
Abstract
Compounds that modulate the heat shock protein (HSP) network have potential in a broad range of research applications and diseases. A yeast-based liquid culture assay that measured time-dependent turbidity enabled the high-throughput screening of different Saccharomyces cerevisae strains to identify HSP modulators with unique molecular mechanisms. A focused set of four strains, with differing sensitivities to Hsp90 inhibitors, was used to screen a compound library of 3680 compounds. Computed turbidity curve functions were used to classify strain responses and sensitivity to chemical effects across the compound library. Filtering based on single-strain selectivity identified nine compounds as potential heat shock modulators, including the known Hsp90 inhibitor macbecin. Haploid yeast deletion strains (360), mined from previous Hsp90 inhibitor yeast screens and heat shock protein interaction data, were screened for differential sensitivities to known N-terminal ATP site-directed Hsp90 inhibitors to reveal functional distinctions. Strains demonstrating differential sensitivity (13) to Hsp90 inhibitors were used to prioritize primary screen hit compounds, with NSC145366 emerging as the lead hit. Our follow-up biochemical and functional studies show that NSC145366 directly interacts and inhibits the C-terminus of Hsp90, validating the platform as a powerful approach for early-stage identification of bioactive modulators of heat shock–dependent pathways.
Keywords
Introduction
Heat shock protein 90 (Hsp90) is a regulatory chaperone protein that modulates the assembly, activation, translocation, and degradation of hundreds of “client” proteins. Many Hsp90 client proteins are involved in common hallmarks of cancer, and Hsp90 is overexpressed or present in differentially active complexes in cancer cells. 1 In addition, Hsp90 and associated stress chaperones have been proposed targets in a broad range of diseases types, including neurodegenerative diseases. 1 These factors have motivated the discovery and development of antagonists for Hsp90 and other HSPs. Heat shock inhibition has added features compared with other molecular pathway targets because of its roles with multiple disease client proteins. However, conformational flexibility, coupled with dependence on protein-protein interaction for function, adds complexity that traditional biomolecular screens cannot easily address. Therefore, a platform that can rapidly identify small molecules that affect heat shock biology by novel mechanisms of action could accelerate future development of pharmacologic modulators.
In the past 15 years, conceptualized understandings of yeast synthetic-genetic and chemogenomic interaction networks have been made possible by the sequencing of the yeast genome and the creation of yeast deletion-mutant libraries. High-throughput genetic-based screens have captured phenotypic data, which in turn provide invaluable information about buffered pathways, genes sensitive to particular perturbations, and target pathways.2,3 Currently, screening in yeast is completed using high-throughput liquid-assay platforms or solid-agar assays. In liquid-assay platforms, semiquantitative phenotyping using molecular barcoding has become a mainstay, because it allows for the analysis of large numbers of strains in parallel under various small-molecule treatments. 4 Target identification relies on drug/target binding and subsequent selective inhibition of diploid strains that are heterozygous for the target. Haploid strains with gene deletions inform on drug/target binding because they may encode essential buffering pathways.
Unlike liquid platforms, solid-agar assays use halo size to derive quantitative information. These assays have the advantage of requiring small volumes of compound, and compound hits can easily be confirmed through visual inspection.5–7 Unpredictable compound diffusion rates and overlapping halos were once considered a limitation of this assay type. However, it has been demonstrated that these effects occur only when a compound is extremely toxic. 8 Halo assays to date have been used to screen only single strains against compound libraries5,7,8; therefore, screening for differential sensitivities via this method remains labor and material intensive.
The initial readouts for the quantitative features of measuring yeast cultures or colonies were based on growth endpoints and were mostly binary.4,8 However, recent efforts have been able to detect effects associated with transitional or subtle phenotypes in high-throughput phenomics approaches, as reviewed by Warringer and Blomberg. 9 We have developed an alternative quantitative approach in liquid growth culture that was focused on examining chemical-genetic interactions.
The goal of this study was to deploy a screening platform, to identify novel chemotypes that modulate Hsp90 biology. Using a pathway to drug approach, 5 a subset of haploid yeast deletion mutants linked to Hsp90 were first identified based on prior protein interaction networks, synthetic lethal relationships, and sensitivity to Hsp90 inhibitors. Poor overlap between results from different screening platforms regarding haploid deletion strain sensitivities to Hsp90 inhibitors motivated an independent evaluation using the phenotypic screen presented herein. A liquid culture–based assay using time-dependent changes in transmittance of settled yeast cell populations was developed to screen candidate yeast strains against known Hsp90 inhibitors geldanamycin (GA) and radicicol (RAD). Sixteen haploid deletion strains defined as Hsp90 antagonist sensitive were validated. These strains were not consistently identified as highly sensitive in previous genome-wide studies.3,10,11 Three of these strains along with wild type (WT) were used to screen a library of 3680 compounds. Curve distance metrics were used to define classes of hit compounds, each demonstrating selective effects toward one haploid deletion strain. The use of a novel secondary screen based on this approach to prioritize compounds and follow-up biochemical characterization of a selected top hit NSC145366 confirmed interaction with Hsp90 by a mechanism distinct from that of GA.
Materials and Methods
Preparing Yeast Strain Stocks
Haploid deletion strains from Open Biosystems (363) previously grown on YPD agar were grown in 500 µL YPD medium contained within four deep-well plates (master plates). Master plates were sealed and agitated at 2000 rpm for 15 s prior to incubation for 3 d with 15 s of shaking at 2000 rpm once daily. Cultures (100 µL) from master plates were pipetted into 96-well plates with 5 µL of DMSO using a Biomek FX workstation and sealed before freezing at −80 °C. For compound library screens, four strains (WT [BY4741], sst2Δ, ydj1Δ, and hsp82Δ) were streaked onto a YPD agar plate and incubated at 30 °C for 2 d. Single colonies were used to inoculate 5 mL of YPD and grown overnight. Aliquots of 200 µL containing 5% DMSO were prepared and frozen at −80 °C.
Compound Preparation
DMSO stocks of GA and RAD were stored at −20 °C and thawed before fresh dilutions of 30 µM and 10 µM GA and RAD were prepared. The assay was performed using minimal proline medium (MPD) containing 0.003% sodium dodecyl sulfate (SDS) and 0.1% proline as the nitrogen source. Previous reports of enhanced yeast-strain sensitivities and permeability to compound treatment used similar conditions. 12 For the compound library screens, the master plates were prepared or received as 10 mM or 1 mM DMSO stocks in 96-well plates. The chemical libraries used were the NCI Set II consisting of ~2400 compounds, representing a diverse set of compound scaffolds from the NCI compound collection, and the Library of Pharmacologically Active Compounds (LOPAC1280 from Sigma-Aldrich, St. Louis, MO). For screening, all compound plates were diluted in MPD medium to 200 µM or 40 µM concentration prior to each experiment.
Yeast Phenotype Plate Screens
For initial screens of the haploid deletion strains with RAD and GA, 5 µL of thawed frozen stock from 96-well plates was used to inoculate a 96-well plate containing 95 µL YPD per well and grown to saturation. Strains were diluted 1/100 in MPD, and 25 µL of diluted yeast was pipetted and mixed into flat 384-well plates with 25 µL diluted compound. Cells were allowed to settle to the bottom of the plate. Plates were incubated at 30 °C, and the optical density was determined every hour in a Tecan GENios plate reader. The initial feasibility screens with 40 strains were performed in a similar manner with RAD (3 µM, 10 µM, and 30 µM), GA (3 µM and 7 µM), and novobiocin (250 µM). Strains were selected based on chaperone function and literature annotations.3,13,14 Concentrations used were based on pilot experiments that demonstrated no effect on WT but at least a 15% decrease in growth rate on deletion strains. Sensitivity scoring was based on the time to reach an OD600 of 0.8 (OD600 T = 0.8), approximately half the absorbance of the saturated culture. Using this method, we determined the relative fitness value for each strain against WT in synthetic medium in the absence of compound, which was used as a normalization factor. The growth rate was determined by adjusting the OD600 T = 0.8 with the fitness value and divided by the measurement for WT at each inhibitor concentration.
For primary screening of the 360 strains, four replicates of 1% DMSO–treated controls were used for each strain/compound treatment and eight replicates in follow-up studies. Screens to confirm growth phenotypes were performed identically using fresh frozen stock with 16 replicates of 1% DMSO–treated controls. The 384-well plates were covered with Greiner Bio-One (Kremsmünster, Austria) transparent tape, incubated at 30 °C, and read every 1 h for 48 to 60 h at 600 nm with a Molecular Devices (Sunnyvale, CA) Spectra Max 384-well plate reader (SoftMaxPro 5.4 software). For chemical library screens, 125 µL of thawed frozen stocks of each strain were used to inoculate 5 mL YPD and grown overnight. Optical densities of cultures were normalized before 1/100 dilution in MPD. Twenty-five microliters of diluted drug followed by 25 µL of diluted yeast were pipetted into 384-well plates. Each strain/compound treatment was prepared in quadruplicate, and every plate had 16 replicates of a 1% DMSO–treated strain. The subsequent steps were the same as above.
Screens for Hit Validation
All follow-up screens to confirm curve phenotypes were performed identically using fresh frozen stocks. Compounds defined as “hits” from the primary screens were rescreened against the four yeast strains, including WT, sst2Δ, ydj1Δ, and hsp82Δ, in addition to the previously identified heat shock inhibitor–sensitive strains. These strains were screened at hit-chemical concentrations of 100 µM and 20 µM using the protocol described above for compound library screens.
Identification of Haploid Deletion Strains Sensitive to Hsp90 Inhibitors
Optical density curves of the settled yeast cultures were normalized using their integrals and the initial optical density. Mean control- and drug-treated curves for each of the strains were computed. The curves were smoothed, and pairwise distances between curves (yeast strains exposed to a treatment compared with the corresponding DMSO curves) were measured using quadratic form distance (QFD), Euclidean distance, KS distance metric, spectral angle distance (cosine distance), and dynamic time warping (DTW) distance. 15 The final assessment of the curve characteristics was performed using DTW and QFD distances. The calculated distances were used to determine the curve-Z′ factor. 16 A more detailed description is available in the supplemental materials.
Data Analysis for Chemical Library Screens
The raw time and optical-density data were normalized using the curve integrals. For the purpose of comparison and quantification, reference readouts/curves were established using WT, sst2Δ, ydj1Δ, and hsp82Δ strains exposed to 1% DMSO. The reference curves for every analyzed strain were compared pairwise to establish a distribution of DTW distances. The distance values at the 95th percentile of the computed pairwise distance distributions were selected as the parameter above which the measured two curves were considered “significantly dissimilar.”
For further analysis, mean control curves were computed for each of the strains using trimmed means of the repeated measurements at all the given time points. For every mean curve, a reference growth–retardation effect was defined as the DTW distance between a mean curve and a curve from wells containing medium only. Using the significance cutoff for DTW distance at the 95th percentile, the fold increase in dissimilarity was calculated for every measured curve/mean-curve pair. The computed parameter was called “response dissimilarity” or v-value. For example, a v-value of 10 means a dissimilarity value 10 times larger than the observed variance within the group of curves. Additional scoring parameters were also computed and summary statistics provided including the sum (SUM index) of all the dissimilarities (for all strains). This parameter was dominated by the greatest dissimilarity value (the strongest response). A high value of the SUM index indicates that at least one of the strains demonstrated a very strong response to the presence of a drug or that a number of strains demonstrated modestly strong responses. The diversity index (DIV), another computed summary statistic, is defined as the maximum difference between responses exhibited by the tested strains. A small DIV indicates that all the strains responded in a similar fashion, whereas a high value shows that some strains responded differently than the others did. The compounds displaying SUM > 100 < 250, DIV > 50, % change < 150, and V > 1 were class I compounds. Class III compounds were defined as those that showed weak or no response in all four strains, that is, having a DIV <40. Artifacts were defined as compounds having a SUM index >400 and a DIV >100.
DARTs Assay Using Whole-Cell Lysate
MDA-MB-468 cells were lysed with lysis buffer (1 mM NaVO3, 50 mM HEPES [pH 7.4], 100 mM NaCl, 0.5% NP40, 1 mM EDTA, 1 mM EGTA, 50 µg/mL RNase, 1% Triton X-100, 1% deoxycholic acid, 1 µg/1 µL leupeptin or Roche protease-inhibitor mixture, and 1x protease mixture) for 15 min at room temperature. After centrifugation, protein concentration of the lysate was measured using a MicroBCA kit. Protein cell lysate (25 µg) was incubated with 500 µM compound, and binding buffer (50 mM Tris-HCl pH 8.0, 50 mM NaCl, 10 mM CaCl2) to 20 µL final volume for 2 h at room temperature and samples were digested with Pronase (Roche, Basel, Switzerland) at varying dilutions for 15 min. The reaction was stopped by adding 5 µL of 5x SDS loading dye and immediately boiling samples at 95 °C for 5 min. Samples were run in gradient SDS polyacrylamide gel electrophoresis (PAGE) gels (4% to 15%) at 150 V for 60 min followed by Western blotting. An equal aliquot of nonproteolyzed sample was run simultaneously on a separate gel to assess β-actin levels as a loading control. Blots were probed with anti-Hsp90 antibody (ADI-SPA-831; Enzo Life Sciences, Farmingdale, NY). The blots were stripped and reprobed with anti-β-actin antibody (JLA20, DSHB, University of Iowa) to demonstrate that β-actin was proteolyzed equally in the presence or absence of compound. The same anti-β-actin antibody was used to probe β-actin levels in the loading control gel.
DARTs Assay Using Human Purified Hsp90β
Recombinant human Hsp90β (200 ng; SPR-102C, StressMarq Biosciences Inc., Victoria, BC, Canada) was incubated with 200 µM compound and binding buffer (50 mM Tris-HCl pH 7.5, 200 mM NaCl, 5% glycerol, 0.1% TritonX-100) to 20 µL final volume for 2 h at room temperature. After compound treatment, samples were digested with Pronase (Roche) at varying concentrations for 10 min at room temperature. The reaction was stopped by adding 5 µL of 5x SDS loading dye and boiling samples at 95 °C for 5 min. Samples were run on 8% SDS-PAGE followed by Western blotting.
Competitive Displacement of FITC-GA by Hsp90 Inhibitors
Displacement studies were performed with recombinant Hsp90β (SPR-102C, StressMarq) and the Hsp90 inhibitors geldanamycin and AUY922 in an established fluorescence polarization assay. 17 Reaction mix was created containing 60 nM Hsp90β, 5 nM FITC-GA (Enzo Life Sciences), and fluorescence polarization (FP) assay buffer (20 mM HEPES pH 7.3, 50 mM KCl, 0.01% NP-40), aliquoted into a 96-well plate and preincubated for 3 h at room temperature. Compounds were serial diluted in FP assay buffer and added to the reaction plate. DMSO concentration was normalized to 2% (v/v) in all reactions. Twenty-five microliters of reaction mixtures was transferred to shallow 384-well, black microplates (ProxiPlate-384 F plus, Perkin-Elmer, Waltham, MA) and incubated for 16 h. Endpoint FP as mP values were recorded using Synergy 4 (BioTek, Winooski, VT). The measured mP values were plotted against competitor concentration.
Hsp90 Chaperone Assay
Chaperone function was measured using an alcohol dehydrogenase (ADH) aggregation assay adapted from previous methods. 18 Forty microliters of reaction mixtures was prepared containing 6.2 µM equine ADH (Sigma-Aldrich) in the presence and absence of 500 nM GST-Hsp90α C-terminal domain (amino acids 626-732; Addgene 22483) and compound. Aggregation was induced at 55 °C and measured using absorbance at 360 nm every minute using an Epoch 2 (BioTek) for 60 min. Experiments were performed three times, and mean values are displayed in the plots.
Results
Liquid-Culture Growth Assay
The purpose of the study was to define approaches for discovery of chemotypes that modulate Hsp90-dependent protein interaction networks. Haploid yeast deletion strains with sensitivity to established Hsp90 inhibitors were identified to screen for additional novel chemotypes. Conceptually similar approaches using yeast screens have been pursued for heat shock protein–related gene networks, providing a global picture of the Hsp90 chemical, genetic, and protein interaction networks.3,10,11,13 However, sparse convergence in these four major studies motivated us to search for a reliable set of strains for chemical library screening ( Suppl. Fig. S1 ). The use of different chemical classes of known Hsp90 inhibitors was expected to enable identification of diverse strain sets that increase the probability of uncovering unique mechanisms of antagonism. The known inhibitors used were GA and RAD, compounds that bind in the same N-terminal ATP site, and novobiocin, a less potent inhibitor that binds to the C-terminal domain.
Conventional shaken cultures and their associated growth curves are useful and have been successfully employed in chemical and phenomic screens. Our approach allowed yeast cells to settle into the small area of a 384-microtiter well, which allowed a highly reproducible change in light transmittance to be observed. Such an approach is similar to a colony growth on an agar plate, which can be highly informative of additional characteristics related to cell number but will also depend on cell size, shape, density, and cell-cell interactions, which can change with genotype of the strain. This observation formulated the basis for an assay, which could be translated to a high-throughput format for single strain–single compound assays. During the preparation of this article, a recent effort demonstrated the utility of agar colony phenomics but also noted substantial differences with previous liquid culturing methods. 19
The feasibility of the screen format was first tested by surveying 40 haploid strains with evidence of association with yeast heat shock response. The assay was performed in a synthetic MPD medium to enhance yeast-strain sensitivities and permeability to compound treatment. 12 The selection of initial strains reflected a cross-section of functions based on gene ontology, documented chemical sensitivity to Hsp90 inhibitors, and protein-folding annotations.3,13 Strains with reported gene-gene interactions associated with Hsp90 were included in this set based on the rationale that a chemically-induced knockout of a cellular pathway can simulate a genetic defect. The initial Hsp90-linked, 40-strain screen used a conventional time to reach conventional optical density of 0.8 at 600 nm as a scoring metric to assess the feasibility of the approach. Each haploid strain was evaluated in the presence of inhibitor (GA, RAD, and novobiocin) and scored relative to an isogenic WT strain in the presence and absence of inhibitor. The ratio values for drug-treated and control wells were treated as initial phenotypes and visualized in a heat map ( Suppl. Fig. S2) . Clustering using centroid linkage of the growth ratio phenotypes demonstrated three major chemotype signatures. These features guided the initial selection of ydj1Δ, hsp82Δ, and sst2Δ as representative strains to use for high-throughput screening.
Haploid deletion strain ydj1Δ, a member of the Hsp40 chaperone family, showed the highest degree of sensitivity to both GA and RAD but exhibited no sensitivity to novobiocin. Previous reports indicate that the co-chaperone protein Ydj1 plays a variety of roles in cellular control mechanisms, including kinase signaling networks, and is thought to have a generalist role in Hsp70-dependent complexes. 20 In addition, ydj1Δ has been shown to have a defect in Hsp90 activation, and hence there is a possibility of discovering agonists of Hsp90 by identifying an increase in growth rate for this strain. 21 The strain ydj1Δ has a broad spectrum of sensitivities and is particularly sensitive to GA analogues and related N-terminal inhibitors.
The yeast Hsp90 deletion strain hsp82Δ is sensitive to RAD and GA, although to a lesser degree than ydj1Δ. Deletion of the Hsp90 paralog, HSC82, does not result in sensitivity to these drugs. HSC82 encodes a nearly identical amino acid sequence but is constitutively expressed with only twofold induction of expression by heat shock or stress, in contrast to HSP82. 22 A differential result based on an Hsp90 isoform is not unique to our medium conditions because genome-wide profiling experiments in richer media indicate a similar difference, and humanized yeast studies demonstrate enhanced sensitivity to radicicol for Hsp90β compared with Hsp90α.3,23
Finally, the sst2Δ strain was the most sensitive to novobiocin and partially sensitive to RAD. The action of novobiocin on the sst2∆ strain is thought to occur by activation of the mating pathway leading to cell-cycle arrest. 14 SST2 encodes a GTPase that regulates mating pheromone signaling, and HSP82 mutants have been implicated in defective pheromone signaling pathways. 24 The sst2Δ strain has not been detected in genome-wide screens with Hsp90 inhibitors, even though novobiocin was used, possibly because of different experimental conditions including the use of a lower compound concentration and rich media. 10 These results provided logic for using these strains as positive controls in screens for additional haploid deletion strains that functionally affect the heat shock protein interaction network. In addition, these strains were considered sufficient as signature strains for identifying additional chemotypes that functionally modulate the Hsp90-dependent protein interaction network.
Quantitative Phenotype Assays
The initial results with established Hsp90 inhibitors GA, RAD, and novobiocin demonstrated differential effects on the time-dependent changes in cultures of haploid deletion strains. Most striking were the distinctions in shapes of the drug-treated versus control curves and variations in minimum and maximal values similar to agar turbidity measurements. 19 These results motivated us to capture the features of the time-dependent curves as a phenotype. First, time-dependent changes in microplate well turbidity produced raw data curves that were normalized by their integrals and their first transmittance measurement ( Fig. 1A ). Using GA and RAD as drug treatments, testing screens of haploid strains were implemented using a minimum of 16 replicates of DMSO controls per strain and four to eight replicates of drug/strain pairs in 384-well plates. Second, a standardized method for phenotype characterization and comparison was developed using curve distance functions to quantify each strain’s phenotypic distance from controls. Different distance measurements were tested, and QFD and DTW were selected for use in the final screen based on excellent match with perceptual curve comparisons. 25 The overall process for computing the differences in time-dependent turbidity curves measured by transmittance is provided in schematic form in Figure 1B–E .
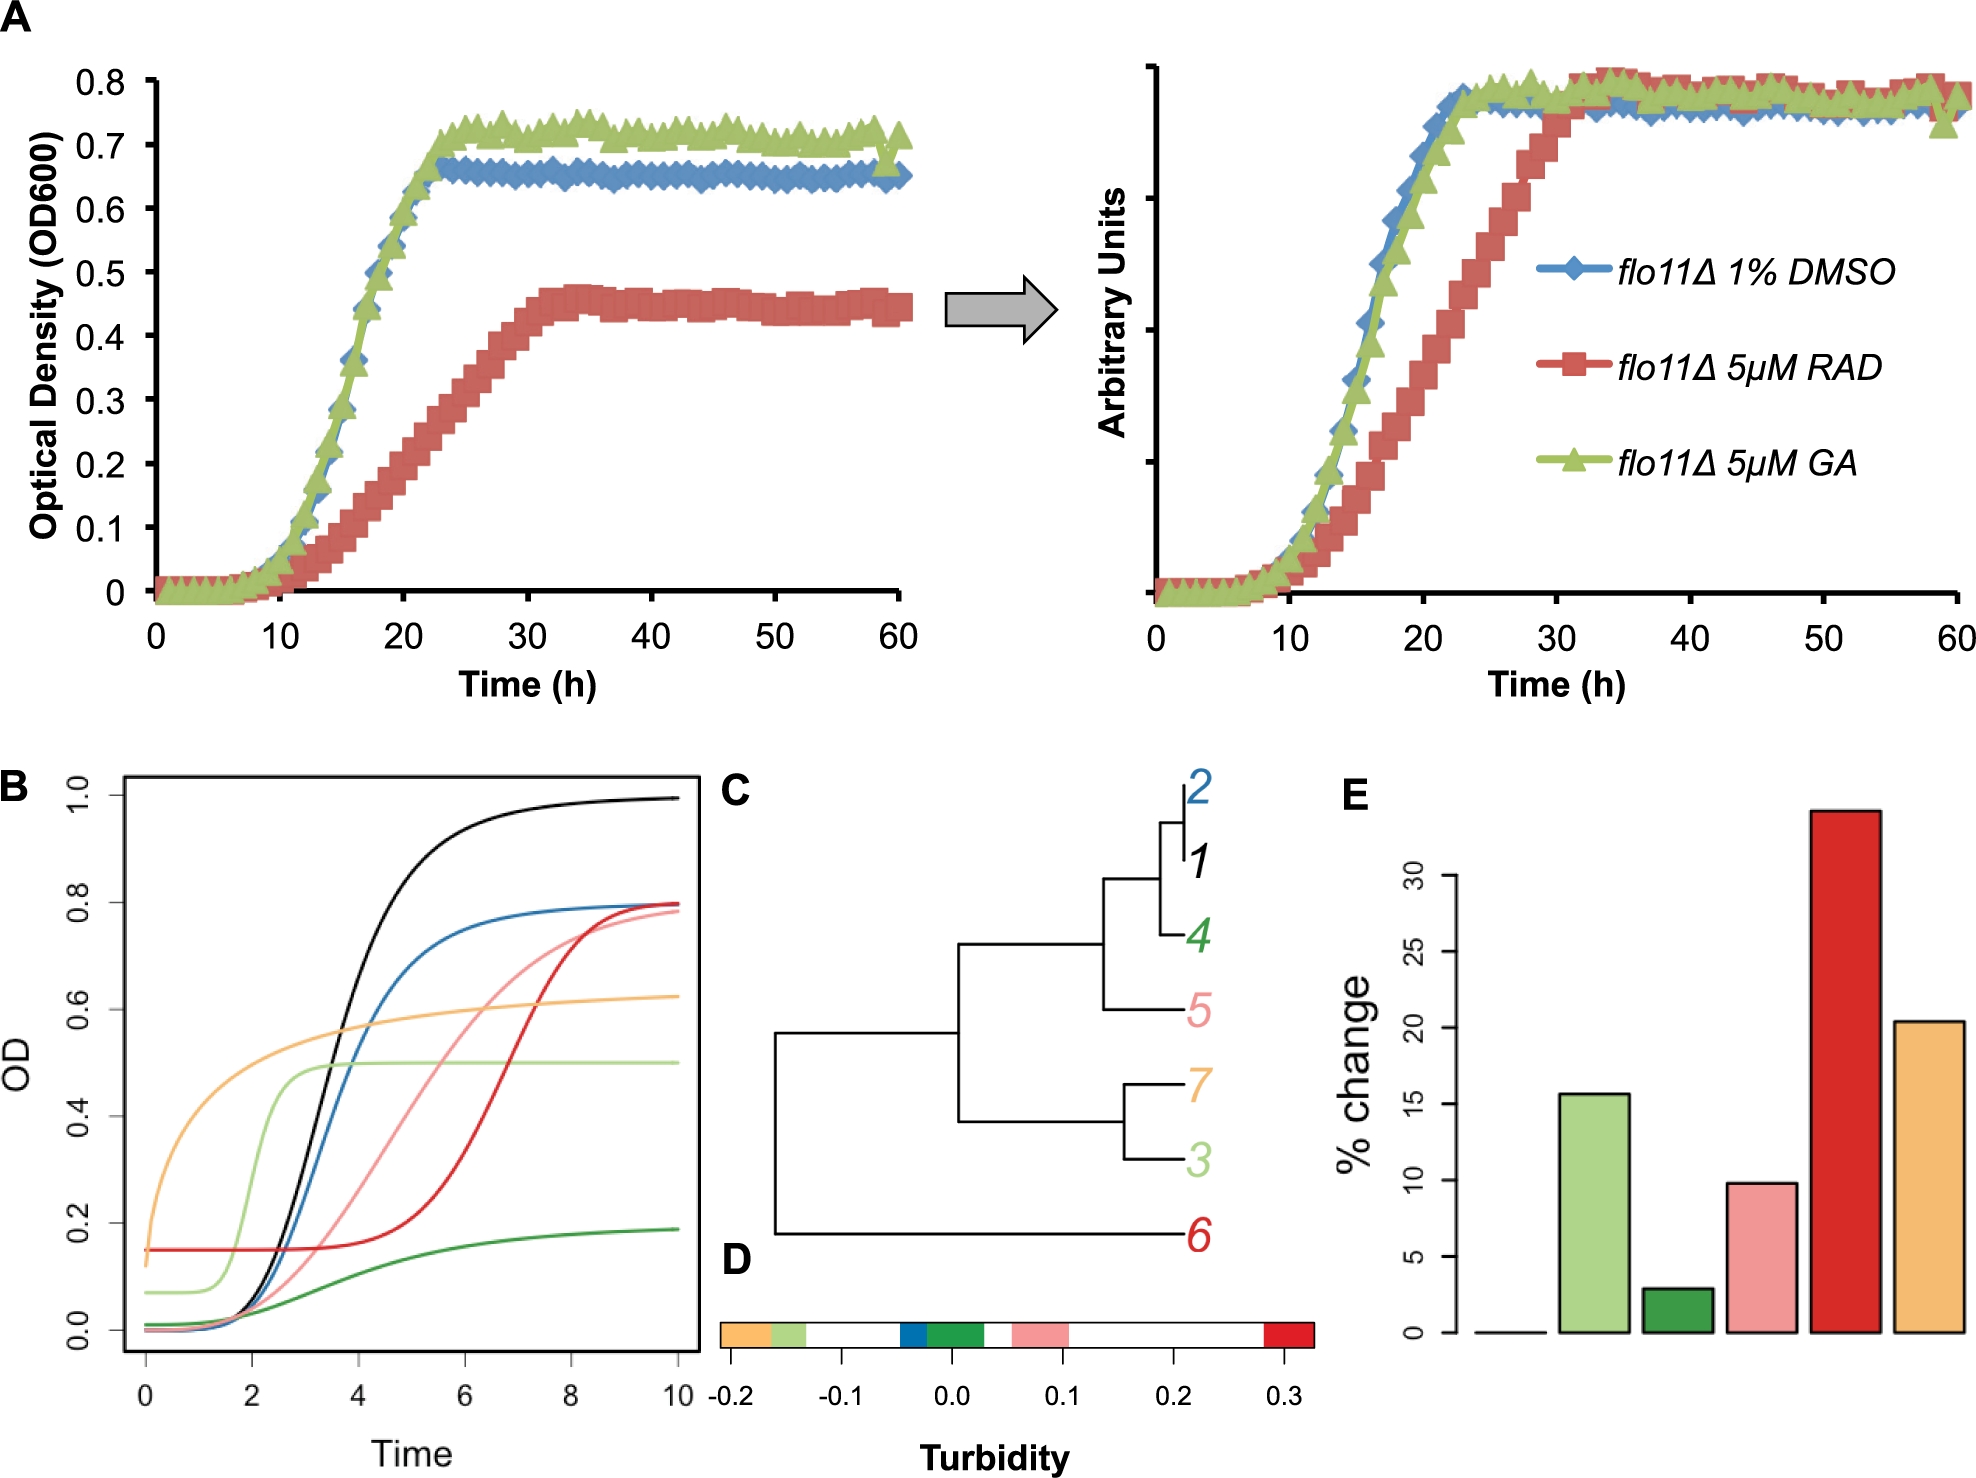
Process of computing differences in time-dependent turbidity curves measured by transmittance. (
Compound Library Screen
The NCI Diversity Set II (~2400 compounds) was screened against the WT and three haploid deletion strains that previously showed sensitivity against GA, RAD, and novobiocin: ydj1Δ (Hsp40), hsp82Δ (Hsp90), and sst2Δ. These strains were employed with the rationale that compounds inducing sensitivity are potential modulators of the Hsp90-related interaction network. The hit compounds were identified and classified by a scoring process based on the selectivity of the compound’s effect on the different strains ( Fig. 2A ; Suppl. Fig. S3 ). A four-tier classification system was used based on the quantitative scoring metrics: those altering curve phenotype in a single strain but not the WT (I), altering curve phenotypes in more than one strain but not the WT (II), showing weak or no effect in all four strains (III), and agents causing artifacts (IV). Reference curves of 1% DMSO–treated controls for each strain (16 wells on each plate) were compared pairwise to establish a distribution of DTW intergroup distances. The average distances between curves from compound-treated wells and reference wells were also computed. A parameter called the response dissimilarity (v-value) was derived using the computed distance values at the 95th percentile for the respective control distributions for each strain ( Suppl. Fig. S3 ). Therefore, in the defined context, a response dissimilarity >1 suggests a biological response bigger than intrinsic variability within the set of controls. The computed percentage change values for compound-treated wells were scaled using the distances between the mean control curve (1% DMSO) and a vector of zeroes.
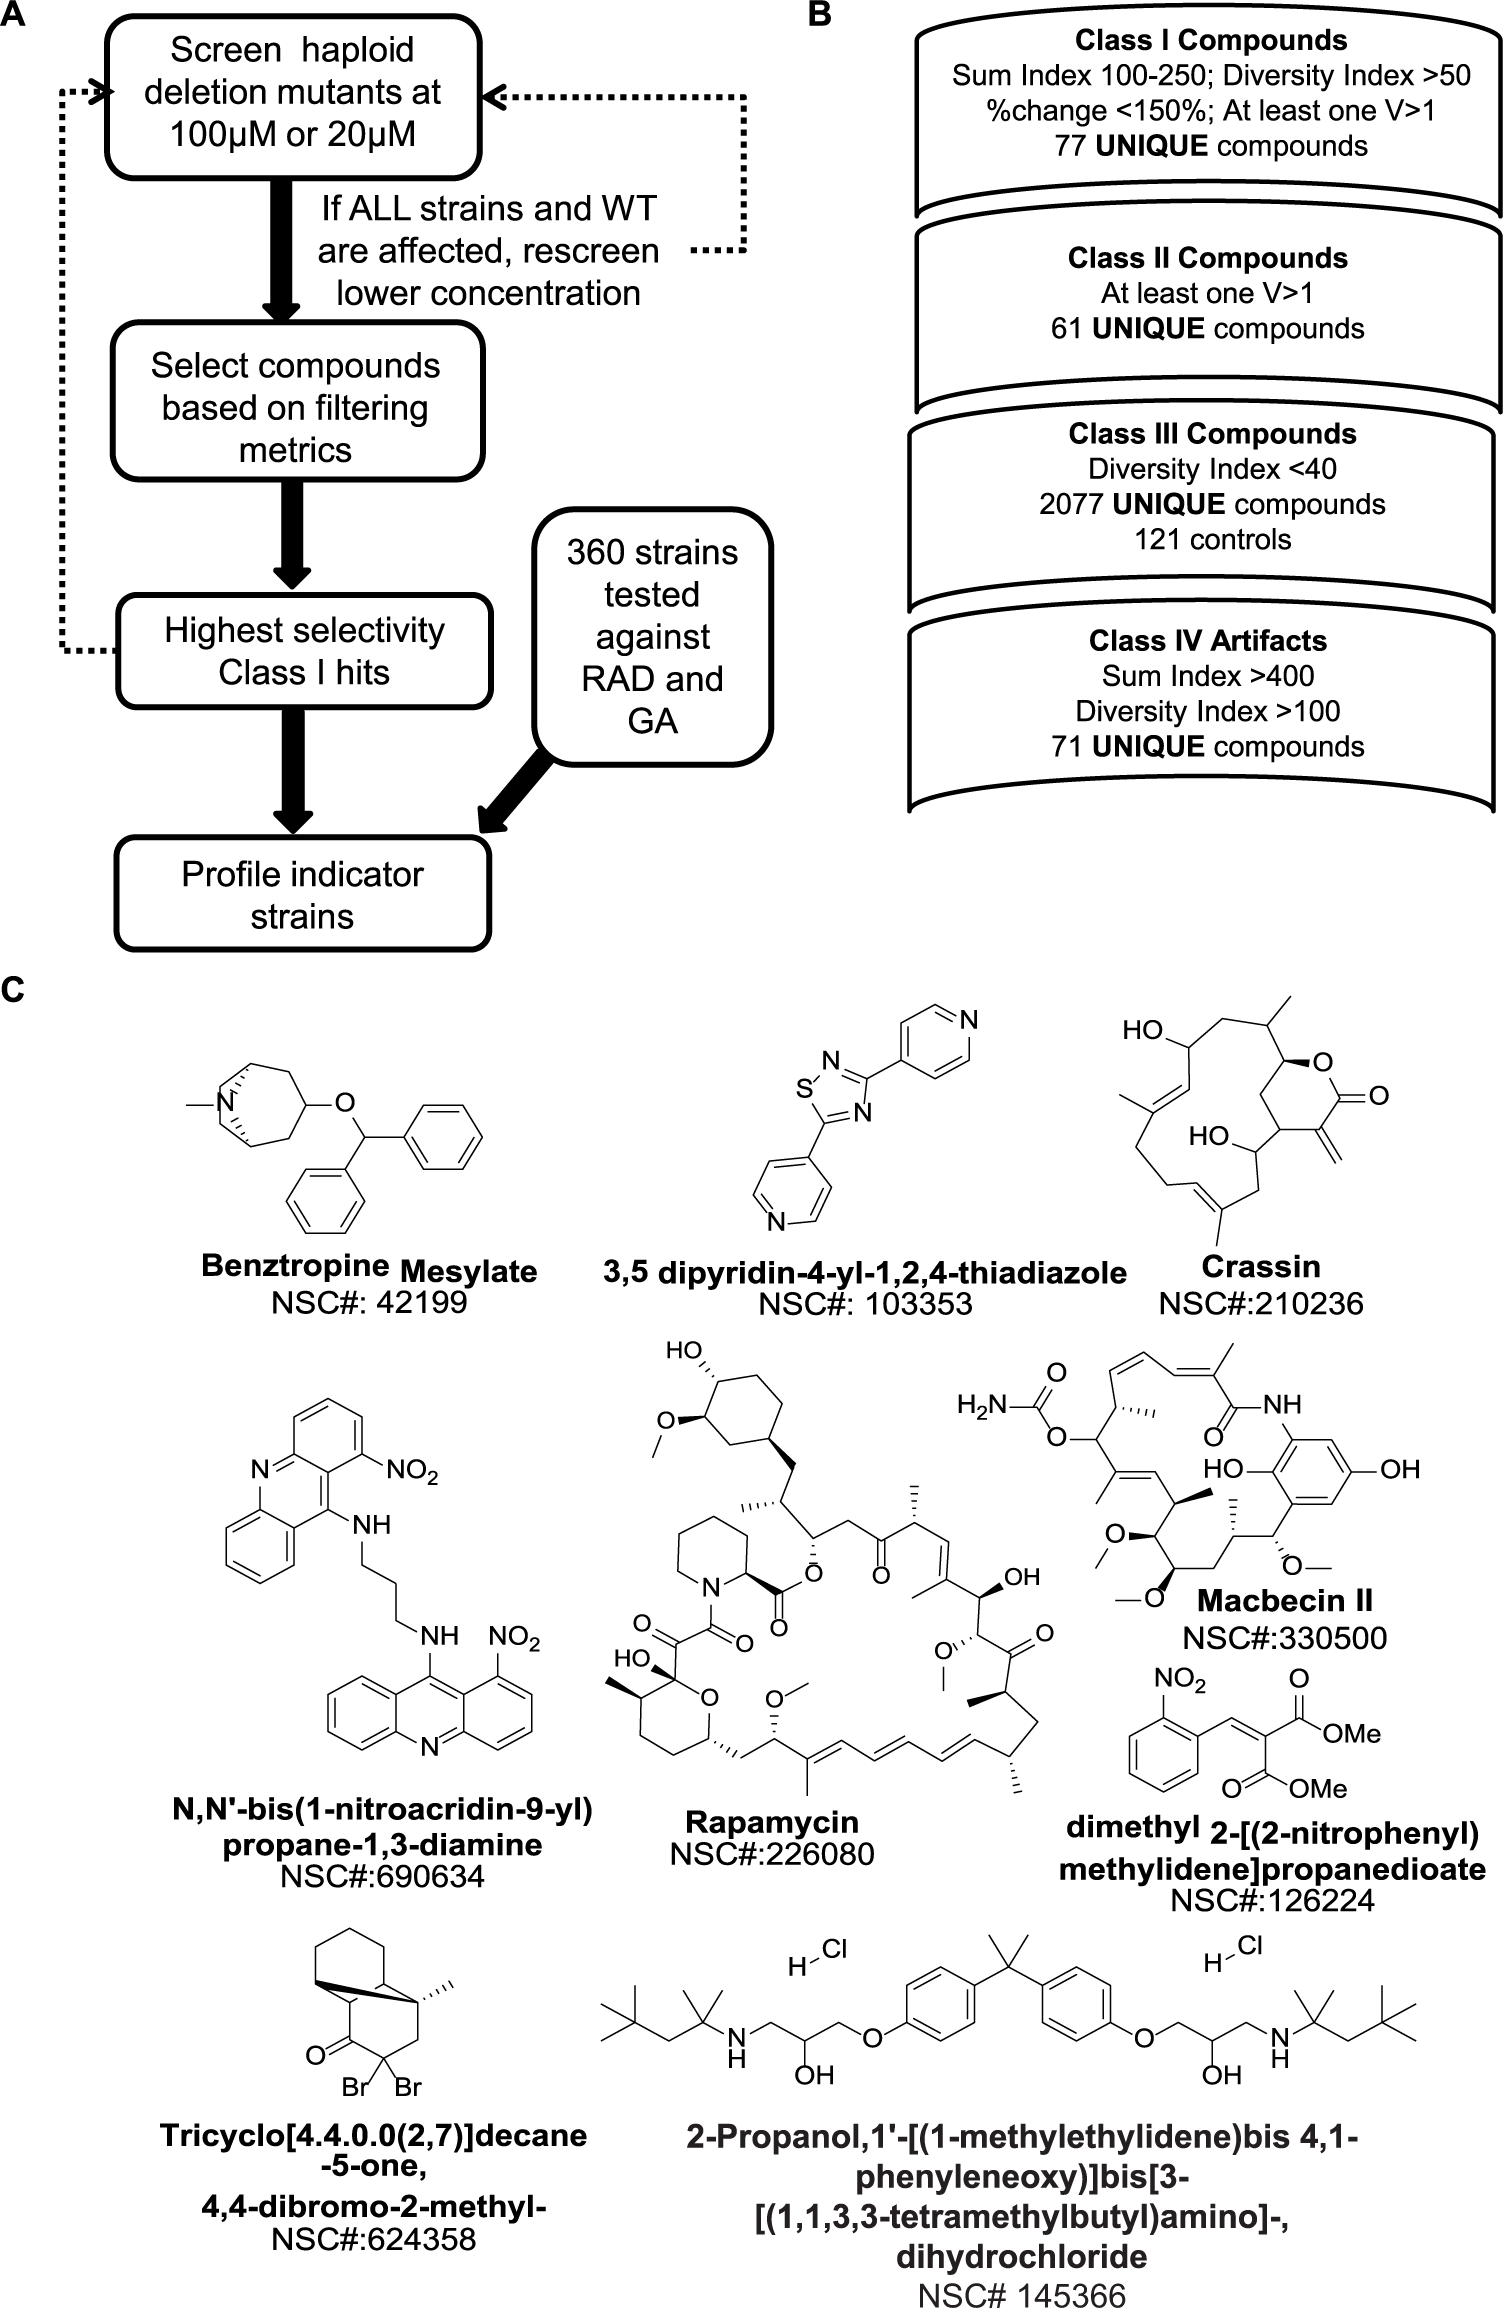
Chemical library screen protocol and process of filtering. (
Strain selectivity of a compound effect was evaluated based on two summary statistics. The “sum index” (SUM) is the numeric sum of percentage changes of compound effects for all four strains. A “diversity index” (DIV) represents the maximum pairwise difference between the compound effects (expressed as DTW or QFD distances) for each strain. A large value for the DIV indicates that a strain showed particular sensitivity to a compound treatment (see supplementary material for definitions of scoring metrics). By setting the range on values, including the SUM and DIV, candidate compounds for each of the four classifications could be identified.
From the NCI Diversity Set II, 77 unique compounds (3.2%) were identified in class I. Follow-up screens of the four yeast strains using the LOPAC identified another 23 compounds (1.7%) that were scored as class I hits. The class II hit compounds defined from the NCI Diversity Set II were a subset of 101 compounds (4%). The majority of the compounds in the library (89%) were in class III. The class IV artifacts (71 compounds or 2.9%) included compounds exhibiting high potency, and the available compounds (51) were rescreened at lower concentration to reveal an additional eight class I compounds ( Fig. 2B ). These hit rates are consistent with the potential scalability of the screen if paired with a secondary screen strategy for compound or pathway prioritization.
Selection of Class I Hit Compounds
All 79 compounds from NCI Set II and four compounds from LOPAC (83 total) were rescreened against all four strains at 100 µM and 20 µM to assess the robustness of the effects. Follow-up studies involving independent screens of the hits were conducted two additional times to select those compounds with the most robust responses. The nine top compounds in class I were identified as possible heat shock modulators for further evaluation ( Fig. 2C ; Suppl. Fig. S4 ). NSC330500 (macbecin II) is a known Hsp90 inhibitor that belongs to the ansamycin class like GA 26 and serves to validate the overall screen, as evidenced by the considerable hypersensitivity of the ydj1Δ strain at 20 µM ( Suppl. Fig. S4B ). NSC226080 (rapamycin) is a well-established immunosuppressant and chemotherapeutic agent that targets the mammalian target of the rapamycin (mTOR) pathway. It is known to exhibit significant potency in yeast; at the doses used in the primary screen, the phenotype is likely dominated by target effects other than heat shock.
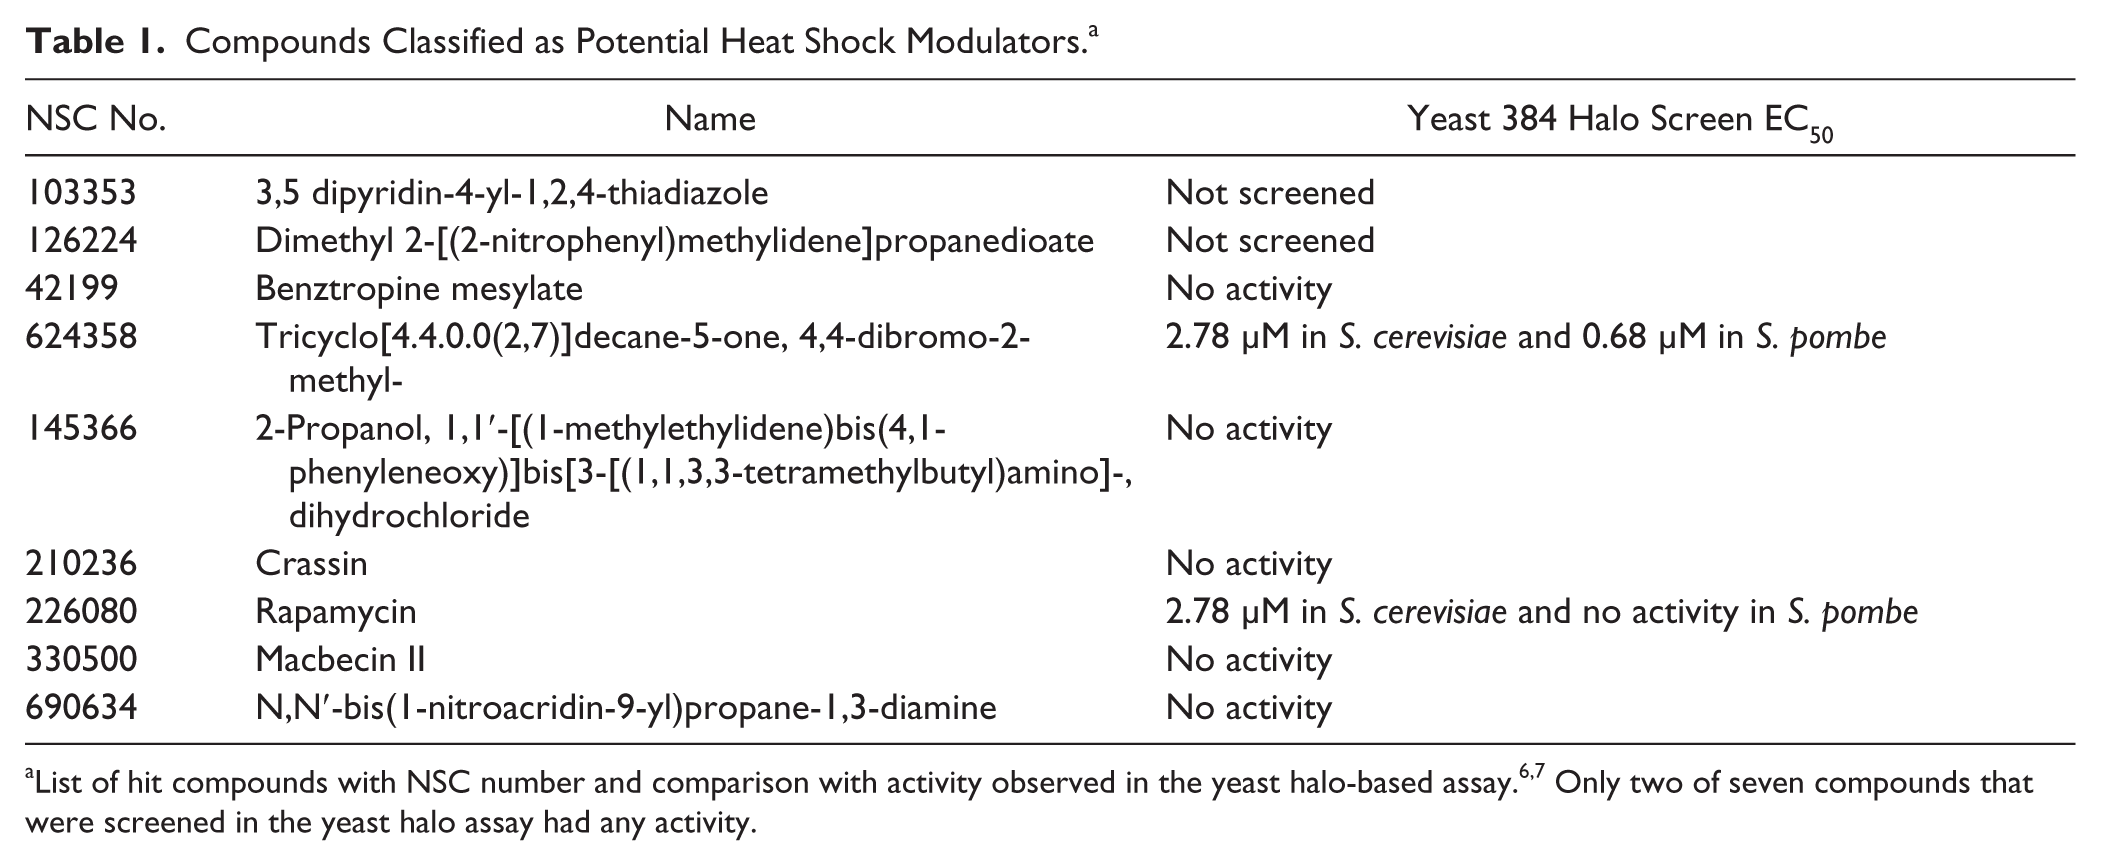
The additional seven compounds have been screened in various contexts but never associated with heat shock modulators. It is worth noting that the NCI Diversity Set II library has been extensively used as part of the National Institutes of Health Molecular Libraries Screening Centers Network efforts as well as in high-throughput halo-based screens of Saccharomyces cerevisiae and Schizosaccharomyces pombe.6,7 Most noteworthy is that the alternative conditions and format of our screen were able to detect activities for compounds that were classified as inactive in the halo-based yeast assay 6 ( Table 1 ).
Compounds Classified as Potential Heat Shock Modulators. a
Identification of Hsp90 Network Haploid Deletion Strains for Secondary Screen
Although using just three strains relative to WT is sufficient to classify the primary screening libraries, there is no expectation that they capture the complete set of mechanisms for modulating the heat shock network. Although prior yeast-screening efforts have defined Hsp90 chemical and genetic interactions,3,11,13,27 the poor consensus among the top 20 most sensitive strains in various studies compelled a process for defining suitable indicator strains for follow-up compound profiling screen and hit prioritizations ( Fig. 2A ). Strains were selected from previous genome-wide studies using Hsp90 inhibitors,3,13 genetic interaction data for hsp82Δ, 11 genetic or protein interactions documented in the literature, and 63 heat shock proteins defined in Gong et al. 27 The resulting list of 360 strains and the inclusion criteria details are provided in the supporting information ( Suppl. Fig. S5 ). The previously identified strains hsp82Δ, ydj1Δ, and sst2Δ were included as positive controls, and strains that did not exhibit sensitivity in previous screens were also included.
The more robust curve phenotype approach with improved quantitation was also employed for compound profiling. By repeating rounds of screening, 13 additional haploid deletion strains that reproducibly demonstrated sensitivity toward GA and RAD were identified ( Table 2 ). The haploid deletion strains were defined as strains for which drug-treated growth curves differ from no drug controls by our dissimilarity permutation test with p < 0.01 and curve-Z′ factors greater than zero (see the Materials and Methods section for definition). These constraints on dissimilarity between curves made it unlikely that phenotypes differed because of biological replicate noise. This assumption was corroborated because the 12 insensitive control strains did not have differential sensitivity in repeated screens. Comparison of the 13 GA- and RAD-sensitive strains with previous data sets indicated that the macbecin sensitivity genome-wide data set had the most overlap ( Suppl. Fig. S6 ). 13
Haploid Strains Sensitive to Radicicol and Geldanamycin with Associated Function and Human Homologs.
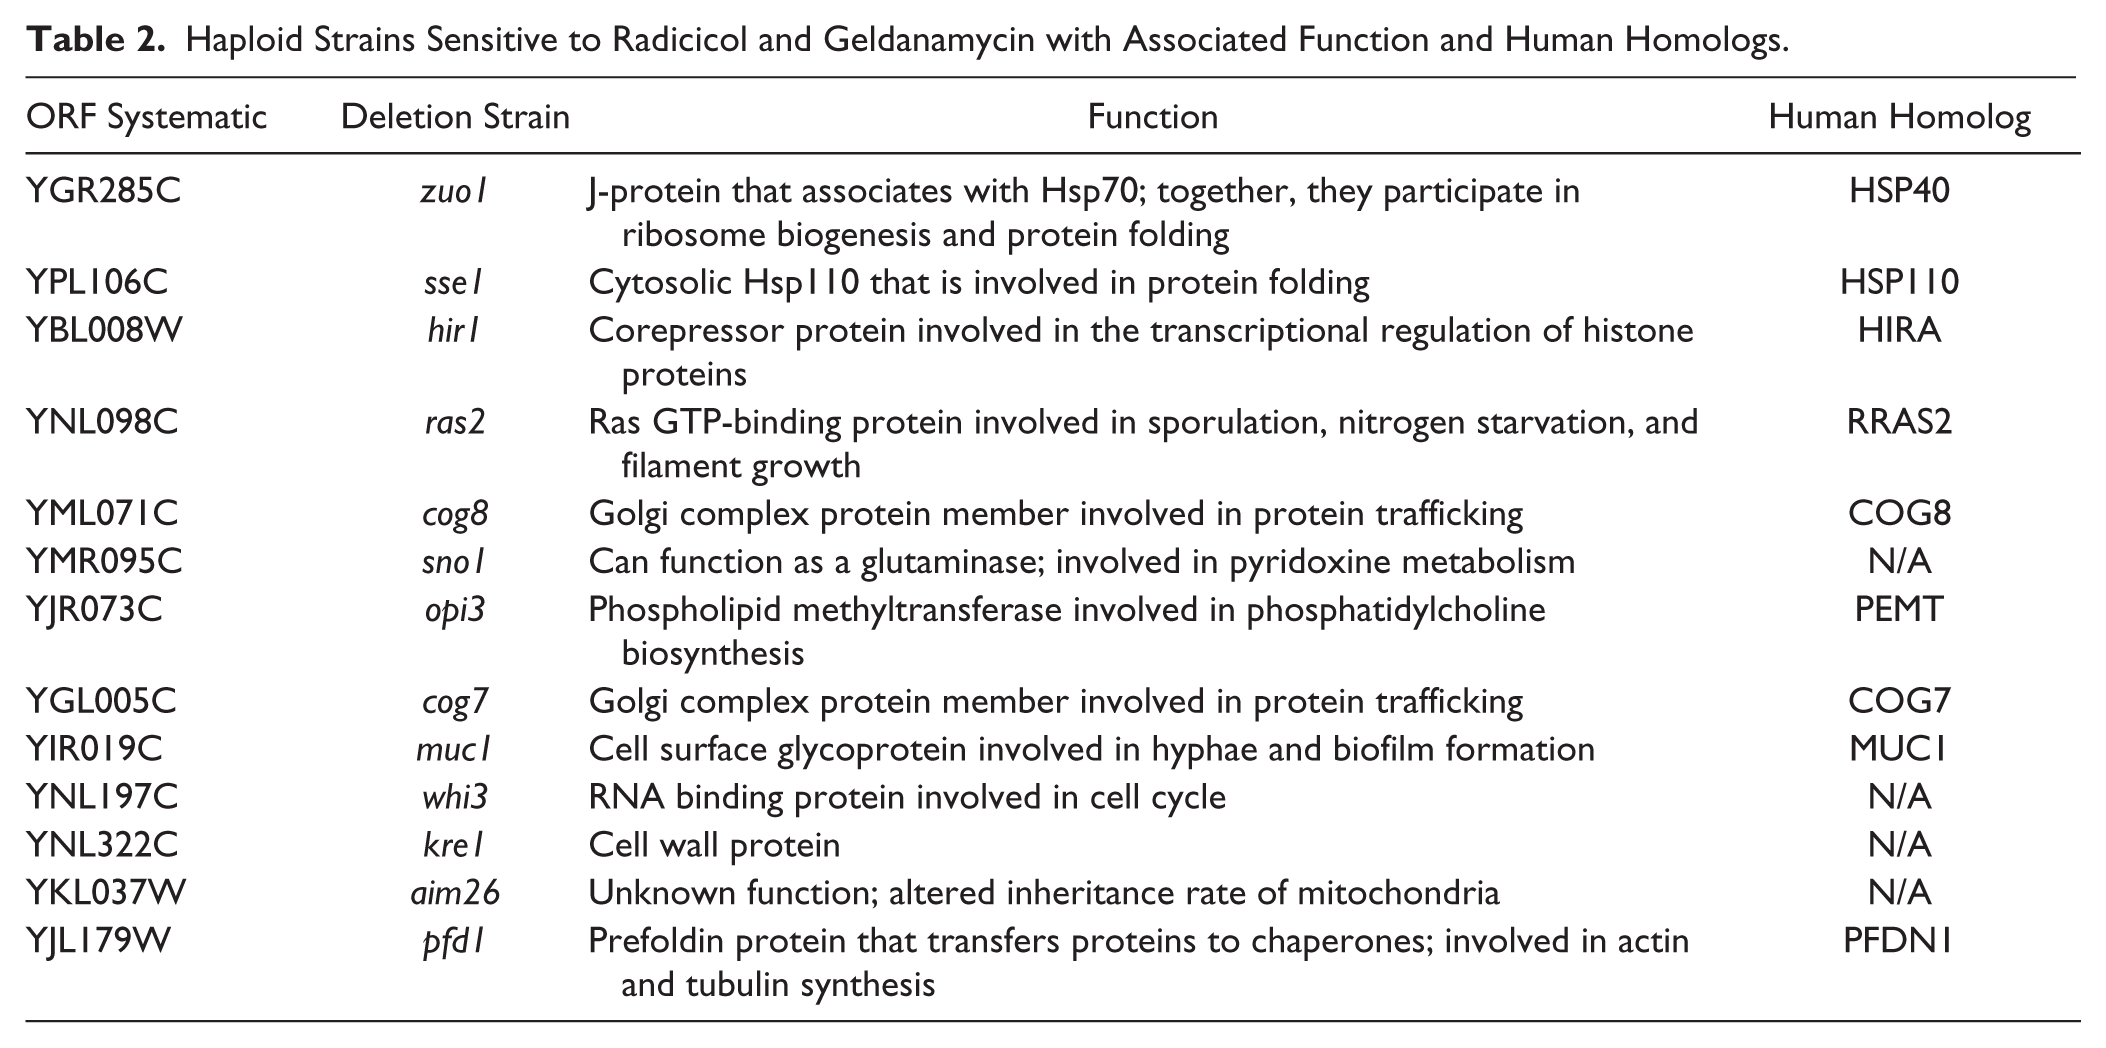
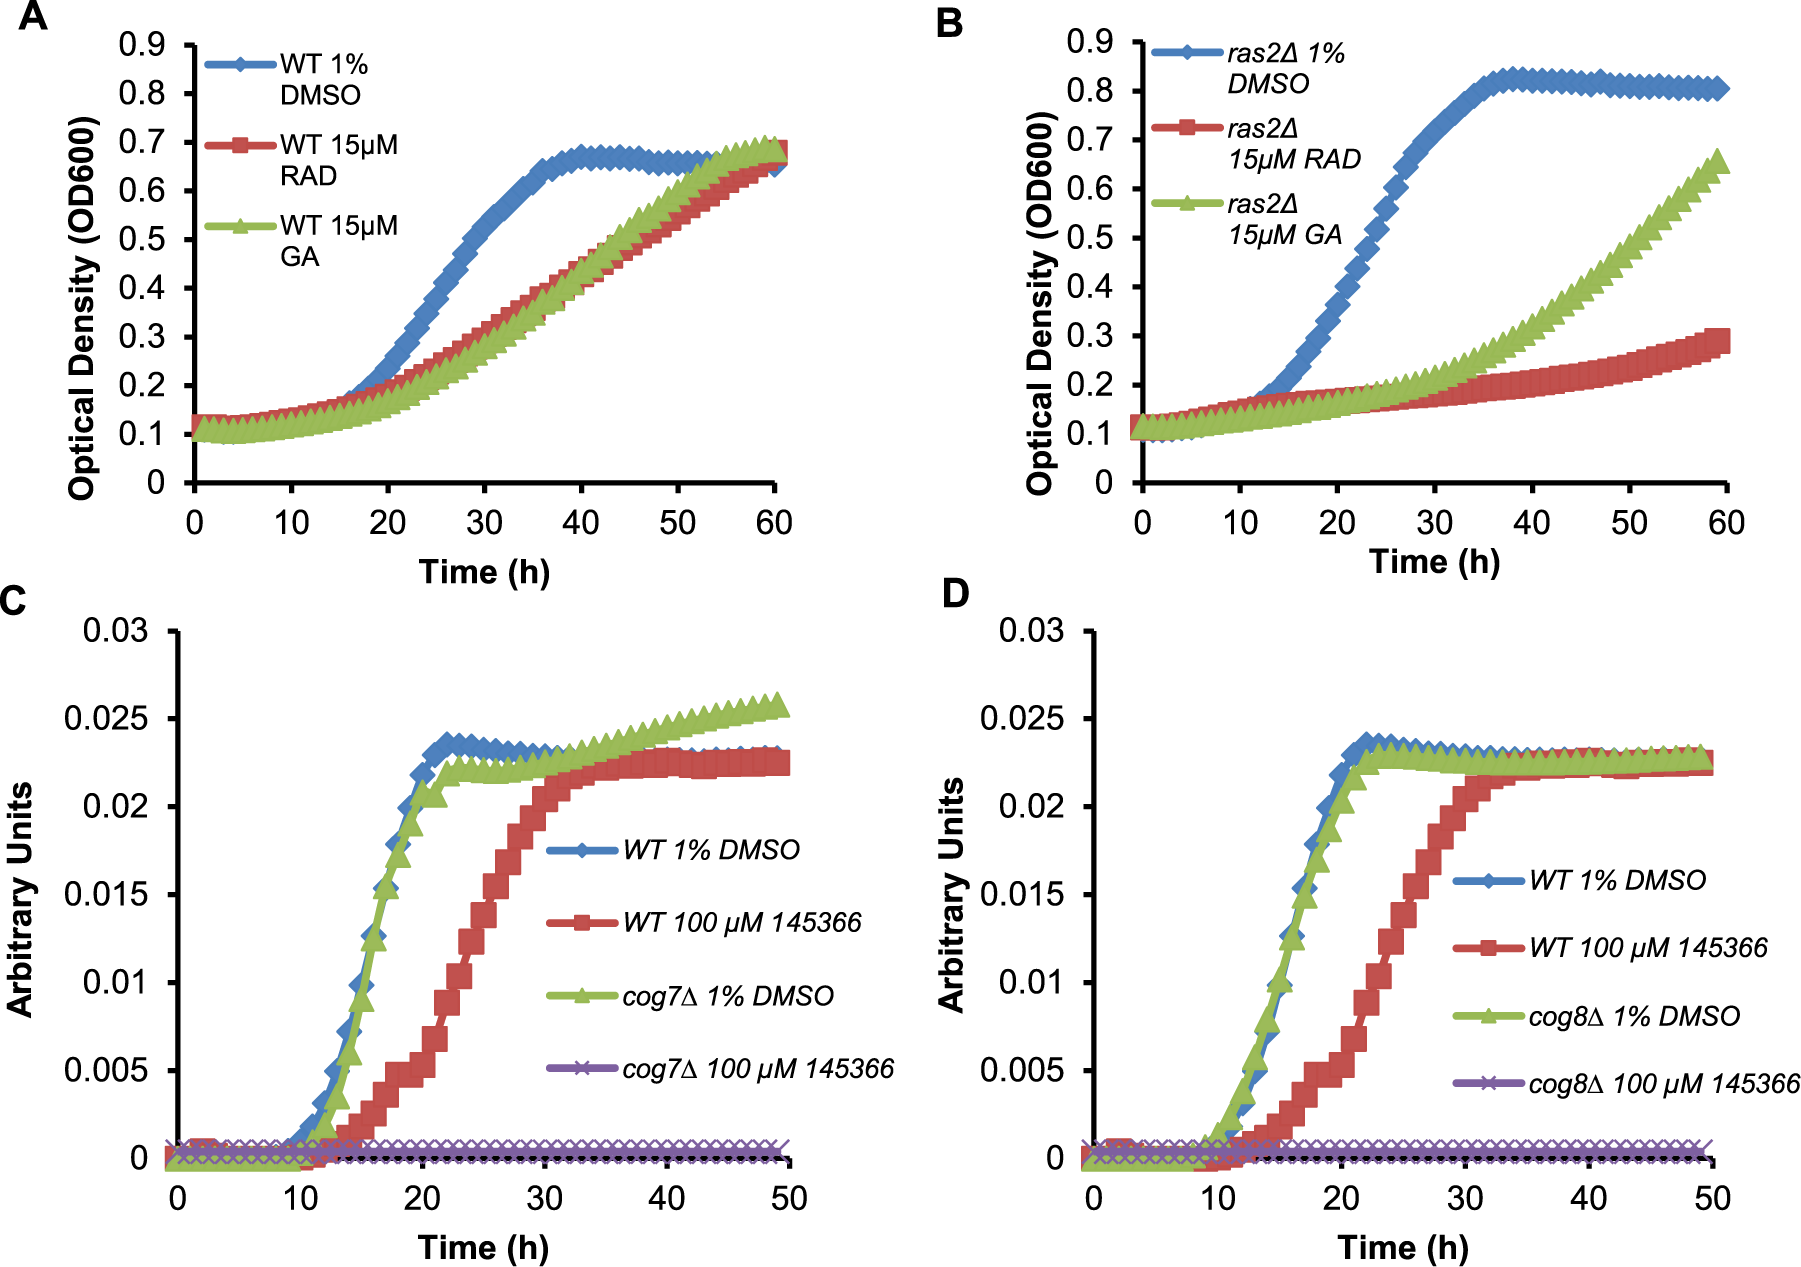
Among the deletion strains in Table 2 are cog7Δ, cog8Δ, and ras2Δ; they are all genes that participate in secretory pathway transport. Cog7 and Cog8 proteins are part of a COG tethering complex that is responsible for the fusion of transport vesicles to the Golgi, whereas Ras2 is a small GTP-binding protein that stimulates the production of cAMP. 28 An invertase secretion assay, as well as genetic network analysis, has previously identified Hsp90 involvement in vesicle trafficking, and mutations in Hsp90 were shown to result in vacuolar sorting defects. 13 Yeast lacking RAS2 demonstrate sensitivity to geldanamycin 11 and macbecin II 1 , and also exhibit synthetic lethal effects with yeast containing a mutant allele of Hsp90. 11 The ras2Δ strain, using eight replicates in our screen, was differentially sensitive to treatment with Rad and GA ( Fig. 3B ). In addition to the secretory pathway, we also observed a more direct connection to Hsp90 in Sse1, a member of the Hsp110 chaperone subclass that can form a high-affinity complex with Hsp70. 29 The emergence of hits that represent distant nodes in the heat shock signaling path space indicate that previously unknown synthetic genetic relationships may be detected using these sensitive assay and analysis conditions.
Examples of turbidity curves and normalized data for defining phenotypes. (
The strains identified in Table 2 were used to profile the top nine class I compounds that emerged from the chemical library screens. Differential chemical sensitivities for these strains were observed among the nine hit compounds described above using similar score methods defined for the library screens. Distinctive variations in the sensitive strain profiles provided a basis for prioritization of hit follow-up studies.
NSC145366
The first step involved the use of the additional haploid deletion strains identified above to assess whether the sensitivity patterns were consistent. NSC145366 induced the strongest effects in the cog7Δ, cog8Δ, and ras2Δ strains and was selected for follow-up evaluation. Neither cog mutant grows in the presence of 100 µM compound ( Fig. 3C , D ). The COG proteins have been implicated in physical interaction with Hsp90, and COG-deletion strains were previously demonstrated to be sensitive to Hsp90 inhibition.11,13 Using the platform described above, the cog deletion mutants showed selective sensitivity to RAD, GA, and NSC145366 (sensitivity profile confirmed in Fig. 3C , D ), all consistent with a role for Hsp90 in the regulation of vesicle to Golgi transport. The sensitivity of the ras2Δ haploid strain to NSC145366 ( Suppl. Fig. S7 ) further supports an inhibitory role in Hsp90 pathways because there is ample evidence indicating a dependence on Hsp90 in a KRAS mutated tumor context. 30 Compounds were evaluated in the PubChem database, and NSC145366 demonstrated cellular mechanism activities similar to other Hsp90 inhibitors based on screening of the NCI-60 tumor cell panel. Using a COMPARE analysis 31 of the publically available data for NSC145366, the GI50 pattern indicates significant correlations with known Hsp90 inhibitors for several GA derivatives (NSC330512, NSC320877, and NSC255104 had r = 0.63, 0.54, and 0.50) and macbecins (NSC330499 and NSC330500 had r = 0.57 and 0.52). Although these are correlative effects, they support our studies indicating that NSC145366 targets Hsp90. The combined observations warranted selection of NSC145366 for further biochemical evaluation.
Physical Interaction of NSC145366 with Human Hsp90
The observations associated with the phenotypic responses of both yeast mutants and human-tumor cell lines provided a basis for associating NSC145366 as a modulator of the heat shock protein network. However, these phenotypic responses do not establish a direct interaction with a protein target. Furthermore, the chemical structure of NSC145366 does not reveal any similarity to known inhibitors. For these reasons, a relatively unbiased assay that can test for direct interactions of this compound with Hsp90 was pursued and modeled after earlier studies with known antagonists. Drug-affinity responsive target stability (DARTs) assays were conducted using MDA-MB-468 cell lysate and human recombinant Hsp90β to assess the NSC145366 binding to Hsp90. Yeast Hsp90 and human Hsp90α are 60% identical, and the structures of the C-terminal domain of yeast and human Hsp90 have been solved and have similar folds. Following room-temperature incubation and proteolysis, selective protection of Hsp90 in the presence of compounds was assessed as previously described. 32 Marked protection was observed when both cell lysate and recombinant Hsp90 were preincubated with NSC145366, comparable to identical concentrations of the known Hsp90 inhibitors AUY922 and GA ( Fig. 4A–D ). Note that DARTs assays typically require high concentrations of compound to observe protection even if the compound has a high affinity for the target such as AUY922 (IC50 = 21 nM). 33 Protection is specific to Hsp90, as demonstrated by the equal proteolysis of β-actin in the presence or absence of the compound ( Fig. 4A , B ) and because a negative control compound (metoprolol) did not protect Hsp90 ( Suppl. Fig. S8 ). The observed equivalent protection of Hsp90, purified protein and in cell lysate, is consistent with a direct binding of NSC145366 to Hsp90 and not dependent on components of cell lysate such as co-chaperones, client proteins, or co-factors. The evidence indicates that NSC145366 does not cause general inactivation of Hsp90 by denaturation or unfolding because there is protection from pronase. Finally, there is a distinct difference in the proteolytic banding patterns observed for the protection of Hsp90 when comparing GA and NSC145366, implicating potential differences in the binding sites and/or protein conformations.
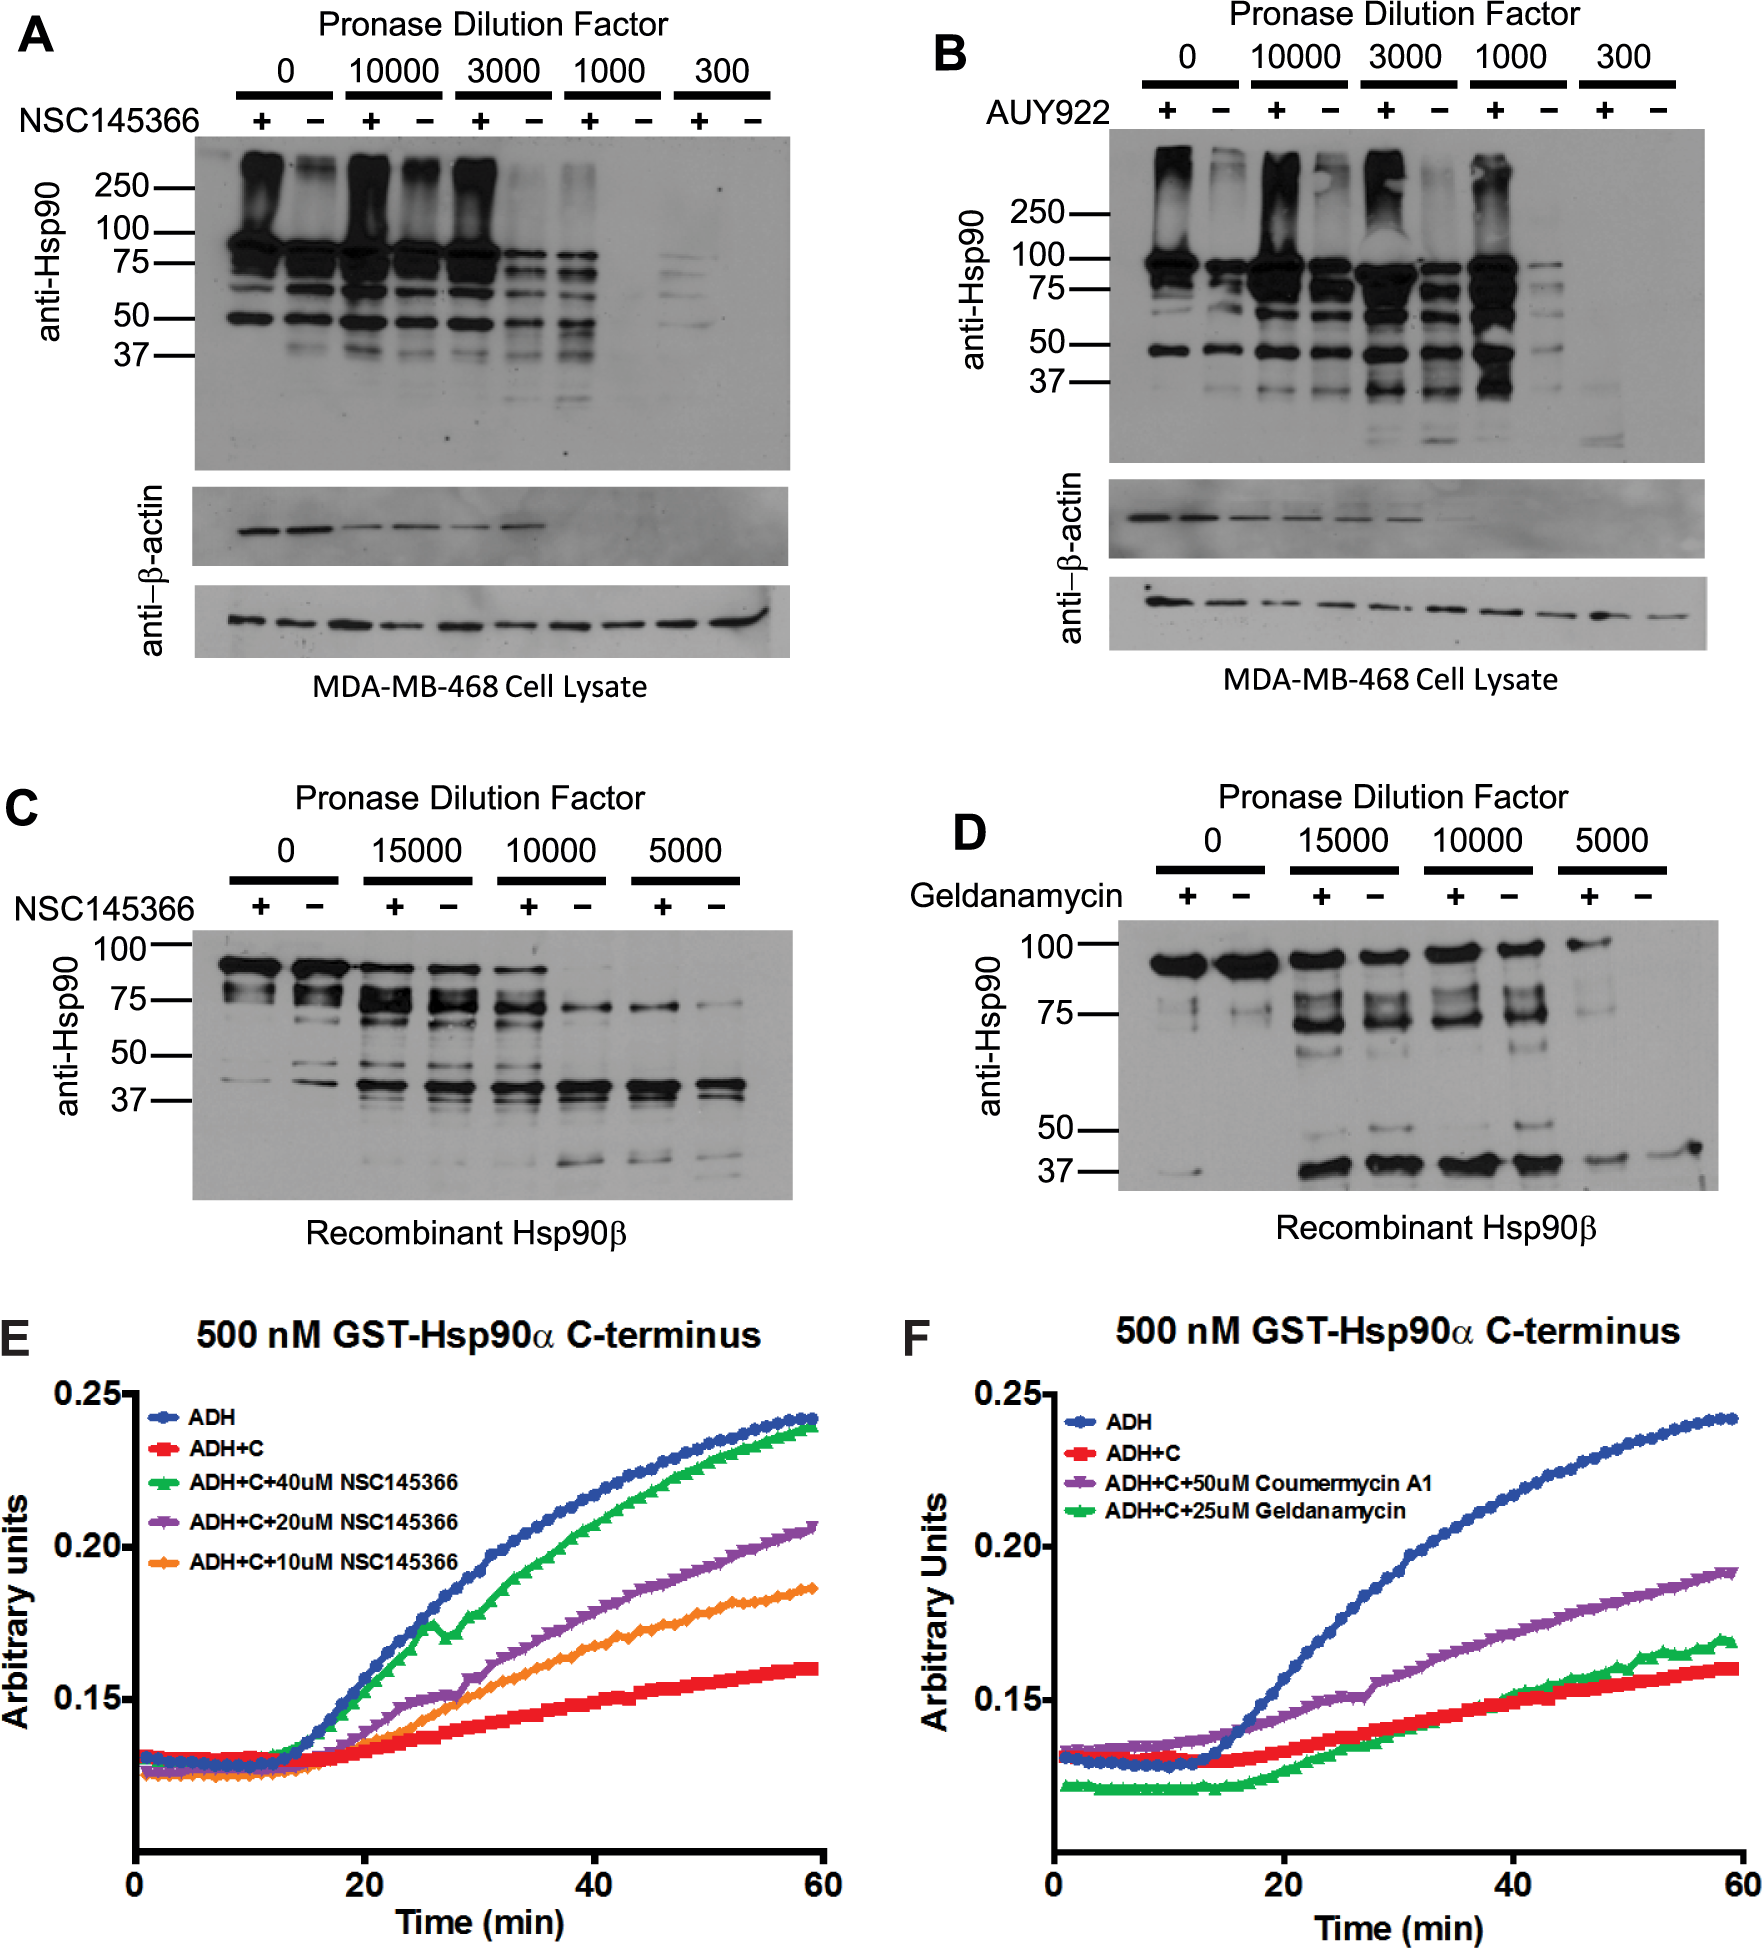
Demonstration of NSC145366 binding to Hsp90 and inhibition of C-terminal domain chaperone activity. (
The evidence for direct binding to full-length Hsp90 from the DARTs results motivated evaluation of NSC145366 for potential competitive binding with GA to the ATP binding site in the Hsp90 N-terminus. Using an established FP assay, AUY922 and GA were used as positive controls for competitive displacement of FITC-GA. However, NSC145366 did not exhibit any capacity to compete with the FITC-GA, indicating no significant binding interactions in the N-terminal ATP site ( Suppl. Fig. S9 ). The lack of binding to the N-terminus implied NSC145366 could potentially bind to the Hsp90 C-terminus. The C-terminal domain has demonstrated chaperoning activity independent of the full-length protein. 34 A chaperone assay based on ADH aggregation was implemented to assess the effect of NSC145366 on this activity. Addition of pure recombinant C-terminal Hsp90α at 500 nM showed marked suppression on the rate of ADH aggregation ( Fig. 4E ). However, addition of NSC145366 was able to reduce the C-terminal chaperone activity in a dose-responsive manner (10, 20, and 40 µM compound concentrations; Fig. 4E ). Inhibition of C-terminal chaperone activity by 20 µM NSC145366 was more potent than the 50 µM of a validated C-terminal binder, coumermycin A1 ( Fig. 4F ).
Discussion
Genetic technologies for yeast continue to provide useful models for molecular interaction studies. Cellular network models of S. cerevisae have continued to develop and enable chemogenomic approaches to define gene associations and functions. 10 Further developments of these platforms offer potential for applications in early-stage drug discovery. The Hsp90 pathway is an important and broadly involved disease target, and this turbidity-based phenotypic assay demonstrates the utility of using focused sets of yeast deletion strains to identify chemical modulators of biological pathways. The strategy used here is based on haploid deletion strains selected for Hsp90-dependent heat shock protein interaction networks. As demonstrated here and elsewhere, the reduction of chemically-induced phenotypes in yeast to definitions of target pathways can follow directly using the combined information content and/or follow-up screens. 10
Using a simple modification of yeast-culture assays, the ability to reproduce and score time-dependent changes offers advantages for screening genetic variation as well as large numbers of chemical entities. In addition to the medium and the use of settled yeast cells, a notable novelty is the quantitative phenotype metric based on QFD and DTW that enables detection of relationships among target pathways. The high repetition in plate formats enables a robust metric, which can detect subtle differences in phenotypes. The emergence of hits that represent distant nodes in the heat shock signaling pathways indicate that previously unknown synthetic lethal relationships may be detected using these sensitive assay and analysis conditions.
An example was revealed in the ras2Δ strain, in which the differential effects of ATP site antagonists RAD, GA, and macbecin were detected. Until the initiation of our study, only one genome-wide screen had screened both RAD and GA, with some differences observed between the two compounds ( Suppl. Fig. S1 ). 3 Although variation in the Hsp90 conformations bound with these small-molecule antagonists can be ascertained from x-ray crystal structures, the functional distinctions among Hsp90-protein interactions are not easily predicted. Additional yeast chemogenomic studies have profiled Hsp90 inhibitors after completion of our screens and strain selection, which also serve as interesting comparisons for strain selection.35,36 Both these additional studies found sti1Δ to be the most sensitive haploid strain and ydj1Δ as a very sensitive heterozygous diploid strain, which is in agreement with our result indicating that sti1Δ haploid is sensitive and that ydj1Δ is a very sensitive haploid strain. Presumably, ydj1Δ was not observed to be sensitive in previous haploid screens because it is a slow-growing strain that is difficult to accurately profile in the pooled strain format.
The incorporation of scoring methods for hit classification enables potential reduction to molecular pathways and targets. The follow-up studies of hits presented here are not exhaustive, because alternative strategies to mine the different classes and chemical types are possible. In the example here, NSC145366 was selected based on its class I features, but the subsequent screens of additional Hsp90 inhibitor–sensitive haploid deletion strains further defined a distinct profile, especially with the cogΔ strains. NSC145366 represents a new chemical modulator of the Hsp90 C-terminal domain. Additional focused studies on the compound interactions with Hsp90 and additional heat shock proteins are warranted to reveal the binding site(s) and full impact on chaperone complexes. Recent studies have identified alternative chemotypes to the N-terminal inhibitors, and NSC145366 is a new chemotype that matches the emerging interest in C-terminal inhibitors. 37
Footnotes
Acknowledgements
The authors acknowledge the support from the Purdue University Center for Cancer Research, NIH grant P30 CA023168, and a Phase 1 Concept Award to T.R.H.
Supplementary material is available online with this article.
Declaration of Conflicting Interests
The authors declared no potential conflicts of interest with respect to the research, authorship, and/or publication of this article.
Funding
The authors disclosed receipt of the following financial support for the research, authorship, and/or publication of this article: This work was supported by grants from the National Institutes of Health R01GM087461 (T.R.H.) and R21NS061667 (T.R.H., V.J.D.). Bartek Rajwa was supported by National Institutes of Health grant R21EB015707 and PhRMA Foundation 2012 Research Starter Grant in Informatics.
Supporting Information
A single pdf file is provided that contains figures and details of analytical methods. In addition, a zip file contains three Excel files of screening results and calculations named Tables S1, S2, and S3.
References
Supplementary Material
Please find the following supplemental material available below.
For Open Access articles published under a Creative Commons License, all supplemental material carries the same license as the article it is associated with.
For non-Open Access articles published, all supplemental material carries a non-exclusive license, and permission requests for re-use of supplemental material or any part of supplemental material shall be sent directly to the copyright owner as specified in the copyright notice associated with the article.