
Abstract
Microtubule targeting agents (MTAs) are used for the treatment of cancer. Novel MTAs could provide additional and beneficial therapeutic options. To improve the sensitivity and throughput of standard immunofluorescence assays for the characterization of MTAs, we used SNAP-tag technology to produce recombinant tubulin monomers. To visualize microtubule filaments, A549 cells transfected with SNAP-tubulin were stained with a membrane-permeable, SNAP-reactive dye. The treatment of SNAP-tubulin cells with stabilizing MTAs such as paclitaxel resulted in the formation of coarsely structured microtubule filaments, whereas depolymerizing MTAs such as nocodazole resulted in diffuse staining patterns in which the tubulin filaments were no longer distinguishable. By combining these components with automated microscopy and image analysis algorithms, we established a robust high-content screening assay for MTAs with a Z′ factor of 0.7. Proof of principle was achieved by testing a panel of 10 substances, allowing us to identify MTAs and to distinguish between stabilizing and destabilizing modes of action. By extending the treatment of the cells from 2 to 20 h, our assay also detected abnormalities in cell cycle progression and in the formation of microtubule spindles, providing additional readouts for the discovery of new MTAs and facilitating their early identification during drug-screening campaigns.
Keywords
Introduction
Microtubule targeting agents (MTAs) are widely used for the treatment of different types of cancer. The first MTAs to be identified were vinca alkaloids (e.g., vinblastine) and taxanes (e.g., paclitaxel). Vinca alkaloids depolymerize microtubule filaments, whereas the taxanes stabilize microtubule polymers. At low concentrations, both MTA classes can kill cancer cells by disrupting the dynamic remodeling of microtubules during mitosis.1,2 The superior performance of MTAs compared with other antimitotic drugs may also reflect their ability to impair the trafficking of mitotic components during interphase. 3 MTAs also affect tumor vascularization and may provide new treatment options for neurodegenerative diseases.3,4 Despite their success, MTAs also have undesirable characteristics that cause side effects such as neuropathy and myeloid toxicity. Furthermore, cancer cells can develop resistance to MTAs, and some tumors are resistant to all known MTAs, creating a demand for new MTA leads with better safety and efficacy profiles. Existing MTAs are chemically diverse, and many have been discovered in natural compound libraries, suggesting there is a large untapped reservoir of potentially therapeutic compounds.1,2
In vitro assays are needed to discover new MTAs and to test modified MTAs. These include high-throughput screening (HTS) formats that allow the parallel testing of many compounds but offer a small number of readouts and cell-based high-content screening (HCS) formats that provide multiparametric readouts but with lower analysis throughput. MTAs are usually tested using four types of assays: tubulin polymerization in vitro, 5 immunofluorescence analysis of microtubules in fixed cells, 5 radiolabeling of tubulin-bound proteins, 6 and live cell imaging of fluorescent tubulin fusion proteins. 7 In vitro assays require large amounts of purified tubulin, which are expensive, and immunofluorescence analysis involves many incubation and washing steps, which reduce the throughput for automated assays. Many MTAs have therefore been discovered indirectly by cell cycle analysis,8,9 migration assays 10 (primary screening), or cytotoxic activity, 11 with their microtubule interactions identified in secondary immunofluorescence or in vitro polymerization experiments. However, a small number of more sophisticated and elaborate HCS assays that address microtubule dynamics have also been described.12–14
We have developed a new cell-based HCS assay that allows microtubule dynamics to be investigated in living cells, with multiparametric readouts captured by automated confocal microscopy and image analysis. We used SNAP-tag technology, which is based on a modified human O6-alkylguanine-DNA alkyltransferase. This enzyme recognizes O6-benzylguanine (BG) and forms a covalent bond with the benzyl group, allowing BG-modified fluorophores to be coupled to the SNAP-tag with 1:1 stoichiometry. 15 We produced recombinant versions of α and β3 tubulin with an integral SNAP-tag and introduced these constructs into the cancer cell line A549. Microtubules could be visualized by staining integrated SNAP-TubA or SNAP-TubB3 with cell-permeable, BG-modified fluorophores. This allowed the identification and selection of recombinant clones that were developed into stable cell lines. These cells were then used to analyze a panel of MTAs for their effect on microtubule dynamics, cell cycle progression, and microtubule spindle formation, thus providing proof of concept for the novel assay format.
Material and Methods
Model Compounds
With the exception of paclitaxel (Biomol, Hamburg, Germany) and etoposid (TCI Deutschland GmbH, Eschborn, Germany), all compounds were purchased from Sigma-Aldrich (Steinheim, Germany): aphidicolin, colchicine, cytochalasin D, demecolcine (colcemid), epothilone B, latrunculin B, nocodazole, thymidine, and vinblastine. Stock solutions were prepared according to the manufacturers’ instructions with concentrations of 1 to 100 mM, so that DMSO levels in the cell culture medium did not exceed 1% [v/v]. Unless otherwise specified, all compounds were applied at a concentration of 10 µM, with the exception of the reference substances paclitaxel and nocodazole, which were applied at a concentration of 500 nM.
Cell Lines and Cell Culture Reagents
The human lung carcinoma cell line A549 was obtained from the American Type Culture Collection (CCL-185). Cells were cultured in DMEM/F-12 (Thermo Fisher Scientific, Darmstadt, Germany) supplemented with 10% (v/v) fetal calf serum (Biochrom AG, Berlin, Germany), 5 mM Glutamax, and 15 mM HEPES (both Thermo Fisher Scientific).
Molecular Cloning of pSNAP-TubA and pSNAP-TubB3
The pSNAPf vector (New England Biolabs, Schwalbach, Germany) was used to transfect mammalian cells with the tubulin fusion constructs. The cDNA templates for α tubulin (pTagGFP2-α-tubulin, Evrogen; acquired from BioCat, Heidelberg, Germany) and βIII tubulin (pCMV 6XL5 βIII tubulin; OriGene, Rockville, MD) were amplified by PCR using primers 5′-TubA-BamHI (5′-CAG TTG GAT CCG TGC GTG AGT G-3′), 3′-TubA-NotI (5′-CTC TAG CGG CCG CGT ATT CCT CTC-3′), 5′-TubB3-BamHI (5′-GGT CCA GGA TCC ATG AGG GAG ATC G-3′), and 3′-TubB3-NotI (5′-GGT CCA GGA TCC ATG AGG GAG ATC G-3′). Finally, using restriction enzymes BamHI and NotI (New England Biolabs), the tubulin cDNAs were inserted downstream of the SNAP-tag coding region in pSNAPf to generate plasmids pSNAP-TubA and pSNAP-TubB3.
Transfection of A549 Cells and Selection of Positive Clones
Cells were transfected using peqFECT (PEQLAB, Erlangen, Germany) according to the manufacturer’s instructions with an additional medium exchange 5 to 7 h posttransfection. The transfected A549 cells constitutively expressing the protein of interest were cultivated in medium containing 400 to 800 µg/ml G418 (Invivogen, Toulouse, France) and adapted to normal passaging routines. Monoclonality was achieved by limiting dilution, and the resulting clones were tested for expression, signal intensity, and homogeneity by staining them with SNAP Cell TMR Star (New England Biolabs) according to the manufacturer’s protocol.
Protocol for the SNAP-Tubulin–Based Assay
We seeded 7 × 10³ A549 cells transfected with SNAP-TubA or A549 SNAP-TubB3 into the wells of 96-well half-area microplates (µClear, Greiner Bio One, Frickenhausen, Germany) in a total volume of 50 µL cell culture medium without G418. Microtubules and nuclei were stained directly by adding 50 µL/well of 30 nM SNAP Cell TMR Star (diluted in cell culture medium) and 1 µg/mL 4′,6-diamidino-2-phenylindole (DAPI; Thermo Fisher Scientific) and incubating the cells overnight before treatment with MTAs. Depending on the assay modality, images were acquired 24 h or 42 h after staining.
Immunofluorescence Detection of Tubulin
We seeded 104 cells/well into a 96-well half-area µClear microtiter plates in medium without G418 and incubated the plates at 37 °C for 4 to 6 h before refreshing the cells with phenol-red free medium. The following day, the cells were optionally treated with 500 nM of the MTAs paclitaxel and nocodazole for 2 h or 20 h, then washed twice with phosphate-buffered saline (PBS) and fixed in 4% (w/v) paraformaldehyde (Polysciences, Inc., Eppelheim, Germany) in PBS for 10 min at room temperature. The cells were washed twice with PBS before and after permeabilization for 10 min with 0.1% (v/v) Triton X-100 in PBS. Nonspecific binding was blocked with 3% (w/v) bovine serum albumin (IgG free Fraction V, Sigma-Aldrich) in PBS overnight at 4 °C or at room temperature for 1 h. The primary antibody (mouse-anti-α-tubulin, Sigma-Aldrich) was added at a dilution of 1:1000 and was detected with a secondary goat-anti-mouse DyLight488 antibody (Abcam, Cambridge, UK). The cells were washed three to five times with PBS between steps. Finally, the nuclei were counterstained with 0.5 µg/mL DAPI.
Image Acquisition and Analysis
Images were acquired using the Opera QEHS 2.0 automated confocal microscope system (PerkinElmer, Waltham, MA). We selected three imaging setups: “short-term high magnification” to detect effects after 2 h of incubation with MTAs (40× air objective 0.85 numerical aperture), “long-term low magnification,” and “long-term high magnification” to detect effects after 20 h of incubation with MTAs (10× air objective 0.25 numerical aperture and 40× air objective 0.85 numerical aperture, respectively). For the long-term high-magnification experiments, images were acquired at two focal planes to ensure detection of flat adherent and round cells. Images were processed using the Acapella High Content Imaging and Analysis Software (PerkinElmer).
For image analysis, we used the Columbus Image Data Storage and Analysis System (PerkinElmer), which includes modules to calculate texture parameters. For all assay variations, we built a similar pipeline for image analysis starting with nuclei and cytoplasm detection and the definition of cell regions. The desired cell populations were selected by filtering all detected objects based on the parameters cell area and nuclei fluorescence intensity. For example, in long-term high-magnification experiments, mitotic cells were defined with a cell area smaller than 5000 pixels and a nuclear fluorescence intensity >35 [a.u.]. Texture parameters for tubulin staining were measured in the images of short-term and long-term high-magnification experiments. The Haralick algorithm 16 was chosen to determine differences in the texture of tubulin staining. After several tests, we selected a pixel radius of 10 in the settings of the Columbus software because this produced the most significant differences, particularly for the parameters “Haralick contrast” and “Haralick homogeneity,” also known as “Inverse Difference Moment.” The median of image analysis parameters for all selected objects per well was chosen for subsequent statistical analysis.
Statistical Analysis and Assay Performance
Statistical analysis was carried out using Graph Pad Prism v5.0. One-way analysis of variance (ANOVA) and subsequent Dunnett’s multiple comparison tests were performed to evaluate differences between treatments and controls. Significance levels were defined as follows: ***p < 0.001 and **p < 0.01. To evaluate the assay performance, the Z′ factor was calculated according to Zhang and others. 17
Results
SNAP-Tubulin Staining of Microtubule Structures and Analysis of Microtubule Dynamics
We established a new cell-based assay for the detection of microtubule alterations using SNAP-tag technology. In the first step, we cloned the plasmids pSNAP-TubA and pSNAP-TubB3 by inserting the cDNAs encoding α or β3 tubulin downstream of the SNAP-tag open reading frame in the pSNAPf plasmid (New England BioLabs). Next, we selected a suitable cell line with the following properties: adherent growth, large cytoplasm-to-nucleus ratio, easy handling, and easy to transfect. The lung carcinoma cell line A549 fulfilled all of those characteristics, and immunofluorescence staining of α tubulin in these cells revealed a distinct microtubule network (compare the upper left picture in Fig. 1A ). We therefore transfected A549 cells with the plasmids pSNAP-TubA or pSNAP-TubB3, and clones expressing the recombinant proteins were selected by cultivation in the presence of G418. Monoclonality was achieved by subsequently limiting dilution. The microtubules were stained with cell-permeable BG-modified dyes, revealing differences in microtubule staining according to the tubulin isoform, as shown in Figure 1A (control cells, left panel). SNAP-TubA staining yielded a signal that was almost evenly distributed throughout the cytoplasm, whereas SNAP-TubB3 staining revealed the microtubule filaments. SNAP-TubA staining did not reveal microtubule filaments with the same clarity observed for SNAP-TubB3 staining under all the incubation conditions tested (data not shown).
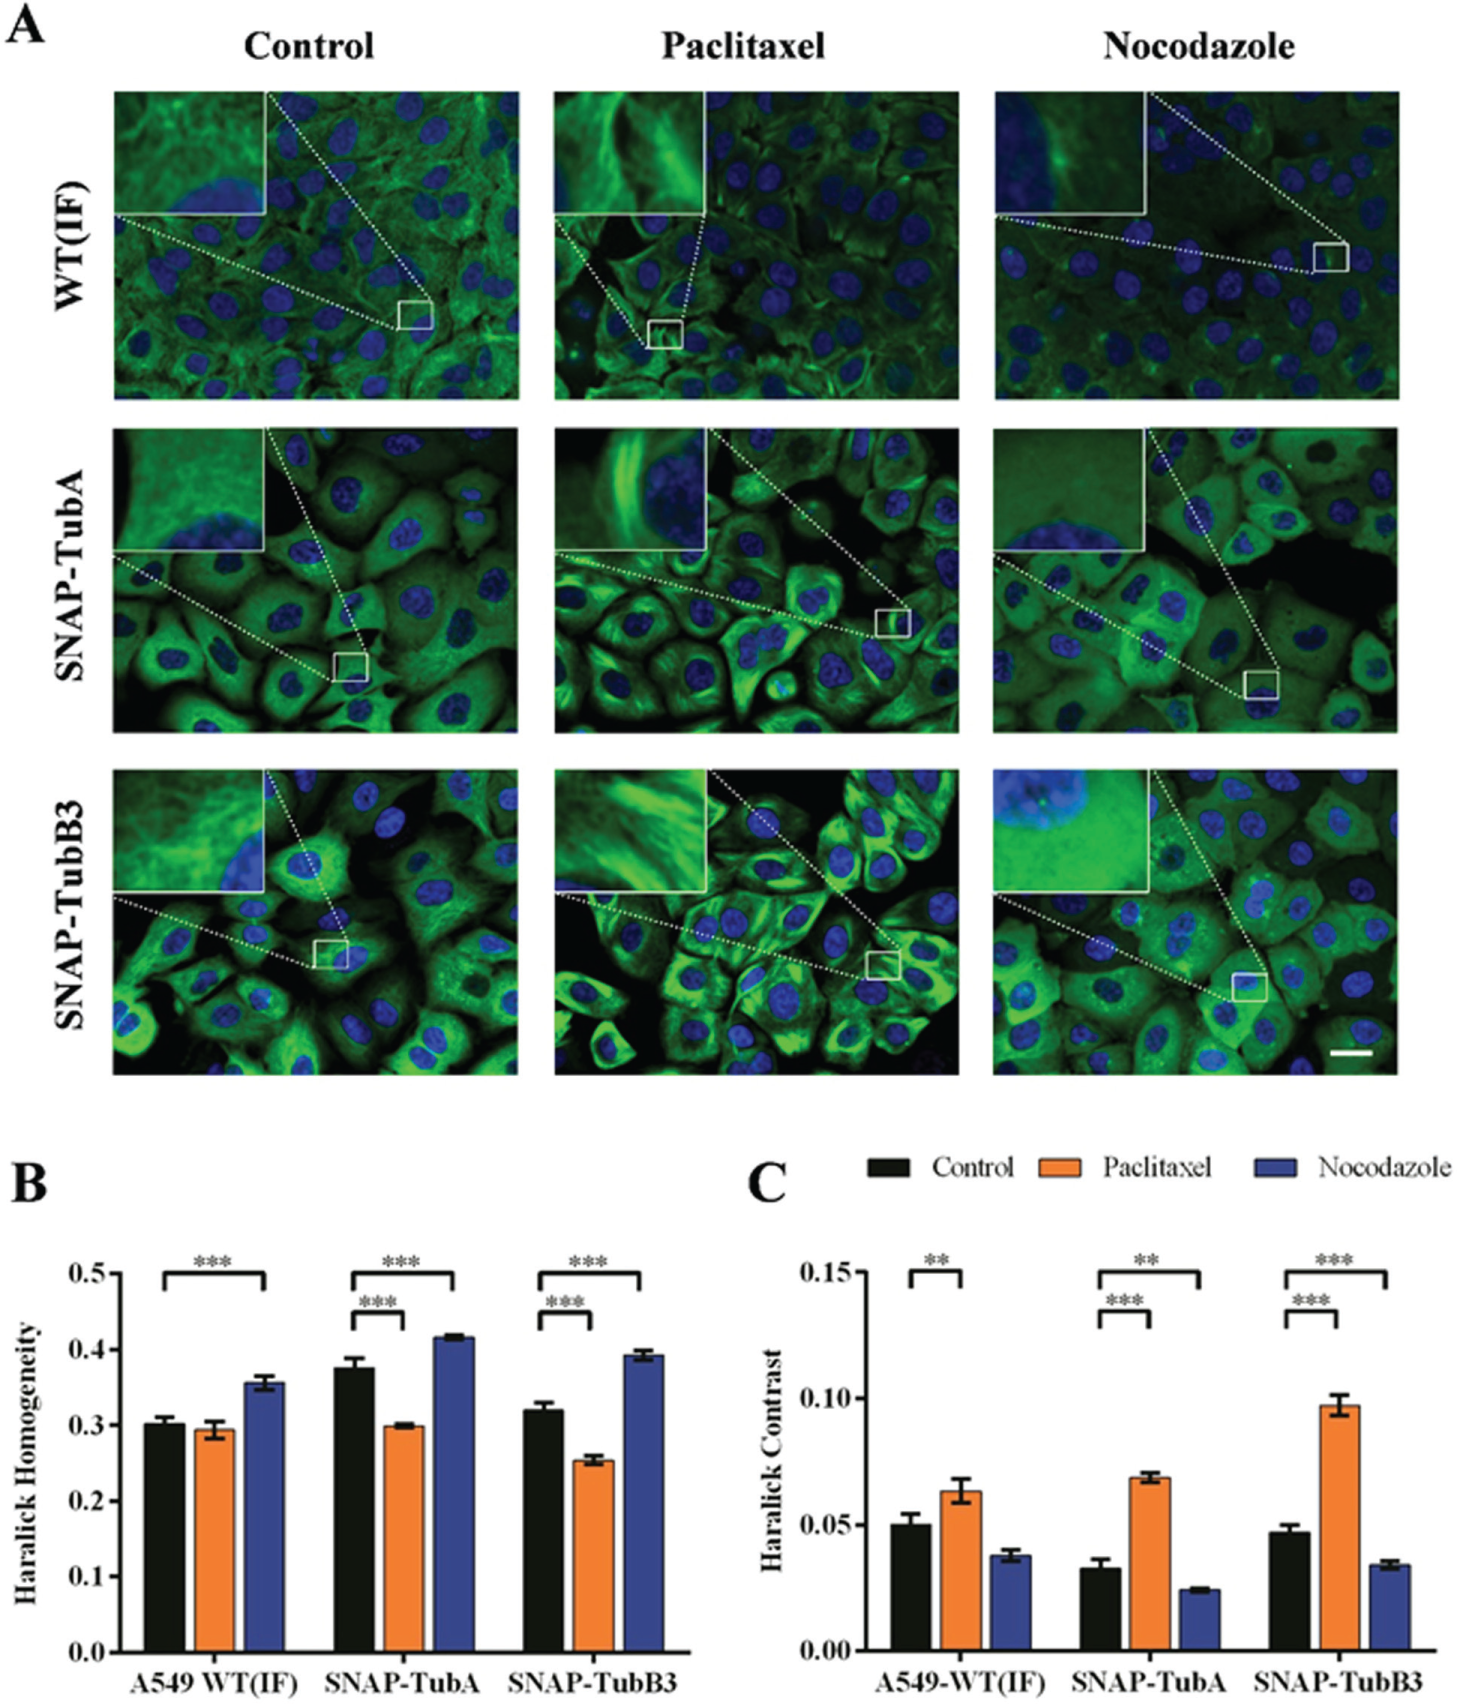
Immunofluorescence and SNAP-tubulin staining of microtubules in A549 cells and quantification of changes in microtubule dynamics. (
The recombinant A549 clones were treated with reference substances that stabilize microtubules (paclitaxel) or destabilize them (nocodazole). The unstructured microtubules in untreated cells expressing both SNAP-TubA and the finely structured microtubules in untreated cells expressing SNAP-TubB3 changed to coarsely structured microtubules following treatment with paclitaxel. For the destabilizing MTA nocodazole, the finely structured microtubules dissolved so that no structures were visible after treatment. We observed these effects with our novel SNAP-tubulin detection method as well as by traditional immunofluorescence staining ( Fig. 1A ).
We analyzed the phenotypic differences described above using the Columbus System for High Content Imaging Data (PerkinElmer) and found the texture parameters “contrast” and “homogeneity” obtained from the Haralick algorithm 16 suitable to quantify the effects induced by MTA treatment ( Fig. 1B , C ). For all three detection methods (immunofluorescence, SNAP-TubA, and SNAP-TubB3 staining), the “Haralick homogeneity” parameter decreased in paclitaxel-treated cells but increased in response to nocodazole treatment, whereas the “Haralick contrast” parameter showed the opposite profile. The quantitative phenotypic differences between treatments were confirmed by one-way ANOVA and subsequent Dunnett’s multiple comparison tests for each parameter and staining method, revealing significant differences between MTA treatments and controls. The performance of the SNAP-tubulin clones was better than the immunofluorescence staining of tubulin because in using our protocol in combination with image analysis, higher levels of significance were achieved. The detection of microtubules for SNAP-TubB3 cells was slightly better than that for SNAP-TubA cells. The former were therefore selected for further experiments.
With the basic tools in hand, we refined the assay protocol by determining optimal cell counts, concentrations, and incubation times for the BG-fluorophore and MTAs. This resulted in a convenient assay in which cells could be seeded and stained simultaneously, without the need for intermediate washing, thus minimizing the number of pipetting steps and making the assay suitable for automation and high-throughput analysis. The assay protocol was also adapted to a 384-well plate format (data not shown). This option may significantly increase the throughput of the assay. However, for this plate format, the assay requires further validation.
Analysis of Cell Cycle Progression and of the Formation of Microtubule Spindles
We extended the incubation times of our assay from 2 to 20 h (long-term setup) to investigate changes in cell cycle progression or the formation of microtubule spindles. We observed a pronounced formation of round cells, which arose during mitosis. An image acquired at low magnification (10× images) provided an overview of the cell population and revealed a higher proportion of round cells after treatment with the reference substances paclitaxel and nocodazole compared with untreated controls ( Fig. 2A ). More detailed information was extracted from high-magnification images (40× images). To capture cells still spread and attached to the bottom of the well and round cells arrested during mitosis, the settings of the automated confocal system were adjusted to acquire images on two focal planes. In the lower focal plane, the effects on the microtubules were similar after 2 and 20 h (data not shown). However, in the upper focal plane, we detected additional changes in the formation of microtubule spindles after 20 h, possibly reflecting the disruption of microtubule dynamics. Untreated control cells showed intact mitotic spindles separating chromosomes during mitotic anaphase. Cells treated with paclitaxel showed multiple spindles, whereas those treated with nocodazole lacked microtubule spindles all together and showed an evenly distributed fluorescence signal ( Fig. 2A ). We used the Columbus System to quantify the effects of MTA treatment and detected significant differences in the proportion of round cells at low magnification ( Fig. 2B ) as well as in the texture parameters of cells imaged at the higher focal plane of the high-magnification setup ( Fig. 2C ).
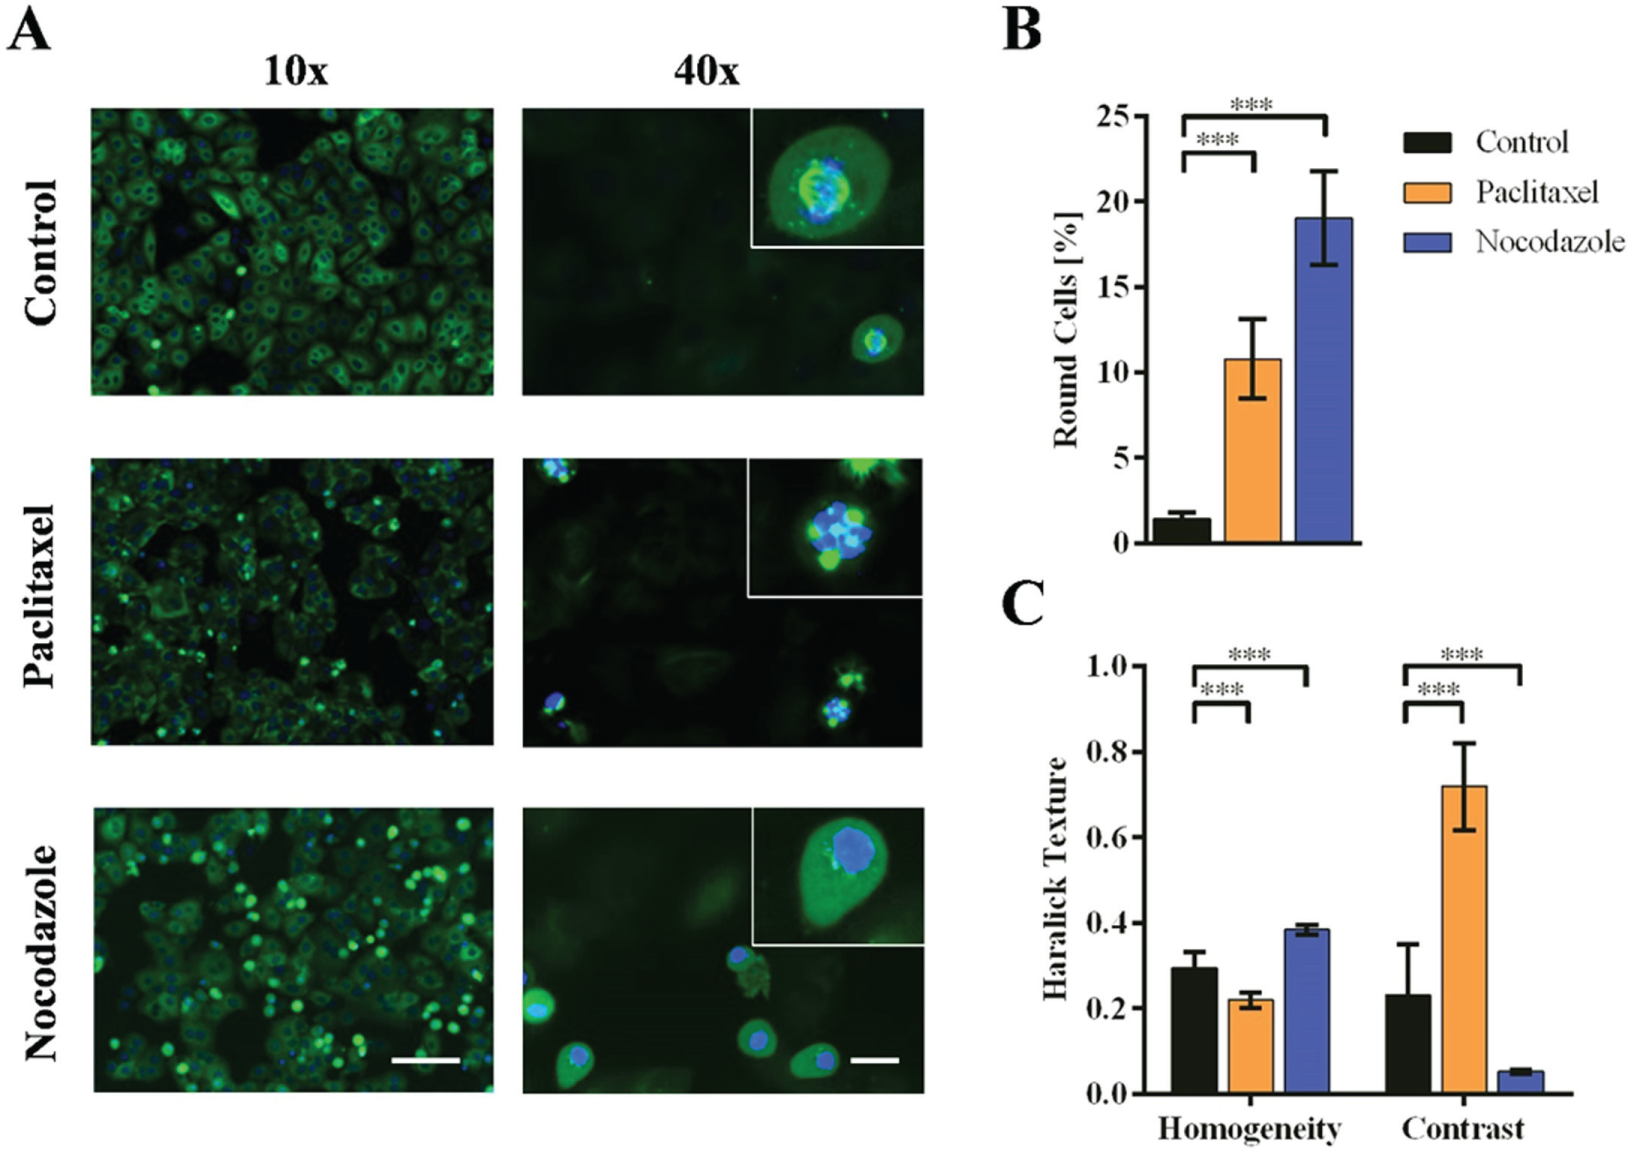
Quantification of changes in cell cycle progression and microtubule spindle formation. (
Validation and Proof of Principle of the Microtubule Assay
The performance of our assay was measured by the Z′ factor, an indicator of assay robustness. In general, for HCS, a Z′ factor in the range between 0.5 and 1 is considered excellent. Z′ factors varied among the assay variants and the different image analysis parameters ( Table 1 ). For short-term effects, the Z′ factor was ~0.7 for all treatments/parameters combinations, except for the combination nocodazole and Haralick contrast. Remarkably high Z′ factors were achieved for the percentage of round cells at low magnification after the analysis of long-term effects ( Table 1 ) probably because of the large number of analyzed cells. Lower Z′ factors were observed for the high-magnification analysis of texture parameters of the long-term setup, probably because the analysis of the texture parameters was carried out only for round cells. This assay format did not yield a large data set and especially control cells with their low proportion of mitotic phenotypes produced relatively high standard deviations. However, this variability can be counteracted by increasing the number of images.
Z′ Factors of the Microtubule Assay in A549 SNAP-TubB3 Cells Treated with the Reference Compounds Paclitaxel and Nocodazole (Positive Control) Compared with Untreated Control Cells (Negative Control; Short Term, n = 4; Long Term, n = 9).
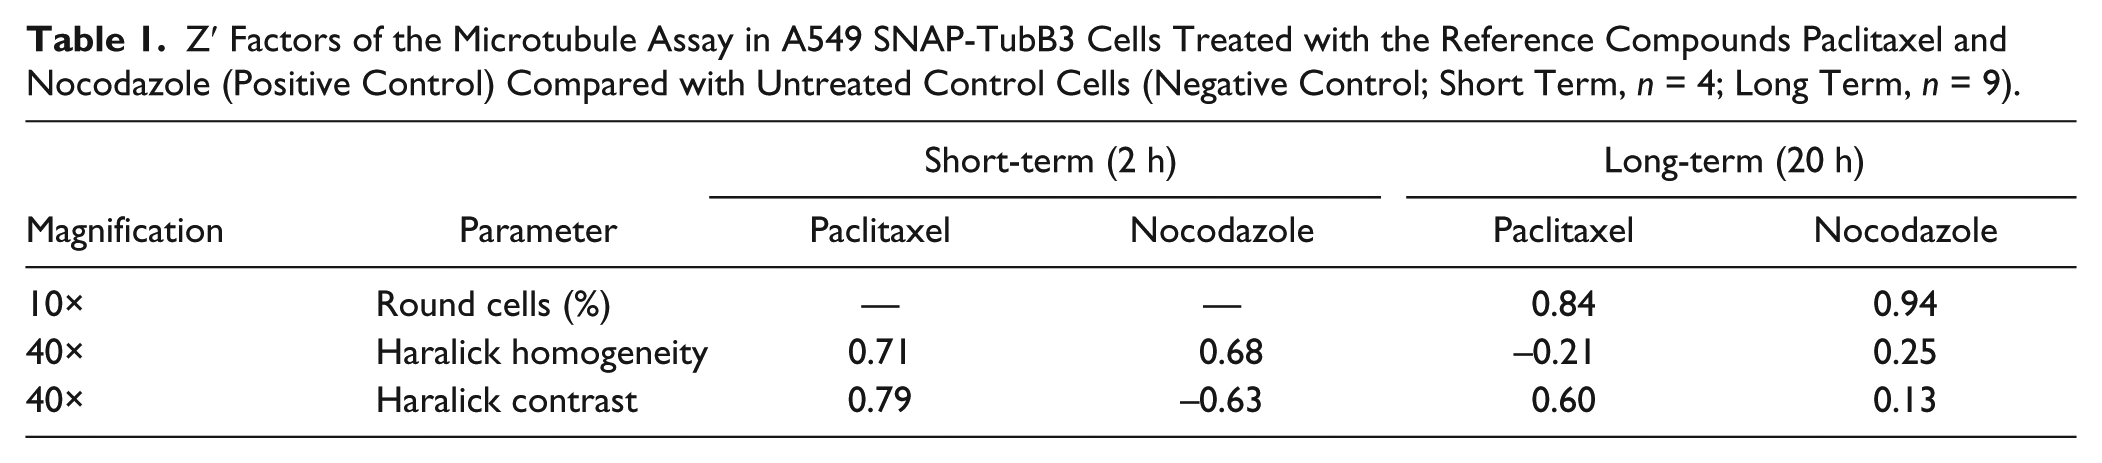
In consideration of these results, it was concluded that the effects measured by the low-magnification long-term setup were rather nonspecific for microtubule dynamics and were therefore confirmed by more detailed analysis at high magnification. For instance, the stabilizing effects of paclitaxel were best captured by the texture parameters of short-term experiments and by the Haralick contrast of long-term experiments. The destabilizing effects induced by nocodazole were most obvious in short-term experiments for the parameter Haralick homogeneity but were also detected for both texture parameters of long-term experiments, albeit with a lower significance.
To achieve proof of principle on the selectivity of our assay, we tested a panel of 10 compounds and monitored their effects on microtubule dynamics, including known MTAs such as epothilone B and vinblastine, but also substances that affect actin filaments or cell cycle progression but not microtubule dynamics directly.
The scatter plot of the short-term effects of MTAs in Figure 3A highlights the opposing effects of these agents on the texture parameters Haralick homogeneity and Haralick contrast. As described above, we observed an increase in Haralick homogeneity and a decrease in Haralick contrast for nocodazole treatment and the opposite effects for paclitaxel treatment. The Haralick homogeneity parameter was also marginally higher than that of control cells for two additional substances: colchicine and demecolcine. The stabilizing agent epothilone B and surprisingly the destabilizing agent vinblastine showed paclitaxel-like effects, because they reduced the Haralick homogeneity while increasing the Haralick contrast ( Fig. 3A ). Most of the off-target substances had no effect, but the actin-targeting substances latrunculin B and cytochalasin D displayed effects similar to those of microtubule-stabilizing substances, perhaps caused by the indirect impact of actin filament disruption on microtubule dynamics.
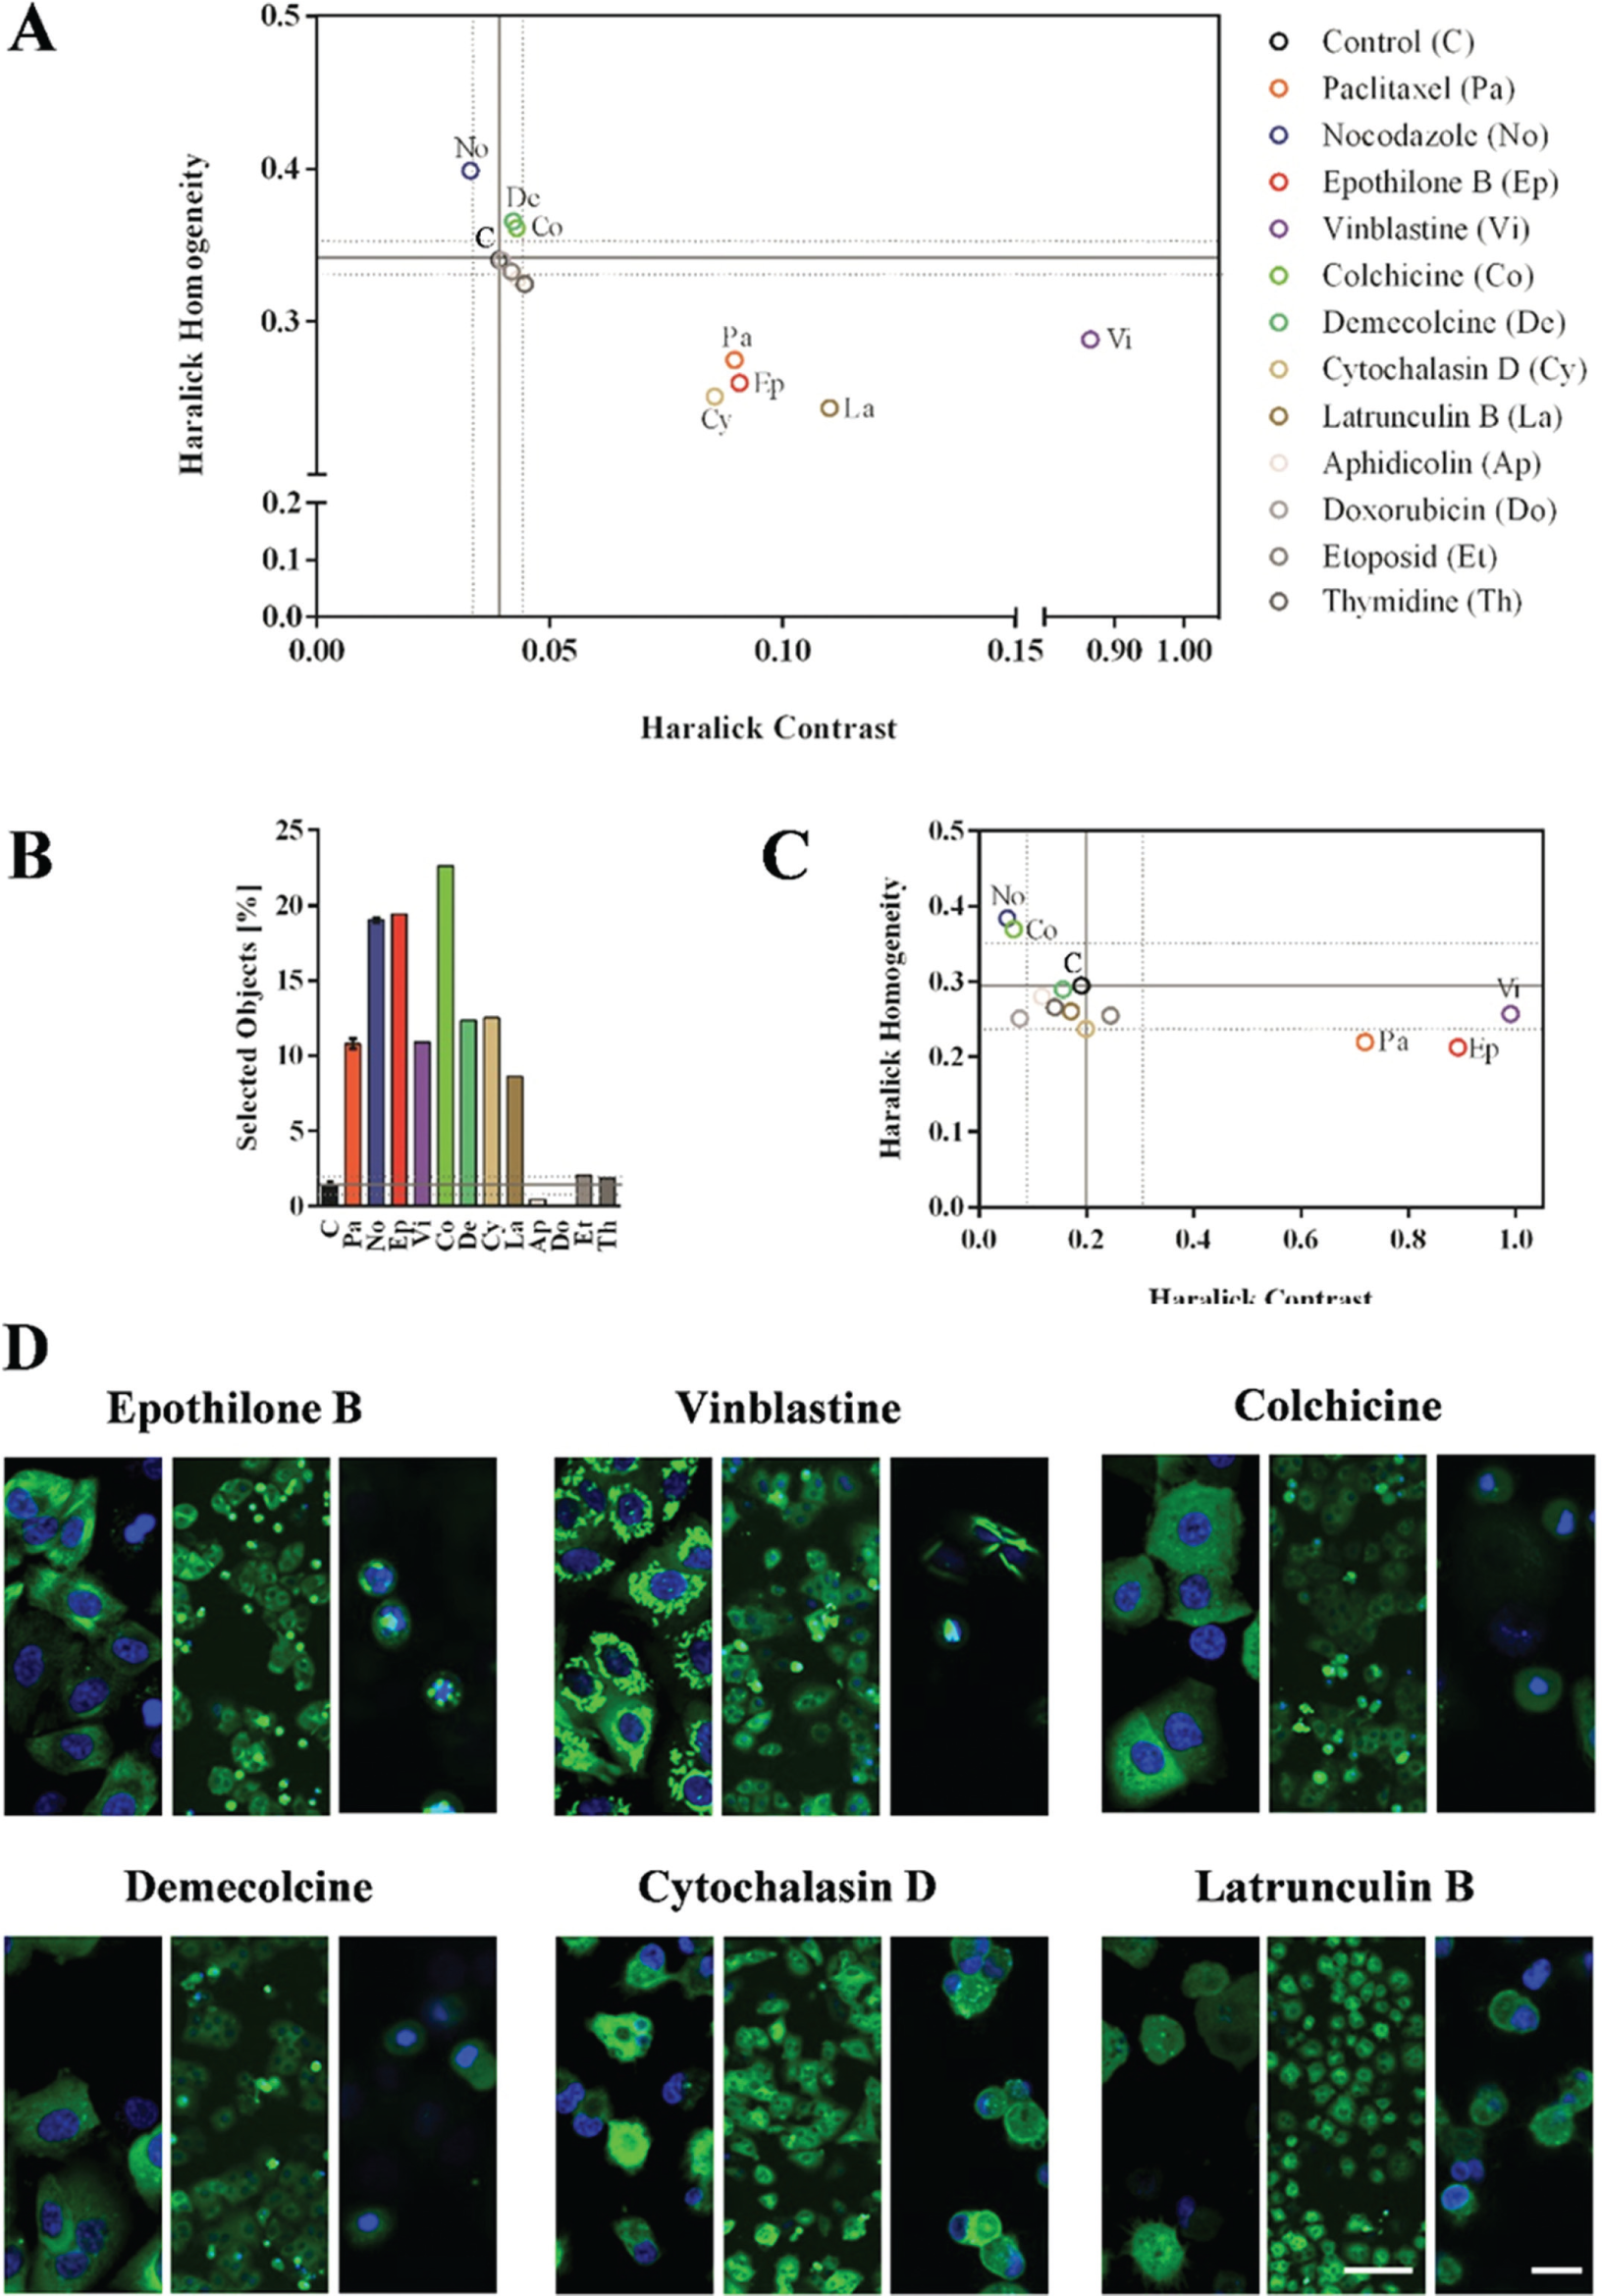
Validation of the SNAP-tubulin–based microtubule assay with a panel of selected microtubule targeting agents and off-target substances. (
Effects on the cell cycle were analyzed by measuring the proportion of round cells at 10× magnification ( Fig. 3B ). This parameter was increased by colchicine, demecolcine, epothilone B, vinblastine, latrunculin B, and cytochalasin D, which all demonstrated short-term effects on microtubule dynamics in our new assay ( Fig. 3A ). However, as mentioned above, the analysis of low-magnification images detected only round cells, which were likely arrested at mitosis, but did not detect differences in the modes of action of the MTAs or effects on apoptosis. In contrast, the analysis of 40× images with more detailed information (albeit for fewer cells) distinguished between MTAs and actin-targeting substances because the texture parameters of latrunculin B and cytochalasin D did not reveal any differences compared with the control cells ( Fig. 3C ). Furthermore, destabilizing and stabilizing MTAs once again showed opposing effects in terms of texture analysis. Colchicine and the reference substance nocodazole increased the Haralick homogeneity parameter while reducing the Haralick contrast, reflecting their destabilizing mode of action. The opposite effects were observed for the MTAs epothilone B and vinblastine ( Fig. 3C ).
Representative images of the different treatments and their effects on microtubule dynamics as detected by image analysis are shown in Figure 3D . For example, epothilone B, which clusters with paclitaxel ( Fig. 3A , C ), displayed the same stabilizing effects on tubulin (compare Fig. 1A and Fig. 2A ). The destabilizing MTA vinblastine represented quite an exception because treatment at high concentrations resulted in the formation of structures similar to the tubulin paracrystals reported by Jordan and others. 18 These tubulin structures produced high Haralick contrast values ( Fig. 3A , C ), explaining vinblastine’s clustering with stabilizing MTAs. The images also show the microtubule-destabilizing effects of colchicine and demecolcine as well as the indirect effects on microtubules for the actin-targeting substances latrunculin B and cytochalasin D.
We also carried out preliminary dose-response experiments with the tested substances, and some selected results for texture parameters of short-term experiments are shown in Figure 4 . We tested four concentrations ranging from 0.2 to 10 µM and observed only slight dose-dependent changes for epothilone B treatment. The destabilizing effects of colchicine were not detected at the lowest concentration (0.2 µM) but were observed at all the other concentrations, with only minor concentration-dependent effects. Vinblastine displayed two opposing effects on microtubule structures, which were concentration dependent. Destabilizing effects were detected only at low concentrations (0.2 and 0.6 µM), an intermediate state was observed at 2.5 µM (which also explains the high standard deviation), and the formation of tubulin paracrystals was recorded at the highest concentration tested (10 µM).
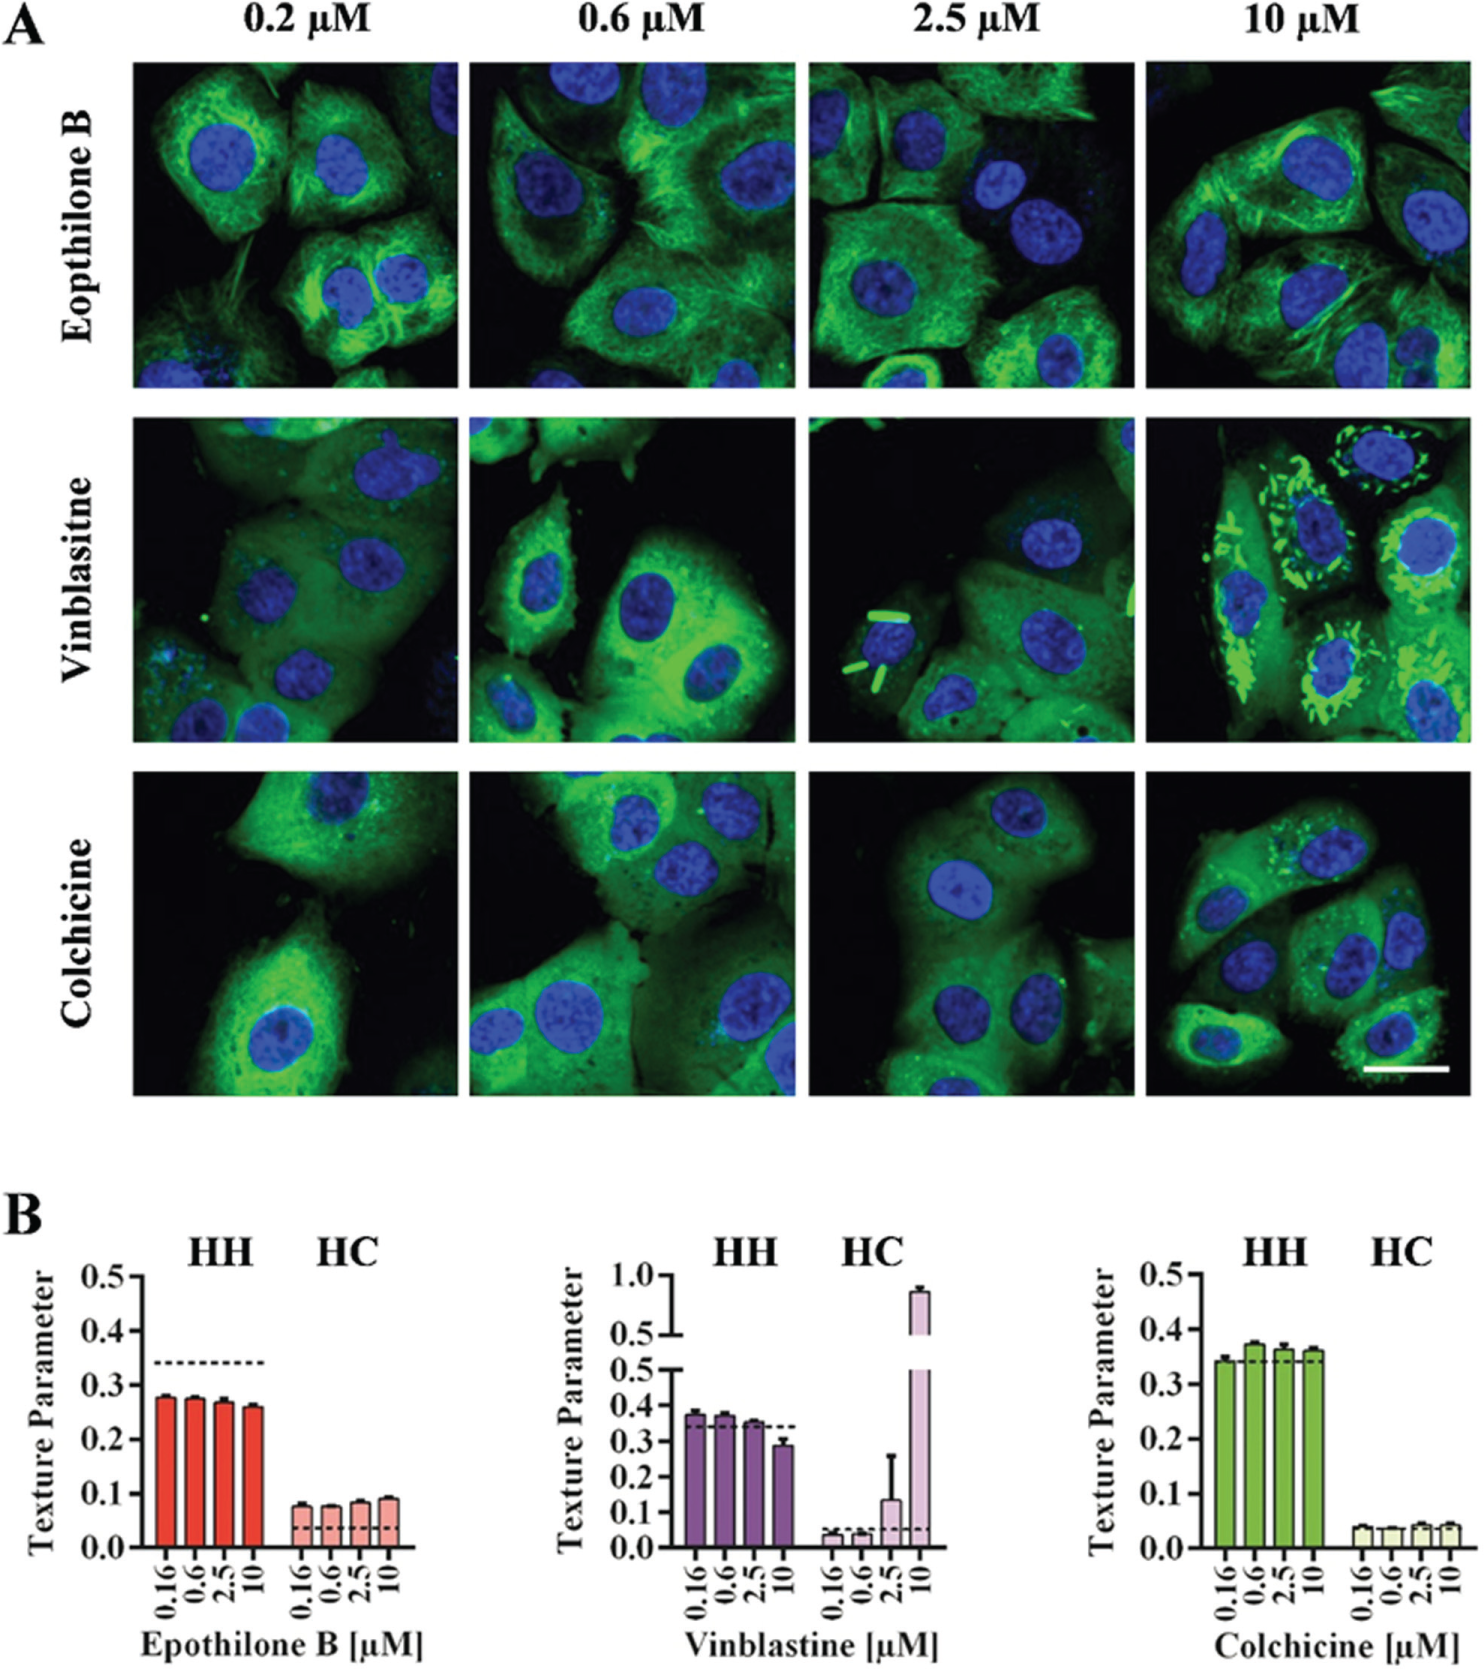
Preliminary analysis of dose-dependent short-term effects of microtubule targeting agents measured by the SNAP-tag–based microtubule assay. (
This data set provided proof of concept that the SNAP-tubulin assay is suitable for the detection of changes in microtubule dynamics and can distinguish between stabilizing and destabilizing modes of action. In addition, our assay detected anomalous tubulin structures, such as the concentration-dependent formation of paracrystals caused by vinblastine that were sorted out and classified by secondary confirmatory screenings.
Discussion
We established a novel cell-based HCS assay for the detection of changes in the microtubule network by using the SNAP-tag technology. We genetically fused the SNAP-tag to two isoforms, tubulin A and tubulin B3, that have been implicated in resistance to MTAs.1,19 Because of these features of the two isotypes, we speculated that the development of an assay for one or both tubulins would provide a robust framework for selection of drugs with high potency. We observed some differences in the optical features of labeled microtubules when comparing SNAP-tag fusions to the tubulin isoforms A and B3. Nevertheless, we treated both recombinant cell lines (A549 SNAP-TubA and A549 SNAP-TubB3) with MTAs for 2 h. This short treatment mainly targeted interphase cells. Stabilizing MTAs induced the formation of coarsely structured microtubules, whereas depolymerizing MTAs caused the fine microtubule networks to dissolve. To target mitotic cells, we also extended the treatment to 20 h. This detected cell cycle arrest and changes in the formation of microtubule spindles. By image analysis, using the Haralick texture algorithms 16 in the Columbus software platform, we were able to show that the SNAP-tubulin assay detected and distinguished several changes in the tubulin network caused by exposure to MTAs. These included the following:
stabilized or destabilized microtubule structures detected by short-term high-magnification analysis,
cells arrested during mitosis resulting in a higher proportion of round cells during long-term low-magnification observations, and
changes in microtubule spindle formation resulting in multiple spindles or the absence of spindles in the long-term high-magnification setup.
These results concurred with those described by other groups. Changes in the microtubule network caused by paclitaxel (
Figs. 1
These preliminary experiments indicated that the assay window for the SNAP-TubB3 cells was larger than that observed with the SNAP-TubA cells for both stabilizing and destabilizing substances. We selected SNAP-TubB3 for further experiments on assay development. Additional investigation on SNAP-TubA and in particular on the differences between the two isotypes was not carried out because it is beyond the scope of the research work.
We tested the assay with a panel of 10 MTAs and effectively retrieved epothilone B, vinblastine, colchicine, and demecolcine ( Fig. 3 ). As already reported by others, epothilone B stabilized microtubules in a similar manner to the reference substance paclitaxel, 23 whereas treatment with vinblastine resulted in the formation of tubulin paracrystals at high concentrations (1018 and 25 µM 12 ) or destabilizing effects at low concentrations (2 µM 14 and 7 nM 22 ). The assay also detected the destabilizing effect of colchicine, which was previously demonstrated by microscopy.12,22 The colchicine derivate demecolcine 24 also destabilized microtubule structures ( Fig. 3A ) and caused cells to arrest during mitosis ( Fig. 3B ). However, the result of the image analysis by the parameters for mitotic spindle formation did not differ significantly from control cells ( Fig. 3C ). Visual inspection of the images of cells treated with demecolcine revealed several apoptotic cells, which were partially detected by image analysis (data not shown). These cells showed large clusters of labeled tubulin and counteracted the destabilizing/monopolar spindle phenotype, thus averaging the texture parameter to levels comparable with control cells.
A panel of off-target molecules was included to test the specificity of the assay. The actin-targeting substances latrunculin B and cytochalasin D 25 affected microtubule structure in an indirect manner, which was detected by short-term high-magnification analysis ( Fig. 3A ). These substances also induced a round cell phenotype, which was detected by long-term low-magnification analysis ( Fig. 3B ). Although the phenotypes differed from control cells during mitosis in the long-term high-magnification analysis, the actin-targeting substances affected microtubule spindle formation differently ( Fig. 3D ), and the spindles were no longer detected ( Fig. 3C ). We previously reported in unrelated experiments that changes of filamentous actin in response to latrunculin B can also affect the microtubule network, 26 explaining why such substances scored positive in our SNAP-tubulin assay.
We also tested additional off-target compounds such as aphidicolin, a DNA polymerase inhibitor 27 ; the intercalating agent doxorubicin, which causes DNA double-strand breaks 28 ; the topoisomerase II inhibitor etoposide 29 ; and thymidine, which has been widely used for cell cycle synchronization. 30 These substances were expected to affect cell cycle progression and thus induce apoptosis and were tested in our assay to exclude their detection while screening for MTAs. At the selected concentration of 10 µM and incubation times of 2 or 20 h, these off-target substances had no detectable impact. If applied at higher concentrations, we would expect these substances to score positive by image analysis for the number of round cells because this parameter does not distinguish between MTAs and other antimitotic agents. The analysis of images acquired at high magnification should nevertheless distinguish between MTAs and other cell cycle disruptors and exclude these off-target substances.
In general, methods for the analysis of microtubule dynamics described in the literature or commercially available include three approaches: immunofluorescence, fusion of recombinant fluorescent proteins to tubulin, and fluorescent tubulin-staining probes.
Immunofluorescence is independent from transfection of cells, but it is not suitable for live cell imaging and requires fixation of the cells and several antibody incubations as well as washing steps, which consequently reduce their application in high-throughput technologies. Nevertheless, a few immunofluorescence assays for the analysis of microtubule dynamics have been published including an assay that distinguishes between tyrosinated and detyrosinated tubulin and in which the depolymerization of microtubules reduces the Tyr-tubulin signal, whereas stabilizing effects increase the Glu-tubulin signal. 12 The fluorescence intensity of tubulin was measured in a plate reader, which makes this rather elaborate immunofluorescence procedure unsuitable for measuring multiparametric readouts required for HCS. Proof of principle for this approach was provided using a selection of 39 compounds. 12 In follow-up research, the assay was used to screen for new MTAs, and two azaindole derivatives were identified, which inhibited microtubule dynamics and were also found to be effective inhibitors of angiogenesis and tumor growth in vitro and in vivo. 31 Another immunofluorescence assay for the quantification of α tubulin intensity was used to screen for cellular responses to paclitaxel following siRNA treatment. 13 More recently, a multiplex immunofluorescence assay that stains α tubulin has been shown to distinguish between stabilizing and destabilizing MTAs, and this could be expanded to monitor physiological responses and associated cellular phenotypes. 14
In contrast to immunofluorescence, assays based on recombinant fluorescent tubulin fusion such as GFP-tubulin 7 require transfection of cells but do not require washing steps and are suitable to live cell imaging. An elegant assay format has been described based on an EB3-EGFP fusion protein, which was introduced into HeLa cells to mark the plus ends of microtubules. The authors analyzed time-lapse images with particle-trafficking software to measure microtubule dynamics and used RNAi screening to identify new genes involved in the regulation of mitotic spindle formation. 32
Staining methods independent of genetic modifications or immunofluorescence are, for example, microinjections of rhodamine-labeled tubulin, 7 which, because of sophisticated tubulin purification and labeling as well as individual cell treatments for the injection process, are hardly suitable for the throughput required for screening purposes. Alternatively, tubulin filaments can be stained with paclitaxel-based probes such as TubulinTracker Green (commercialized by Thermo Fisher), which is optimized for live cell imaging. However, the manufacturer’s instructions indicate that three washing steps are required and that samples should be imaged immediately after staining, because staining intensity will diminish with time. So although useful for a relative small number of samples, this staining is in our opinion less suitable for high-throughput applications. Another dye suitable for live cell tubulin imaging is SiR-tubulin (available from Cytoskeleton, Inc.), which is based on a silicon-rhodamine (SiR) derivative fluorophore coupled to docetaxel as the microtubules’ binding moiety. Although the cytotoxicity of docetaxel was reduced after derivatization, 33 the dye remains based on a MTA. Thus, using SiR-tubulin or the paclitaxel-based probes for screening new MTA structures might affect the number of potential hits as the compounds and the docetaxel- or paclitaxel-based dye might compete at the tubulin-binding site.
Compared with current tubulin staining and screening methods, the new SNAP-tubulin approach proposed here offers several advantages. In comparison to immunofluorescence, our SNAP-tubulin assay reduces the number of pipetting steps because we can introduce the fluorescent dyes during the seeding protocol and do not need to fix the cells before readout, increasing the assay throughput. In comparison to direct staining methods based on fluorescent derivatives of tubulin drugs, such as fluorescent taxane derivatives, the SNAP-tubulin assay does not interfere with the binding site on tubulin of these drugs and is therefore better suited for the selection of potential drug candidates.
The comparison between our SNAP-tubulin approach and fluorescent protein fusions to tubulin is more subtle because the two methods are conceptually similar. Both technologies require transfection of the cells, but tubulin-fluorescent protein fusions can be directly inspected whereas the SNAP-tubulin requires staining with a permeable SNAP-tag–specific dye before being imaged. However, this useful feature of the SNAP-tag technology offers the possibility of specifically coupling selected fluorophores with desirable characteristics to tubulin subunits, making the assay flexible. For instance, the TMR-Star dye used in our assay has brightness and fluorescence stability that outperforms standard fluorescence proteins. Although tubulin-fluorescent protein fusions do not require washing steps, our assay setup labels the SNAP-tubulin 24 h before imaging, and the amount of dye is adjusted to the cell density. Because of the turnover of tubulin, the intracellular background of unincorporated tubulin subunits is reduced in the prestained SNAP-tubulin cells. This significantly increases the optical features of the cells for image analysis, especially if microtubule dynamics are measured by texture features. Furthermore, the prestaining adopted in our protocol eliminates the need for washing steps, which is an important requisite for using the assay within an industrial screening setup. The SNAP-tag technology also provides a flexible tool for multiplexing. In fact, a panel of SNAP-tag–reactive fluorophores with different fluorescence excitation and emission properties is available and can be selected with each experiment, especially when other fluorescent-labeled targets are concomitantly imaged within the same cells. However, several fluorescent reporter proteins encompassing a large range of excitation and emission wavelengths have been recently engineered. These fluorescent proteins are nowadays regarded as very valuable tools in cell biology, because their recombinant coexpression within the same cells allows for the simultaneous analysis of different subcellular targets. Similarly, the SNAP-tag technology can be complemented by the coexpression of CLIP-Tag (New England Biolabs) and HaloTag (Promega, Mannheim, Germany) fusion proteins, which can be labeled by tag-specific fluorescent dyes that do not cross-react with the SNAP-tag. As observed with the SNAP-tubulin fusion of our assay, the SNAP-tag and related technologies offer the possibility to adjust the concentration of the fluorescent tag-reactive dyes to the cell number for each of the transfected tags independently. Thus, despite the constitutive expression of the recombinant tag fusion proteins, because of the turnover of the labeled proteins, the unincorporated fluorescent dye can be depleted within the cells, thereby reducing the background signal. This cannot be directly achieved by cotransfection of conventional fluorescent protein fusions, because the fluorescence intensity of the recombinant proteins depends on the promoter activity, which is difficult to control, especially for constitutive promoters.
Finally, compared with fluorescent proteins, the labeled SNAP-tags retain their fluorescence also after fixation with, for example, denaturing fixative agents, such as methanol. Thus, cell fixation with several fixative agents and time-lapse live cell imaging offer the opportunity to exploit the SNAP-tubulin assay also with a diverse array of techniques for hit confirmation or target validation.
Similar to recombinant fluorescent tubulin fusions, the new SNAP-tubulin assay depends on the transfection of cell lines that may alter the susceptibility of cells toward MTAs. We therefore compared A549 cells transfected with SNAP-TubA or SNAP-TubB3 to nontransfected wild-type cells. Immunofluorescence staining of microtubules following treatment with paclitaxel or nocodazole did not reveal any differences from wild-type cells (
In conclusion, we have developed a new SNAP-tubulin assay that facilitates screening for new MTAs due to minimal pipetting requirements and simple image acquisition and analysis procedures, which are particularly suitable for HCS applications. We have provided proof of concept for the assay by detecting changes in microtubule dynamics, cell cycle progression, and the formation of microtubule spindles. The flexibility of our assay is based not only on the SNAP-tag staining but also on the magnification and the time scale of image acquisition, both of which can be individually adapted and refined. The combination of short- and long-term analysis methods might achieve the best MTA screening results in our assay, because different effects are revealed by each method. Depending on the library size, one could envisage using our assay by following two approaches: a primary screen at low magnification for detection of the round cell phenotype followed by confirmation screens at high magnification and a dual screen for short- and long-term effects at high magnification, which could be carried out in the same microtiter plate at different time points.
Footnotes
Acknowledgements
We thank Dr. Richard M. Twyman for critical revision of the article.
Supplementary material is available online with this article.
Declaration of Conflicting Interests
The authors declared no potential conflicts of interest with respect to the research, authorship, and/or publication of this article.
Funding
The authors disclosed receipt of the following financial support for the research, authorship, and/or publication of this article: N.B. was partially financed through the project No. 13N11827 sponsored by the German Federal Ministry of Education and Research (BMBF).
References
Supplementary Material
Please find the following supplemental material available below.
For Open Access articles published under a Creative Commons License, all supplemental material carries the same license as the article it is associated with.
For non-Open Access articles published, all supplemental material carries a non-exclusive license, and permission requests for re-use of supplemental material or any part of supplemental material shall be sent directly to the copyright owner as specified in the copyright notice associated with the article.