
Abstract
Parkinson disease (PD) is a prevalent neurodegenerative disease characterized by selective degeneration of dopaminergic neurons in the substantia nigra, causing tremor and motor impairment. Parkin protein, whose mutants are the cause of Parkinson disease type 2 (PARK2), has been mechanistically linked to the regulation of apoptosis and the turnover of damaged mitochondria. Several studies have implicated aberrant mitochondria as a key contributor to the development of PD. In the attempt to discover new drugs, high-content cell-based assays are becoming more important to mimic the nature of biological processes and their diversifications in diseases and will be essential for lead identification and the optimization of therapeutic candidates. We have developed a novel fluorescence cell-based assay for high-content screening to find compounds that can promote the mitochondrial localization of Parkin without severe mitochondrial damage induction. In this work, this model was used to screen a library of 1280 compounds. After the screening campaign, the positive compounds were chosen for further testing, based on the strength of the initial response and lack of cytotoxicity. These results indicated that this Parkin cell-based assay is a robust (Z′ > 0.5) and valid strategy to test potential candidates for preclinical studies.
Introduction
Parkinson disease (PD) is a common neurodegenerative disorder affecting about 0.4% of the population between the ages of 60 and 74 years, about 1% between the ages of 70 and 79 years, and about 2% in those older than 80 years. 1 It is the second most common neurodegenerative disorder and clinically is characterized by motoric deficits including slowness of movement, rigidity, tremor, and postural instability, 2 which ultimately result in near-total immobility. The principal neuropathology is the loss of midbrain dopaminergic neurons in the substantia nigra, which results in a severe lack of striatal dopamine. 3
While most PD cases are sporadic, the familial forms can provide exceptional insight into disease processes. Parkin is the most causative gene of familial Parkinson disease (FPD) by mutations in the PARK2 gene on chromosome 6q25.2–27 and is abundantly expressed in brain and other tissues. 4 Parkin protein is composed of 465 amino acids and has a molecular mass of 51.65 kDa. It contains various domains such as the ubiquitin-like domain, a linker domain, three ring domains (R0, R1, and R2), and in between ring fingers (IBR) domain between R1 and R2. Ring domains coordinate two zinc atoms each, and two other zinc atoms are found in the IBR domain. 5 It is part of the E3 ubiquitin ligase complex that mediates the targeting of proteins for degradation, and its function involves the transfer of ubiquitin from conjugating enzyme E2 to substrates. Ubiquitination of these substrates leads predominantly to their proteosomal degradation. 6 Loss-of-function Parkin mutations, and therefore loss of ubiquitination of proteins, have been related to neurodegeneration in humans. In patients harboring Parkin mutations, a selective loss of dopaminergic neurons in the substantia nigra has been observed. 7
The ubiquitin-proteasome system, in which Parkin is involved, is fundamental to several different cellular events, and its malfunction is thought to be a responsible key to the pathogenesis of neurodegenerative diseases such as Alzheimer disease (AD), PD, or amyotrophic lateral sclerosis (ALS). The regulation of targets involved in this pathway has been a tricky area for drug discovery and drug development, basically because of a lack of good robust and functional assays for screening. 8 Parkin, as an E3 ubiquitin ligase, forms part of the mitochondria quality control pathway that identifies dysfunctional mitochondria and promotes their degradation via autophagy. 9 This specialized form of lysosome-mediated degradation pathway is called mitophagy. In this pathway, Parkin is recruited to mitochondria and ubiquitinates its membrane proteins to induce autophagic elimination. Several lines of evidence also point to mitochondrial dysfunction as a central driver of PD pathogenesis. 10 Absence of functional Parkin is thought to result in aberrant ubiquitination and compromised mitochondrial integrity, leading to cell damage and neuronal dysfunction, contributing to the development of PD.
In damaged mitochondria, the protein PINK1 is imported to the outer mitochondrial membrane via its mitochondrial-targeting signal (MTS), and it remains associated with the TOM complex (translocase of the outer membrane). 11 The accumulation of PINK1 on the outer mitochondrial membrane and the loss of mitochondrial membrane potential (ΔΨm) result in the recruitment of Parkin from the cytosol and activate its ubiquitin ligase activity. 12 Parkin ubiquitinates outer membrane proteins preferentially on which PINK1 has accumulated, notably the mitofusins and Miro. 13 Ubiquitination of outer mitochondrial membrane proteins by Parkin leads to their degradation by the proteasome or the removal of the damaged mitochondria by autophagy. 14
It is known that some compounds that affect mitochondria stability and function are related to PD. The inhibitors of the mitochondrial respiratory chain enzyme complex I, MPTP and rotenone, 15 are sufficient to induce parkinsonism. The mitochondrial proton gradient uncoupler, carbonyl cyanide m-chlorophenyl hydrazone (CCCP), induces a loss of mitochondrial membrane potential (ΔΨm) and therefore promotes rapid recruitment of Parkin from the cytosol to the damaged mitochondrial outer membrane during the early stages of mitophagy.13,16 So, finding an agonist that promotes or stabilizes Parkin activity in mitochondria seems to be a useful strategy to fight PD.
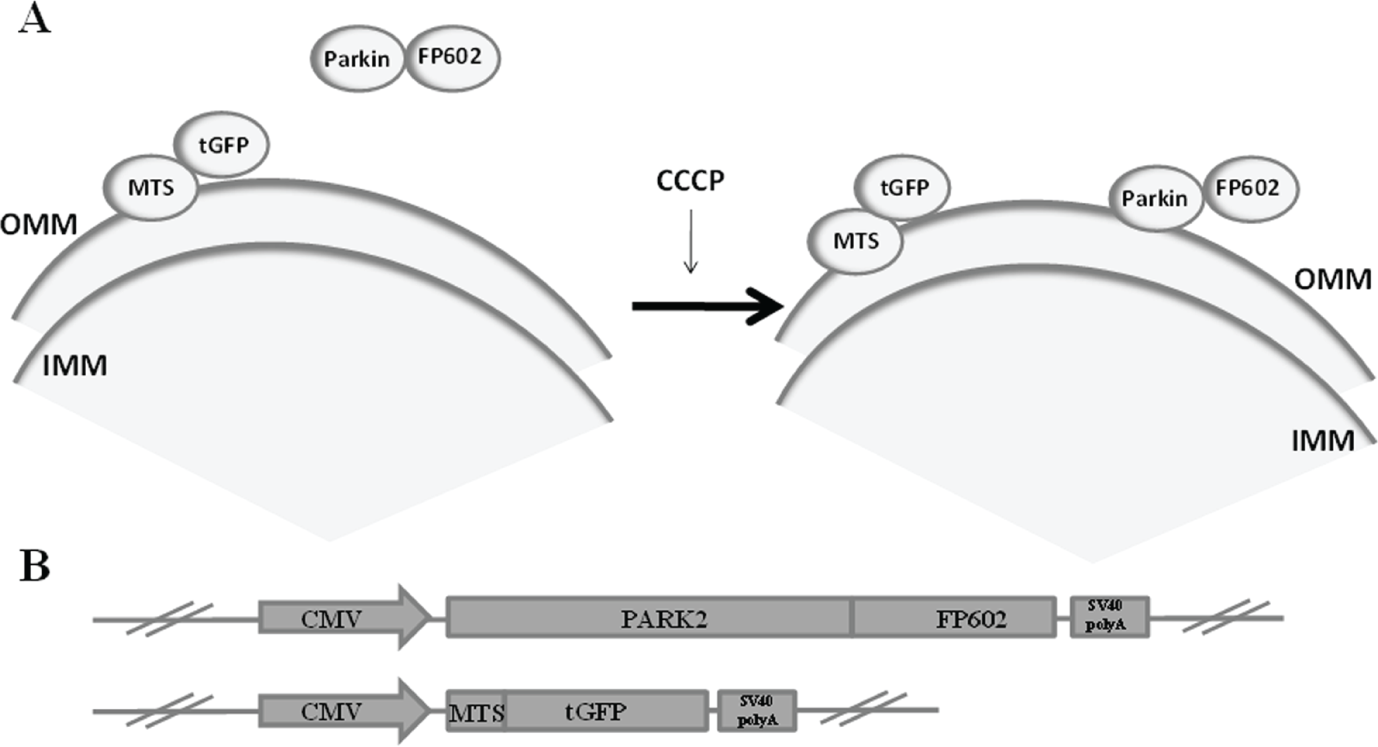
Previous high-throughput screening (HTS) experiments for small molecules binding to E3 ligases have used principally enzymatic activity assays. 17 Advancements in high-content screening (HCS) technologies have contributed to increasing efficiency in the drug discovery process. 18 In this work, the development of an image-based HCS method for compounds that promote the mitochondrial localization of Parkin without mitochondrial severe damage induction was performed. Using this HCS system, a chemical library of 1280 small molecules was screened to identify compounds that could produce this behavior in Parkin. The U2OS immortalized cell line that overexpressed at the same time fluorescently tagged Parkin and fluorescently labeled mitochondria was used to develop a reliable assay with automated image acquisition and analysis ( Fig. 1 ). This fluorescence-based assay is capable of detecting concentration-dependent effects of positive compounds and determined EC50 at the expected ranges. Therefore, this assay is useful for testing potential candidates for preclinical studies and facilitating the drug discovery process.
(
Materials and Methods
Cell Cultures
U2OS human bone osteosarcoma cell line (DSMZ, Braunschweig Germany), derived from ATCC (cat. HTB-96; ATCC, Manassas, VA), was grown in Dulbecco’s Modified Eagle’s Medium Nutrient Mixture F-12 HAM (Sigma-Aldrich, St. Louis, MO). SH-SY5Y human neuroblastoma cell line (DSMZ, Braunschweig Germany), derived from ATCC (cat. CRL-2266), was grown in RPMI-1640 medium (Sigma-Aldrich). Both cell lines were supplemented with 10% fetal bovine serum (Sigma-Aldrich), minimum essential medium (MEM) nonessential amino acids (Sigma-Aldrich), and gentamicin (Sigma-Aldrich) at 37 °C in a humidified atmosphere supplemented with 5% CO2. For the screening image analysis, cell lines were cultured into 96-well Imaging Plates (BD, Franklin Lakes, NJ) at a density of 10,000 cells/well.
Generation of a Stable Cell Line
PARK2-FP602 fusion protein was created by subsequent cloning of the FP602 red fluorescent protein (Evrogen, Moscow, Russia) and the human Parkin (PARK2) (Sino Biological, Beijing, China) complementary DNAs (cDNAs) into the puromycin-resistant pPURO vector designed in our lab, under the control of the cytomegalovirus (CMV) promoter. Prior to the Parkin cloning, the desired fragment was amplified with 5′-GCT AGC ATG ATA GTG TTT GTC AGG TTC-3′ (forward) and 5′-AAG CTT CAC GTC GAA CCA GTG GTC CCC-3′ (reverse) primers, synthesized by Sigma-Aldrich. On the other hand, MTS-tGFP fusion protein was also created by the cloning of the turboGFP (tGFP) green fluorescent protein cDNA (Evrogen) into the geneticin-resistant MTS (derived from the subunit VIII of human cytochrome C oxidase) expressing vector (Evrogen), under the CMV promoter as well. All the clonings were confirmed by DNA sequencing. Plasmids containing these constructs were transfected into U2OS cells using Lipofectamine LTX (Thermo Fisher Scientific, Waltham, MA), and double-positive transfected cells were selected using 500 µg/mL geneticin (Sigma-Aldrich) and 10 µg/mL puromicyn (Sigma-Aldrich). After generating green and red fluorescent–resistant clones with limit dilution, a 100% certified truly monoclonal cell line was obtained with the technology developed within the FP7 PASCA EU project where cells are handled and analyzed one by one. These cells constitutively express the fusion polypeptides Parkin-FP602 and MTS-tGFP.
Transient DNA Transfection
A SH-SY5Y cell line that stably expressed MTS-tGFP protein (generated in the above-mentioned way) was transiently transfected with PARK2-FP602 containing plasmid, using Lipofectamine LTX (Thermo Fisher Scientific). Verification of the transient expression was done 48 h after transfection by fluorescence microscopy.
Chemical Compounds
A chemical library consisting of 1280 compounds, sourced from the Prestwick Chemical Library (Illkirch, France), based on their chemical and pharmacological diversity and their bioavailability and safety in humans, was used for the screening. The reference compound CCCP was purchased from Sigma-Aldrich. All compounds from the library and CCCP were prepared in DMSO (Sigma-Aldrich).
Liquid Handling and Phenotype-Based Screening Assay
For dispensing of the liquid media containing cells and compounds, Hamilton’s (Reno, NV) Microlab Star automated liquid handling workstation was used. Human-tagged PARK2-FP602+MTS-tGFP stably expressing cells were treated with CCCP (positive control) at 5 µM for 3 h and library compounds at 10 µM for 24 h in Optimem medium (Thermo Fisher Scientific) before image acquisition. Redistribution of Parkin and its localization to mitochondria was quantified after treatment. Cellular viability was determined by counting nuclei.
Image Acquisition and Analysis
Plates were fixed with phosphate-buffered saline (PBS; Sigma-Aldrich) containing 3.7% formaldehyde (FA; Sigma-Aldrich) for 10 min at room temperature (RT) and permeabilized with 0.3% Triton-X100 (Sigma-Aldrich) in PBS for 3 min at RT, and cell nuclei were stained with DAPI (Sigma-Aldrich) for 5 min at RT. Fluorescent images were acquired in the Pathway 855 High-Content (BD) automated image platform with a ×20 dry objective. The change in the fluorescence pattern of cytosolic Parkin to granular mitochondria-recruited Parkin was processed and quantified using image analysis algorithms with the Attovision bioimaging software (BD) in 3 × 3 subfields of each well (500–1000 cells analyzed per well). DAPI, GFP, and rhodamine excitation and emission filters were used for image acquiring. Excitation and emission filters were 380/10 and 84101 for DAPI, respectively; 488/10 and FURA/FITC for GFP, respectively; and 548/20 and 570LP for rhodamine, respectively. Calculated cellular granularity and MTS localization were normalized as percentage of activity compared to the negative control (vehicle DMSO). Cellular viability was determined by counting nuclei (DAPI). Overlapping analysis was quantified with the Attovision bioimaging software (BD) using Manders’s colocalization coefficient M2, which represents the fraction of FP602 color channel in the FP602 and tGFP colocalized area. It is defined as
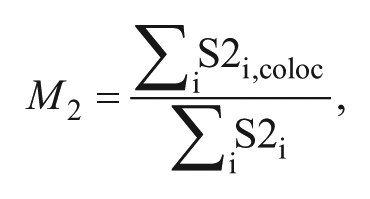
where S2i is the FP602 fluorescence intensity value in pixel i and S2i,coloc is the FP602 fluorescence intensity value that colocalizes with tGFP value (S1i) in pixel i. S2i,coloc = S2i if S1i > 0 and S2i,coloc = 0 if S1i = 0.
Mitochondrial Membrane Potential Assay
U2OS wild-type cells and MTS-tGFP–expressing U2OS cells were seeded at a density of 10,000 cells/well in a 96-well plate. The next day, half of the wells were treated with 5 µM CCCP, and 3 h later, cells were stained with 50 µM tetramethyl rhodamine methyl ester (TMRM) fluorescent probe (Anaspec, Fremont, CA) for 30 min at 37 °C, according to the manufacturer’s protocol. The excitation/emission filters used were 555/28 and 647/78, respectively. The TMRM fluorescence intensity was represented as mean ± SD among three replicate wells, and a p ≤ 0.05 calculated with one-way analysis of variance and Tukey post hoc test was considered statistically significant.
Autophagosome Detection Assay
PARK2-FP602 and MTS-tGFP–expressing U2OS cells were seeded at a density of 10,000 cells/well in a 96-well plate. The next day, half of the wells were treated with 5 µM CCCP, and 3 h later, cells were stained with 50 µM monodansylcadaverine fluorescent dye (Sigma-Aldrich) for 30 min at 37 °C, according to the manufacturer’s protocol. Excitation and emission filters for monodansylcadaverine visualization were 380/10 and 84101, respectively.
WST-8 Cell Viability Assay
Cell viability of positive compounds was evaluated by the Cell Counting Kit-8 (CCK-8; Sigma-Aldrich) based on the reduction of the colorimetric compound WST-8 by dehydrogenases in living cells, according to the manufacturer’s protocol. The absorbance at OD 450 nm of the reduced yellow-colored product was measured using a Synergy 2 plate reader (BioTek Instruments, Winooski, VT). The normalized absorbance was represented as mean ± SD among three replicate wells, and a p ≤ 0.05 calculated with one-way analysis of variance and Tukey post hoc test was considered statistically significant.
Positive Compound Confirmation by Dose-Response Curves
To confirm the activity in Parkin mitochondrial recruitment, one selected positive and nontoxic compound from the primary screen was tested in tetraplicate at a serial 1:3 dilution with identical assay conditions described for the HCS. Data generated from image analysis were plotted and analyzed using the nonlinear regression formula (log [compound] vs. response) in SigmaPlot (Systat Software, San Jose, CA) software. The EC50 value, defined as the effective concentration resulting in a 50% activity of Parkin mitochondrial recruitment, was used to evaluate compound activity. All values were expressed as mean ± SD. For estimation of the assay performance and robustness, Z′ values were calculated for Parkin recruitment assay.
Results and Discussion
Parkin Redistribution Assay
It is known that Parkin protein is involved in the mitochondrial fission/fusion system and is recruited to depolarized mitochondria to promote mitophagy,9,19 but the exact mechanism of mitochondrial pathogenesis associated with PD and Parkin protein in particular has not been totally elucidated. 20 An example could be the different effect in mitochondrial morphology of Parkin mutants when it is carried out in Drosophila or in mice.21,22 However, a malfunction of Parkin seems to be correlated with mitochondrial dysfunction in several studies.13,22 Mitochondria are dynamic and mobile organelles that suffer membrane remodeling through repeated cycles of fusion and fission and a regulated turnover via mitophagy. These processes help to maintain the optimal function of mitochondria. 3 Parkin appears to be involved in the entire spectrum of mitochondrial dynamics. To investigate the role of Parkin and mitochondria in PD, we performed a cell-based model that can facilitate future research in this field.
The Parkin mitochondrial recruitment image-based high-content assay presented in this work is based on a Parkin fluorescent fusion polypeptide that changes its localization from the cytosol to the outer mitochondrial membrane (OMM) when some specific compounds are added. The other fluorescent fusion polypeptide (MTS-tGFP) binds directly to OMM, and it is used to visualize mitochondrial integrity after compound addition ( Fig. 1 ). Several compounds promote Parkin recruitment, but stress and the toxicity increase generated by these compounds damage mitochondria in the cell. So a good, promising positive compound would be one that promotes Parkin binding to mitochondria to accelerate Parkin protective function but without deeply altering mitochondrial integrity.
To verify the viability of this model, Parkin-FP602 and MTS-tGFP distributions were observed first in the microscope after addition of vehicle (DMSO) and CCCP (at 5 µM for 3 h) ( Fig. 2A ). Negative control showed a homogeneous cytoplasmic distribution of Parkin-FP602 and a granular perinuclear MTS-tGFP pattern that mitochondria usually have. On the other hand, CCCP, at this concentration and incubation time, changes drastically Parkin distribution. CCCP is a proton gradient uncoupler that induces a loss of mitochondrial membrane potential; it damages mitochondria and, therefore, promotes Parkin recruitment to mitochondria. This effect of CCCP on mitochondria, described by other authors,16,23 can be seen in the change of MTS-tGFP fluorescence pattern, where mitochondria appear to be forming larger and more clustered granules.
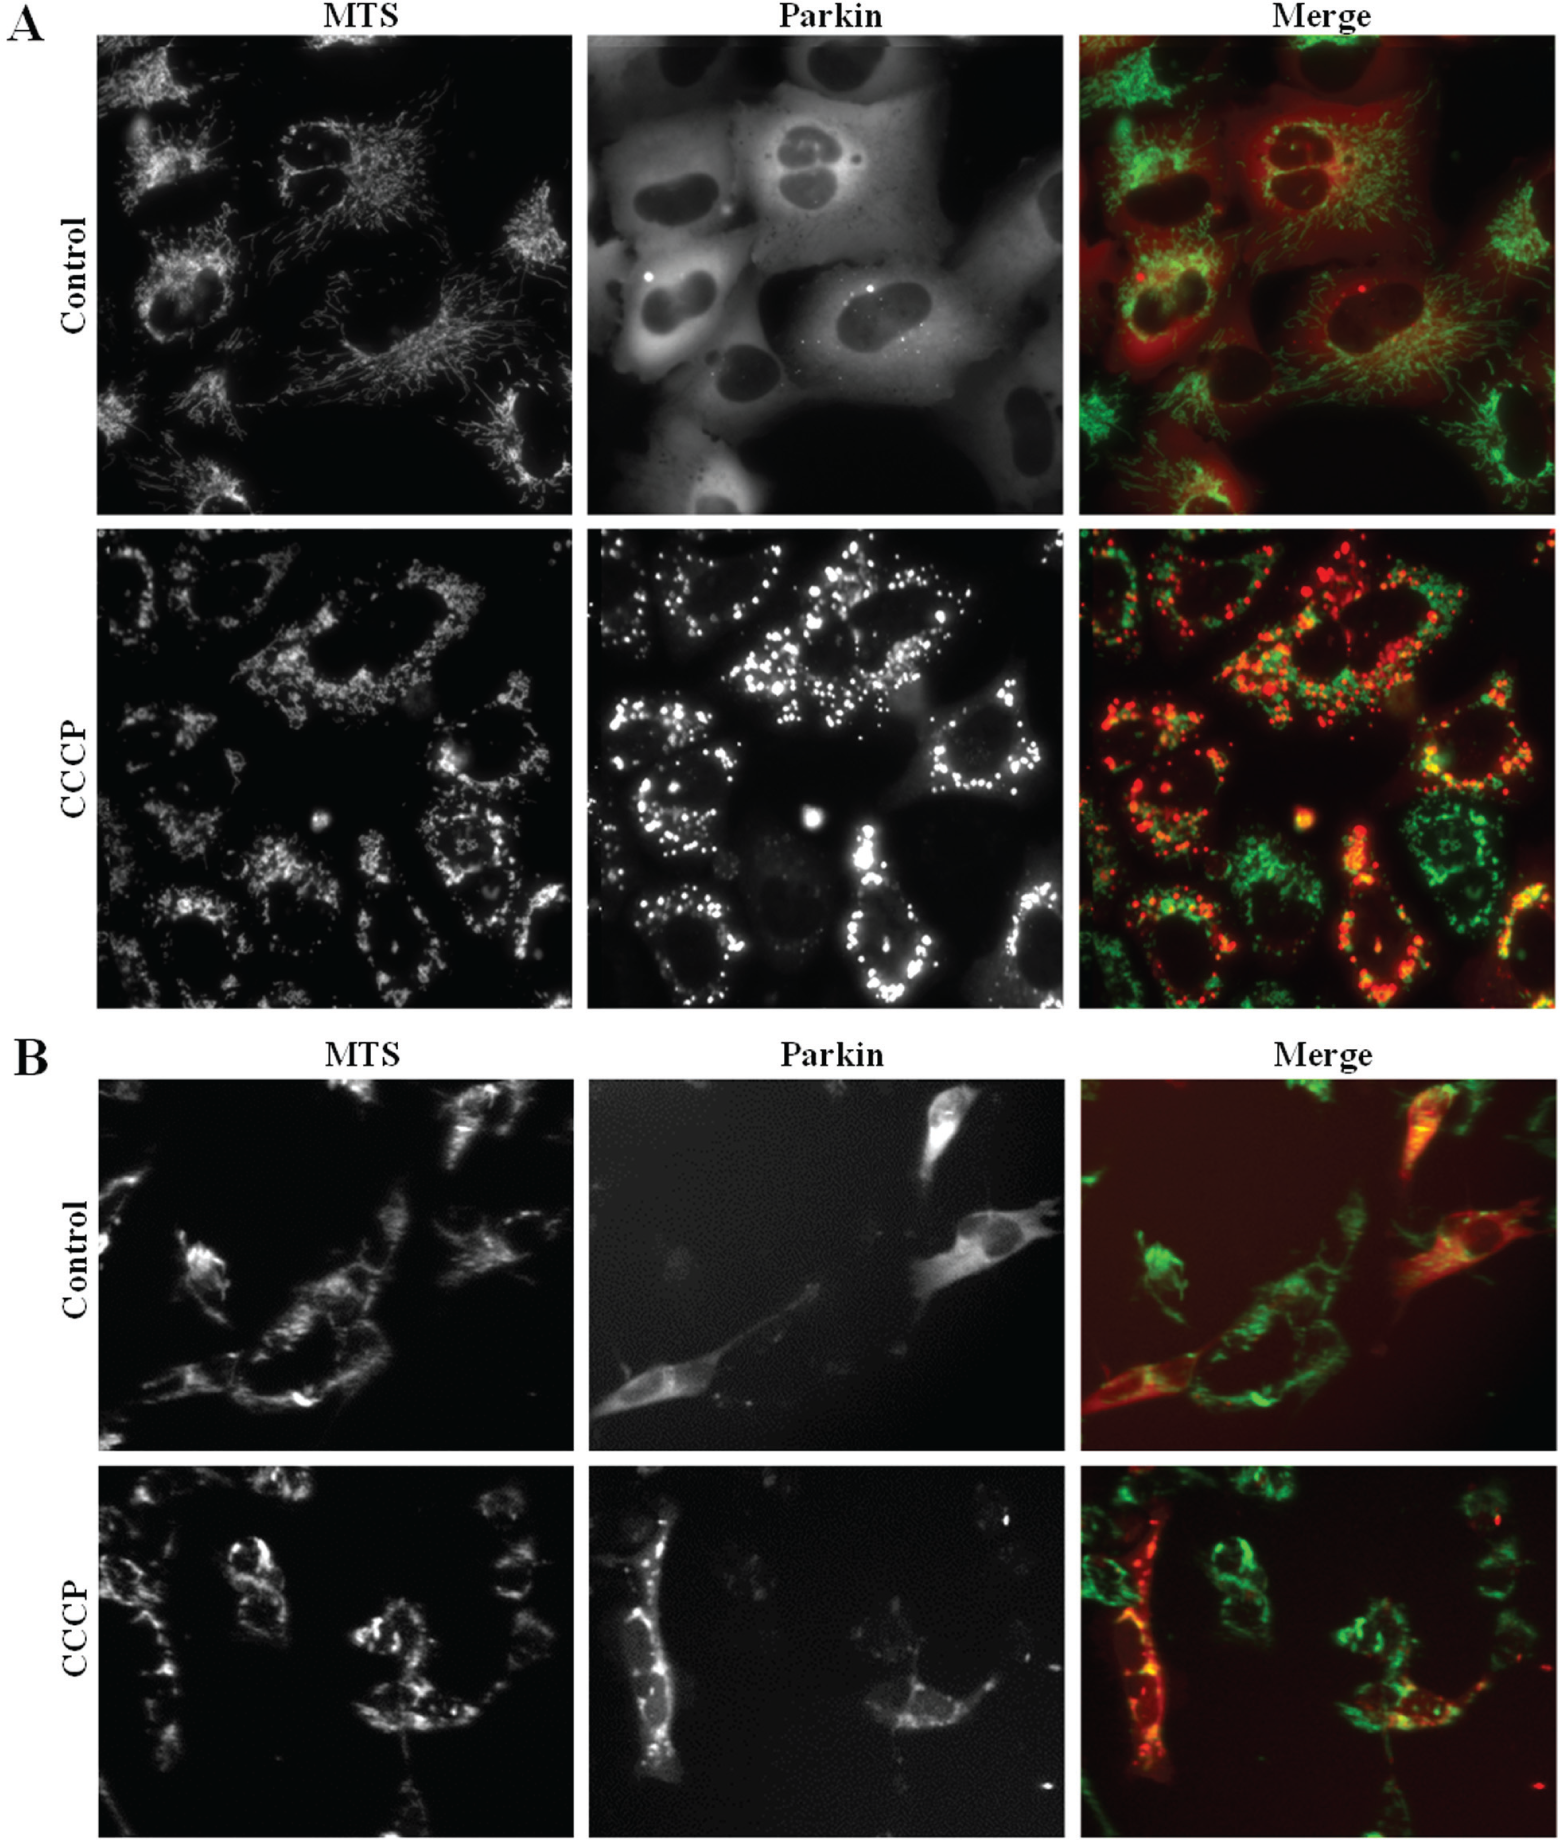
Cellular fluorescence redistribution after compound treatment. (
With the aim of validating the Parkin recruitment observed in U2OS cells, a transient transfection of Parkin-FP602 containing plasmid was carried out into MTS-tGFP stably expressing SH-SY5Y cells. SH-SY5Y is a human neuroblastoma cell line that resembles in many aspects primary neurons. Although it is frequently used in Parkin and mitochondria-related research studies, 24 it is not an appropriate cell line for conducting massive HCS assays due to their narrow morphology and their tendency to grow, forming dense clumps. Forty-eight hours after transfection, CCCP was added at 5 µM for 3 h, and an apparent Parkin translocation to mitochondria was observed, as seen in U2OS cells ( Fig. 2B ).
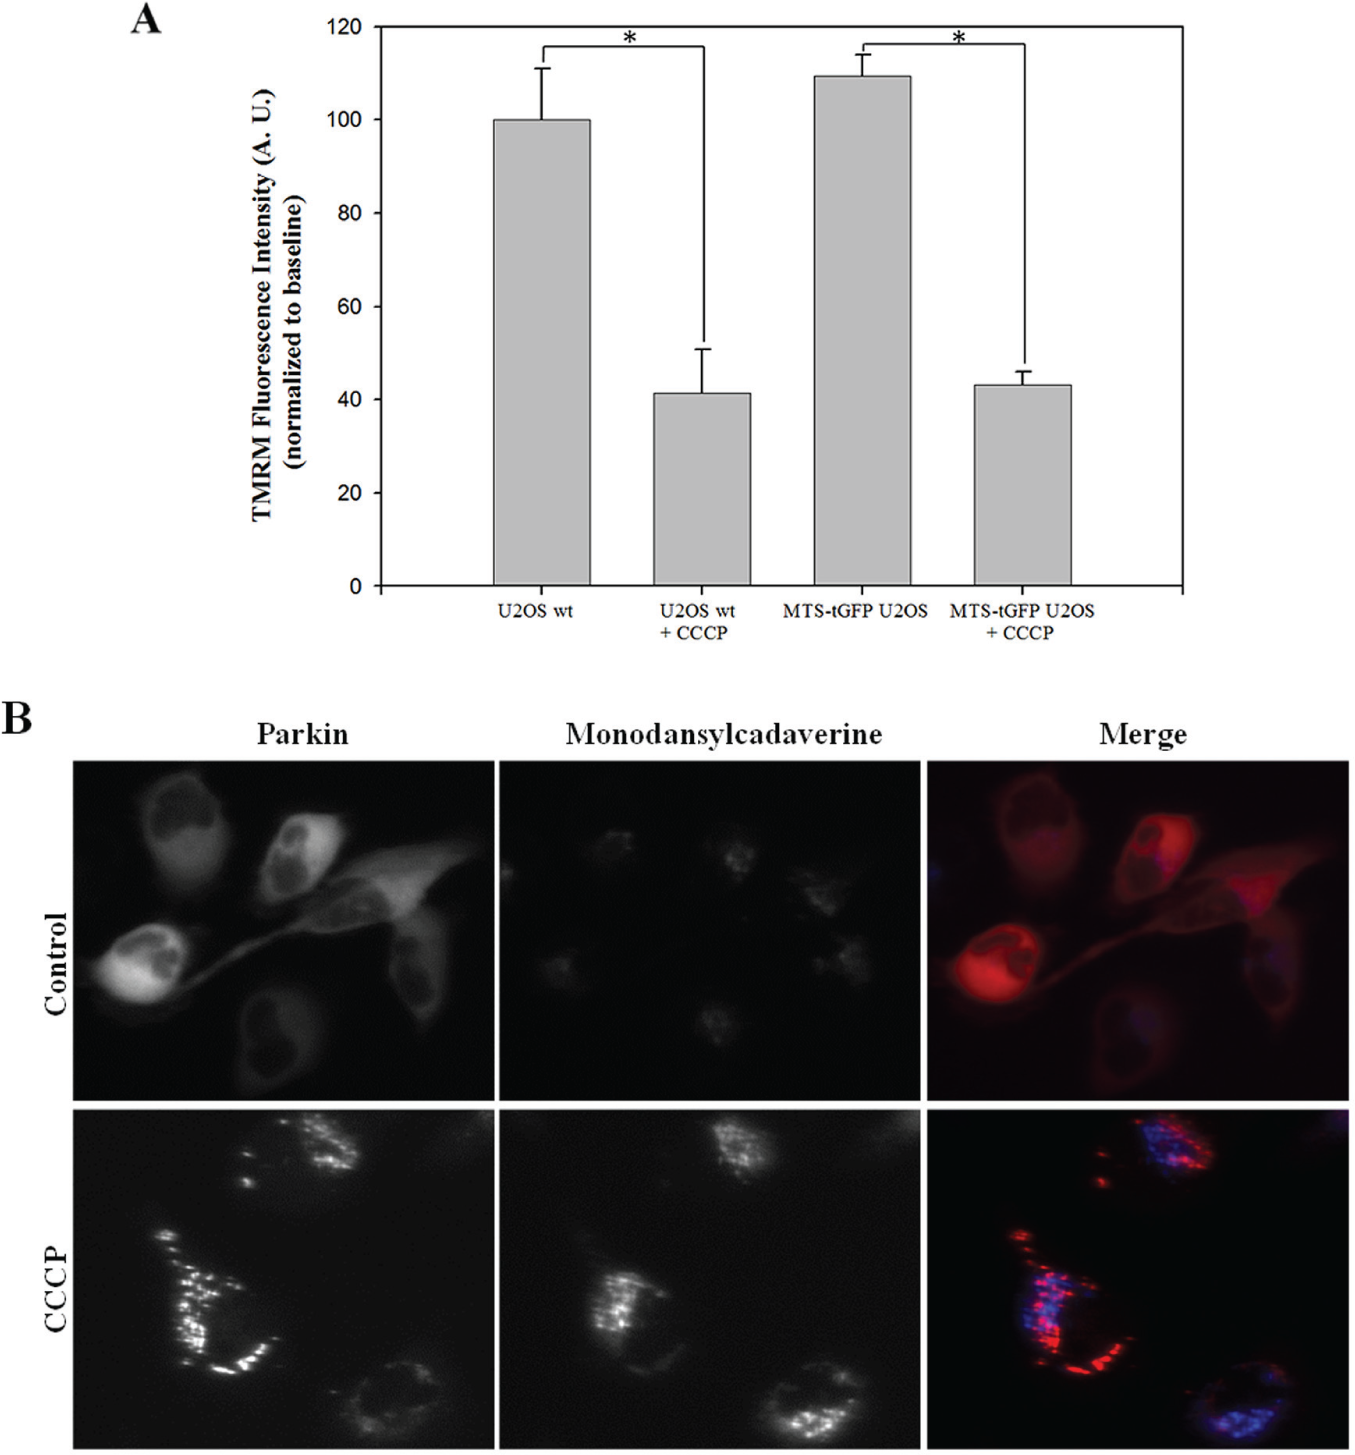
Because an overexpression of any MTS-fused protein bound to mitochondria can alter the functionality of these mitochondria, we tested mitochondria’s health in MTS-tGFP–expressing U2OS cells compared to the U2OS wild-type cell. The analysis of the mitochondrial membrane potential (ΔΨm) was performed using the fluorescent probe TMRM. TMRM is a cationic fluorescent dye that accumulates into the mitochondrial matrix, induced by the membrane potential. Upon loss of the mitochondrial membrane potential, TMRM accumulation ceases and the fluorescence decreases. As a positive control of mitochondrial damage, 5 µM CCCP was added for 3 h to both cell lines. The result of the assay shows that the overexpression of MTS-tGFP does not alter ΔΨm significantly, whereas the addition of CCCP decreases TMRM signal either in U2OS wild-type or in MTS-tGFP–overexpressing U2OS cell lines ( Fig. 3A ).
(
As seen in Figure 2A , the addition of 5 µM CCCP for 3 h leads to the formation of Parkin granules after Parkin translocation to mitochondria. To know if these granules correspond to Parkin recruitment or to endolysosomes as a consequence of autophagy, we added to the cells the autophagosome marker monodansylcadaverine and observed the overlap of Parkin-FP602 and the autophagosome dye. The fluorescence of monodansylcadaverine is enhanced when it interacts with lipid membranes contained in autophagosomes. We observed that most of the granules of Parkin did not overlap with autophagosomes ( Fig. 3B ), so we can assume that the autophagy process is not interfering with Parkin recruitment process at this treatment time.
The next step of the assay involved its miniaturization to the 96-well plate format. A seeding density of 10,000 recombinant U2OS cells per well was performed with a high number of cells but with enough spatial distribution in a monolayer for proper and accurate identification and segmentation by the Attovision software (BD). Automated data analysis is required to make the system practical for running large-scale assays. An initial screening of 1280 compounds, belonging to the Prestwick Chemical Library (Illkirch, France), was carried out on these cells at 10 µM for 24 h. The vehicle DMSO was used as a negative control, and CCCP (5 µM for 3 h) was used as a Parkin recruitment positive control. Those compounds with a positive Parkin mitochondrial mobilization activity over 1.5 with respect to the negative control were considered positive compounds. Usually, the threefold standard deviation (3 × SD) is used to define a threshold, but considering the size of the library, a 2 × SD (that corresponds to 1.5 activity with respect to control) was used as a cutoff to not lose any potential hits. Likewise, those compounds with cell viability under 60% with respect to control (corresponding to a 2 × SD of the negative control) were considered toxic and eliminated from the study. Under normal conditions, Parkin is distributed homogeneously in the cytoplasm, but after positive compound addition, Parkin moves to the mitochondria and presents a more dotted redistribution that was quantified by measuring fluorescence granularity ( Fig. 4 ). After this assay, eight compounds were selected to continue into subsequent experiments: colchicine, digitoxigenin, digoxin, thiostrepton, lanatoside C, azacytidine-5, digoxigenin, and proscillaridin A. This way, the hit rate of the assay was 0.62%.
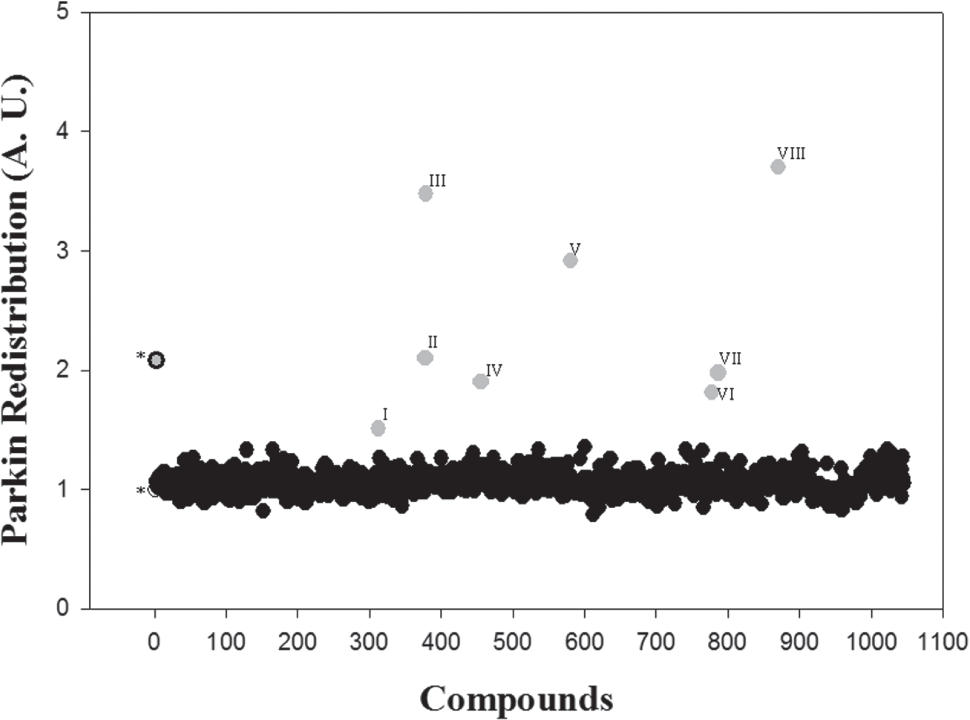
Representative data of Parkin redistribution screening. An initial screening of a 1280-compound library was performed. Negative control (DMSO) is represented in white, and positive control (carbonyl cyanide m-chlorophenyl hydrazone [CCCP], 5 µM) is represented in gray with a solid edge. Positive compounds (with an activity over 1.5 with respect to control) are represented in gray without an edge. Parkin redistribution was quantified by measuring fluorescence granularity with Attovision software. Positive compounds are I (colchicine), II (digitoxigenin), III (digoxin), IV (thiostrepton), V (lanatoside C), VI (azacytidine-5), VII (digoxigenin), and VIII (proscillaridin A).
Parkin and Mitochondria Overlapping Analysis
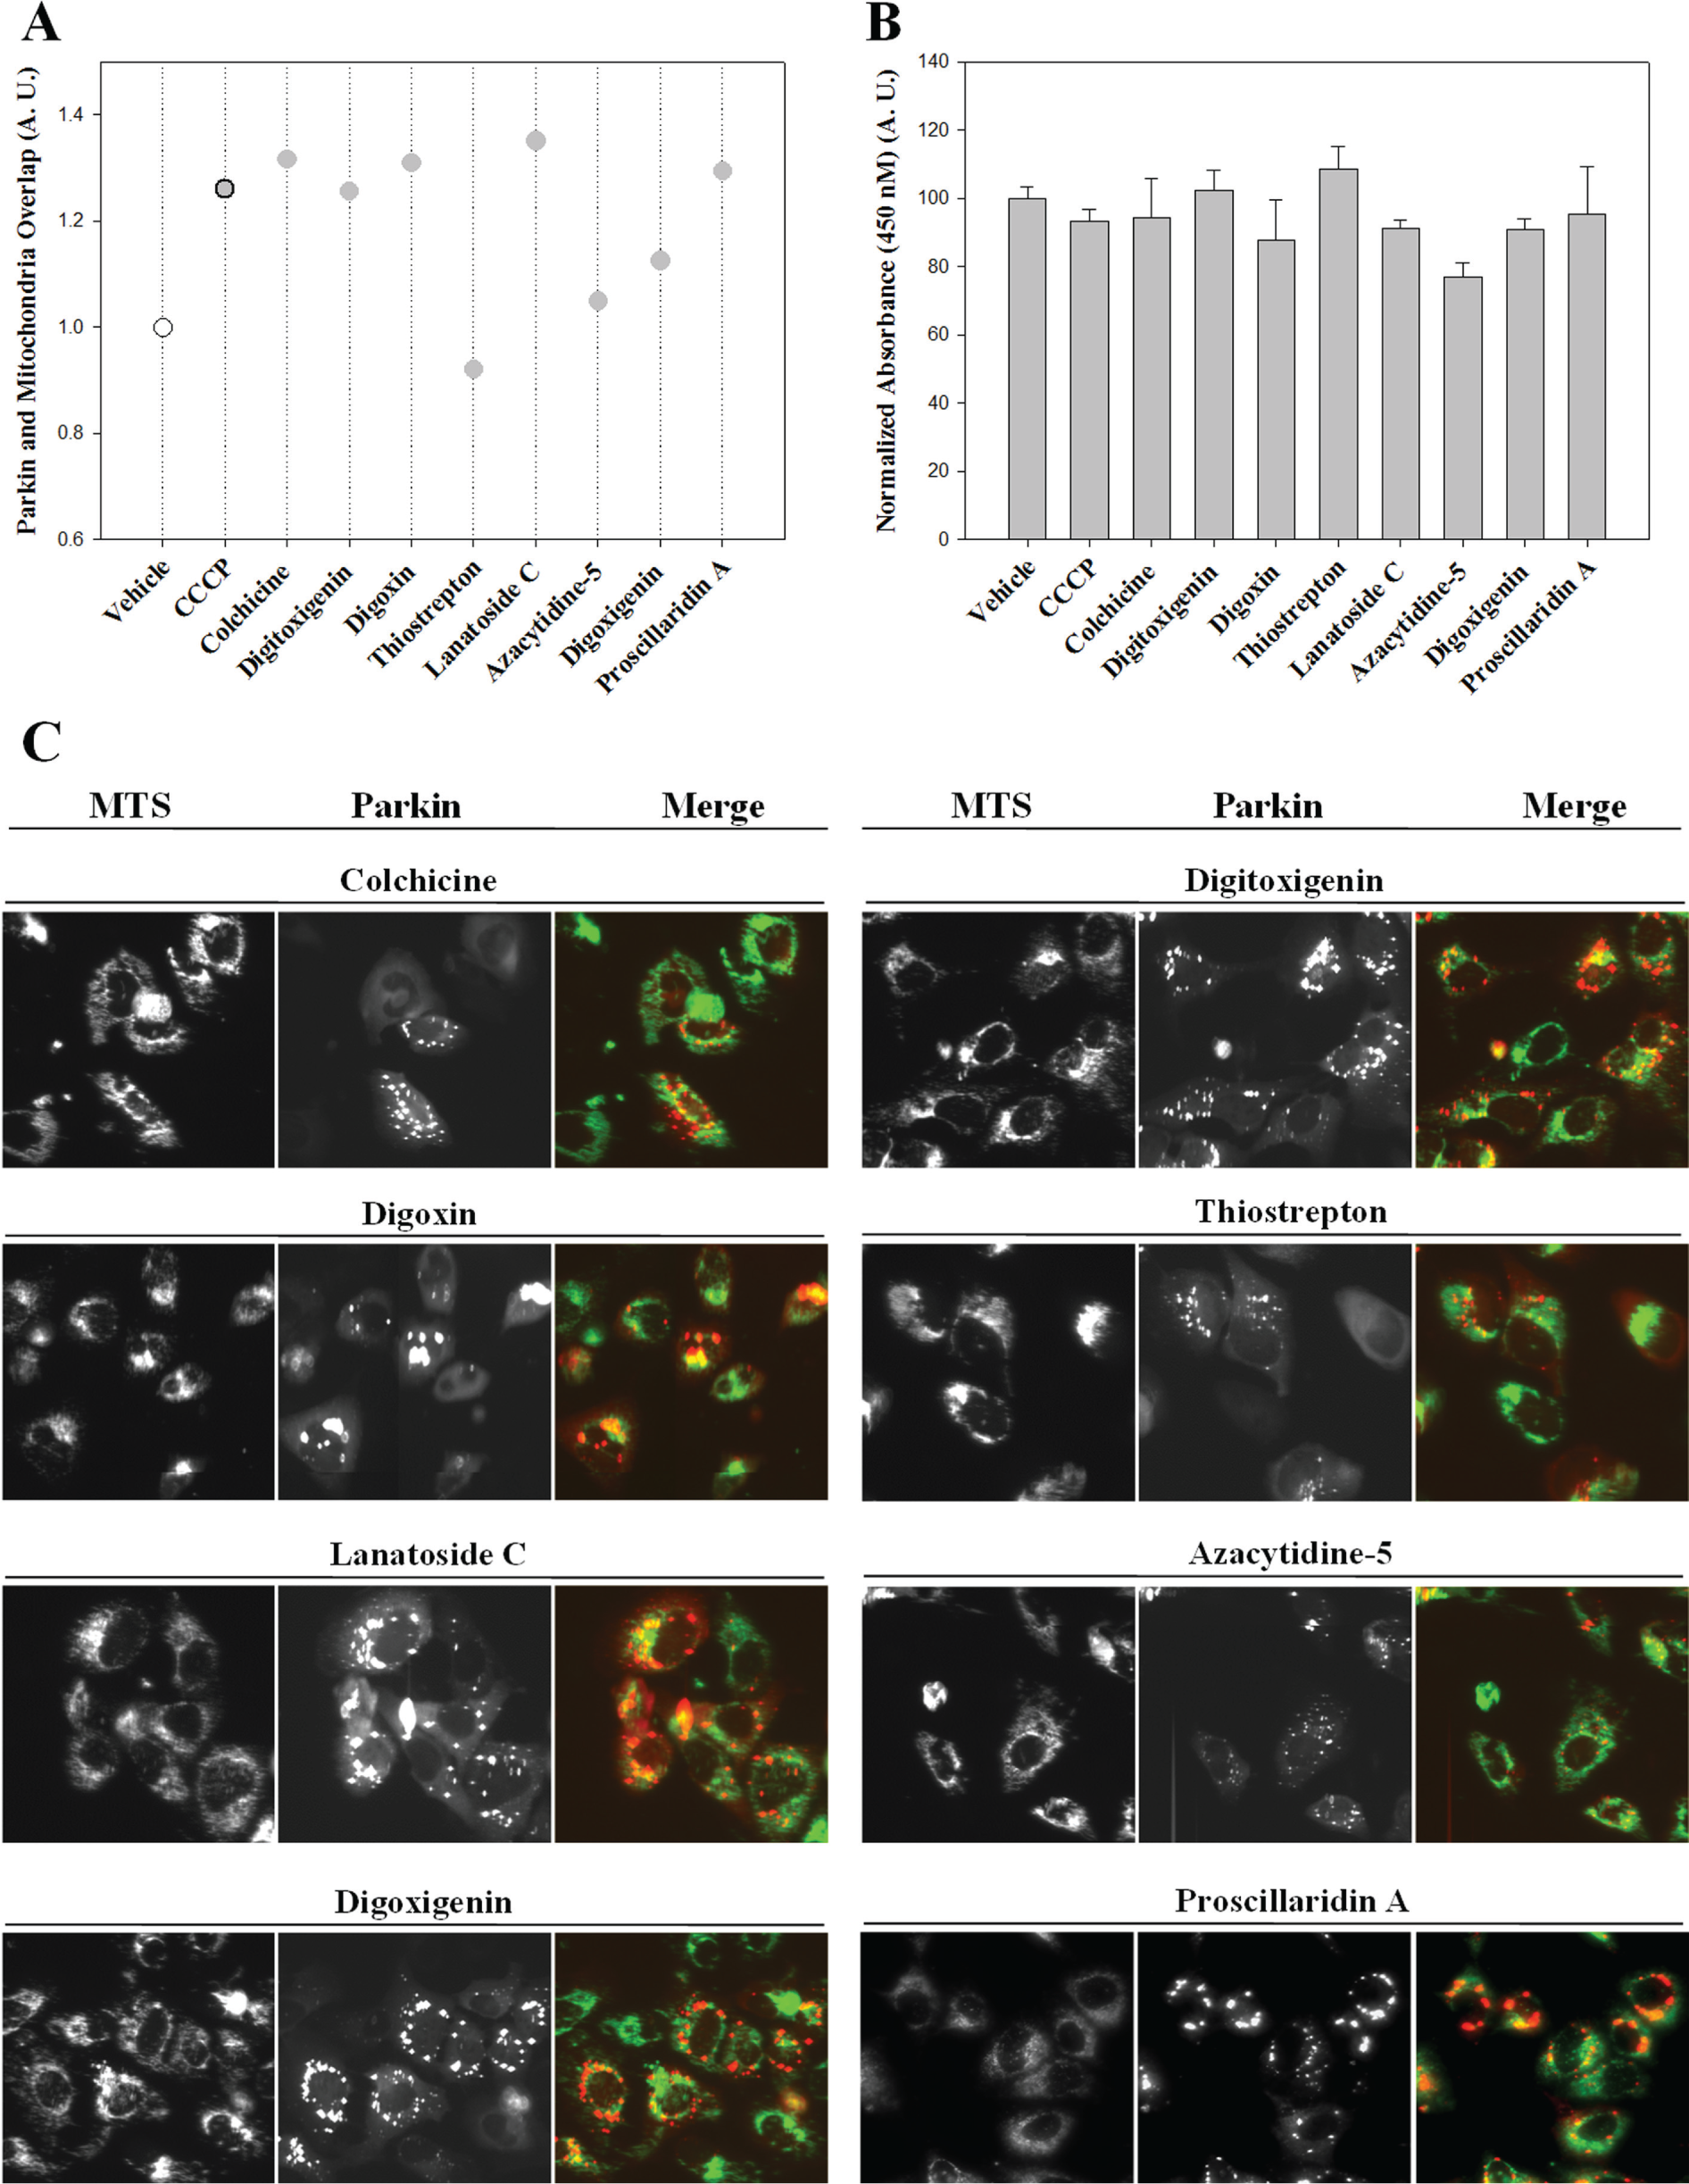
To confirm and validate the location of Parkin in mitochondria, an overlap analysis of Parkin-FP602 (red fluorescence) and MTS-tGFP (green fluorescence) was performed with the eight positive compounds. Both localizations were measured by the M2 coefficient ( Fig. 5A ). Afterward, the viability of the cells after the addition of these eight positive compounds was evaluated by a WST-8 assay ( Fig. 5B ). None of the compounds significantly decreased cell viability with respect to control. Images of the cells after addition of eight positive compounds are shown in Figure 5C .
(
Only the addition of the compound thiostrepton does not result in an increase in the overlap of both fluorescence patterns. It increased 1.91 times Parkin fluorescence granularity relative to control and decreased 1.08 times Parkin and MTS fluorescence overlap with respect to control. Thiostrepton is a thiazole antibiotic that inhibits the expression of the oncogenic transcription factor FOXM1 and, although its effect is related to mitochondria, 25 does not seem to specifically recruit Parkin to it.
The compound azacytidine-5 is an analogue of cytosine that inhibits DNA methyltransferase and, at high doses, promotes cell death. It increased 1.82 times Parkin fluorescence granularity relative to control and 1.05 times Parkin and MTS fluorescence overlap with respect to control. It is known that azacytidine can cause a dose-dependent loss of mitochondrial membrane potential prior to apoptosis, 26 between other toxic effects. In our experiment, we cannot conclude that Parkin recruitment after azacytidine-5 addition happened via mitochondria damage.
The compound colchicine inhibits microtubule polymerization and, therefore, increases cellular-free tubulin. This tubulin is capable of binding to mitochondria and, consequently, leads to partial mitochondrial depolarization. 27 Colchicine increased 1.51 times Parkin fluorescence granularity relative to control and 1.32 times Parkin and MTS fluorescence overlap with respect to control.
Digitoxigenin, digoxin, lanatoside C, digoxigenin, and proscillaridin A belong to the same type of cardiac glycosides and gave the highest results in granularity and overlapping analysis. Digitoxigenin and digoxigenin are not actually glycosides; they are the by-product or the precursor steroids of glycosides, 28 and the addition of these two compounds to U2OS cells gave lower values than the addition of pure glycosides. They increased 2.11 and 1.98 times Parkin fluorescence granularity relative to control and 1.26 and 1.13 times Parkin and MTS fluorescence overlap, respectively.
Digoxin, lanatoside C, and proscillaridin A increased, in turn, 3.48, 2.92, and 3.71 times Parkin fluorescence granularity and 1.31, 1.35, and 1.29 times Parkin and MTS fluorescence overlap, respectively. These types of glycosides increase intracellular calcium by the inhibition of membrane Na+ /K+-ATPase,28,29 and this calcium elevation can result in mitochondrial depolarization.29,30 Mutations in this Na+ /K+-ATPase are associated with a neurological disorder related to PD (rapid-onset dystonia Parkinsonism [RPD]), and some of the mutation not only functionally alters the protein but also interferes with its affinity for glycosides. 31 This enzyme catalyzes ATP-driven exchange of intracellular Na+ for extracellular K+ across the plasmatic membrane. The sodium ion gradient provides the driving force for the transport of other ions like Ca2+, H+, or phosphates so a change in intracellular Na+ may lead to secondary changes in Ca2+ via the Na+ /Ca2+ exchange system 28 and provoke, therefore, an increment in intracellular Ca2+ and a loss in mitochondrial membrane potential that could, finally, recruit Parkin to mitochondria.
The compound that gave better results measuring fluorescence granularity and fluorescence overlap was proscillaridin A. Other authors have observed a higher effect of proscillaridin A after addition to cells compared to other cardiac glycosides, and they suggest that belonging to the bufadienolide family could be a reason for this. 28 So we decided to continue our analysis with this compound as an example of the effect of the cardiac glycosides family on our model.
Dose-Response Curve of Parkin Redistribution
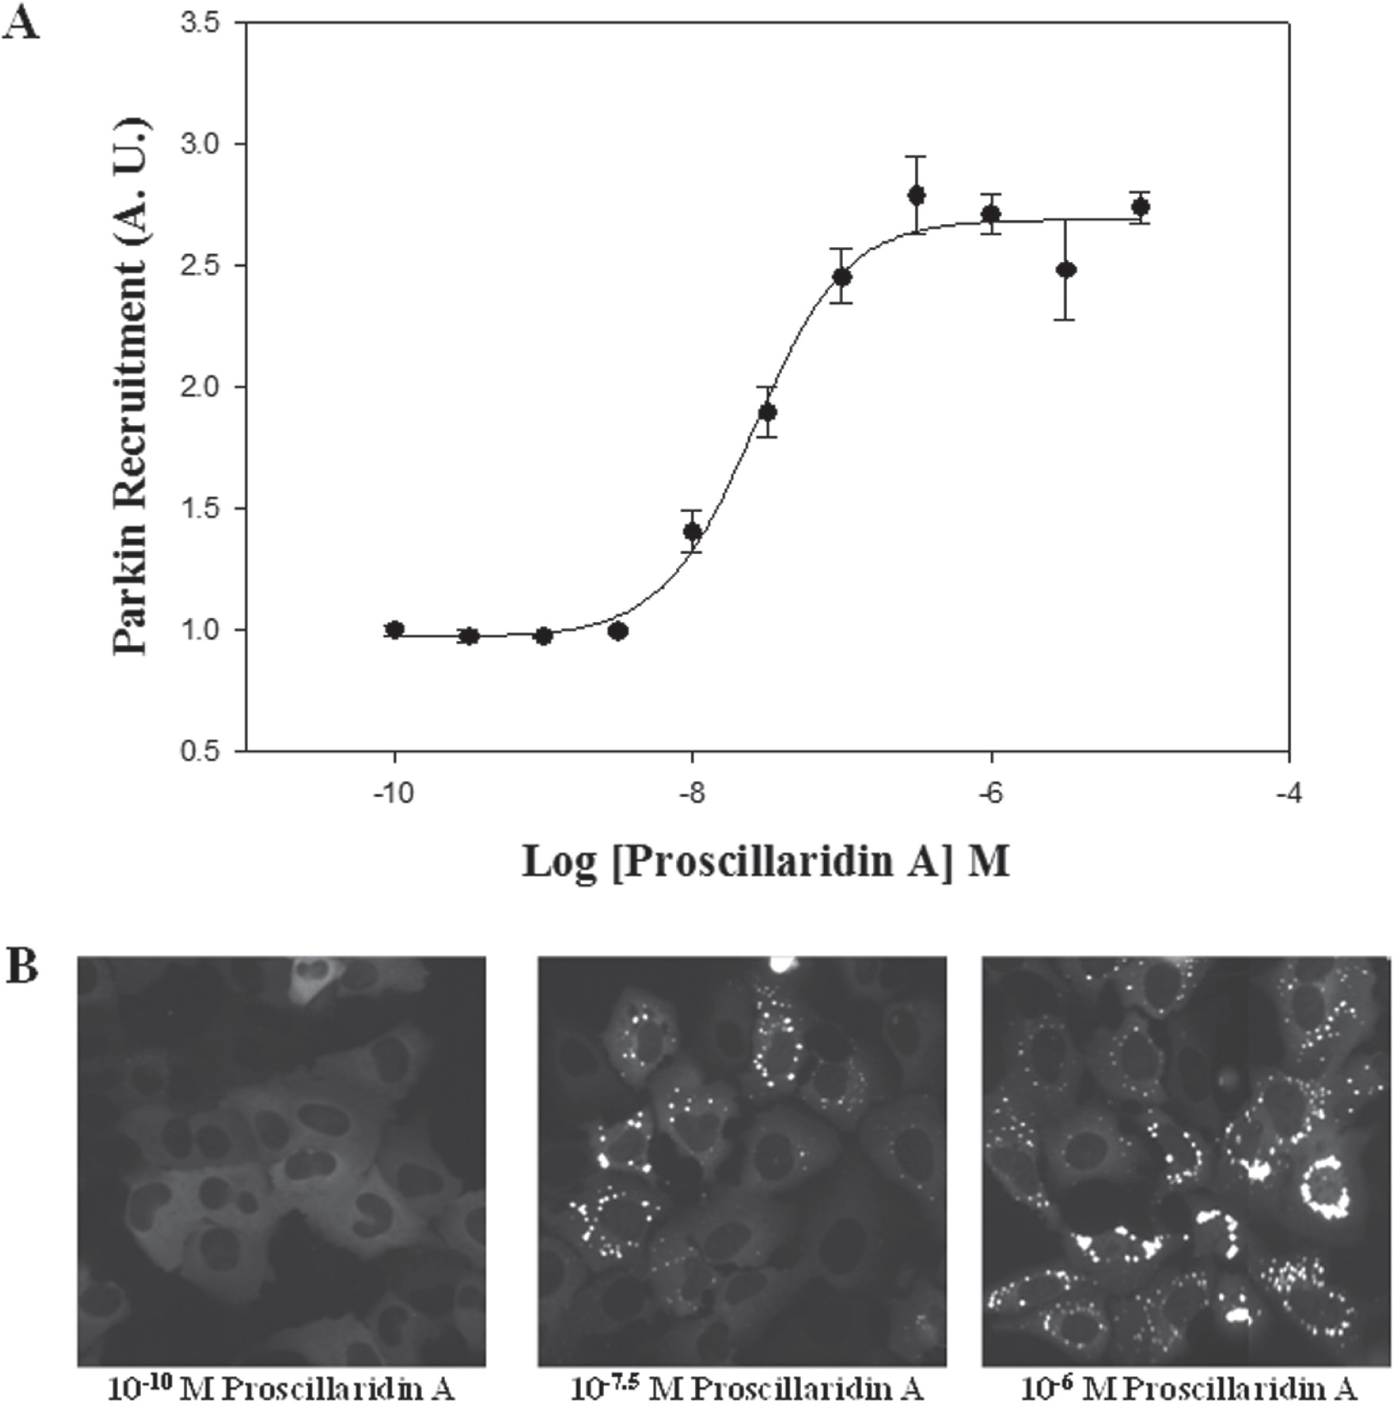
The robustness and reliability of the Parkin redistribution assay were measured by obtaining the Z′ factor of the proscillaridin A dose-response curve. Cells were treated with a range of concentrations comprising 11 dilution points spanning from 100 pM to 10 µM of the compound proscillaridin A during 24 h in a 96-well format ( Fig. 6 ). Error bars represent the standard deviation among four replicate wells. EC50 for proscillaridin A in this assay was 2.59 × 10⁻⁸ M. This value is in the range of usual physiological values for neuronal agonists. 32 The Z′ factor calculated for this assay was 0.85 ± 0.01. According to several authors, 33 a Z′ factor >0.5 indicates a statistically reliable separation between positive and negative controls.
(
Some authors suggest that there could be other adaptor proteins that are recruited to mitochondria as well, 13 and some compounds could affect the function of these adaptors. Proteins such as PINK1 or BAX can also be implicated in this effect. Further detailed analyses would be required to fully understand the mechanism underlying this action and the implications for PD. However, in our opinion, finding a compound that promotes Parkin redistribution to mitochondria without gravely damaging mitochondria can be a good strategy for fighting PD.
In summary, taking into account the data obtained, we can conclude that the work reported here describes the development of a high-content assay based on a phenotypic Parkin U2OS cell-based model that permits evaluating Parkin mitochondrial recruitment in living cells through the study of its location pattern in space and time. Further advantages of this assay are the short response time of 24 h, the straightforward experimental one-step procedure after compound addition, the compatibility with the 96/384-well format, and the reliable separation of positive and negative controls. The assay precision is also sufficient for screening of compounds 34 and can potentially allow early determination of their suitability for drug development. 35 Since modifying abnormal mitochondrial dynamics is becoming a target for the treatment of neurodegenerative diseases, these previously mentioned attributes make this assay attractive for being applied in a robust and reproducible way for the screening of compound libraries that promote mitochondrial Parkin localization in multiple high-content bioimaging platforms and therefore facilitate the search of possible candidates against PD.
Footnotes
Acknowledgements
We thank Eva Ferrández, Julen Herrero, and Gonzalo Saracibar for their technical support.
Declaration of Conflicting Interests
The authors declared no potential conflicts of interest with respect to the research, authorship, and/or publication of this article.
Funding
The authors received no financial support for the research, authorship, and/or publication of this article.