
Abstract
Many emerging dyeing technologies have recently entered laboratory research or industrial production phases. However, only a few studies have evaluated and compared the environmental impact of different dyeing systems. This study calculated the carbon footprint of low-pressure anhydrous dyeing for polyester and compared with conventional water bath dyeing. The results showed that the carbon footprint of the anhydrous dyeing process was 1670 kgCO2 eq/1000 kg polyester. Steam occupied the most significant proportion, accounting for 55.5%, followed by electricity at 35.5%. The waste has the lowest environmental impact, with 0.55%. Uncertainty analyses showed that the data and results in this article were reliable. The results of the sensitivity analyses indicated that more attention should be paid to the data quality of steam and electricity. Compared with the traditional water bath dyeing process, the low-pressure anhydrous dyeing system can reduce greenhouse gas emissions by more than 30% and, more importantly, can avoid almost all the consumption of clean water. This anhydrous dyeing system can save water and reduce carbon emissions, which is of positive significance to the sustainable development of the textile and fashion industry. Further studies could use the water footprint as an indicator to evaluate this dyeing system in terms of water consumption and potential environmental impact.
Keywords
Introduction
The textile industry is one of the largest polluters in the world, and dyeing is one of the most polluting processes in the textile industry and value chain. 1 Meanwhile, polyester (PET) is the most frequently used fabric in the textile industry. 2 According to statistics, PET fibers account for about 50% of the fibers market, and that share is expected to continue to grow in the next few years. 3 The carbon emissions of the production process of PET textiles from cradle to gate are shown in Figure 1(a). The dyeing and finishing process is the most significant contributor to its cradle-to-gate greenhouse gas (GHG) emissions, accounting for 60%. 4 While emitting a lot of waste and salt, this dyeing process also consumes a lot of water, energy, and chemicals, which has a poor environmental impact. In addition, approximately 30–50 l of fresh water are required for dyeing 1 kg of PET textile under the traditional technology system.5–7 Most PET fibers need to be dyed depending on the consumer’s demand. Owing to our dependence on PET textiles for coordination with the latest fashions, there is no doubt that severe environmental problems result from dyeing and finishing and the disposal of PET textiles.4,8–10 Green manufacturing, clean production, and green sustainable development of the whole process are urgent goals for the textile and apparel dyeing industry.
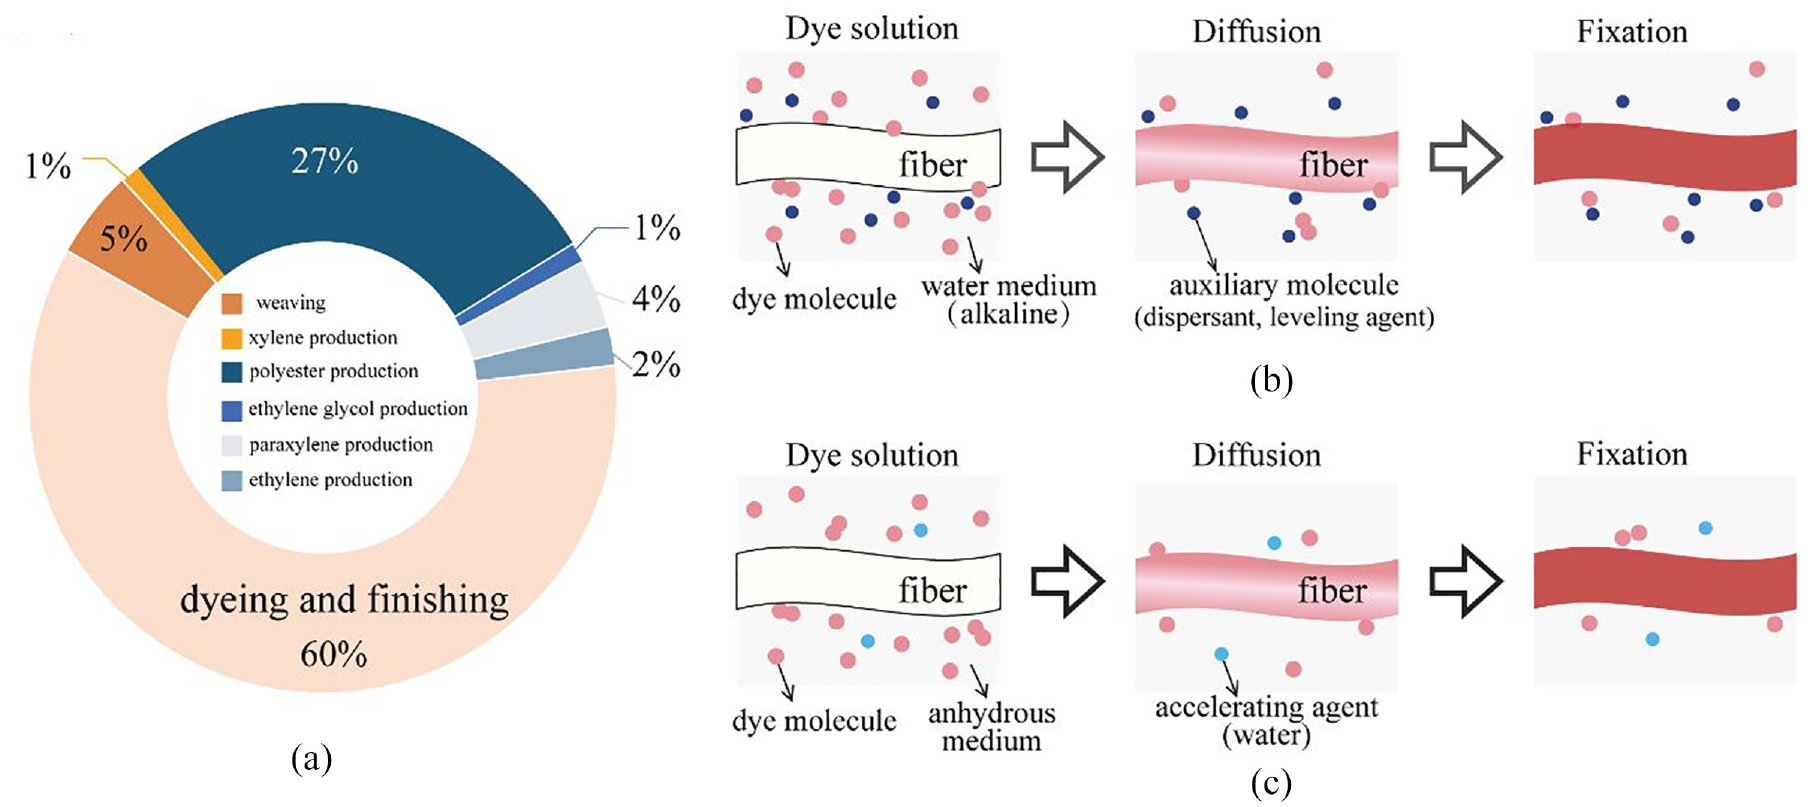
(a) Carbon emissions of polyester filament production process. (b) The principle model of traditional water bath dyeing. (c) The principle model of low-pressure anhydrous dyeing of polyester.
The most widely used dyeing technique is still the traditional water bath dyeing method. Since dispersed dyes are insoluble in water, adding auxiliaries to the medium is necessary. The conceptual model of the staining process is shown in Figure 1(b). Auxiliaries are usually dispersants and leveling agents. Sodium hydroxide also needs to be added to provide an alkaline dyeing environment. Meanwhile, maintaining a high-temperature and high-pressure environment for extended periods is often required to obtain a better dyeing rate and leveling properties. After dyeing, the fabrics are also subjected to reduction clearing and washing by hot and cold water, respectively. The consumption of clean water and the discharge of sewage are massive.
Many emerging dyeing technologies have entered the stage of research and development or industrial testing stages, such as dyestuff modification and non-aqueous medium dyeing.11–13 Researchers have begun to choose new dyeing mediums to achieve eco-friendly dyeing.
Li et al. 14 selected an organosilicon solvent (decamethylcyclopentasiloxane, D5) as the dyeing medium and prepared an anhydrous dyeing system for dyeing PET fabrics with dispersed dyes. The principle model of this dyeing process is shown in Figure 1(c). In this dyeing system, PET fabrics can be dyed with purified dispersed dyes without adding any dispersant. Industrial production experience shows that adding a tiny amount of accelerating agent is a better choice for a good dyeing effect. No reduction clearing is required after dyeing. Only two washes with silicone solvent are needed. Moreover, the dyeing and washing waste can be recycled, and the dyeing performance of the dyed samples is comparable to that of traditional high-temperature and high-pressure dyeing. Currently, this technology has two pilot-scale factories that can be put into production. The factory researched for this article is one of them. This technology has significant advantages regarding clean water consumption and effluent discharge, but its electricity consumption is higher than that of conventional dyeing technologies. Therefore, it is not yet known whether this technology can reduce the environmental impact of the dyeing process.
Industry and consumers are increasingly interested in environmental impact and sustainability. Life cycle assessment (LCA) is an internationally recognized method and tool for quantifying and evaluating environmental impacts. Currently, the LCA method is also widely used for carbon footprint (CF) quantification and evaluation in the textile and apparel field. However, it focuses on the product or enterprise level. Several studies have focused on the environmental impacts of textiles and clothing from production to end-of-life. 15 Some environmental impact assessment studies on textile and apparel products focus on the production process of individual textile fibers or competing textile products.16–19
However, there are few research cases of textile dyeing companies calculating the CF and implementing it in practice.20,21 Similarly, there is a shortage of research on quantifying the environmental impact of emerging dyeing technologies. Compared with other dyeing technologies, especially the traditional water bath dyeing process, is the PET low-pressure anhydrous dyeing process more environmentally friendly? Although the technology has the absolute advantage of reducing the consumption of clean water and lowering the effluent discharge, it is still not clear that it can reduce the environmental impact characterized by indicators such as CF. Therefore, this study should focus more on the ecological effects of different dyeing processes and comparative studies on the environmental impacts of varying dyeing technologies.
Using CF as an indicator, this article quantifies and evaluates the environmental impact of low-pressure anhydrous dyeing technology. The LCA method was used to assess the environmental impact of the anhydrous dyeing technology to determine which substances have the most significant impact throughout the dyeing process and how much carbon emissions are reduced by this technology compared to conventional dyeing techniques. This study quantifies and evaluates the CF of the printing and dyeing process based on the process-level indicators. While assessing how much carbon emissions can be reduced by this dyeing technology, it can also better help enterprises use existing resources and equipment rationally. It can also help enterprises further implement the exemplary management of the dyeing process and formulate standardized, fine, and individualized process optimization and production scheduling plans in a more targeted manner.
Methodology
Assessment Framework and System Boundary
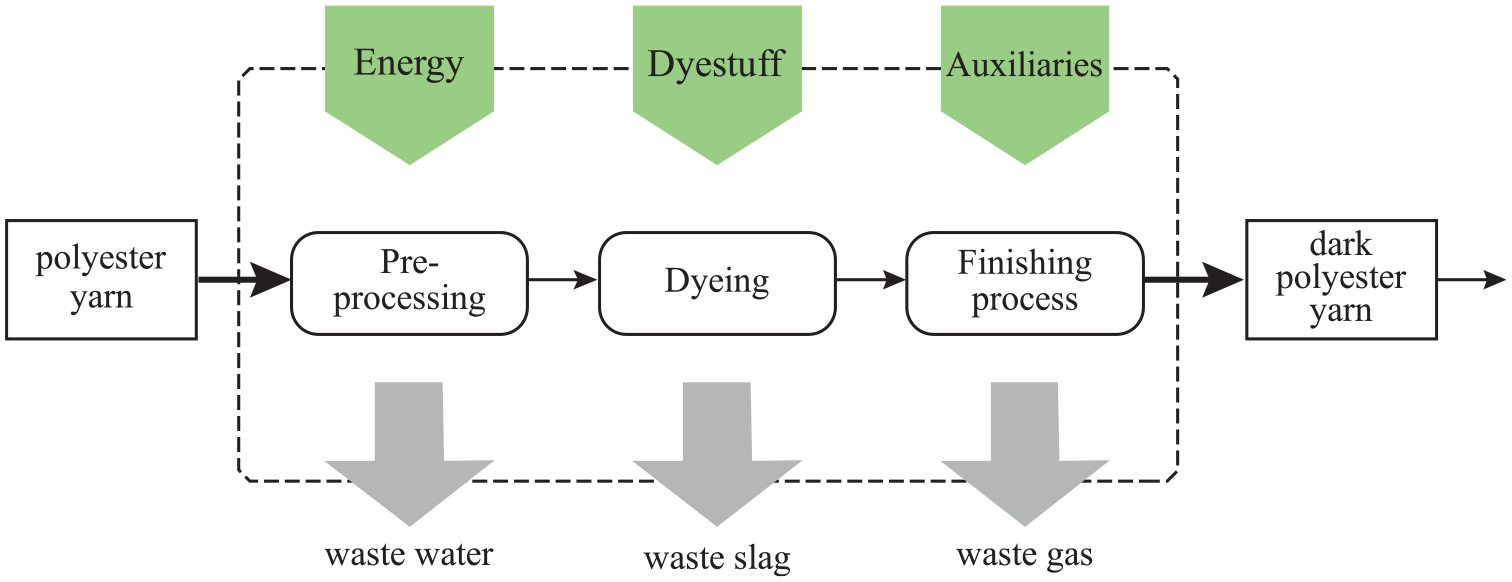
The methods presented in the IPCC report, ISO 14067, and PAS 2050 all offer general assessment principles and a system framework. The system boundary for assessment of the PET filament CF in this study (Figure 2) is based on these principles, the investigation of the dyeing processes, and a summary of all inputs/outputs. The CF assessment in this article involves calculating the direct and observable emission of GHGs and includes estimates of the indirect emissions.
System boundary of the industrial dyeing process for CF assessment.
The functional unit considered in this article is 1000 kg of PET filament. The system boundary includes the front pre-processing, dyeing, and finishing process. The main relevant input factors for CF calculation in this article are energy consumption and material consumption, including water, steam, electricity, dyes, and accelerating agents. In addition, the environmental impact caused by the waste emissions is also considered. The loss of the drying medium (D5) is also taken into account.
The system boundary of CF evaluation of the dyeing process is shown in Figure 2. From a temporal point of view, the system boundary comprises a series of processes from the entry of PET fibers into the factory to dyeing and finishing. Generally, three production segments are compiled, namely, preprocessing, dyeing, and the finishing process, each of which can be subdivided into multiple production steps. Considered from the point of view of material space, the system boundaries in a broad sense include energy consumption (electricity, water, steam, natural gas) and material consumption (labels, cartons, packaging bags, etc.) in production areas, production auxiliary areas, and business operations areas.
Items expected to produce less than 1% of the total carbon emissions of the product are excluded from the system boundaries, such as the consumption of raw materials, the use, maintenance, and damage of plants, machinery, and equipment, and the daily lives of workers. The neglected items do not exceed 5% of the total carbon emissions of the functional unit. 22 Considering the actual dyeing technology system of the researched factory, its CF quantification indicators are divided into three categories: energy, dyestuff and auxiliaries, and waste. Substances not involved or other tiny amounts of substances are also excluded from the actual system boundary. In other words, the main factors related to the CF calculation in this article are the consumption of energy resources, the consumption of materials (such as dyes and accelerating agents), solid waste, and dyeing medium.
Dyeing Process
The target factory is in Jiaxing City, Zhejiang Province, China, and its PET filament dyeing process is shown in Figure 3(a).
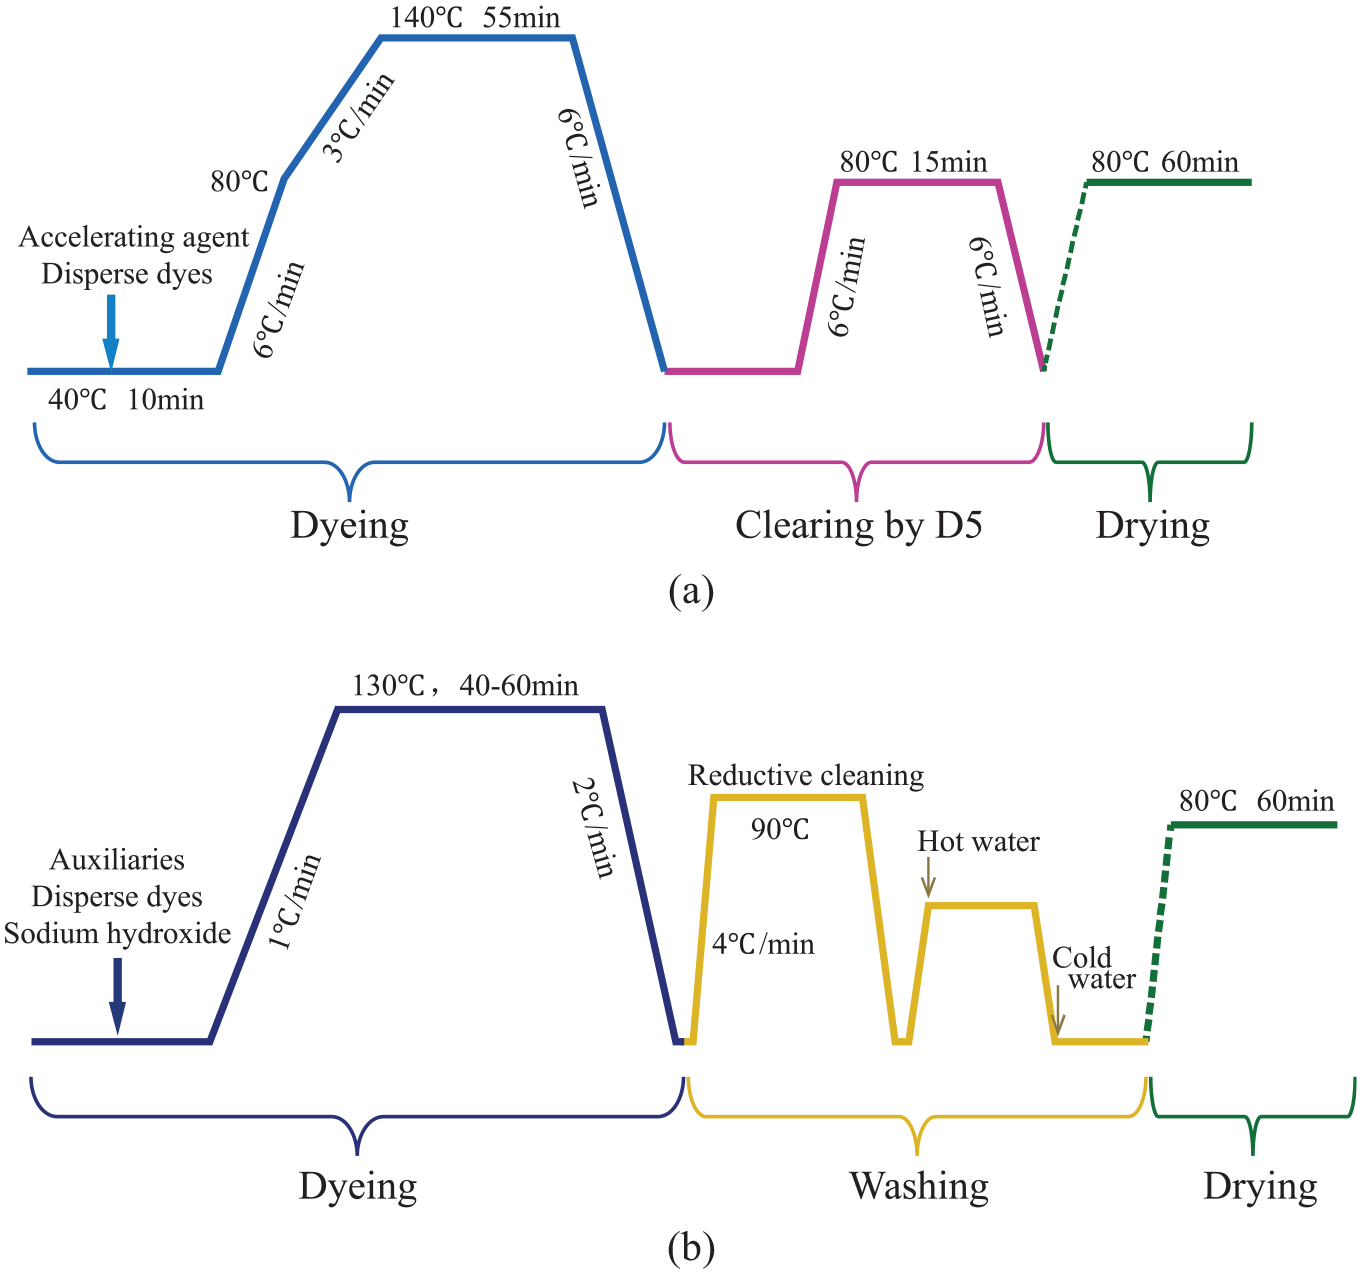
(a) Low-pressure anhydrous dyeing process for polyester. (b) Traditional water bath dyeing process of polyester.
This factory uses an emerging silicone-based anhydrous medium dyeing technology system. Only dispersed dyes and a tiny amount of accelerating agent are needed in this dying system. Under normal pressure conditions, the dyeing standards as the traditional water bath system can be possibly achieved by selecting the appropriate process parameters in this dyeing system. The dyeing waste and washing waste can be collected and recycled, and the recycling rate of dyeing medium is as high as 99%. The dyestuff added during the dyeing process is color paste and the accelerating agent is in liquid form, so the waste after media recycling is a solid–liquid mixture. That greatly reduces the discharge of dyeing wastewater.
The PET dyeing process of the traditional water bath staining technology system is shown in Figure 3(b). In the PET alkali reduction, one-bath dyeing process system, dispersed dyes, dispersants, and caustic soda are put into the dyeing solution. Then, it is heated to 130°C and maintained for 40–60 min for dyeing. After dyeing, the fabrics are subjected to reduction clearing, and then washing by hot and cold water, respectively. Finally, it is dried to obtain the products.
CF Accounting Method
The basic logic of the CF process analysis method is the LCA method. The carbon emissions of the research object in the entire life cycle are calculated using the input and output substances inventory. This method is mainly used to measure the CF of a particular product or production activity. It is targeted and suitable for micro-systems. However, this method has boundary problems and some difficulties in boundary determination, and the required workforce and material resources are extensive. The steps generally include “establish a flowchart—determine the system boundary—collect data—account footprint—results test.”
The CF is equal to the sum of the product of each material and activity data and its corresponding carbon emission factor. 23 The carbon emission factor refers to the CO2 equivalent of the environmental impact caused by the discharge or consumption of a unit substance, raw material, or energy. According to the PAS2050 standard, calculate the carbon emission value corresponding to a particular activity. The calculation method is CF = activity data (mass/volume/kWh/km) × emission factor (CO2 eq/unit). The result of continuous working equipment carbon emission is the sum of equipment energy consumption and the corresponding electric energy emission factor. The CF accounting formula of the product or service in the system boundary is as follows:
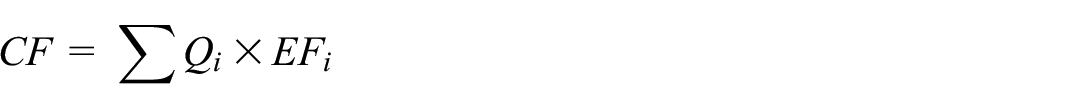
where CF is the carbon footprint in the boundary of a certain product, kg CO2 eq; Qi is the activity data of material i, that is, consumption or emission, and the unit is determined according to the emission source, like kg or m3; and EFi is the carbon emission factor of material i, and the unit is determined according to the emission source, like kg CO2 eq/kg or kg CO2 eq/m3. Generally, it is inspected to ensure the scientific completeness and accuracy of CFs and improve credibility.
Data Collection
Data collection is the focus and difficulty of this article and is the core part of the material and accounting inventory. In the PET textile industrial production system, there are differences in the availability of various data types. For example, the water and electricity used in the processing and manufacturing of PET textiles are more accessible. At the same time, the production data of dyes and auxiliaries are challenging to obtain. Except for a small portion of primary data obtained from enterprise research, most of the data required for this project are secondary data. Some of the data are for internal use only and are not open to the public. Some of the data are not monitored and collected by the factories. For these reasons, some of the data were calculated by integrating other data from the factory, such as the amount of water and electricity. Some of the data are obtained from existing literature, such as carbon emission factors of substances.
The direct data collected from enterprise research in this article include raw materials and stage products, types and consumption of energy and resources, and types and emissions of pollutants discharged to the atmosphere, water, and the environment. The textile dyeing technology is also included in the scope of the research.
Results and Discussion
CF Accounting Results
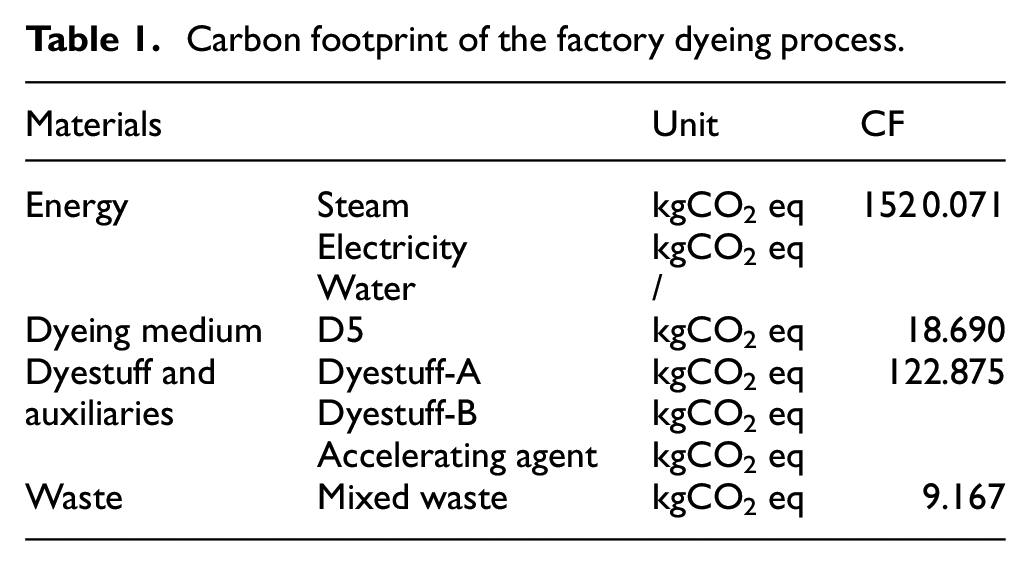
Based on the research data obtained from the enterprise, calculate the results as follows. As shown in Table 1, the quantitative results of the CF of this company’s 1000 kg PET filament dyeing process are 1670 kgCO2 eq, 1.670 kgCO2 eq/kg PET filament. Under the decamethylcyclopentasiloxane anhydrous dyeing system, this factory’s dyeing process only requires a tiny amount of dyes and auxiliaries. Hence, the carbon emissions caused by energy consumption occupy a large proportion of the entire dyeing process, which is about 1520 kgCO2 eq. The environmental impact of dyes and auxiliaries is about 123 kgCO2 eq. Meanwhile, under this dyeing system, there are no waste water and gas pollutant emissions and only a small amount of mixed wastes. The waste pollutants only account for 0.55% of the overall carbon emissions.
Carbon footprint of the factory dyeing process.
As shown in Figure 4, in this dyeing system, the environmental impact of waste is the lowest, and its proportion is lower than 1% of the entire process. The main reason is that this system’s waste emissions, mainly oligomers or staple fibers, are low. The carbon emissions from energy consumption (steam and electricity) are 1520 kgCO2 eq, which accounts for more than 90% and contributes almost all the GHG emissions during this dyeing process. Among them, steam consumption accounts for 56%, and electricity consumption accounts for about 36%. Dyestuffs and auxiliaries have the next highest environmental impact, at about 7.3%. The loss of dyeing medium (D5) has a small contribution to the overall carbon emissions, accounting for about 1.1%. The GHG emissions from dyestuffs are 96 kgCO2 eq, accounting for about 5.7% of the dyeing process. The environmental impact of the auxiliaries is only 1.6% of the CF of the overall dyeing process. Optimization of process parameters to reduce the amount of dyeing materials and selection of dyestuffs produced in a low carbon way are among the research directions to reduce the CF of the dyeing process.
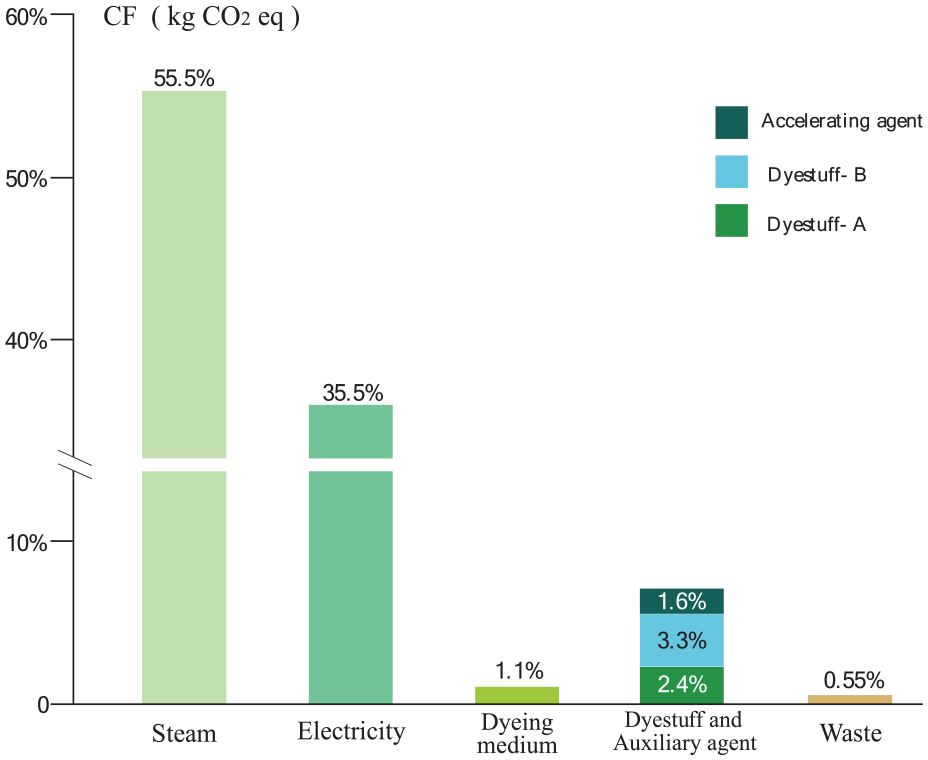
Carbon footprint contribution (%).
Three aspects can be considered to reduce the CF of this dyeing process: reducing steam consumption, using clean electricity, and selecting low-carbon materials. The steam and electricity resources this company uses are purchased from other factories. Suppose the energy production method can be adjusted to the direction of the green energy structure (such as wind power, photovoltaic power generation, and other clean electricity). In that case, the carbon emissions factors of steam and electricity will be reduced, so the overall carbon emissions of the dyeing system will be reduced significantly. If the electricity energy (assuming thermal power) can be replaced by photovoltaic power generation, the CF of this dyeing process can be reduced by at least 7%. Selecting dyestuffs produced by low carbon methods or improving process parameters to reduce the amount of dyestuffs and chemicals is also one of the research directions to reduce the CF of this dyeing system.
Comprehensive Evaluation of CF
The bottom-up assessment methodology in this study is based on direct data from the detailed process in the life cycle clarifying the specific system boundary. With this approach, the CF result can be disassembled and reassembled, which makes it possible to compare the results from different assessments of similar products. As one of the essential mechanisms for controlling and managing GHG emissions, comparing carbon emissions between different fungible products and between the same products from different producers could help reduce CF of production across the industry. Future assessments of fungible products, such as other dyeing technology methods, should be conducted using a consistent framework and methodology to encourage consumers to select those associated with low-carbon production.
In actual CF assessments, producers have insufficient experience in measuring and collecting the basic data. Moreover, available data lack sufficient accuracy to support comparisons between different product processes. This article’s data related to the water bath dyeing technique are derived from a literature article, which only has final CF results and lacks detailed process data. And the system boundaries are not fully consistent. The GHG emissions of the PET low-pressure anhydrous dyeing system and the traditional water bath dyeing system are summarized in Table. 2.
Dyeing process of anhydrous and traditional water bath.
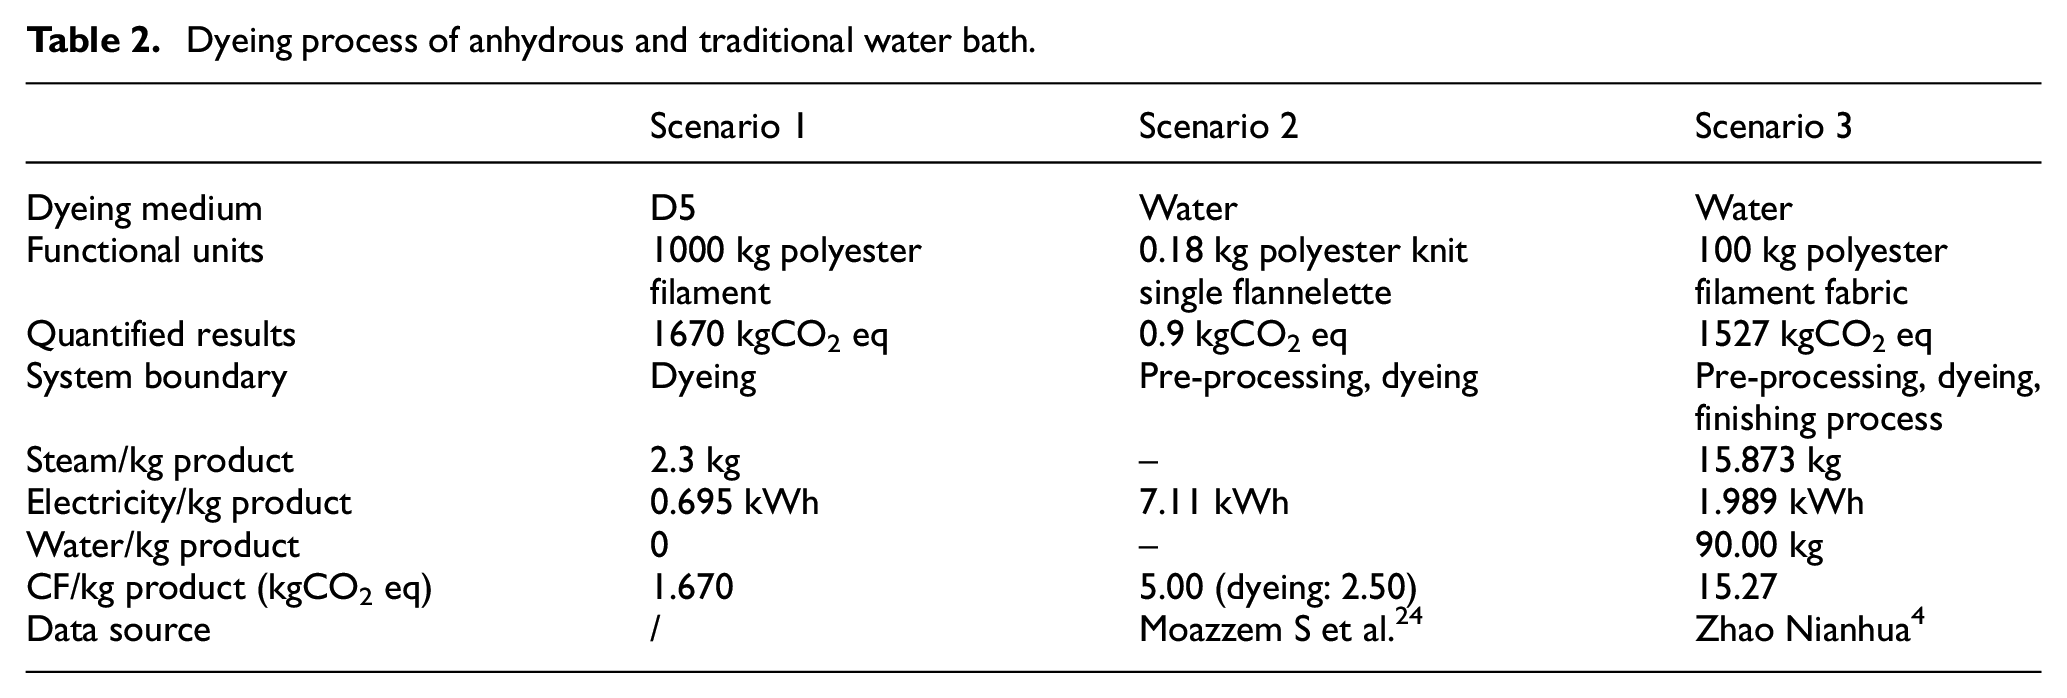
When the three scenarios are dyed 1 kg PET products, the anhydrous dyeing system does not need to consume a variety of chemicals for routine post-finishing processes such as soap washing and water washing. All its environmental impact is significantly lower than scenario 2 and scenario 3, ignoring the influence of time, region, and others on the carbon emission factors of power, steam, and other substances. Compared with the GHG emissions of the unit product in scenario 2 (2.5 kg CO2 eq/kg PET products), the dyeing system of scenario 1 is relatively reduced by 33.2% of the GHG emissions. Although the power consumption of unit products has increased, the emerging dyeing technology in scenario 1 saves almost all of the water consumption, and the overall carbon reduction effect is significant.
Some scholars 25 use the comprehensive LCA method to evaluate the environmental impact of cotton fiber products in the entire life cycle, including the effects of the use of decamethylcyclopentasiloxane as a dyeing medium. Then, it was concluded that compared with conventional water bath dyeing technology, the GHG emissions of textile products using silicone medium technology decreased by 43.70%. In addition, its excellent water-saving capacity (about 61.30–79.86%) makes it possible to transfer the textile industry from the eastern coastal areas of China to the western regions where water is relatively scarce. To sum up, the emerging dyeing technology, in this case, has a more vital ability to reduce pollution and carbon than the traditional dyeing process, which is feasible. This emerging dyeing technology has a positive significance for the sustainable development of China’s textile industry.
Uncertainty and Sensitivity Analysis
Uncertainty analysis is a process of measuring uncertainty and description of uncertainty. The sources of uncertainty in this study mainly relate to the realism of the CF assessment method and potential data errors. The method’s reliability primarily depends on the completeness of the assessment framework and the system boundary. 26 The framework presented here references not only the existing methodologies of the ISO, Carbon Trust, IPCC, and others but, as far as possible, includes all of the substances involved in the dyeing process. The present assessment method, therefore, has relatively high certainty.
The quality of the list data determines the reliability of the LCA results to a large extent, and the data quality is affected by human factors. Therefore, this section focuses on the quantitative analysis of the input data quality uncertainty. The quality of the input data depends on the source of data and evaluation methods, processes, allocation principles, assumptions, and so on. This article chooses the commonly used way, combining data indicators and uncertainty stochastic simulation. The critical point of this analysis method is the selection of data quality indicators. The steps are as follows: determine the input data of the analysis target, and determine the input data’s probability distribution, related parameters, and range. According to the probability distribution and content of the input data, the Monte Carlo simulation is performed after the sampling value.
Normal distribution is selected as the distribution function in this study. The input uncertainties are indicated as the coefficient of variance (
The uncertainty analysis results in Figure 5 show that the average CF of the 1000 kg PET filament dyeing process is 1671.05 kg CO2 eq. The standard deviation was 55.15. Taking the 95% confidence interval as the uncertainty estimation range, the 2.5% and 97.5% confidence intervals were 1562.96 kg CO2 eq and 1779.14 kg CO2 eq, respectively. The median was 1671.04 kg CO2 eq. The coefficient of variation (CV) was 3.30%. When the CV is less than 10%, it is classified as weak variation, which indicates that the uncertainty of the CF accounting results, in this case, is low. The results are credible.
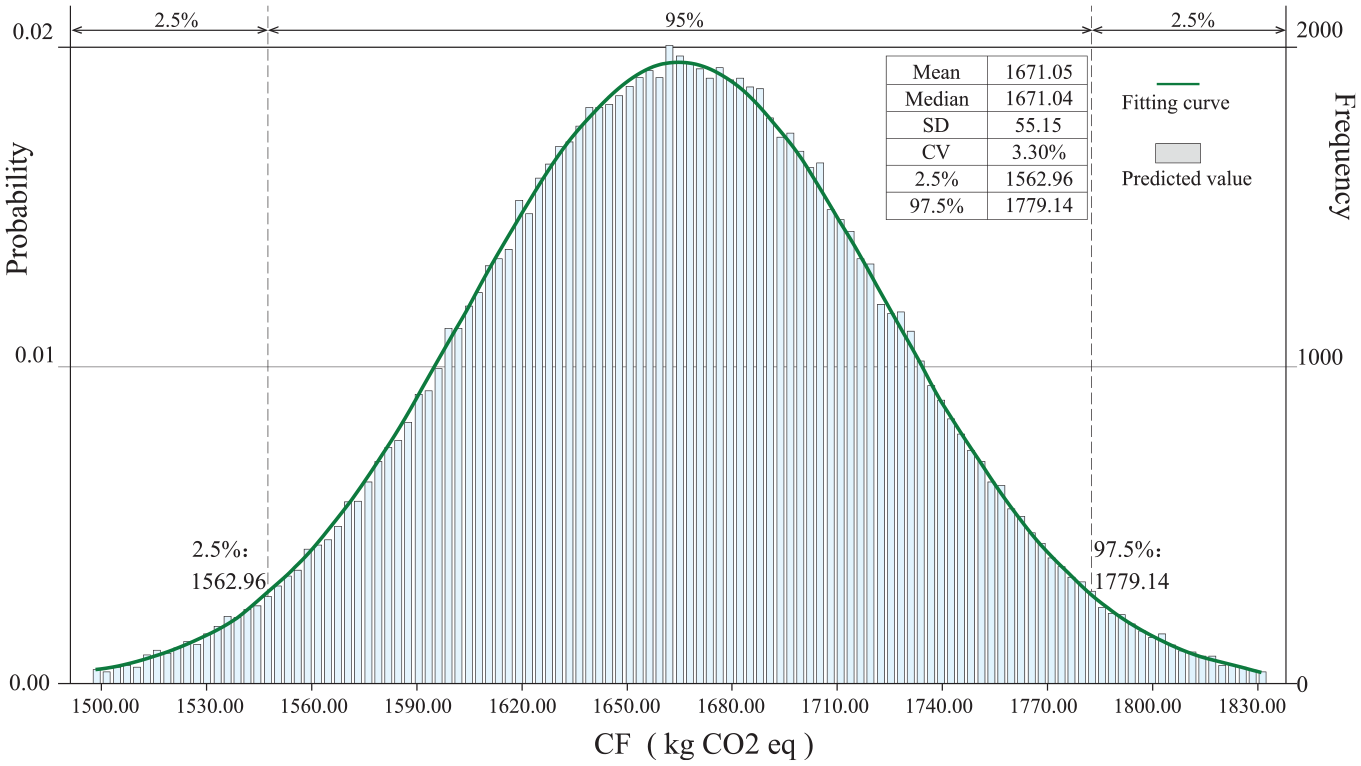
Frequency histograms of carbon footprints based on Monte Carlo simulations.
Figure 6(a) shows the results of sensitivity analysis based on Monte Carlo simulations. Factors include the input of dyestuff-A, dyestuff-B, and accelerating agent, the consumption of steam and electricity, and waste emission. Among the seven input parameters, steam consumption was the most sensitive to CF results, up to 71.7%. Other parameters, D5, dyestuff, accelerating agent, and waste, had shallow effects on CF output, all of which were less than 1%.
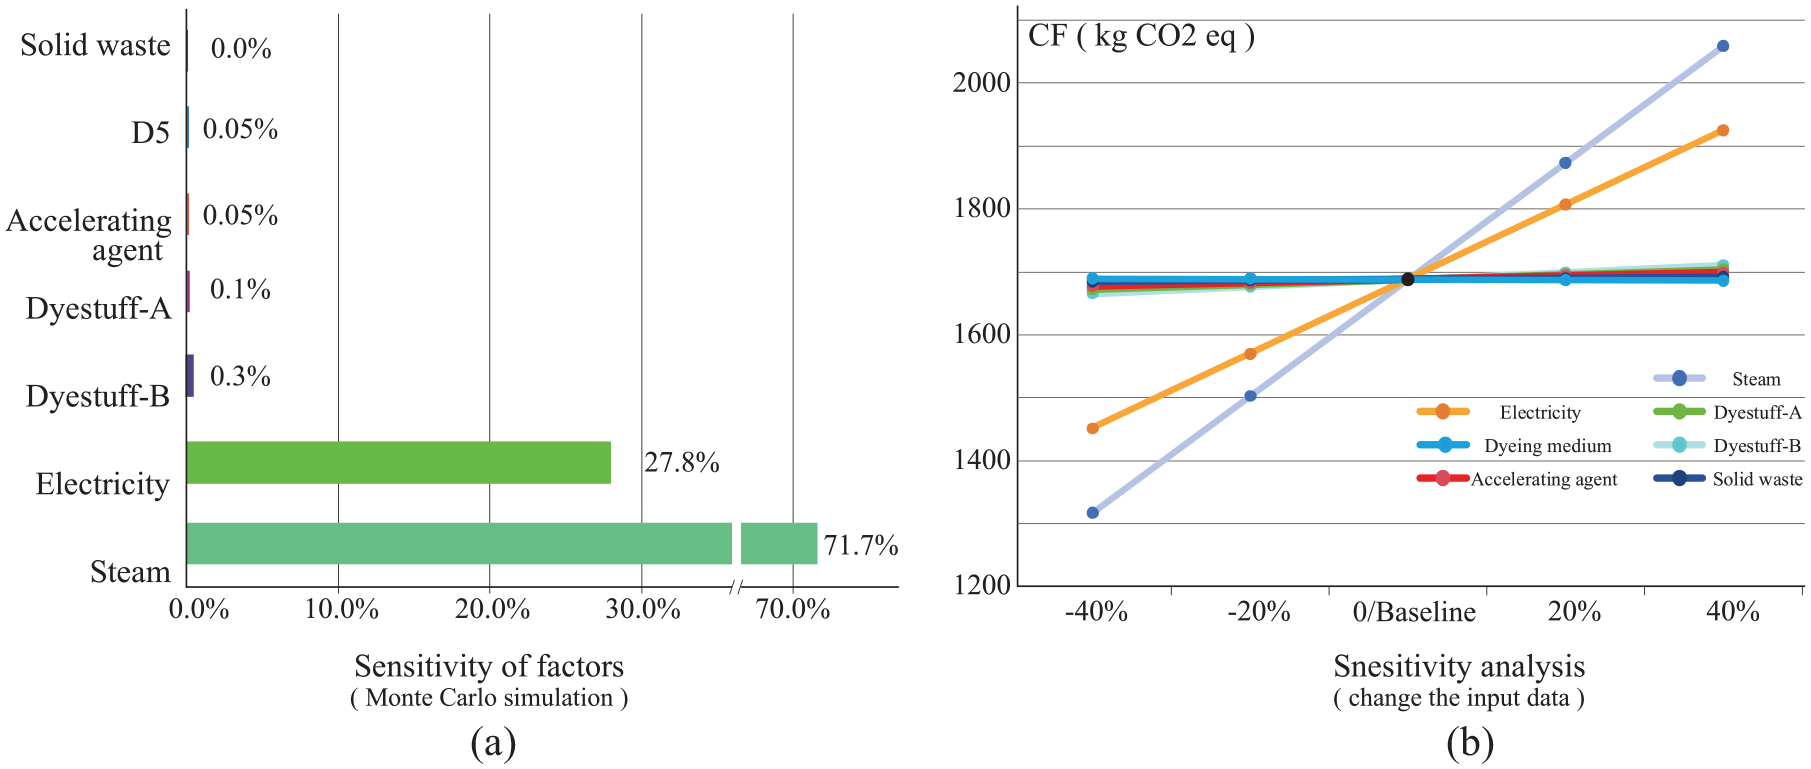
(a) Sensitivity analysis of factors by Monte Carlo simulation. (b) Sensitivity analysis of factors by change the input data.
To increase the robustness of the evaluation results, a sensitivity analysis was performed for seven input parameters (non-zero data) involved in the CF accounting of the PET dyeing process. This is shown in Figure 6(b). The values of the seven input parameters were changed between ±40% to obtain the corresponding changes in the output results, and the sensitivity of different input parameters to the evaluation results was analyzed.
Steam consumption had the highest sensitivity. When the steam consumption varied by ±40%, the CF went between 1318 kg CO2 eq and 2060 kg CO2 eq. Electricity consumption is also sensitive. When the electricity data varied between ±40%, the CF fluctuated between 1452 kg CO2 eq and 1926 kg CO2 eq. The other parameters (dyestuff-A, dyestuff-B, accelerating agent, waste) had shallow effects on the CF accounting results. Therefore, when quantifying the CF of the dyeing process, special attention should be paid to the quality of data collection for steam and electricity consumption.
Conclusions
This article used the CF as an indicator and evaluated the environmental impact of this low-pressure anhydrous dyeing technology for PET. The system boundary of this article is the dyeing process of 1000 kg of PET filament yarn. The most crucial carbon emission contributors are identified. In addition, other cases of CF studies using traditional water bath dyeing techniques were collected from other studies. The similar accounting boundaries and uniform functional units (which can be unified directly or indirectly) were prerequisites for case selection. Finally, the uncertainty and sensitivity of the CF accounting results were also analyzed.
The conclusions are as follows. The CF of this factory’s low-pressure anhydrous dyeing process is 1670 kg CO2 eq/1000 kg PET filament. Steam and electricity consumption are the main sources of carbon emissions from the factory, accounting for 55.5% and 35.5%, respectively. Further management and control direction or optimization and improvement of sustainable development can be considered from three aspects: reducing steam consumption, using cleaner electricity, and selecting low-carbon materials. Compared with the traditional water bath dyeing systems, the carbon emissions of the dyeing process with low-pressure anhydrous dyeing technology are reduced by more than 30%, and avoid almost all of the consumption of clean water. Uncertainty analyses show that the data and results in this article are reliable. The results of the sensitivity analyses indicate that more special attention should be paid to the quality of data collection for steam and electricity.
In conclusion, emerging dyeing technology has a vital ability to reduce pollution and carbon emissions. This has a positive significance for the green, sustainable development of China’s textile and apparel industry. Furthermore, the enterprises investigated in this article chose silicone instead of water as the medium for textile dyeing. The possibility of using other substances as a medium for anhydrous dyeing technology is also a future research direction. The water footprint is an indicator that measures the water consumption and the environmental impact of wastewater discharges by a process or one service. In future studies, the water footprint can be applied as another indicator for evaluating the ecological effects of low-pressure anhydrous dyeing of PET textiles.
Footnotes
Declaration of conflicting interests
The author(s) declared no potential conflicts of interest with respect to the research, authorship, and/or publication of this article.
Funding
The authors disclosed receipt of the following financial support for the research, authorship, and/or publication of this article: Research and industrialization demonstration on key technologies of non-aqueous dyeing and zero discharge of wastewater for textiles(2019AA001), Study on molecular diffusion kinetics of reactive dyes in non-aqueous medium dyeing and its relationship with the characteristic structure activity of fiber surface(22072089) and Study on the mechanism of improving the dyeing rate of dispersive dyes in low pressure anhydrous dyeing system based on supramolecular synergy(22108169).