
Abstract
Dyes play an important role in textile production, but their contribution to air pollution and harming human health have raised concerns and remain an international problem. The key to overcoming this challenge is to assess how much greenhouse gases are being generated and the hotspots which guide decision-making process toward more sustainable options. This article established a carbon footprint calculation method for disperse dyes. First, the system boundary description and the functional unit were discussed. Second, the carbon footprint inventory analysis was determined. What’s more, the calculation method, allocation method and emission factors were proposed. It was intended to be practical and effective based on three typical disperse dyes in China. The results showed that the carbon footprints of Disperse Blue 79, Disperse Red 167, and Disperse Orange 61 corresponded to 8.28 t CO2 eq/t, 8.07 t CO2 eq/t, and 7.48 t CO2 eq/t, respectively. For the three disperse dyes, the carbon emissions of dispersing agent melamine-formaldehyde resin and liquid ammonia consumption were the dominant emission sources. The steam and electricity were the two major sources of carbon emissions caused by energy usage. The homogenization and the wastewater treatment process were the two largest emission emitters. The sensitivity analysis showed that the total product carbon footprint was mostly sensitive to dispersing agent melamine-formaldehyde resin changes, followed by steam, liquid ammonia, and electricity. The results show that disperse dye production have great potential for improvement. The reduction options for the emissions of the disperse dyes production can be concluded by the optimization of the production process and technology for dispersing agent melamine-formaldehyde resin, liquid ammonia, electricity, and steam. Through the calculation, the influencing factors for the carbon footprint can be analyzed and highlighted. The method provides a comprehensive understanding of environmental impacts with dyes, driving the adoption of sustainable dyeing practices.
Introduction
Rising levels of greenhouse gases (GHGs) in the atmosphere have increased the greenhouse effect and, consequently, caused a rise in the temperature of the earth. Humans are responsible for climate change largely, especially the activities of industry. 1 The dyes industry is a typical energy consumer, with a great amount of emissions and wastes annually, 2 affecting the global climate through GHG emissions (Kiteme et al., 2017). 3 Dyes can be classified into reactive, acid, disperse, direct, naphthol, indigo, lanaset, and basic dyes, with different applications for various fabric types. 4
As the global demand for textile products increases, the production of textiles showed an increment of more than four times in last 40 years. 5 Global textile consumption is expected to increase by up to 148 million tons by 2030. 6 However, the prosperity of the textile industry results in the high consumption of synthetic dyes with 0.8 million tons per year needed to meet the requirements of annual textile production. 7 Textile dye emissions into the air can contribute to air pollution and harm human health. 8 Disperse dye is the most widely used for textile dyeing, of which China has the largest export volume production among all textile dyes. 9 Disperse dyes are mainly applied to polyester, nylon, and other synthetic fabrics. 10 Therefore, it is necessary to analyze the GHG emissions of the dyes and to identify potential measures to improve energy-saving management in dye production.
To quantify the GHGs impact from goods and services, the life-cycle-based carbon footprint (CF) is widely used as a sustainable indicator. 11 The CF is comprehensive tool of measuring GHG emissions over the entire life cycle of a product from raw materials acquisition, through manufacturing, to final waste disposal.12,13 It is widely used to compare the impact of different products on climate change and to explore mitigation measures for GHG emissions. 14 In order to provide the requirements for quantifying the GHG impact, vital standardization processes have been developed. One approach is the Product Life Cycle Accounting and Reporting Standard developed by the World Resources Institute and the World Business Council for Sustainable Development. 15 Another is the PAS 2050: 2011 16 standard issued by the British Standards Institute. ISO 14067 has also emerged as an important technical standard for quantifying, monitoring, and reporting on GHG emissions. 17 The main differences of the three standards are about how certain types of emissions are taken into account and the requirements for reporting. 18 But in general, these three standards are similar, and specifically, all are based on the life cycle thinking approach. Therefore, in this work, the methodology employed to assess the CF of the typical dyes is life cycle assessment (LCA).
Currently, there are several studies about the CF calculation in chemistry production, relating mainly to ethanol, 19 aluminum, 20 magnesium, 21 calcium carbide, 22 methyl crotonate and methyl acrylate, 23 and liquid biofuels. 24 The previous studies qualify the GHG emissions using the LCA method and determine the energy-saving potential, aiming at improving the energy-use efficiency. However, there is no study that presents a complete CF of the disperse dyes production in the chemical industry.
As an indispensable material input into the textile production, the emission factor of dyes should be involved in the CF calculation for textile products. Many national and international researchers have determined the CF for textile products. The main discussions have been on the improvement of CF theory in the textile industry, 25 product CF accounting, 26 and the relationship between industrial CF and influencing factors. 27 Some cases of CF research on textile products include silk clothing, 28 T-shirts, 29 cotton knitwear, 30 cotton fabric, 31 jeans, 32 leather, 33 yarns, 34 cashmere fabrics.35,36 Murugesh and Selvadass summaring the results of the CF for the dyeing and finishing process involved in organic cotton single jersey knitted fabrics using a single dye emission factor instead of individual factors for different dyes, and this is also the case in other studies.36,37 Munasinghe et al. 38 presented the carbon and energy footprint of a bra manufactured in Sri Lanka based on life cycle analysis using PAS 2050 standard. However, this study did not consider the GHG emissions of dyes and this omission also occurs in other studies (Yan et al., 2016). 39 The previous studies showed that there is little available data for emission factors of dyes; most studies have taken the average emission factor of dyes instead of a certain colored dyes, or simply ignored the upstream emissions from dyes. This is because current research has less explored the carbon dioxide emissions from the production process of commonly used dyes, and the lack of emission factors has led to an exaggeration or underestimate of the carbon dioxide emissions from downstream textile production processes. At the same time, it has been shown that the major environmental impact in the dyeing process is due to the use of the dyes. 38 Thus, the need to calculate the CF for disperse dyes in the Chinese textile industry cannot be overemphasized.
This study aims at incorporating sustainability into the production process concerning dye generation, identifying the key points and exploring the opportunities for the reduction of carbon emissions in dye production. For this purpose, a CF calculation method for the disperse dyes were established. The objects of case study were the Disperse Blue 79 (DB), Disperse Red 167 (DR), and Disperse Orange 61 (DO). The production flow for each disperse dye were tracked and the CF of disperse dyes production based on an approach of LCA were quantified. As dyes are commonly important material inputs to the textile dyeing process and outputs to the petrochemical industry, this CF calculation for dyes provides the reference carbon emission factors for the accurate CF of the textile and petrochemical products.
Methods and Data
CF assessment based on LCA is primarily focused on GHG and related environmental impacts. LCA consists of four main steps, which are shown in Figure 1: (1) goal and scope definition, which defines the functional unit and system boundary, (2) inventory analysis, which includes all material and energy flows caused GHG emissions, (3) impact assessment, which calculates the environment impact caused by GHG emissions, (4) interpretation, which is the key parameters of the results and determines the data sensitivity. In this study, we followed the above-mentioned steps of LCA and established the CF calculation model for disperse dyes.
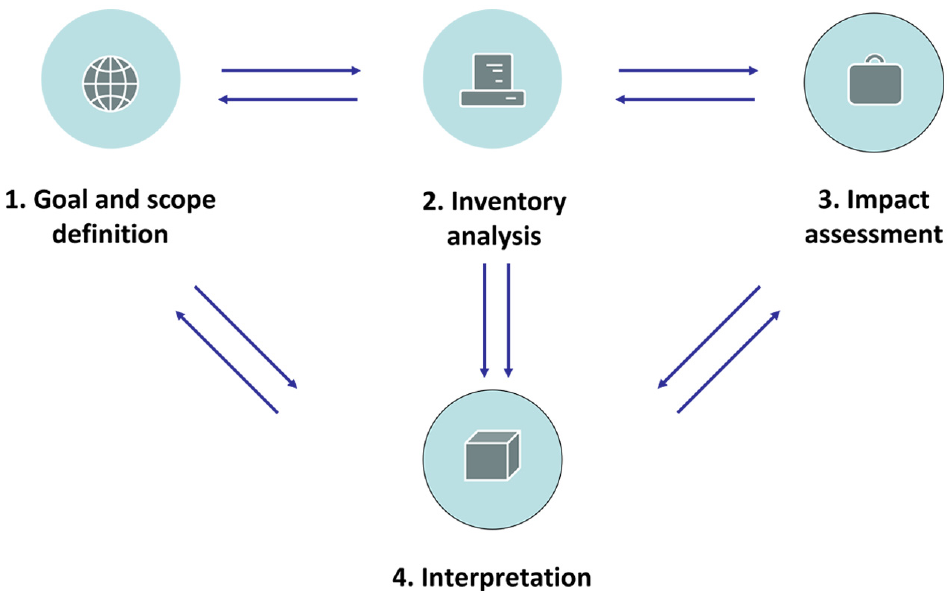
The four main steps of LCA.
The Hangzhou Bay Shangyu Economic and Technology Development Area (HSEDA) is a typical fine chemical industrial park which hosts the largest dye production center in China. In this study, three typical disperse dyes from Company A, the largest producers in HSEDA, were selected to calculate and assess the CF. The three disperse dyes were Disperse Blue 79 (DB), Disperse Red 167 (DR), and Disperse Orange 61 (DO). These products are the most representative and largest output products of the enterprise, and at the same time, the production technology is stable, so the CF results are also representative and comparable. All the three sample dyes belong to the azo disperse dye family, and their chemical structures are shown in Table 1.
Disperse dyes for the carbon footprint (CF) calculation in the study.
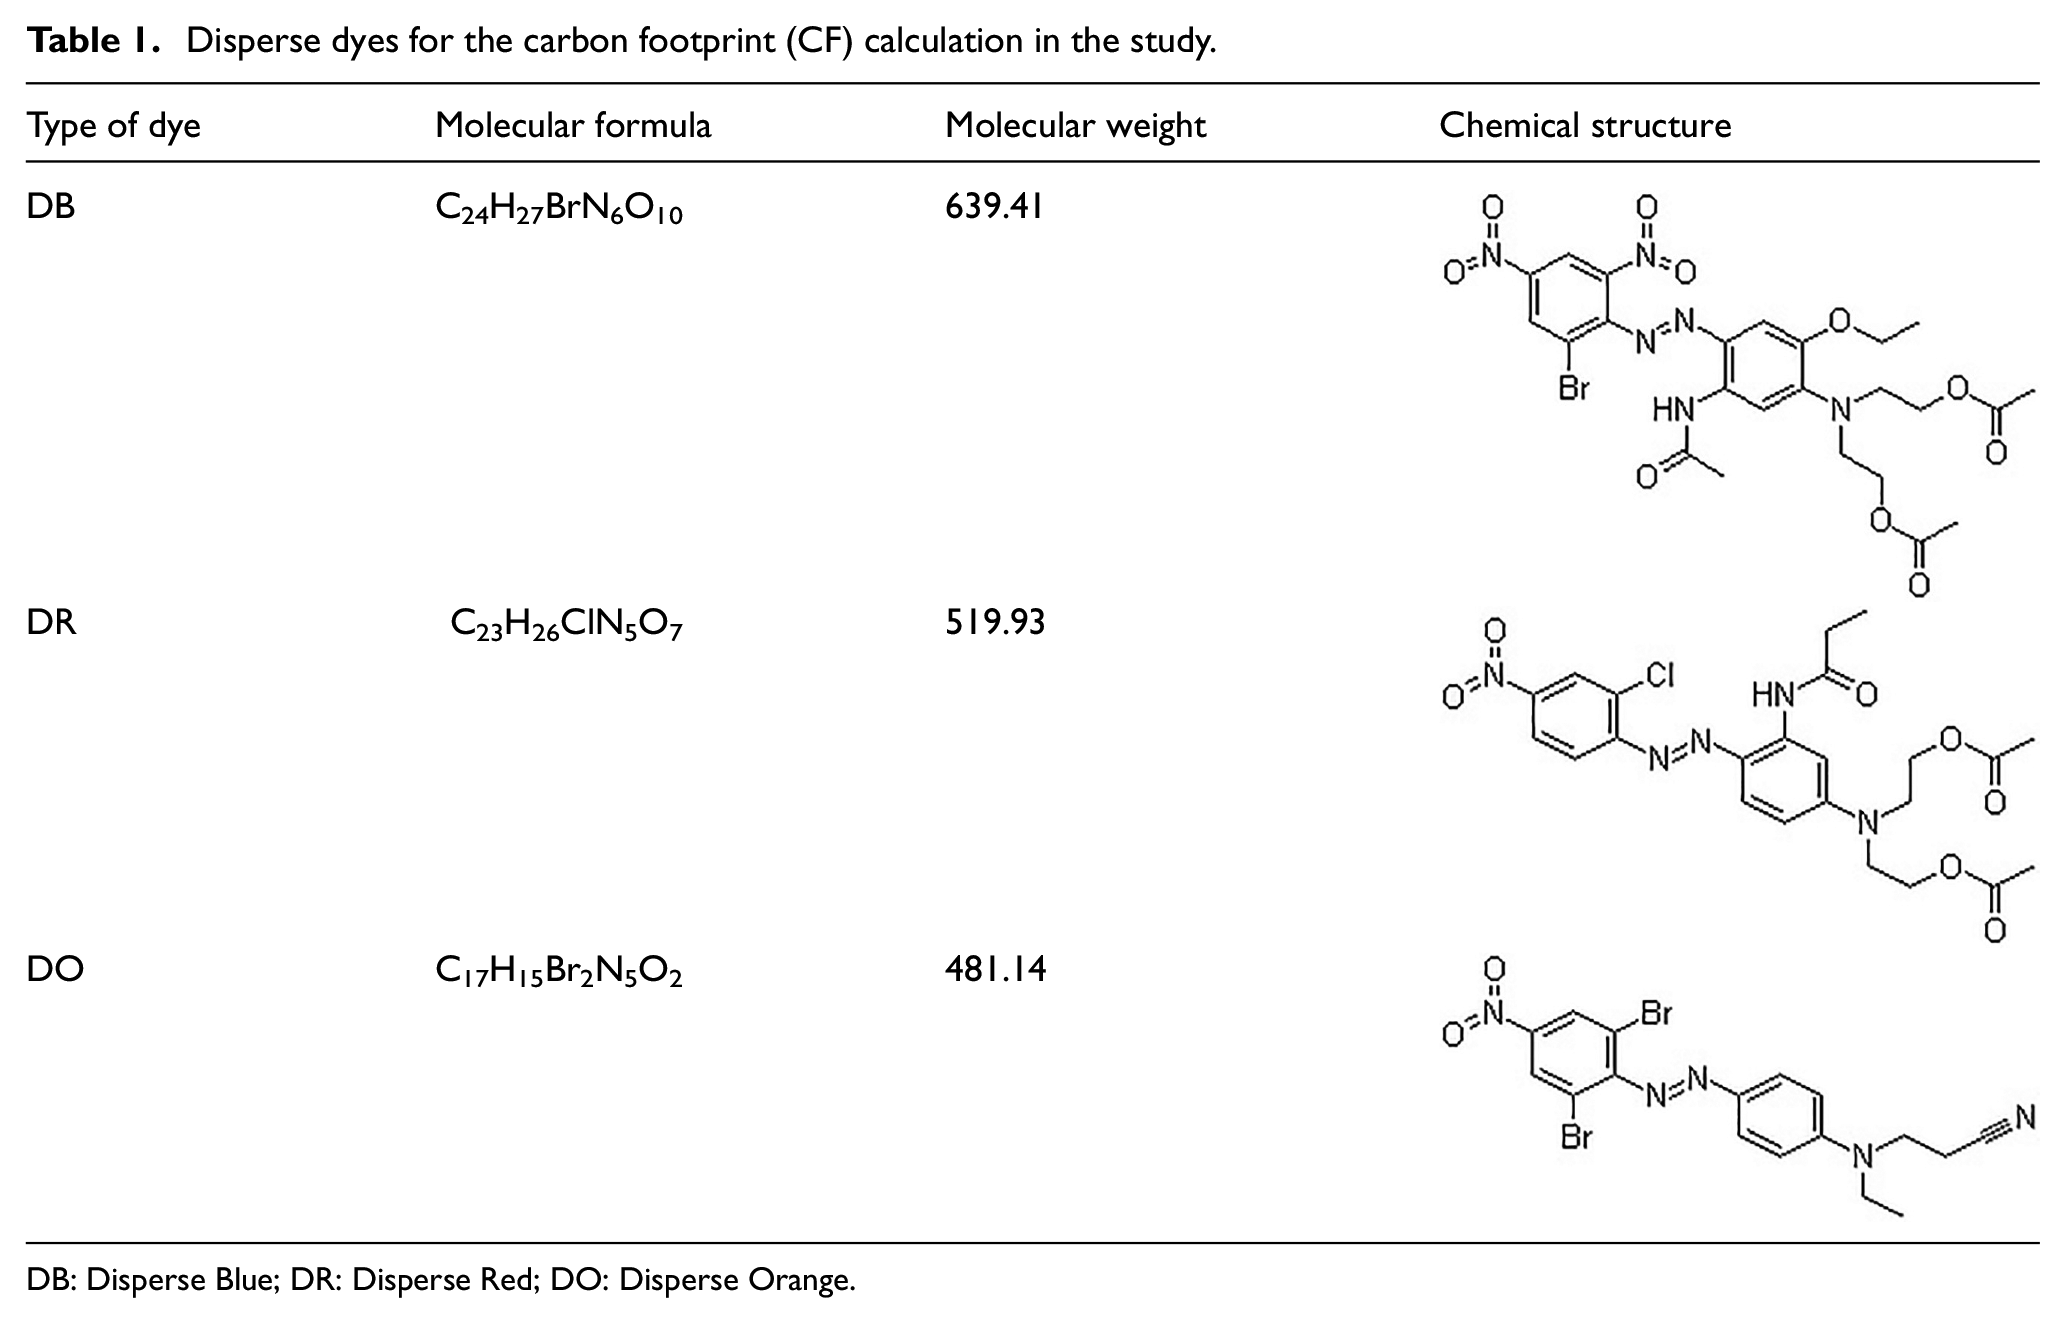
DB: Disperse Blue; DR: Disperse Red; DO: Disperse Orange.
System Boundary Description and Functional Unit
The study is mainly focused on the production stage (gate to gate) due to the complexity of the entire life cycle system and the limitation of data availability. The types of the substance inputs for these three dyes were identical in this process, but the consumption of each dye varies significantly. The inputs (electricity, steam, diesel for transportation, sulfuric acid and other chemicals) and the outputs (CO2, CH4, N2O, and wastewater) were included in the system boundary (see Figure 2). The transportation mentioned here was limited to the handling of the product within the factory. The GHG emissions for warehousing, recycling, transport outside the factory, use phase and disposal at the end-of-life were excluded from the system boundary.
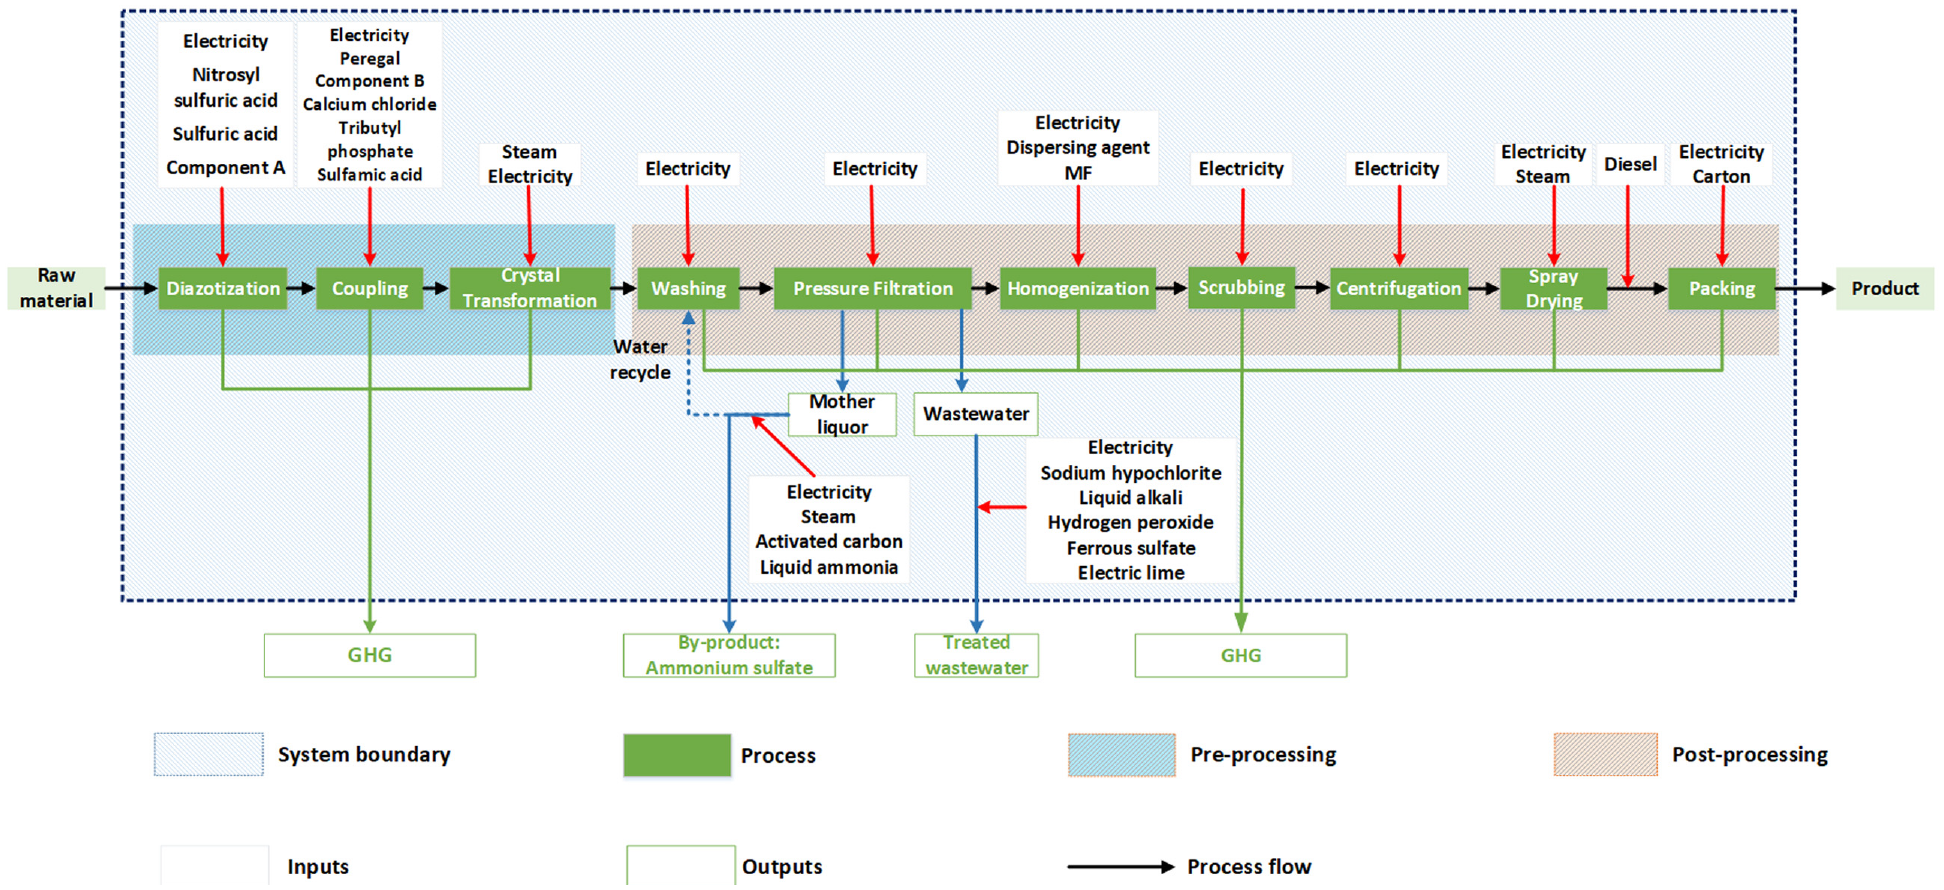
System boundary for the three disperse dyes.
Figure 2 shows the system boundary, which included the pre-processing and post-processing of dye production. The pre-processing can be divided into the diazotization, coupling and crystal transformation process, through which the raw materials were synthetized. In addition, there were differences in component A during diazotization and component B during the crystal transformation process. The component A applied in DB, DR, and DO was 2-chloro-3,5-dinitroaniline, 2-chloro-4-nitroaniline and 2,4-dibromo-6-nitroaniline, respectively, and the component B was 2-methoxy-5-acetamino-N, N-diethylaniline, acetamide, N-[3-[bis[2-(acetyloxy)ethyl]amino]-4-ethoxyphenyl]-, and 3 ethylanilinopropiononitrile, respectively. The chemical structures of these are very complex, but all belong to the category of aniline. The post-processing process includes the washing of raw materials, pressure filtration, homogenization, scrubbing, centrifugation, spray drying, and packing process. It is worth noting that after the pressure filtration process, the water used in the washing and the pressure filtration process was discharged in the form of mother liquor. Through the MVR (mechanical vapor recompression) concentration method, 46.7% of the mother liquor was recycled and at the same time, and the by-product (ammonium sulfate) was generated and sold to the market. The remaining wastewater was treated through the anaerobic sludge treatment method until it met the municipal requirements and was finally discharged to nature. Dispersing agent melamine-formaldehyde resin (dispersing agent MF) is mainly used for vat, disperse, and reactive dyes as dispersing agent. The product can be carried out with various types of dispersing agent mixtures, to adapt to all kinds of disperse dyes commercialization requirements. The functional unit used in this study is 1 ton of dry matter of dyes.
CF Inventory Analysis
CF inventory analysis involves quantification of inputs related to energy and material in production process. Inventory data were collected to describe the disperse dye processing. The energy, and material usage during the production and wastewater treatment were considered. The inputs data were firsthand survey data collected from a disperse dyes plant in China. The CF inventory is presented in Figure 3.
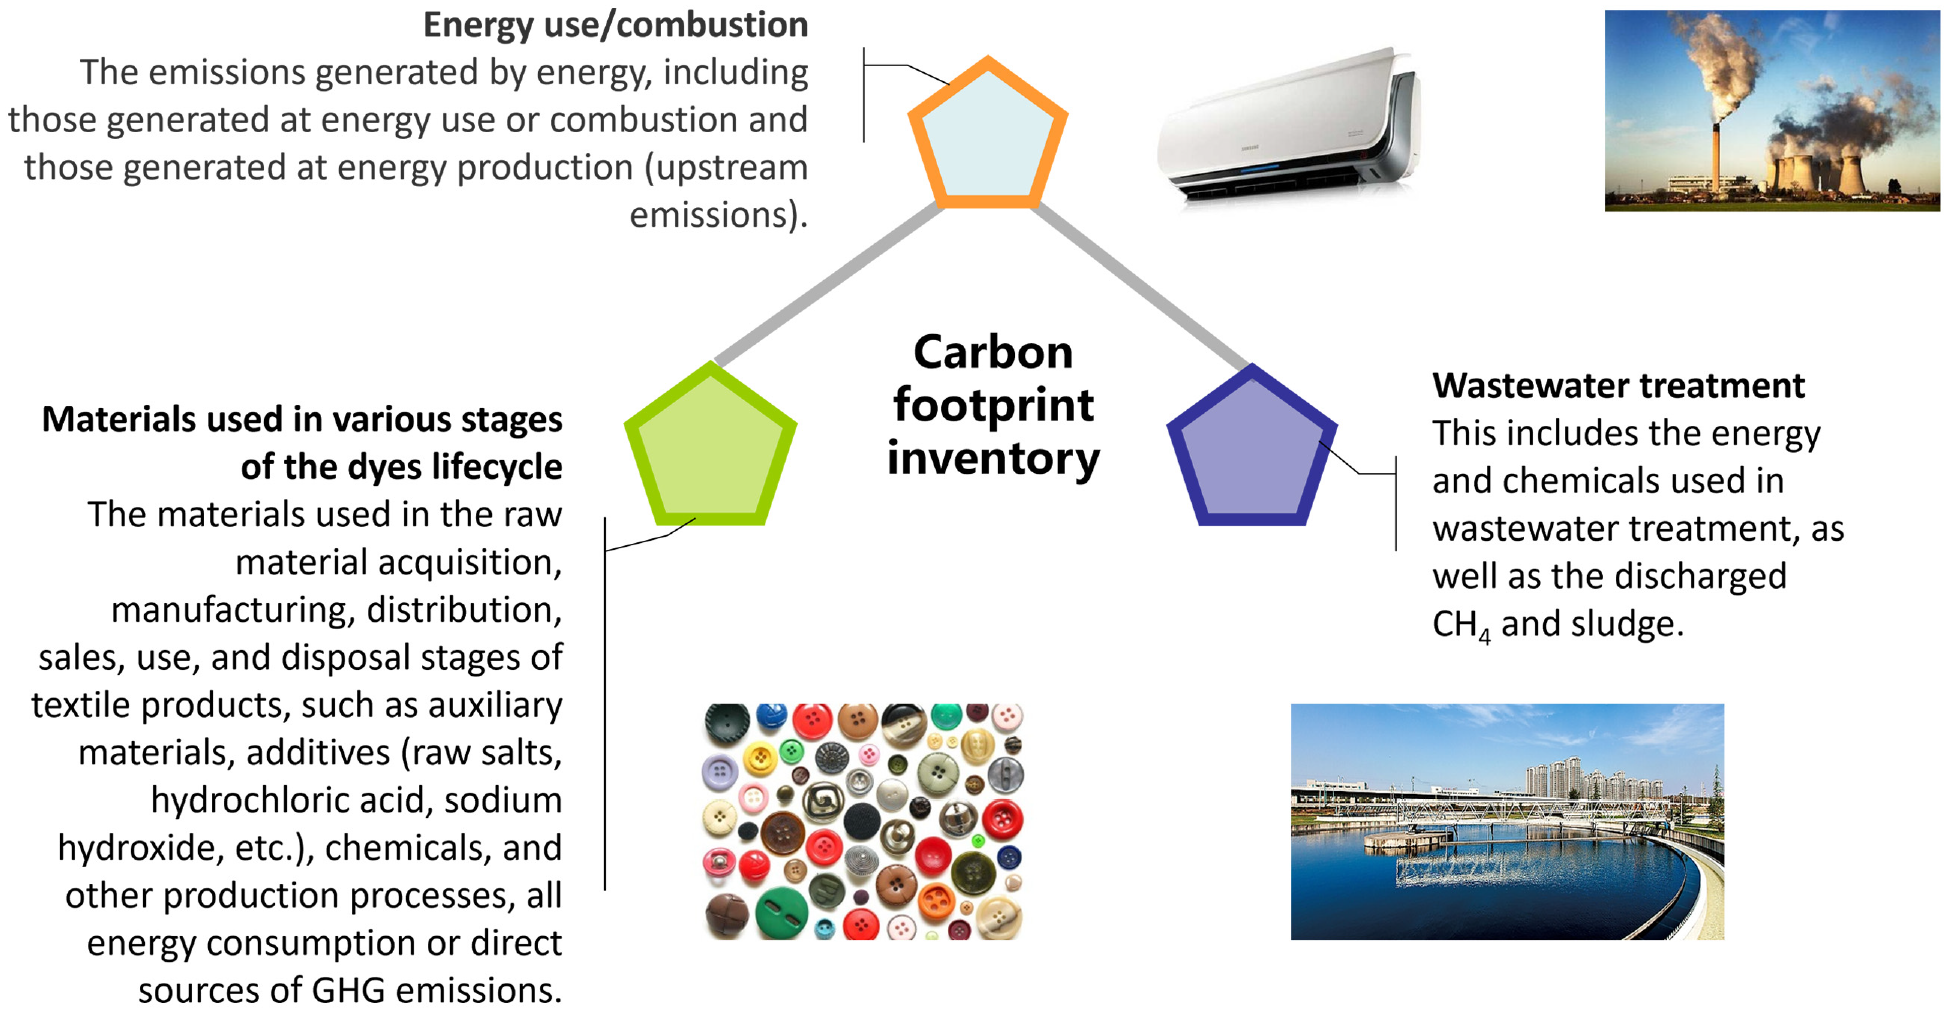
The carbon footprint inventory.
Framework of CF calculation
CF calculation for Energy and Material Inputs
The GHG emissions for energy and material inputs are estimated following equation (1):
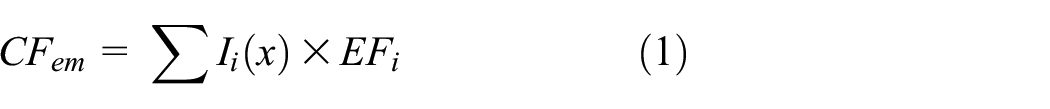
where
CF for Wastewater Treatment Process
In the waste treatment stage, the anaerobic sludge treatment method was applied and thus CH4 was generated. To estimate the CF for waste treatment, equation (2) is used based on IPCC: 40
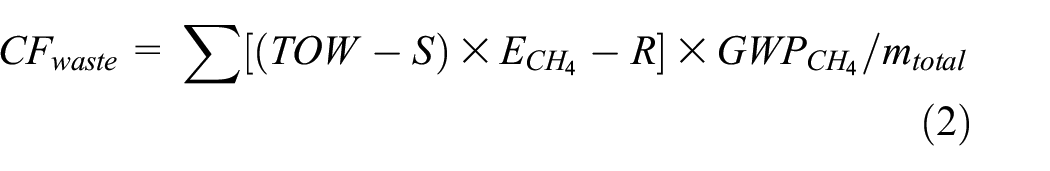
where
Here,

where

where

where
The values of
The variables used in the carbon footprint (CF) calculation of wastewater treatment.
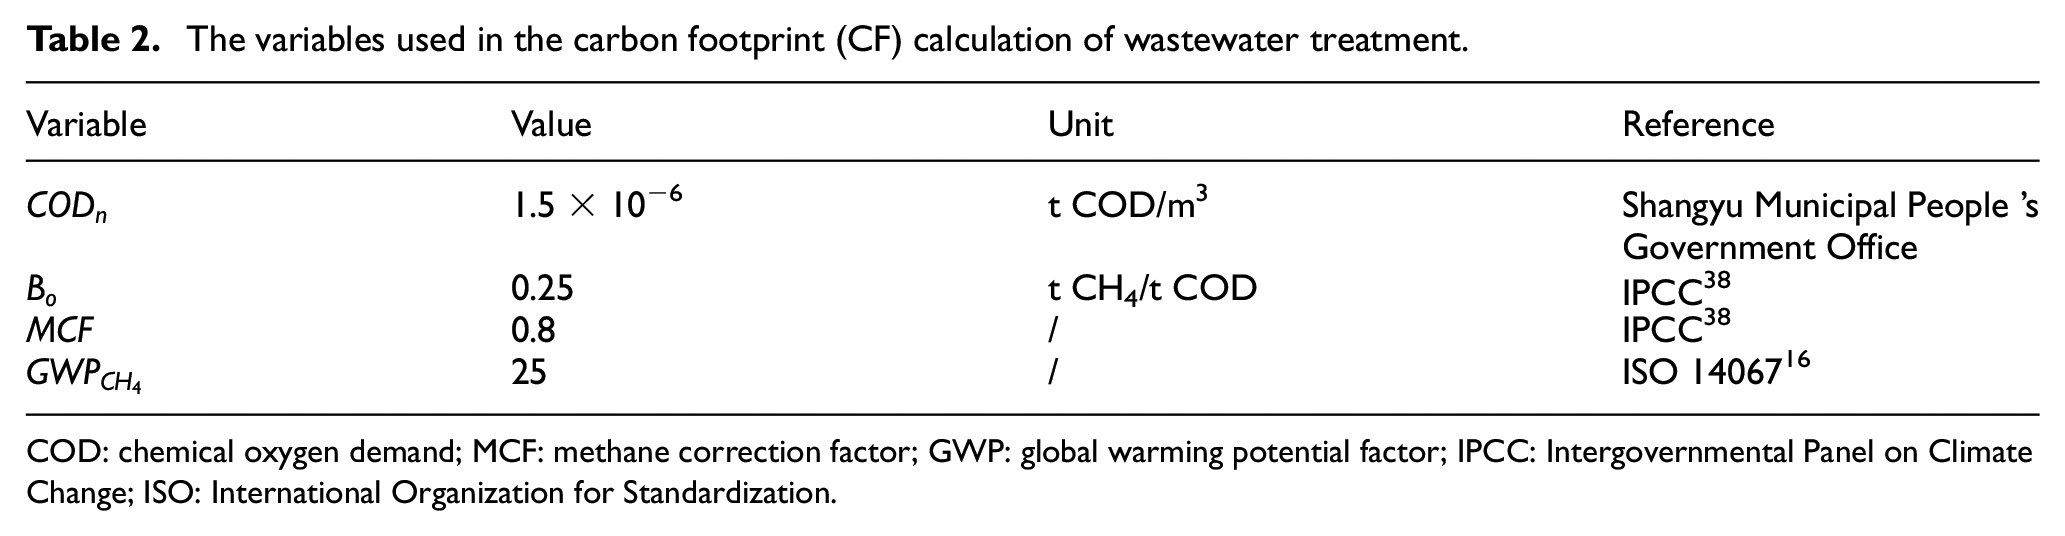
COD: chemical oxygen demand; MCF: methane correction factor; GWP: global warming potential factor; IPCC: Intergovernmental Panel on Climate Change; ISO: International Organization for Standardization.
Allocation Method
Multiple inputs and outputs of by-product are quite common in chemical production. As previously described, ammonium sulfate was produced in the wastewater recycling process. Therefore, it is crucial to consider the choice of proper allocation methodology. 25 According to the ISO standard, one approach should be to first try to avoid allocation. If this cannot be achieved, the physical value (mass, volume, and energy balance) or the economic relationship between the products is often used as the allocation indicator. 41 It is difficult to avoid allocation due to the profound differences in the production process and none of the alternative production systems are completely satisfactory. The economic allocation method is in some ways more problematic due to temporal and geographical variations. 42 The mass allocation method does not demand the collection and analysis of large amounts of extra data except for the actual mass value and has been widely used in the CF in previous studies. 40 In this case, mass value was adopted as the allocation indicator to deal with the outputs of the by-product. The allocation for multiple inputs or outputs among the target product and the by-products is estimated as following equation (6):
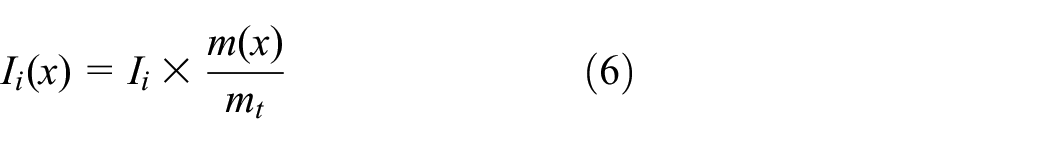
where
Emission Factors
The inputs and outputs were firsthand data from the dye company, consisting of the inputs to the processes (materials and energy) as well as the outputs from the processes (products, by-products, and the volume and quality of industrial wastewater discharged).
The emission factors for electricity, diesel, chemicals, and other materials are shown in Table 3. National-level emission factors were selected for the energy. For the electricity emission factor, the electric power emission factor for regional power grids issued by the National Development and Reform Commission 45 was used. The steam and diesel emission factors were obtained from two Chinese studies and the emission factors for chemicals and packing materials were obtained from the Gabi and Ecoinvent databases. However, the emission factors for some chemicals are still inadequate. Hence, a part of the chemicals emission factors in this study were simplified or substituted for the similar substances. As noted, Component A and Component B used in diazotization and coupling process are in the aniline category, and hence the emission factor for aniline was used for these items. The emission factors for sulfuric acid and ammonium sulfate were used for both nitrosyl sulfuric acid and ferrous sulfate due to the substance similarity.
The emission factors used in the study.
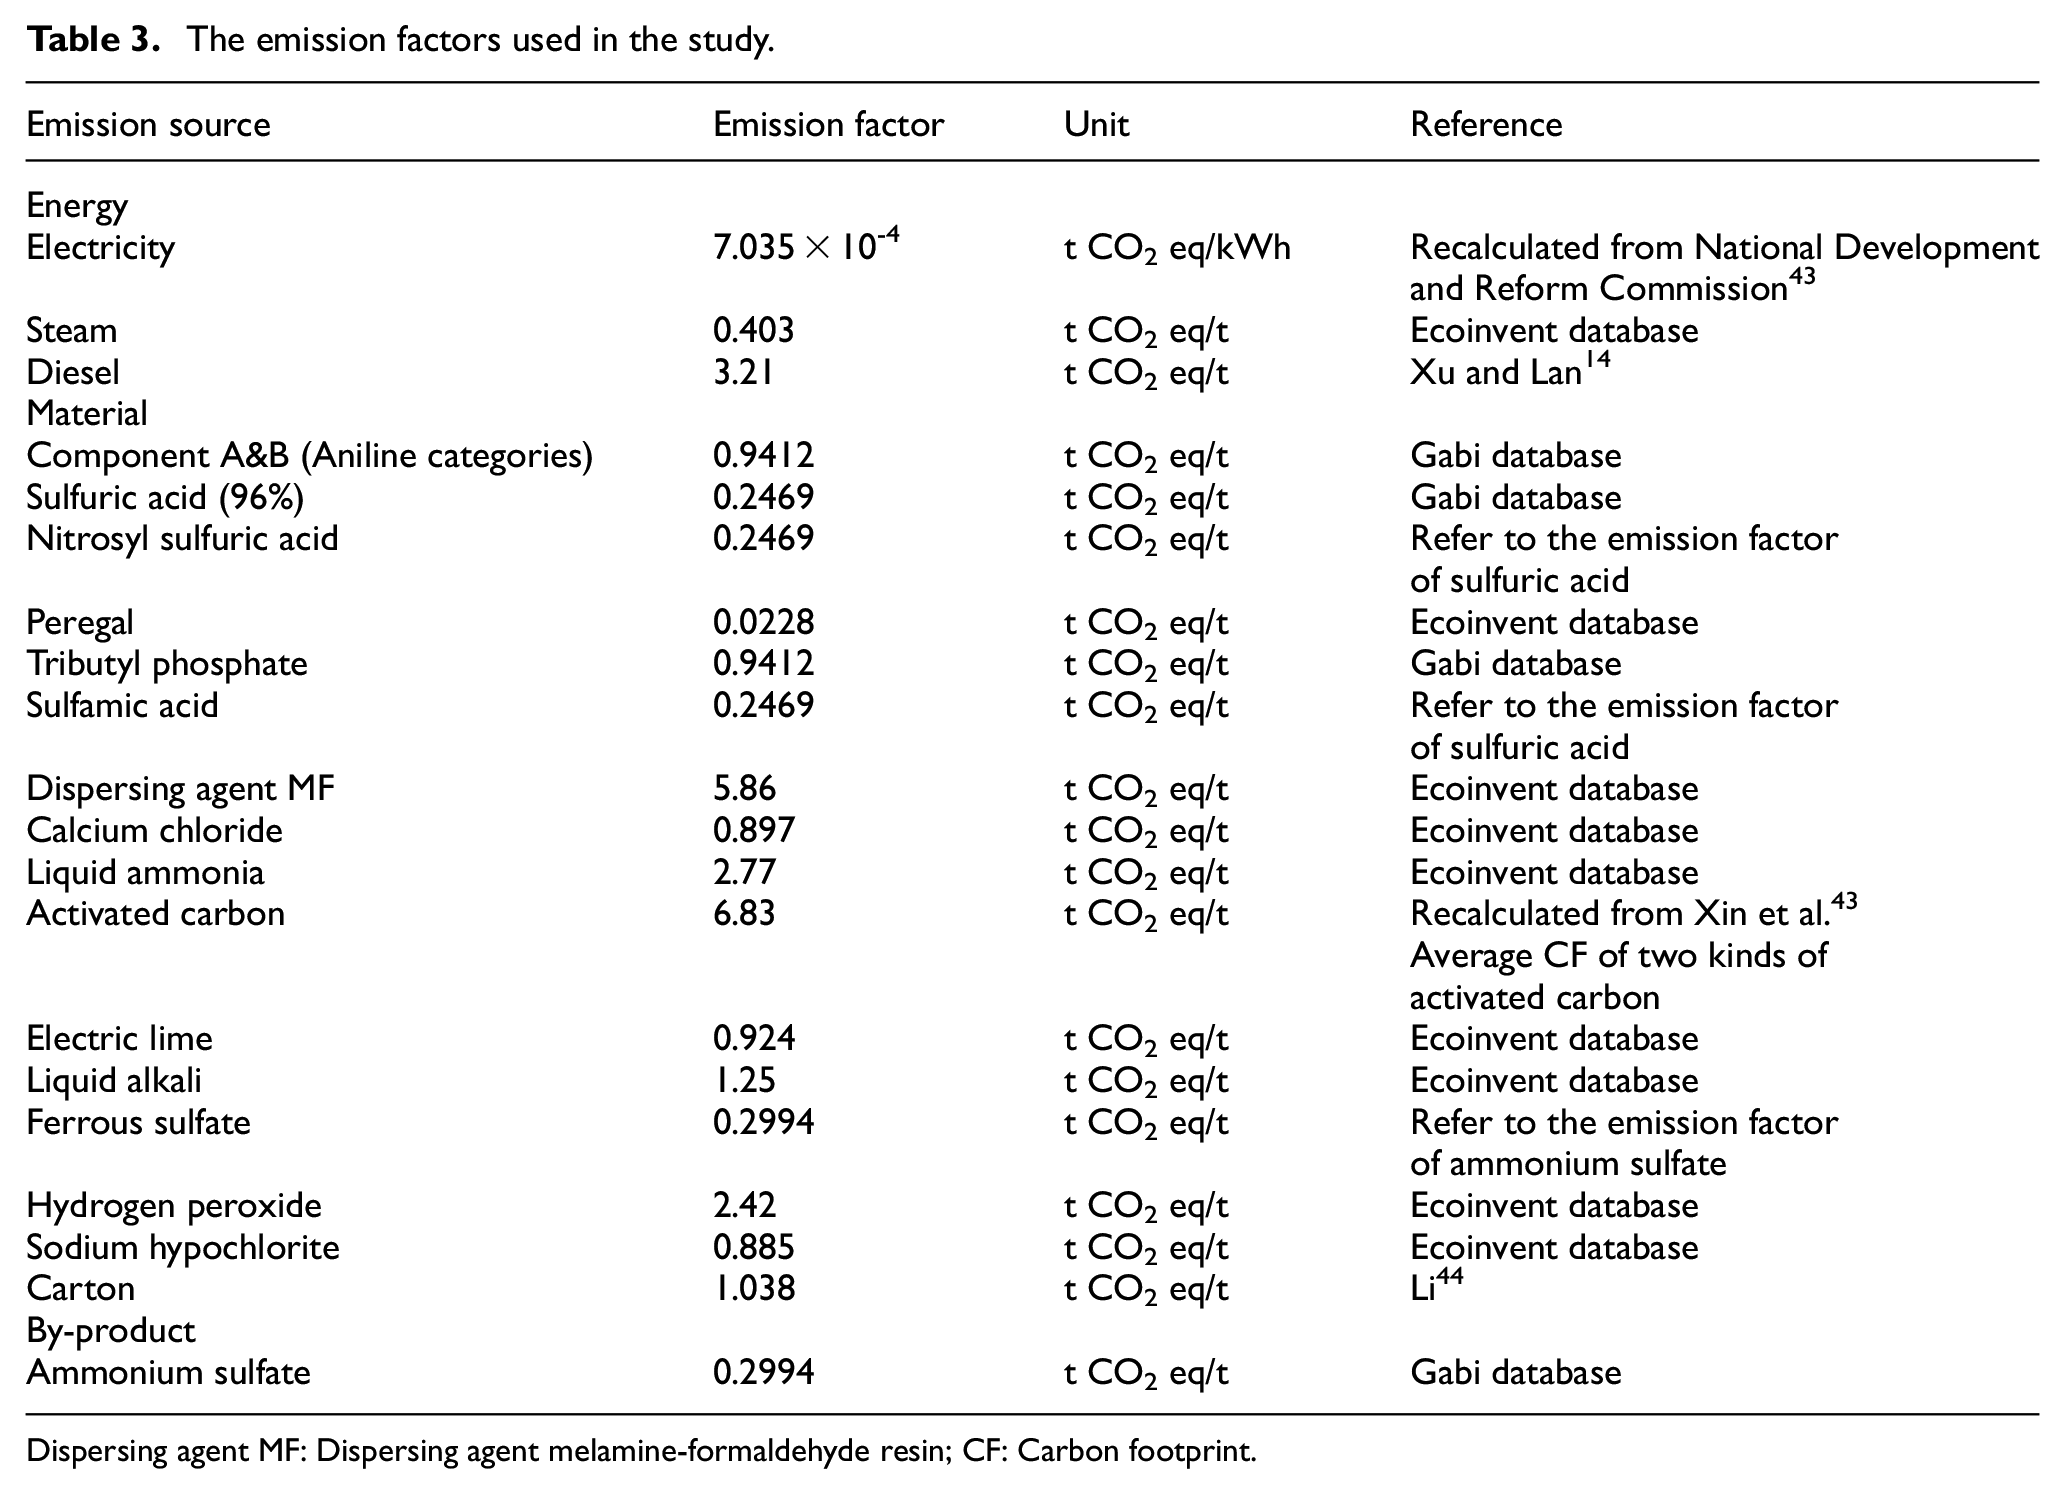
Dispersing agent MF: Dispersing agent melamine-formaldehyde resin; CF: Carbon footprint.
Results and Discussion
Comparison of CFs for Three Disperse Dyes
The CFs of the three disperse dyes were calculated according to the inventory data. The CFs for DB, DR, and DO were 8.28 t CO2 eq/t, 8.07 t CO2 eq/t, and 7.48 t CO2 eq/t, respectively, as shown in Appendix A. The percentages of carbon emissions from material inputs, energy inputs and wastewater treatment are shown in Figure 4. Material inputs accounted for the largest proportion of the emissions (over 65%) in the total CF, followed by energy inputs, and wastewater treatment. This indicates that the three dyes were similar in the distribution of the different sources. Among these three dyes, the emissions generated by wastewater treatment are the same, and the difference in emissions generated by energy is not significant, but the difference in emissions generated is relatively large (DB>DR>DO). Due to the lack of precise data on wastewater treatment, the annual average data were obtained, resulting in the same value for emissions generated by wastewater. Because of the different amounts of dispersing agent MF use, there were differences in the emissions of different colored dyes. Dispersing agent MF was the largest emission source. Dispersants are fillers and abrasives for dye strength. Because each dye has different strength, the content of dispersant added to each commercial dye is different to achieve a uniform strength, resulting in a large difference in the content of dispersant in commercial disperse dyes.
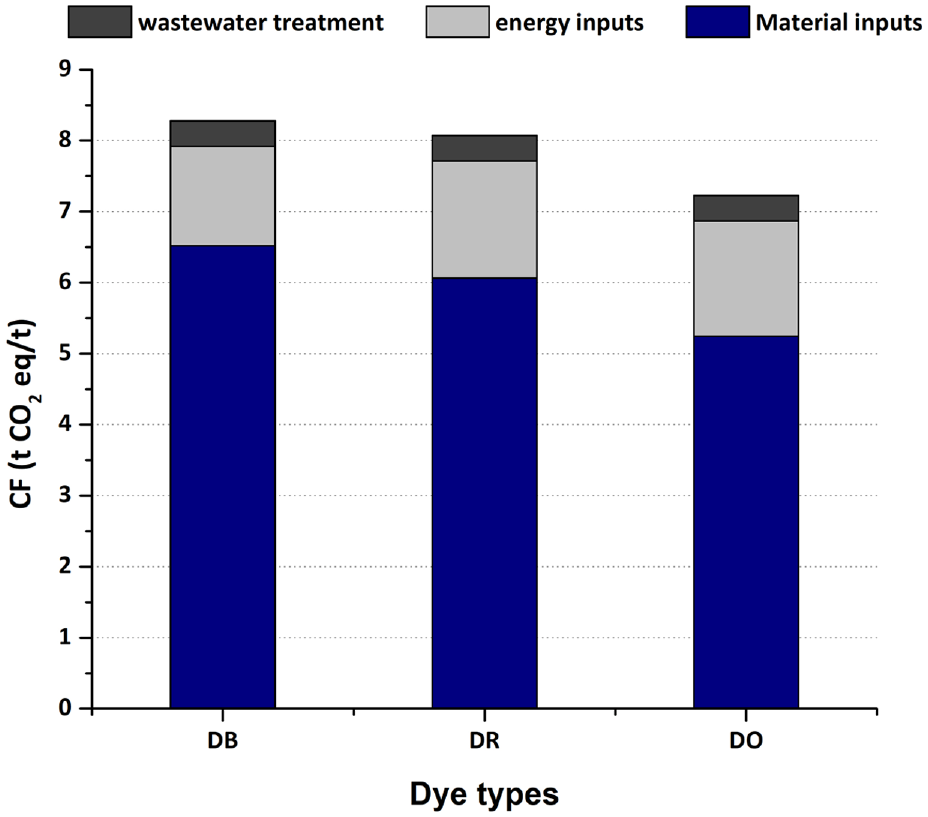
The percentage of different sources.
To determine the factors that account for the differences in the three disperse dyes, the carbon emissions from the different steps and sources were defined as the basic unit parameter (BUP) for assessment (Table 4). For instance, “E1” represents the amount of CF from electricity in the diazotization step, and “E15” represents the CF for the dispersing agent MF used in the homogenization step. It is noteworthy that the CF for the wastewater treatment for each dye was calculated on an average basis, and hence this is excluded in the following analysis. The CF and standard deviation (SD) for each BUP can be found in Appendix B. Figure 5 shows that E15 (CF of the dispersing agent MF used in the homogenization step) was clearly the most important parameter with the highest value of SD. Dispersing agent MF is an anionic dispersant that is a formaldehyde condensate of methyl naphthalene sulfonic acid. It is generally synthesized as industrial methyl naphthalene, which is sulfonated with sulfuric acid, then condensed with formaldehyde, neutralized with lime and liquid alkali, and filtered to obtain the finished product. However, due to the large amount of calcium sulfate waste generated in production, the environmental pressure increases, which resulted in high CF.
The coding of the basic unit parameters.
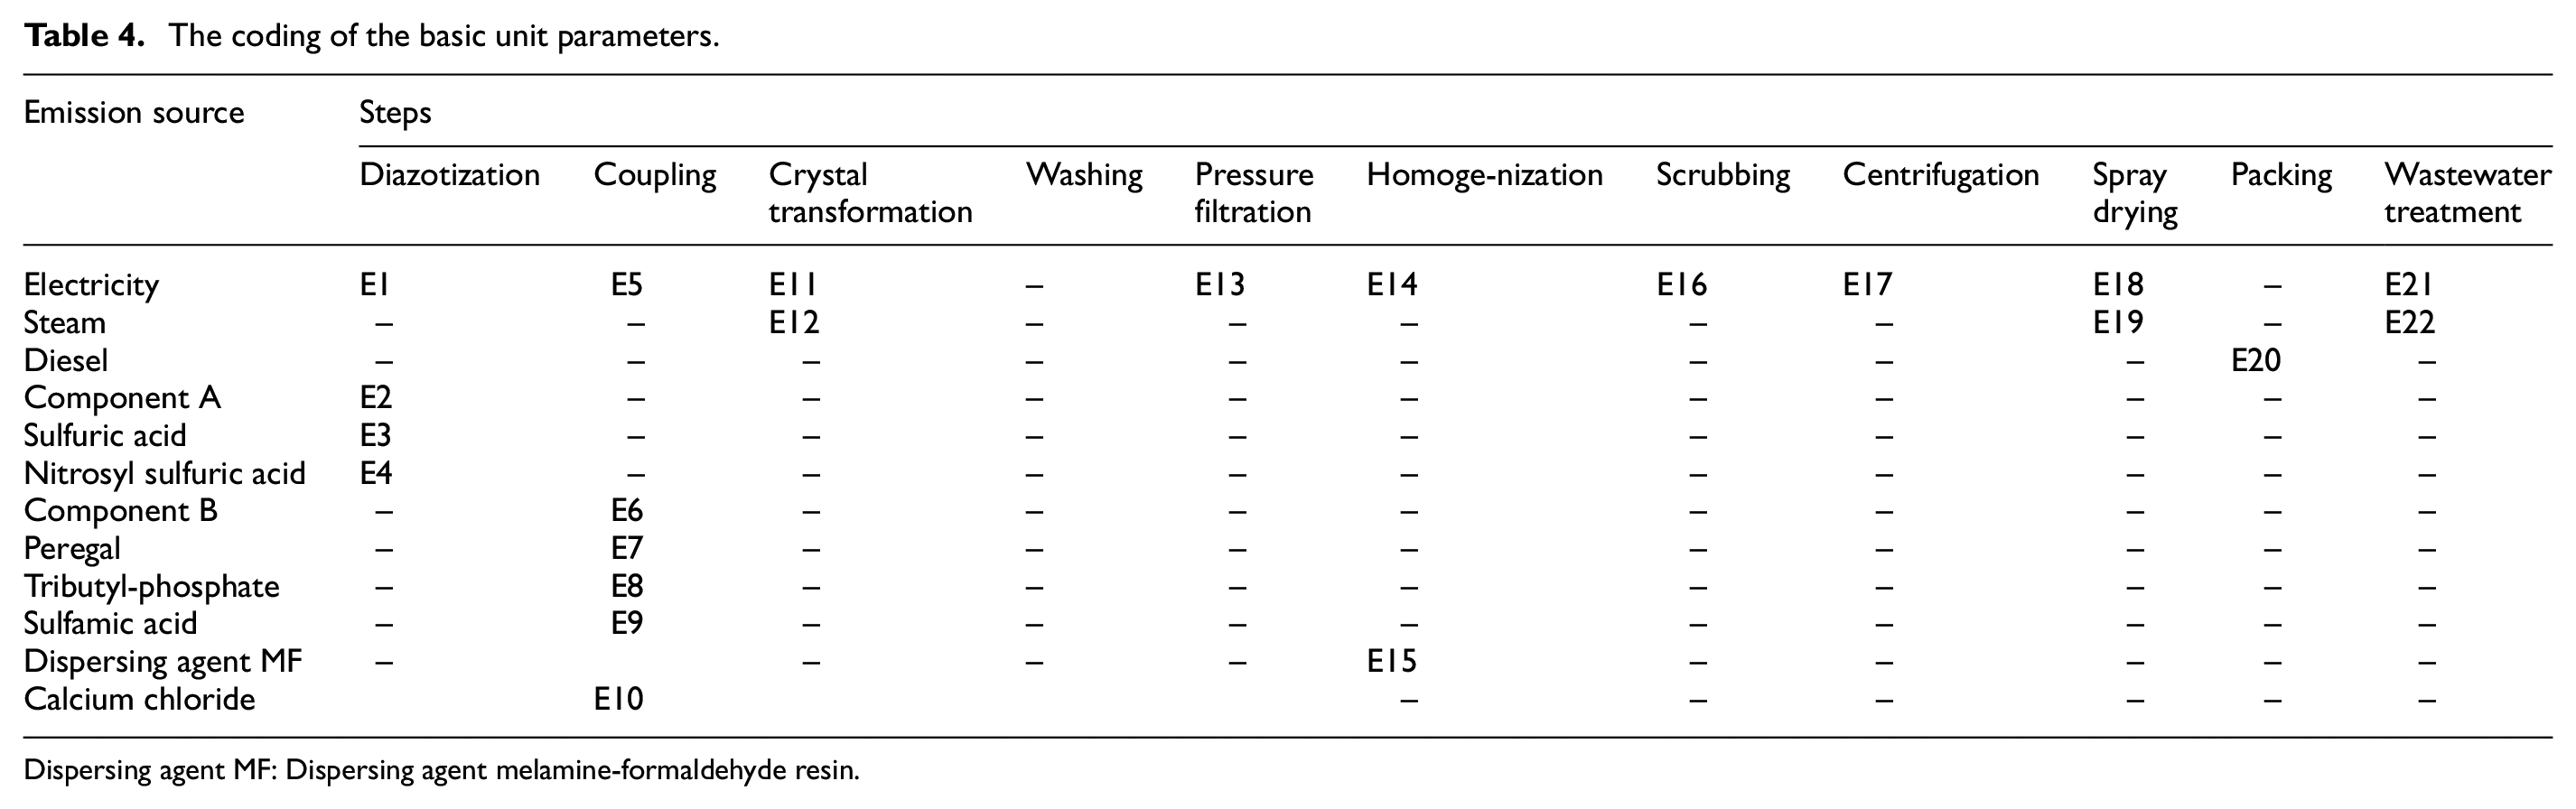
Dispersing agent MF: Dispersing agent melamine-formaldehyde resin.
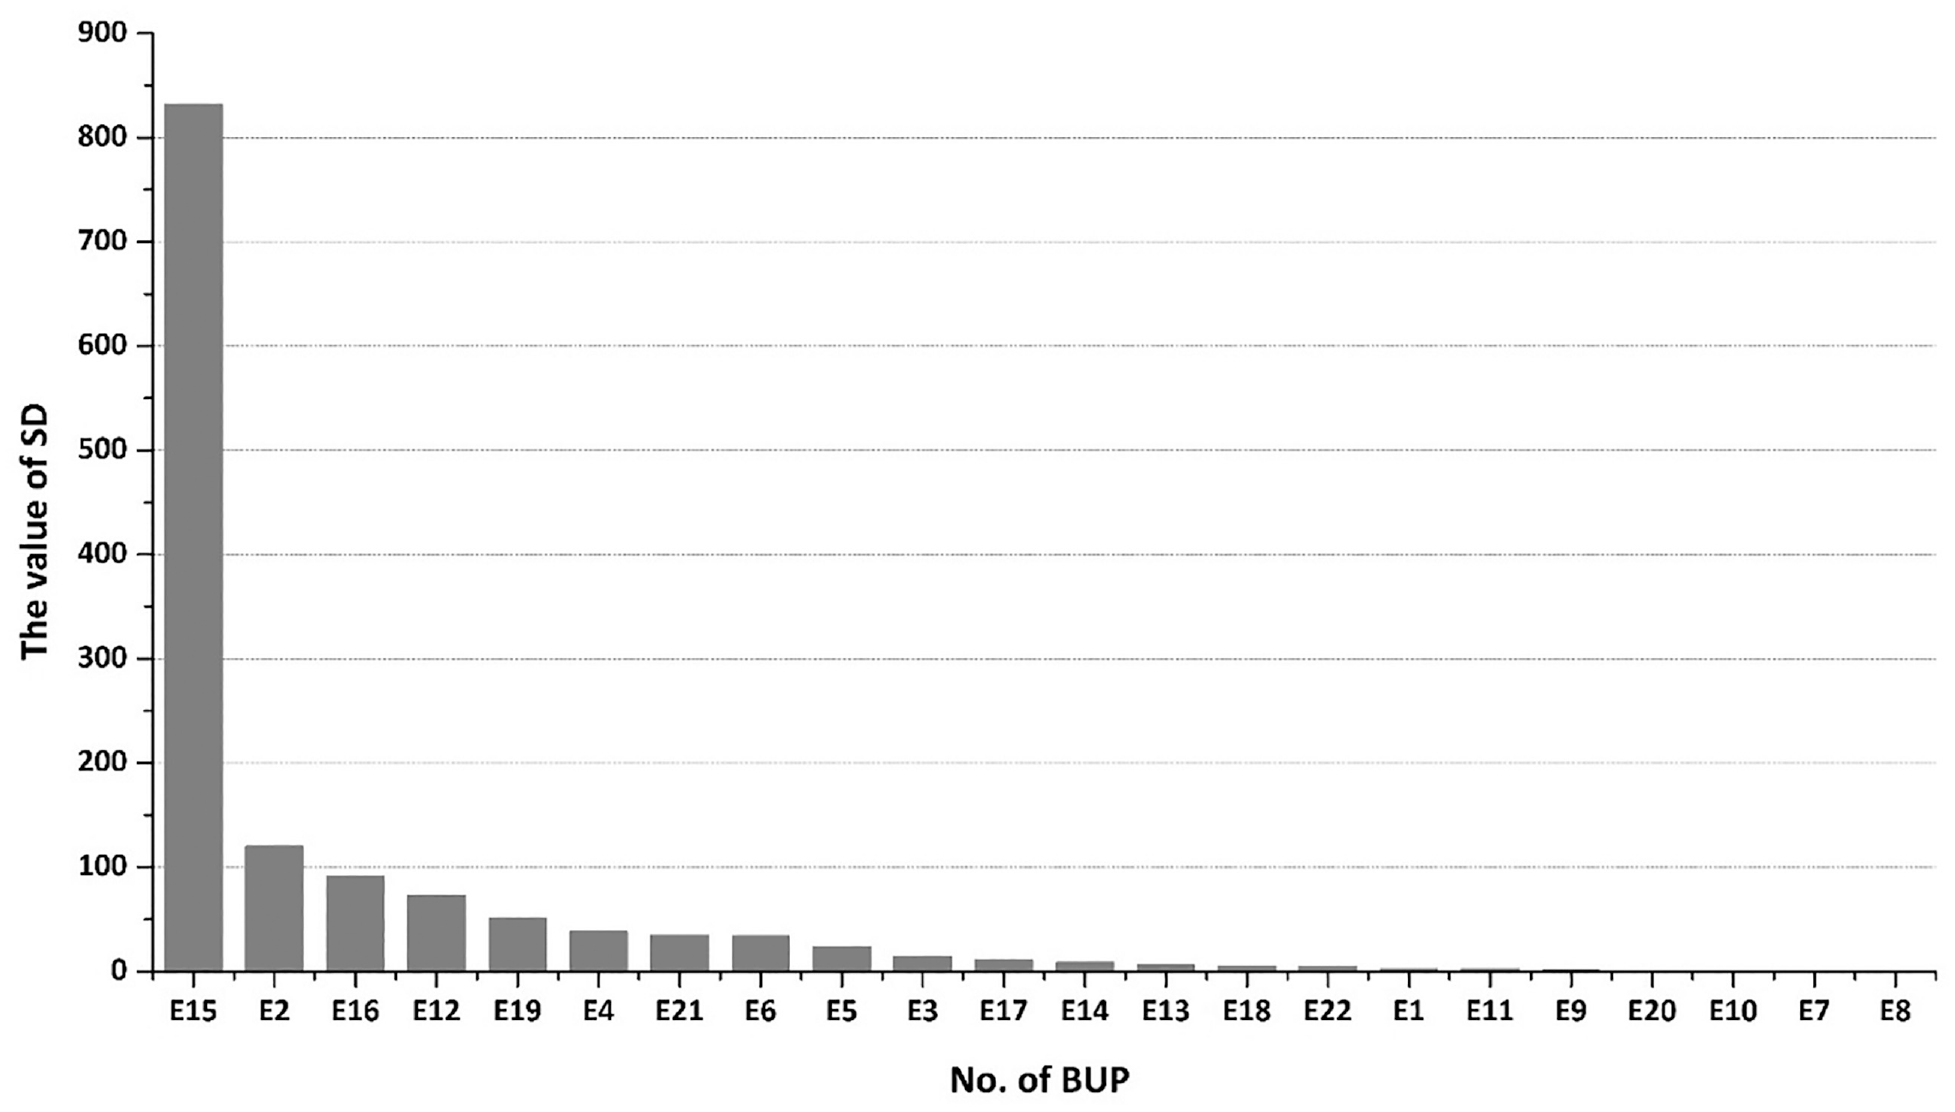
The SD value for each BUP (in descending order).
To produce 1000 kg of DB, DR, and DO dye, 780, 680, and 500 kg of dispersing agent MF were required, respectively. Thus, the different consumption of the dispersing agent MF in the three dyes is the main reason for the differences in their overall CF. E2 (the CF for the component A used in the diazotization) was also an important material-induced parameter. The consumption and type of component A is mainly decided by the type of the end product and the chemical reaction occurring during the process. Therefore, the quantity consumed in each dye results in differences for each product. E16 (the electricity-induced CF in the scrubbing step), E12 (the steam-induced CF in the crystal transformation step) and E19 (the steam-induced CF in the spray drying) were also important parameters accounting for differences in the three dyes. The impacts of other BUPs were much less than these discussed above.
Comparison of Different Emission Sources
The results showed that the three dyes were similar in the distribution of the different emission sources. Therefore, DB is used as an example to show the detailed carbon emission sources, as illustrated in Figure 6. It should be noted that material consumption was the major contributor (74.92%) to the CF of disperse dyes, followed by energy consumption (20.95%) and wastewater treatment (4.13%). The GHG emissions from dispersing agent MF consumption was the dominant component (70.14%) in material consumption. Dispersing agent MF was one of the largest dyeing assistants used in disperse dye production with every 1000 kg DB requiring 780 kg of dispersing agent MF. The emission factor of dispersing agent MF is also very high, amounting to 5.86 t CO2 eq/t. Because of the large use of dispersing agent MF, the utilization rate of powdered disperse dye is low and floating dyes are more, which leads to the high-water consumption, wastewater discharge, waste residue and energy consumption in polyester printing and dyeing. In future production, green process technology or clean dispersants can be explored. Liquid ammonia and activated carbon were also important resources in material consumption. However, the purpose of these inputs is to recycle the mother liquor and generate a by-product, ammonium sulfate. Therefore, the GHG emissions for these materials can be offset by the mass allocation method as mentioned earlier. The remaining resources were less than 5%. Steam and electricity were the two major sources of GHG emissions caused by energy use during dye production, accounting for 52.29% and 47.63%, while the GHG emissions from diesel were extremely low due to the minimal consumption (0.08%). Due to the fact that most of the current electricity comes from coal-fired power, resulting in high GHG emissions, clean energy sources such as photovoltaic power, biomass energy can be used in future production to reduce the GHG emissions. GHG emissions came from CH4 generated in the wastewater treatment result in the smallest part of the total CF. The high chemical consumption results in a high COD value of the sewage, which produces CH4 in the presence of anaerobic degradation.
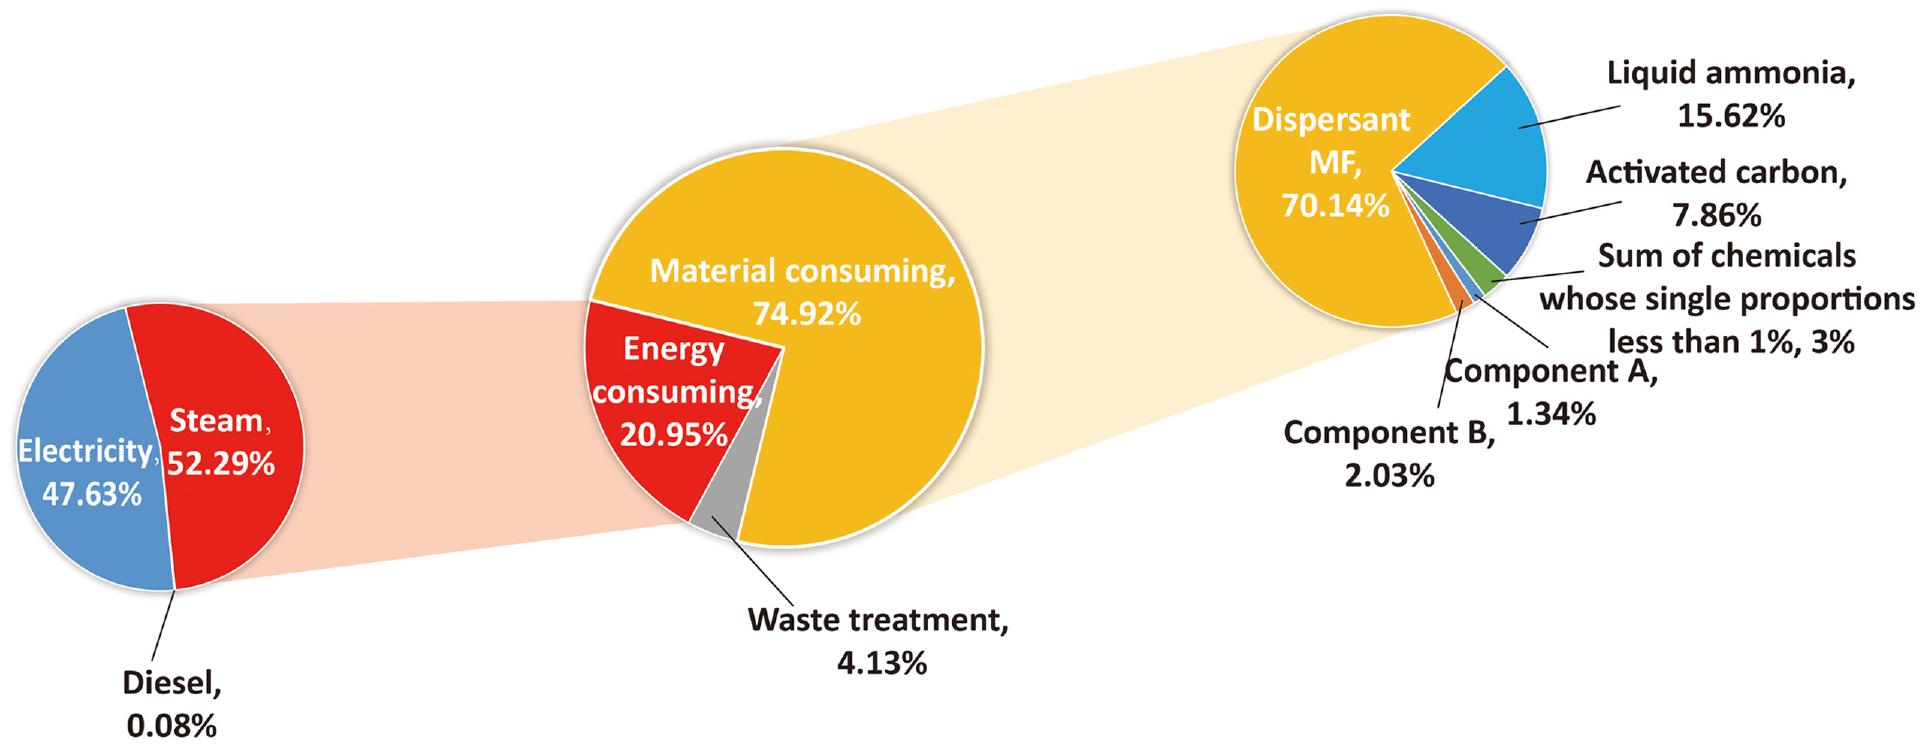
The detailed carbon emission sources for DB.
Product CFs From Different Production Process
The CFs for the three disperse dyes during the processing stage are shown in Figure 7. The ratios of the CF for each process for three products were similar because the process flow was the same. Homogenization had the largest contribution to the CF (55.44% for DB; 49.75% for DR, and 39.63% for DO), followed by wastewater treatment (29.03% for DB; 29.07% for DR, and 32.14% for DO) and the spraying dry process (9.16% for DB; 10.75% for DR, and 10.88% for DO). In the case of homogenization, this is mainly because the dispersing agent MF was used during this process as described above. Large numbers of dispersing agent (such as MF, NNO, etc.) are the main reason that restricts the development of low-wastewater and low-waste-residue printing and dyeing technology. Therefore, in recent years, developing liquid disperse dye instead of powdered disperse dye is the key to solving the high pollution source of disperse dyes production. The biggest advantage of liquid disperse dye is to replace the dispersing agent in powder dyes with a large amount of water, which can meet the requirements of dyeing performance. At the same time, it can also achieve the effect of energy conservation and emission reduction. Wastewater treatment was another important source of the CF, containing both the CH4 generated during the anaerobic sludge treatment (12.7%) and consumption of the sewage treatment agents (87.3%). The wastewater discharged from the production of disperse dye is characterized by large changes in water quality and quantity, high concentration of pollutants, complex composition, high salinity, and high content of bacteriostatic substances. It is a typical high concentration, high salinity, and refractory wastewater. Therefore, it is possible to consider using ozone oxidation treatment, electrocatalytic method, and other methods to reduce carbon emissions in wastewater treatment. It may also be useful to consider implementing CH4 capture and to promote the recycling rate of wastewater. The emissions in the spray drying step came from the consumption of steam and electricity. According to the results, the steam-induced CF was mainly due to the spray drying process. The steam is used to remove moisture from the intermediate product through convection, which is a necessary step in the dye production. The steam comes from coal or electricity, resulting in high GHG emissions. Clean energy sources can be used emission generation to reduce the GHG emissions. The CFs in the other steps were relatively low in comparison to the above processes.
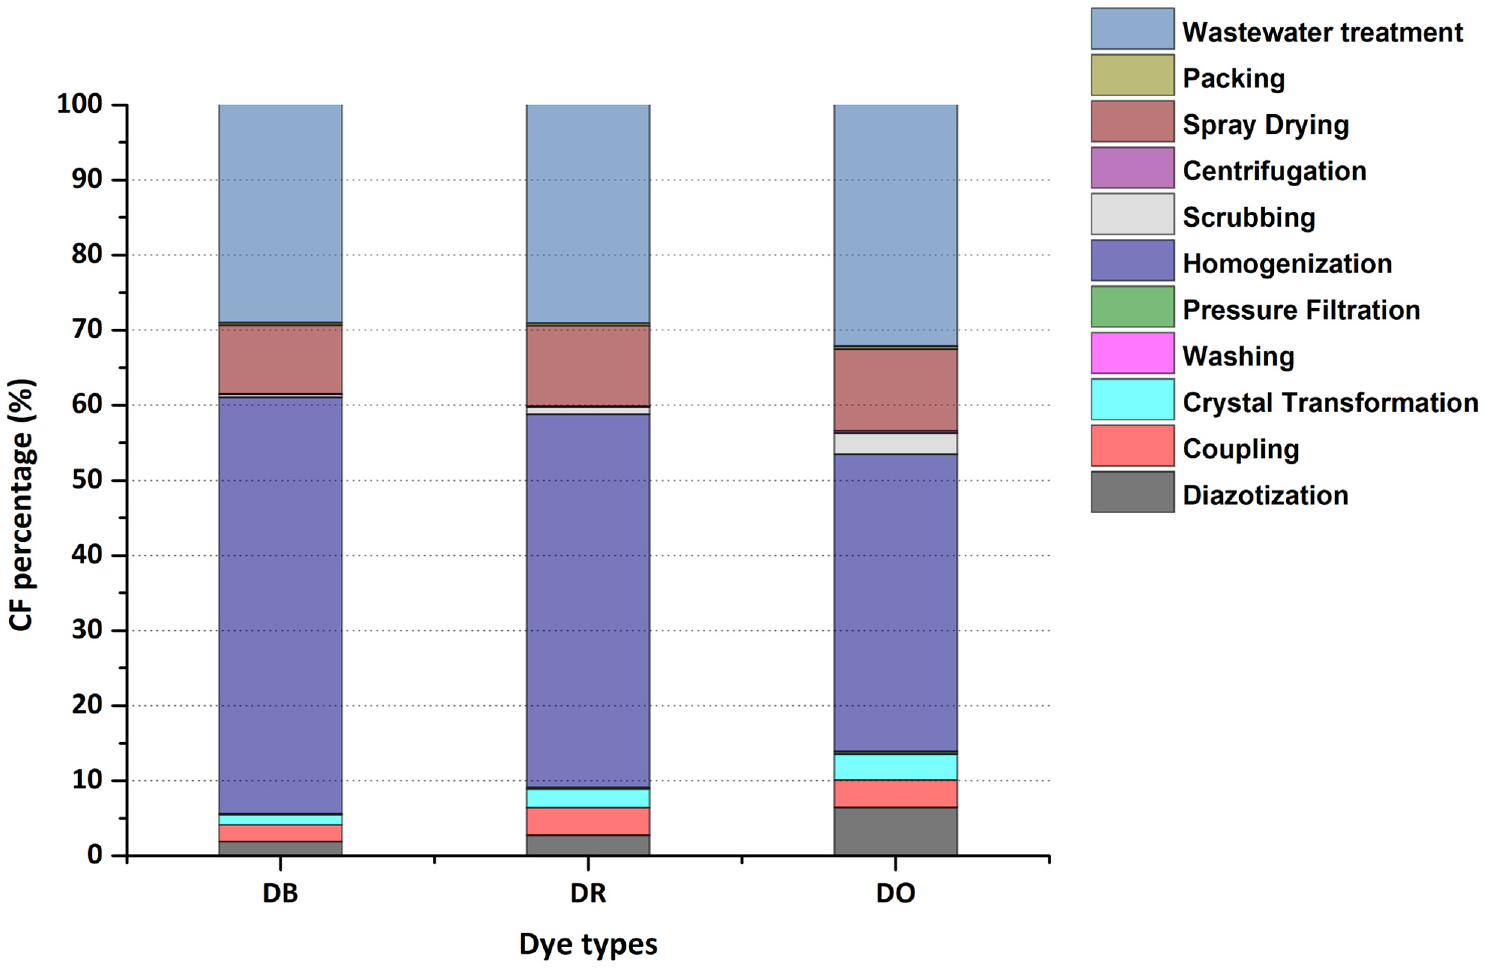
The CF percentage for the different production process.
Sensitivity Analysis
In order to investigate and measure the effectiveness of parameters with the greatest influence on the CF value, a sensitivity analysis was performed. Most studies have applied a sensitivity analysis on the LCA results to account for the substantial variation in input data, reporting the variation in the final results obtained. 46 The sensitivity analysis is carried out to determine the effect of varying parameters on the overall environmental impact. 45 The result of the analysis is helpful to find the gorge of high-CF process. The One Factor At A Time (OAT) model is applied for the assessment. 48
For this purpose, one original scenario and three groups of scenarios were developed. The original scenario was the CF for the three disperse dyes calculated according to Section 2. By comparing the original scenario with the three groups of scenarios, the effectiveness of parameters can be determined. The first group of scenarios investigated the influence of energy emission factors. The second group of scenarios reviewed the effect of material emission factors. The third group of scenarios inspected the effect of changes in the mother liquor recovery rate. In the first and second scenarios, it was assumed that the emission parameters varied by ±10% in comparison with the original values for sensitivity analysis. Generally, the varied range of the emission parameters is ±10% to ±50%. After testing under ±10%, the significant impact of uncertainty of parameter changes can be obtained. Therefore, the emission parameters varied by ±10% in this article. In the third scenario, it was assumed that the mother liquor recovery rate varied by ±10% in comparison with the original rate for sensitivity analysis.
The final CFs for the three disperse dyes were calculated according to different scenarios, as shown in Table 5. The sensitivity analysis of the parameters is shown in Table 5. It can be concluded that the total CFs of the three disperse dyes has risen with an increase in the energy and material emission parameters. On the contrary, the total CF for the dyes decreased with an increase in the mother liquor recovery rate. This indicates that improving the mother liquor recovery rate can effectively reduce emissions. The results from the sensitivity analysis of the factors for the three products were basically similar apart from those for the dispersing agent MF. This is due to the significant differences in the quantity of dispersing agent MF used in the production of the three dyes as mentioned earlier. The total CF was most sensitive to dispersing agent MF change which means that a 10% change in dispersing agent MF resulted in a change of around 4% in the total CF value. Steam, liquid ammonia, and electricity also had an impact on CF while the other factors had little impact (a change of less than 1%). It is recommended to enhance the reaction efficiency of chemical agents and reduce the requirement for these substances. Promoting the production of these chemicals is also helpful, and the development of green chemicals with the same properties is to be encouraged to substitute the present ones. Although energy did not account for the largest portion of the CF, there is still potential to reduce the carbon emissions generated during energy production or adopting clean energy. Advanced technologies should be applied to enhance the utilization of steam and low-power equipment should be adopted to reduce the consumption of electricity.
Sensitivity analysis of the parameters.
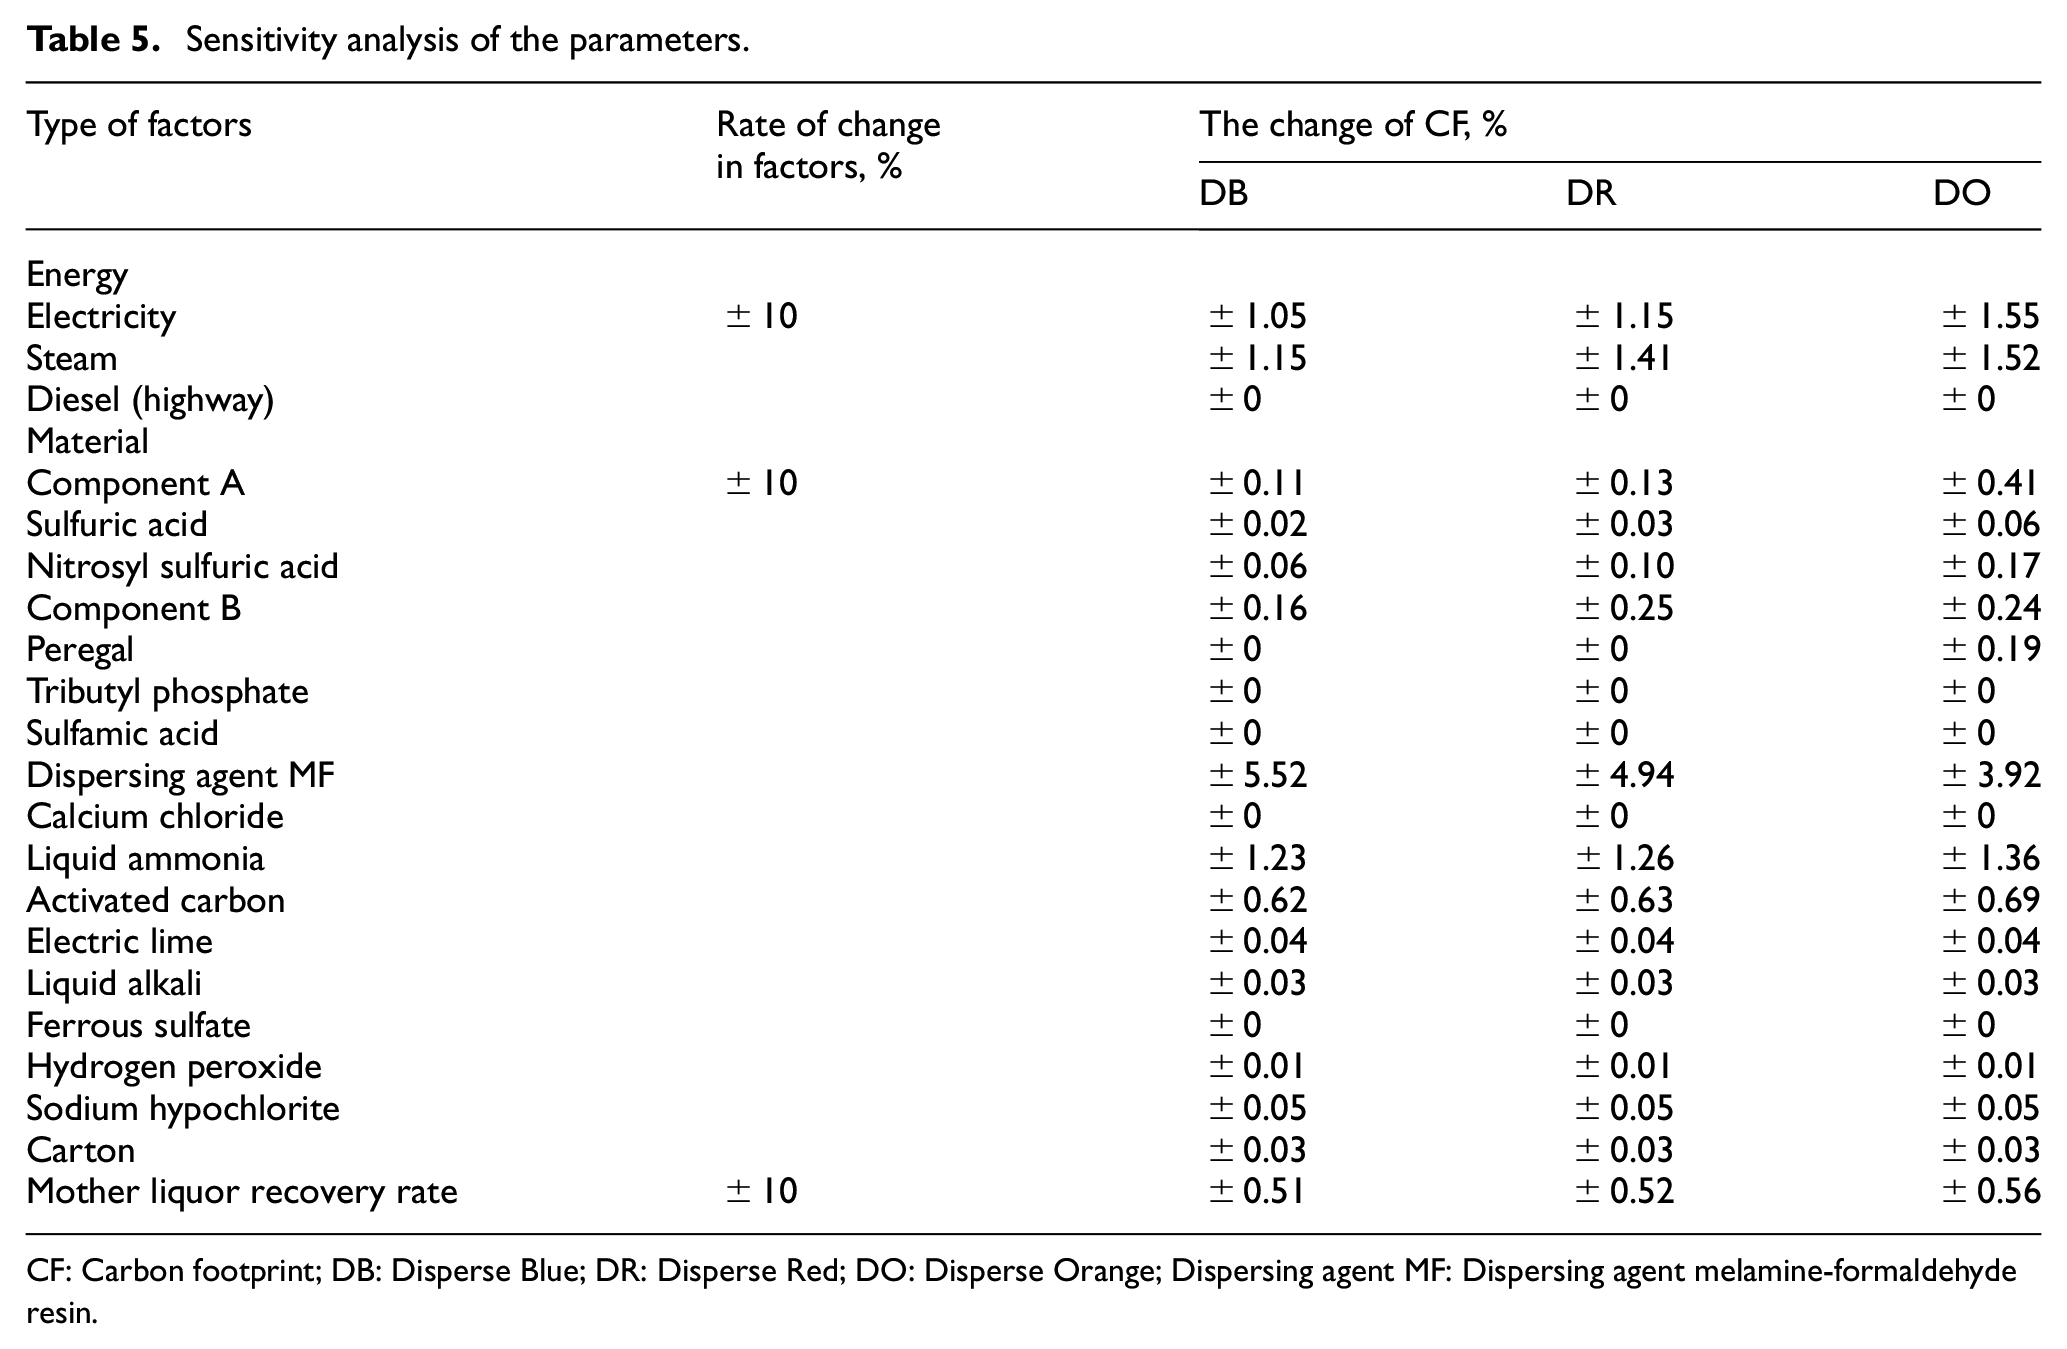
CF: Carbon footprint; DB: Disperse Blue; DR: Disperse Red; DO: Disperse Orange; Dispersing agent MF: Dispersing agent melamine-formaldehyde resin.
Improvement Opportunities
In the case of disperse dyes, considerable quantities of chemicals were consumed in production and therefore there was a large material-induced CF accounting for 66.07%–74.63% of the total CF. Thus, decreasing the use of chemicals is a feasible approach to reduce carbon emissions. Among these chemicals, the dispersing agent MF was the largest contributor to the CF and influences the CF significantly due to the high consumption and high emission factor. Therefore, it is suggested to enhance the reaction efficiency during the homogenization step, as well as to develop energy-saving and material-saving production processes. In addition, the development of green chemicals with lower emission factors to replace dispersing agent MF should be encouraged. Developing liquid disperse dye instead of powdered disperse dye is the key to solving the high pollution source of disperse dyes production.
The CF resulting from the production of electricity and steam was relatively low, accounting for 22.17%–30.70% of total emissions. However, the usage of electricity and steam had a markable impact on the CF. Electricity was used in almost all the processing steps, and the wastewater treatment stage consumed the most electricity. This is due to the wide variety of equipment used, such as the blowing machine, the lifting pump and the heat exchanger. Thus, the promotion of green electricity use is recommended. It is suggested that the current sewage treatment equipment could be replaced by energy-saving equipment. Since most steam was consumed in the spray drying step to remove moisture from the intermediate product, there is the potential to develop and apply a more effective steam regeneration technology.
The CF was attributed to the sewage treatment where considerable amounts of CH4 were discharged. In order to reduce these CH4 emissions, the production team could attempt to identify cleaner chemicals that can be used to reduce pollution in the discharged sewage. It may also be useful to consider implementing CH4 capture and to promote the recycling rate of wastewater.
Limitation of This Study
There are some limitations to this article. First of all, several stages in the entire life cycle of dyes were not included in the system boundary, such as warehousing, energy generation (fuel, heat, etc.), recycling, transport outside the factory, the use phase and disposal. Also, due to the inadequate database, some emission factors of chemicals for this study had to be substituted for values for similar substances. The accuracy of the result could be improved by obtaining more accurate emission factors. It should also be noted that the total CF order for the three dyes is DB > DR > DO and their color brightness order is DB < DR < DO. 49 Therefore, it assumes that the CF might be influenced by the brightness of the dye’s color. This assumption should be investigated further by applying more samples of different colors.
Conclusion
The LCA approach in the disperse dyes industry must be considered and implemented. There is a need to calculate and analyze the disperse dyes GHG emissions through the CF method. This study developed a CF calculation method for the disperse dyes. The method discussed the system boundary, functional unit, inventory analysis, calculation, allocation method and emission factors. The potential hotspots were identified, and it also provides the reference carbon emission factors for the accurate CF of the textile and petrochemical products calculation. Based on the results, following conclusions can be drawn, and these findings helps guide decision-making process toward more sustainable practices:
The CFs of the three products were 8.28 t CO2 eq/t for DB, 8.07 t CO2 eq/t for DR, and 7.48 t CO2 eq/t for DO. This indicates that the three dyes were similar in the distribution of the different sources. For the three products, material inputs accounted for the largest GHG emissions source (over 65%) of the total CF, followed by energy inputs and wastewater treatment.
The homogenization and the wastewater treatment processes were the two largest emission emitters for the three disperse dyes while the CF of other processes is relatively low. The GHG emissions from dispersing agent MF and liquid ammonia consumption were the dominant factors in the material usage for the three disperse dyes. The steam and electricity were the two major sources of GHG emissions caused by energy used during dye production. The results show that eco-friendly dispersing agent MF, liquid ammonia, electricity, and steam can be used to reduce the CFs of the three dyes.
From the sensitivity analysis results, the total CF was most sensitive to change in the dispersing agent MF followed by steam, liquid ammonia, and electricity with the other factors having little impact on CF (less than 1% change). The sensitivity analysis shows that improving the mother liquor recovery rate can effectively reduce emissions.
This study contributes to the deep understanding of the GHG emission impacts for three different disperse dyes, guiding decision-making toward sustainable optimization. The results show that disperse dyes production have great potentials for improvement. Therefore, the optimization of the production process and technology for dispersing agent MF, liquid ammonia, electricity, and steam can significantly reduce the CFs of the disperse dyes production. In future production, green process technology or clean dispersants can be explored. And clean energy sources such as photovoltaic power, biomass energy can be used to reduce the GHG emissions. Besides, it is possible to consider using ozone oxidation treatment, electrocatalytic method, and other methods to reduce carbon emissions in wastewater treatment. Advanced technologies should be applied to enhance the utilization of steam and low-power equipment should be adopted to reduce the consumption of electricity.
To test the approach and confirm its feasibility in the dyes industry, other researchers should investigate the method and publish their results. Compared with electronic or machinery industry, the informatization level in dyes industry is low. Most enterprises are small- and medium-sized which have not installed real-time meters or ERP system in China. The data of CF-related data are scarce, and real-time meters should be developed to achieve more accurate accounting results. In addition, the lack of data for transportation and usage stage are challenging issues that calls for quantitative solution.
Supplemental Material
sj-docx-1-aat-10.1177_24723444231212954 – Supplemental material for Climate Change and the Textile Industry: The Carbon Footprint of Dyes
Supplemental material, sj-docx-1-aat-10.1177_24723444231212954 for Climate Change and the Textile Industry: The Carbon Footprint of Dyes by Xin Li, Lisha Zhu, Xuemei Ding, Xiongying Wu and Laili Wang in AATCC Journal of Research
Footnotes
Acknowledgements
Special thanks are extended to the anonymous referees and the Editor-in-Chief of this journal for their valuable and constructive comments on the paper. The authors also thank their contacts at the manufacturers for helping them to collect the data.
Declaration of conflicting interests
The author(s) declared no potential conflicts of interest with respect to the research, authorship, and/or publication of this article.
Funding
The author(s) disclosed receipt of the following financial support for the research, authorship, and/or publication of this article: This paper was supported by the following bodies: Shanghai Science and Technology Committee through project 21640770300, Hangzhou Philosophy and Social Science Planning Project (grant no. M23JC054), Soft Science Research Project of Zhejiang Provincial Innovation Center of Advanced Textile Technology (grant no. ZX2022002R), Science Foundation of Zhejiang Sci-Tech University (grant no. ZSTU) under Grant (grant no. 23072077-Y, 22202009-Y), National Innovation Training Program for college students (grant no. 202310338026).
Data availability
The data that supports the findings of this study are available within the article and its supplementary material.
Supplemental material
Supplemental material for this article is available online.
References
Supplementary Material
Please find the following supplemental material available below.
For Open Access articles published under a Creative Commons License, all supplemental material carries the same license as the article it is associated with.
For non-Open Access articles published, all supplemental material carries a non-exclusive license, and permission requests for re-use of supplemental material or any part of supplemental material shall be sent directly to the copyright owner as specified in the copyright notice associated with the article.