
Abstract
The raw material acquisition stage of wool involves raising sheep and a large amount of input and output, resulting in substantial greenhouse gas emissions. To date, the research literature on wool carbon footprint is limited, and there is a lack of research on Victoria. These studies did not consider the influence of changes in weight and productive lifespan. This study aims to address this knowledge gap by calculating the wool carbon footprint in Victoria and improving the calculation method. In this article, 20,000 sheep in Victoria were investigated. The average weights of the sheep were obtained by curve fitting and calculating. Two scenarios with 5-year and 6-year productive lifespans were used to calculate the carbon footprint of merino wool by the mass allocation method, economic allocation method, and protein mass allocation method. Results revealed that the carbon footprint of wool for the 5-year and 6-year productive lifespans were 14.158–49.040 kg carbon dioxide equivalent (CO2-e)/kg wool and 16.743–52.882 kg CO2-e/kg wool. Rumination and excretion accounted for the largest proportion, followed by phosphate fertilizer, electricity, and potash fertilizer. The longer the productive lifespan and the heavier the sheep, the greater the greenhouse gas emissions from rumination and excretion, leading to a larger carbon footprint for wool. For the same productive lifespan, the economic allocation method produced the highest carbon footprint for wool compared to the mass allocation method, which produced the lowest carbon footprint. This study provides a reference for the subsequent carbon footprint accounting of wool from cradle to farm-gate and helps the wool industry save energy and reduce emissions.
Introduction
As global resources and non-renewable energy continue to be consumed, a series of environmental problems such as climate change, energy shortage, and pollution are becoming increasingly pressing. As an industry with large energy consumption and greenhouse gas emissions, the textile industry is one of the important sources of global greenhouse gases. Wool has been widely used in the modern textile industry since ancient times. Among textile fibers, wool has excellent flexibility, flame retardancy, and moisture absorption, and is the main material of various clothing and high-quality fabrics (sweaters, socks, curtains, carpets, and bedding).1,2 The market share of wool products is large, and wool enterprises are the most profitable enterprises in the trade of various countries. 3 In 2021, the global sheep population has risen to 1.266 million, from which 1949.5 million kg (mkg) of greasy wool and 1033.5 mkg of clean wool were produced. 4 Wool accounts for about 1.2% of the global textile market share and is becoming increasingly popular. 5 Australia is the largest producer of wool in terms of clean weight, with greasy wool production reaching 356,745 tons in 2021, accounting for 18.3% of the global market. 4 The acquisition of wool needs to go through the raw material acquisition stage, that is, the sheep raising stage. Sheep are small ruminants whose rumen is a large fore stomach with a continuous fermentation system and are major emitters of methane (CH4). 6 During the raw material acquisition stage of wool, various energy and material inputs, as well as sheep’s rumination and excreta activities, emit greenhouse gases into the atmosphere. Once greenhouse gases are generated, they accumulate in the atmosphere for a long period of time. As a result, various issues such as sea level rises and climate anomalies caused by global warming will seriously damage the environment and human society. The quantification of greenhouse gas emissions during the raw material acquisition stage has become a global concern. The carbon footprint is a quantitative measure of an activity’s greenhouse gas emissions, which is helpful for the assessment of emission management and mitigation measures. 7 It has become a key issue in assessing the environmental protection performance of wool.
The study of the “footprint” theory began with the ecological footprint proposed by Wackernagel and Rees. 8 The concepts of “Ecological footprint,”“Carbon footprint,” and “Water footprint” are used to study the impact of human activities on the ecological environment. Based on the global concern of greenhouse gas emissions, the carbon footprint is currently the biggest focus in the field of “footprint” research. At present, there are relatively few studies on the carbon footprint of wool. Australia is a major wool producer in the world. Wiedemann et al., 9 Cottle and Cowie, 10 and Brock et al. 11 studied the carbon footprint of wool in New South Wales, Australia. Wiedemann et al. 12 studied the carbon footprint of wool in Western Australia, Australia. In addition to these places, Victoria is also the main wool production area in Australia. During 2021–2022, the total sheared greasy wool production in Victoria was 73.9 mkg. The sheep population in Victoria was about 16.1 million. Victoria is the second largest wool-producing state in Australia, currently producing 22.8% of all Australian wool. 13 Biswas et al. 14 studied the carbon footprint of Victoria, Australia, but the data in the literature were collected 15 years ago and were relatively old. Different literature used different methods to calculate the carbon footprint of wool at the cradle to farm-gate stage. Wiedemann et al.9,15 and Peri et al. 16 calculated the carbon footprint of wool using the Intergovernmental Panel on Climate Change (IPCC) method. Cottle and Cowie 10 calculated the carbon footprint of wool based on the measurement data method of nitrogen monoxide in Australia by Galbaly et al. 17 Eady et al. 18 and Brock et al. 11 used FarmGas to calculate the carbon footprint of wool. Most of the literature used IPCC or software modeling methods to calculate the carbon footprint of wool, but the existing studies did not consider the influence of changes in sheep weight, productive lifespan (the productive lifespan of sheep may be defined as the time from birth to death), and other factors on the carbon footprint of wool in the calculation process.
To date, a few scholars have studied the carbon footprint of wool during the cradle to farm-gate stage. This stage involves the raising and the physiological activities of sheep such as rumination and excretion, which is an important stage for the carbon footprint accounting of wool products. Published studies have focused on carbon footprint calculation and assessment in New South Wales, Western Australia, and other places. On the one hand, as the second largest wool producing region in Australia, there is a lack of research on the carbon footprint of wool in Victoria, Australia. 13 On the other hand, the changes in sheep weight and productive lifespan are not considered in this study. To address these knowledge gaps, this study was based on ISO 14067 and PAS 2050 standards, selected global warming potential indicators, and used the application system of product life cycle assessment (CNTAC-LCAPlus) software in the textile and clothing industry to study the carbon footprint of wool during the cradle to farm-gate stage in Victoria, Australia.19,20 In this study, 20,000 sheep in Victoria were selected as the research objects. First, the weights of sheep were fitted, and then the carbon footprints of wool were calculated by the mass allocation method, economic allocation method, and protein mass allocation (PMA) method for 5 and 6 year productive lifespans.
Materials and Methods
Goal and Scope
Functional Unit
In this study, the carbon footprint was reported for a functional unit of 1 kg merino wool, which is the most commonly used unit in product trading and market price quotation. 21 Merino wool was produced in Victoria, Australia, which is abundant in wool. Victoria is geographically favorable with an average annual rainfall of 500–600 mm. Soils are sandy loams of low fertility and often poorly drained outcrops. Some alluvial soils are found on the flatter parts. The altitude is 30–300 m, which is suitable for the raising and growth of sheep, and the quality of wool is good. 22 The wool produced is clean and suitable for processing into textiles. We reported emissions per unit of product (kg carbon dioxide equivalent (CO2-e) per kg greasy wool), as is common practice in LCA, rather than by area (ha) of land in production.
System Boundary
To calculate the carbon footprint of 1 kg greasy wool, we conducted a cradle to farm-gate LCA for 1 kg greasy wool using a global warming impact category. The system boundary of wool is shown in Figure 1. The setting of the system boundary was conducive to improving the comparability with the literature results. 23 The system boundary of the LCA consisted of two main phases: pre-farm and on-farm. The pre-farm phase included the production of inputs such as fertilizer, electricity, pesticides, and herbicides, as well as the combustion of diesel to transport the inputs to the farm. On-farm activities included all sheep activities and were based on a 12-month field study (March 2021 to February 2022) carried out on pastures in Victoria. Farm establishment and infrastructure construction were not included. Biogenic carbon, which was part of the annual carbon cycle, was assumed to be in equilibrium, so that changes in vegetation and soil carbon, carbon in agricultural products, and carbon respired by soil microbes and livestock were not included within the system boundary.
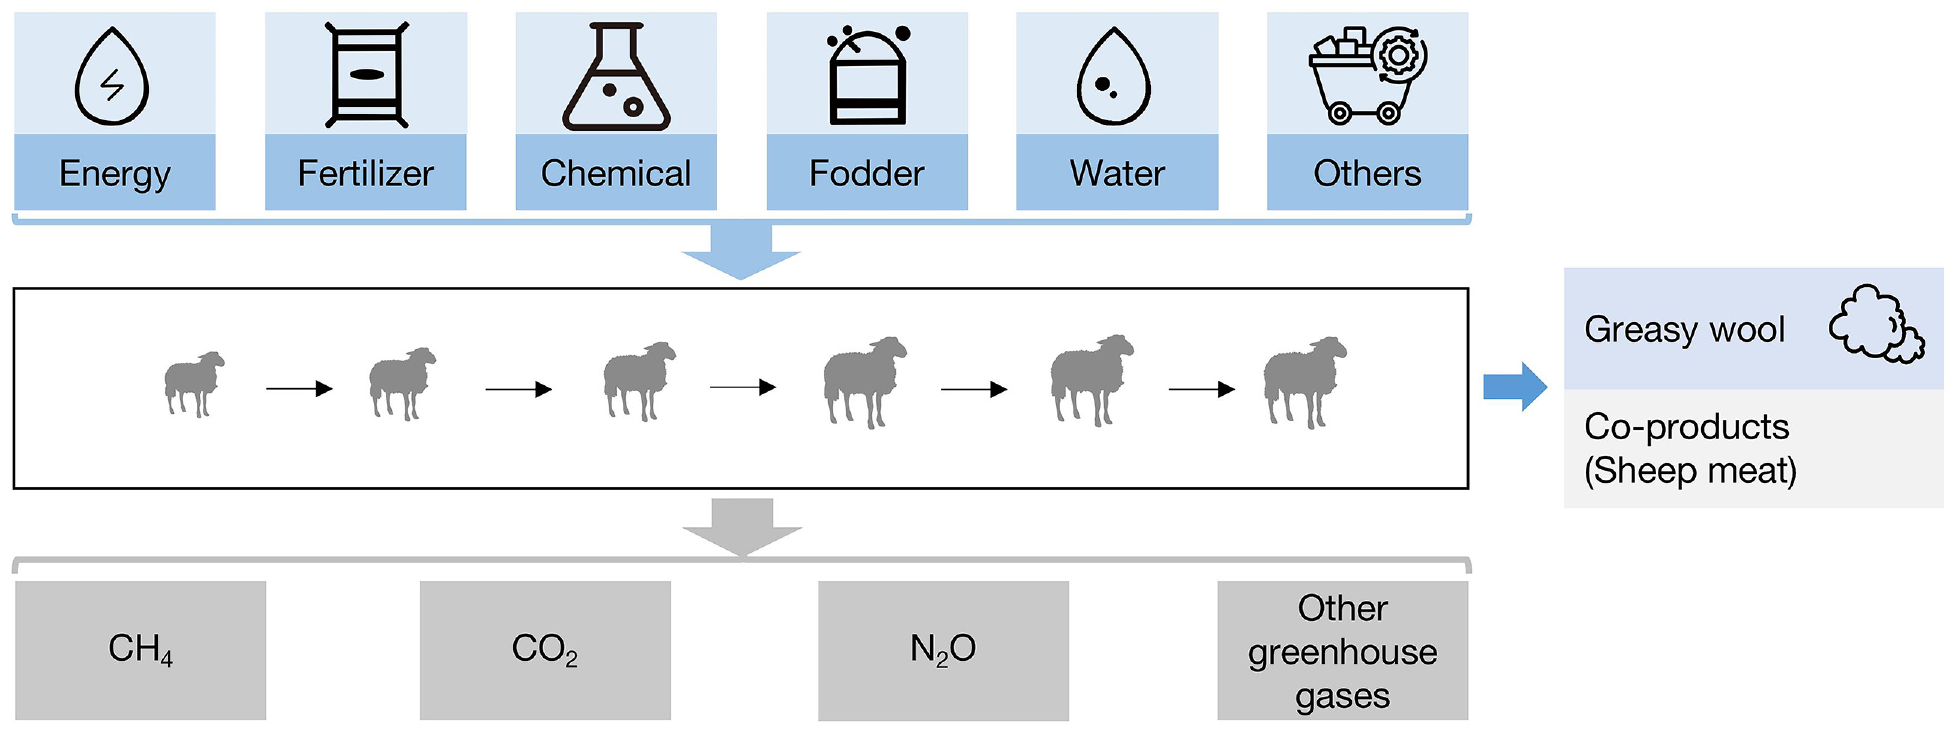
The system boundary of wool from cradle to farm-gate.
Inventory Data
The data were collected from farms in Victoria where fine merino wool was produced for a variety of luxury clothing. The field data were actual production data obtained through site collection and historical archival. The methodology was to conduct site visits, interviews, and surveys of farms over 12 months in 2021–2022 to collect detailed production data, livestock inventory, and input data. The data included livestock inventory, energy consumption in the production, the amount of raw and auxiliary materials used, the use of packaging materials and the waste generated, the transportation distance of raw materials and packaging materials from the place of manufacture to the place of use, and the transportation distance of products from the place of production to the distribution point. The background data included production data of the main auxiliary materials, pollutant emission data, and environmental impacts caused by different transportation types. Due to the difficulty of background data collection, the data in the application system of product life cycle assessment in the textile and clothing industry (CNTAC-LCAPlus) were used in this study.
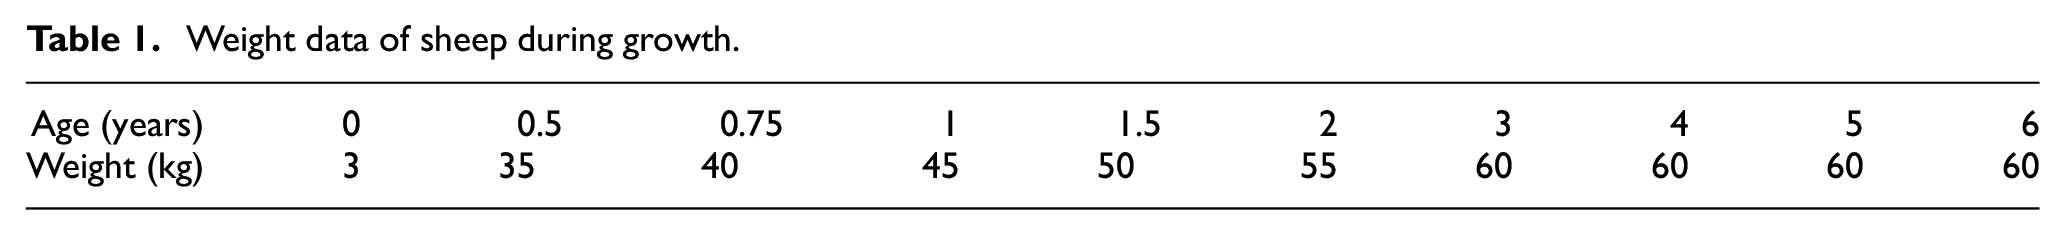
The weight information of the sheep is shown in Table 1. The weight of the newborn sheep was 3 kg and gradually increased with age. At 3 years of age, the sheep’s weight reached a maximum of 60 kg and remained stable.
Weight data of sheep during growth.
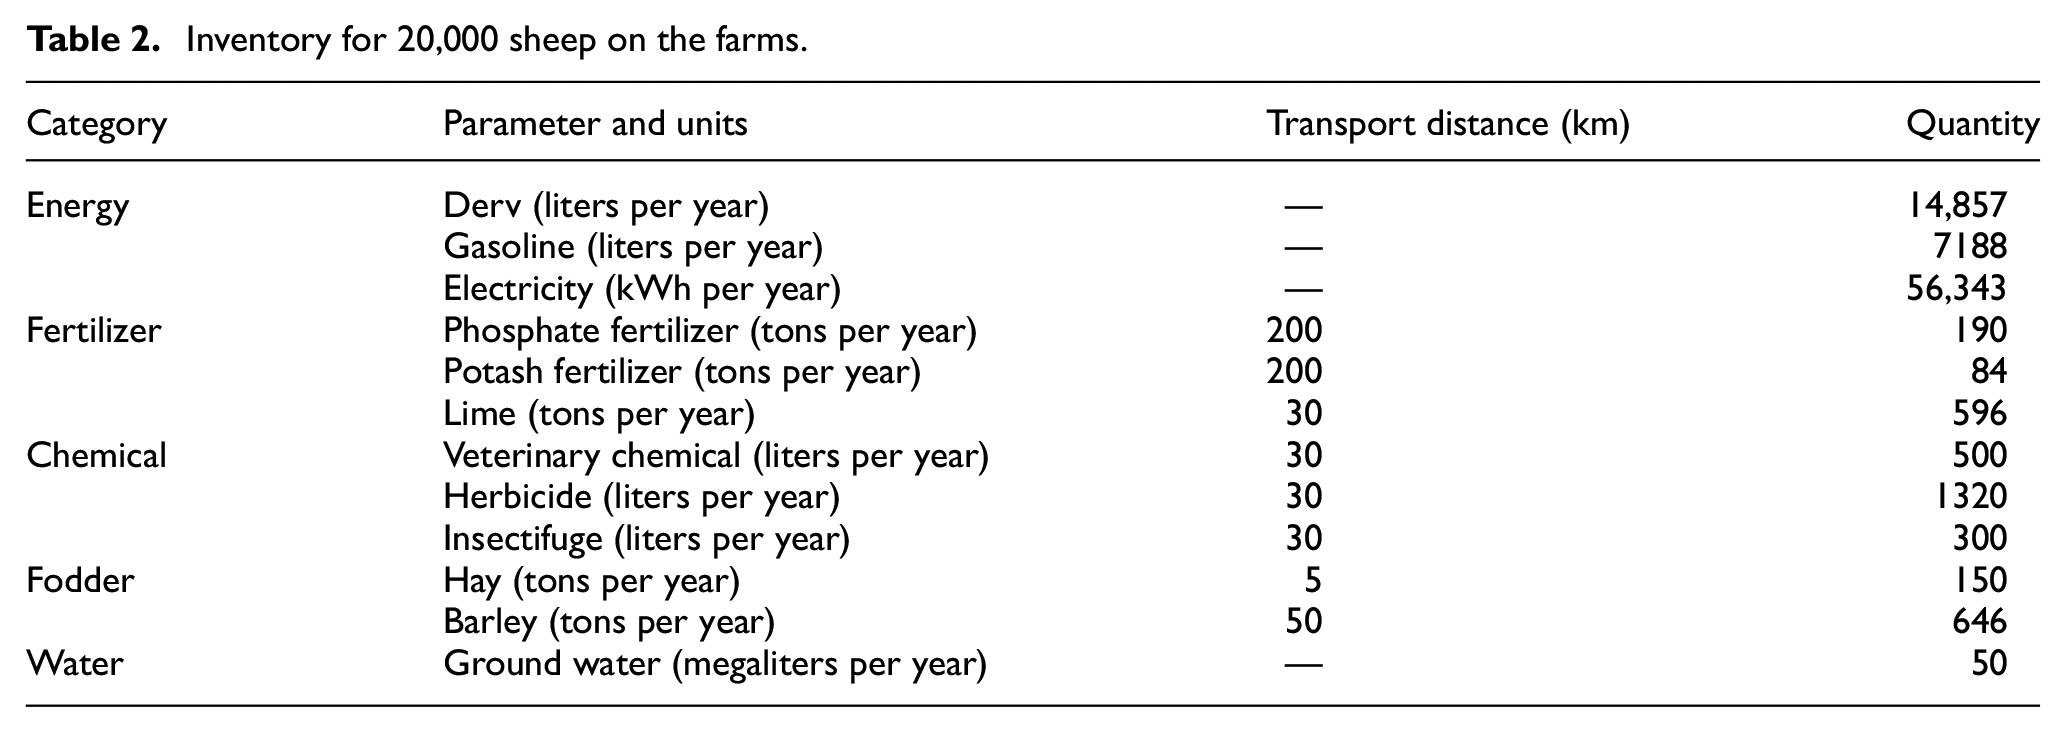
The farms had a total of 15,000 adult sheep, 5000 lambs, and a total of 20,000 sheep shorn per year. The farms obtained the greasy wool by shearing, and each sheep produced 3 kg per year. The sheep productive lifespans of the sheep were 5 and 6 years, so we calculated the situation of the 5-year and 6-year productive lifespans. The data list of sheep is shown in Table 2.
Inventory for 20,000 sheep on the farms.
Handling Co-production
Co-products such as meat, lamb, and milk are produced during the cradle to farm-gate stage. The carbon footprint should be allocated to different co-products. The sheep in the research farms were all non-dairy sheep, which only produced meat as a co-product in addition to wool. Therefore, greenhouse gas emissions need to be allocated between wool and meat. In addition to the system boundaries considered in this study, there are also by-products such as burrs, sweepings, and lanolin generated during the subsequent production of wool products. When these by-products have value, they also need to be allocated. At present, the most widely used methods in the literature are biophysical allocation method, mass allocation method, and economic allocation method. These three methods were chosen for the allocation of wool and its co-products in this study. Biophysical allocation is based on the physical relationship between co-products and outputs, dividing environmental impacts based on physicochemical properties such as protein mass and energy content. 24 The PMA method was proposed by Wiedemann et al., 25 which was based on the protein content of wool and co-products. The allocation ratio used in this study was based on Wiedemann et al., 12 which allocated 46% of the environmental impact of farm gate to wool. The economic allocation method allocates wool and its co-products according to their economic value, reflecting the economic causality of the product. Based on the price of wool and meat sold on the farms, when the economic allocation method was used, the proportion of wool was 69.3% when the productive lifespan was 5 years. When the productive lifespan was 6 years, the proportion of wool was 73%. The mass allocation method provides a quantitative perspective based on the proportion of the mass of wool and its co-products at the farm gate. Based on the weight of wool and meat sold at the farm gate, the proportion of wool was 20% and 23.1% when the productive lifespans were 5 and 6 years when using the mass allocation method. Under different allocation methods, the proportions of wool and meat are shown in Table 3.
Proportion of wool and meat under different allocation methods.
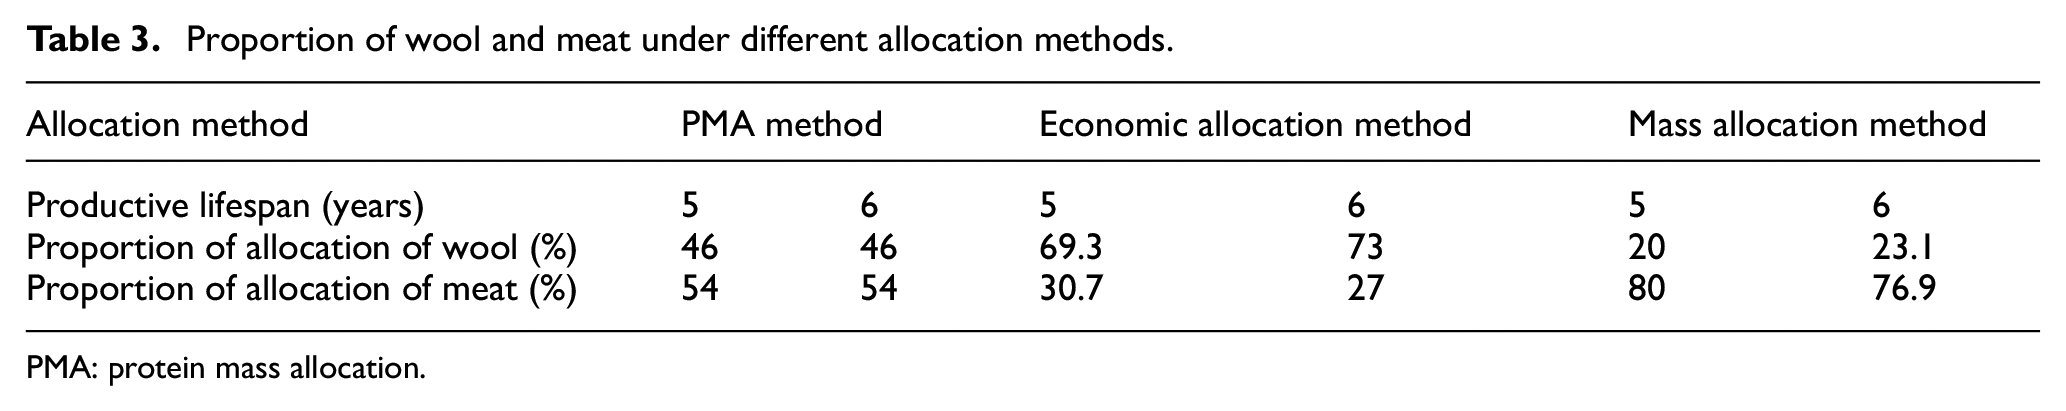
PMA: protein mass allocation.
Calculation of Greenhouse Gas Emissions from Rumination and Excretion
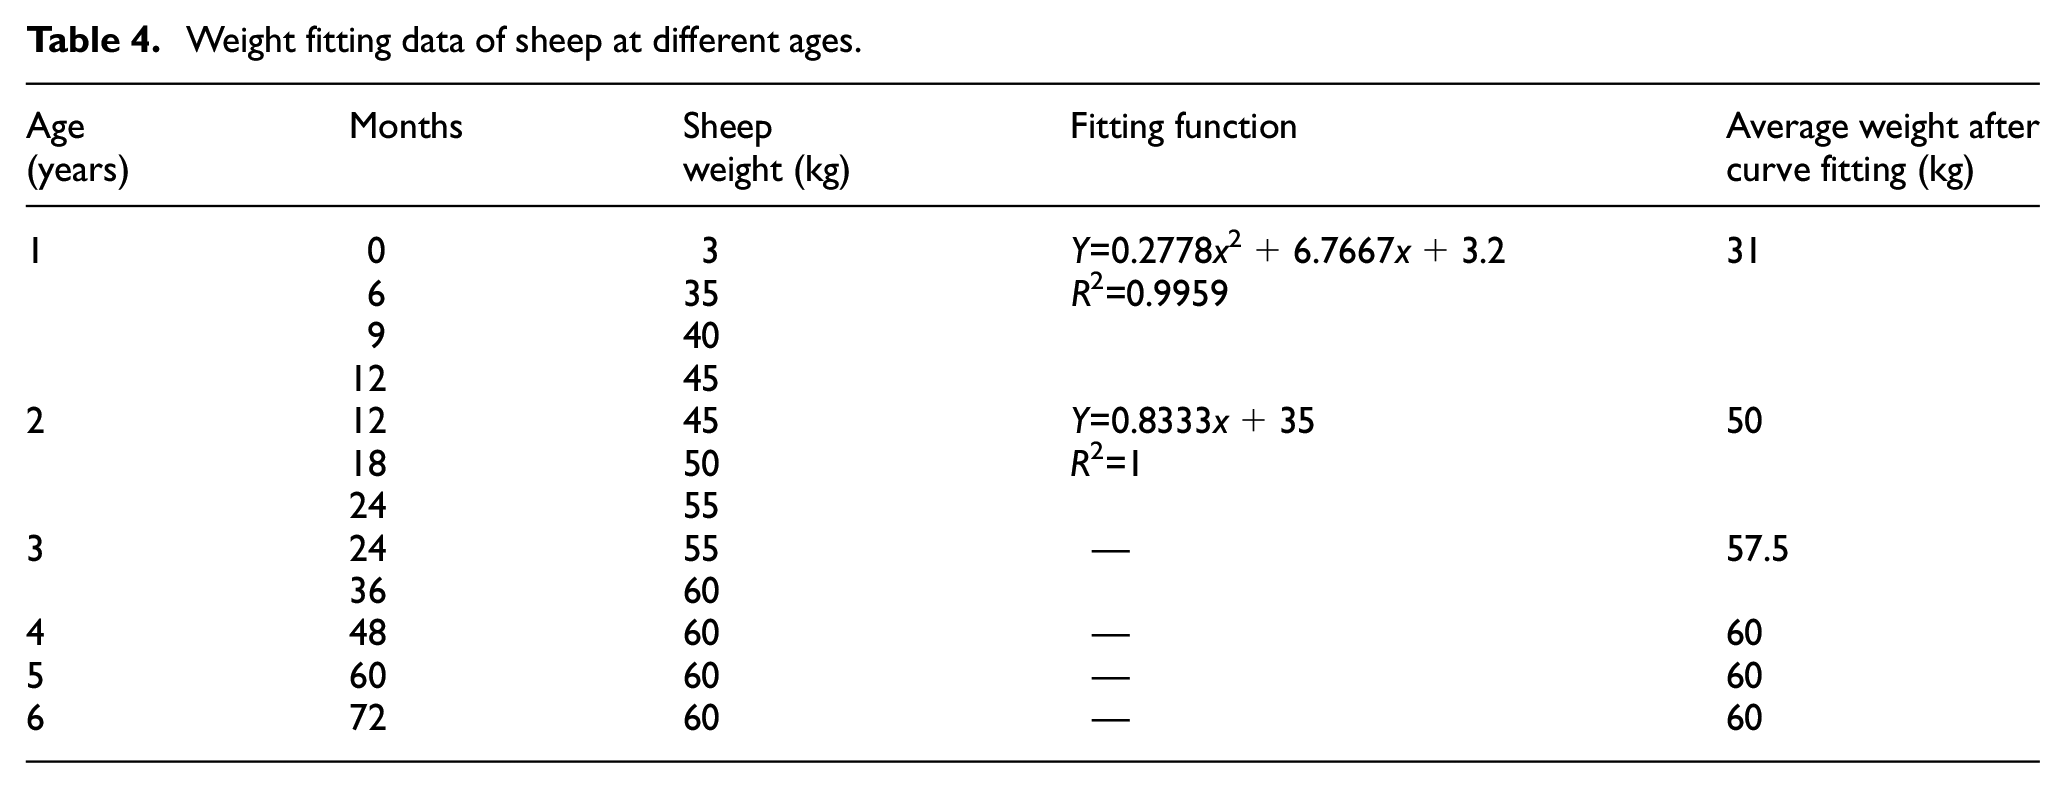
The amounts of CH4 and nitrous oxide (N2O) produced by rumination and excretion of sheep are closely related to the number of productive lifespan years and average weight of sheep. Based on research data from Victoria farms, the sheep’s productive lifespans in this study were 5 and 6 years. The average weight of the sheep was fitted from birth to 1–6 years according to the median weight of the sheep; the list of data is shown in Table 4. Curve fitting is commonly used in data analysis and modeling. It’s the empirical determination of a curve or function that approximates a set of data. After obtaining the average weights of the sheep by curve fitting and calculating, greenhouse gas emissions from rumination and excretion during sheep’s productive lifespan were calculated according to the calculation methods in the IPCC 2019. 26 Emissions were divided into rumination CH4 emissions, excretion CH4 emissions, and excretion N2O emissions.
Weight fitting data of sheep at different ages.
Analysis
The study was conducted using CNTAC-LCAPlus to model and evaluate the life cycle of wool, selecting the global warming potential indicator. This system was developed by the Office for Social Responsibility of the China National Textile and Apparel Council, and the calculation process used the CML2001-Jan.2016 impact assessment method. The CML method is an accounting method system for life cycle assessment, defined by researchers from Leiden University in the Netherlands. It was designed according to ISO 14040 to carry out an environmental impact assessment of global climate change potential at the midpoint level. 27 It was a calculation method used in GaBi software. The characterization factors for energy, materials, and emissions in the study were obtained from the GaBi database. The methodology adopted in this study complied with the principles of ISO 14040, and the calculation process of a global warming potential indicator was in accordance with the principle of ISO 14067 and PAS 2050.19,20,27
Results and Discussion
Carbon Footprint of Rumination and Excretion
During the cradle to farm-gate stage, sheep’s rumination and excretion produce large amounts of greenhouse gases such as CH4 and N2O. This study used the standard by IPCC 2019 to calculate the carbon footprint of rumination and excretion. 26 The calculated results are shown in Figure 2. Raising sheep generated substantial quantities of greenhouse gas emissions from rumination and excretion. As sheep gain weight over their productive lifespan, the greenhouse gas emissions from their rumination and excretion gradually increase. Rumination and excretion produced the least greenhouse gas emissions in the first year of the productive lifespan, generating a total of 118.717 kg CO2-e. In the second year of the productive lifespan, 191.839 kg CO2-e were generated, followed by a gradual increase in greenhouse gas emissions. The sixth year of the productive lifespan produced the highest greenhouse gas emissions from rumination and excretion, reaching 229.973 kg CO2-e. CH4 emissions from rumination accounted for the largest proportion, followed by N2O emissions and CH4 emissions from excretion.
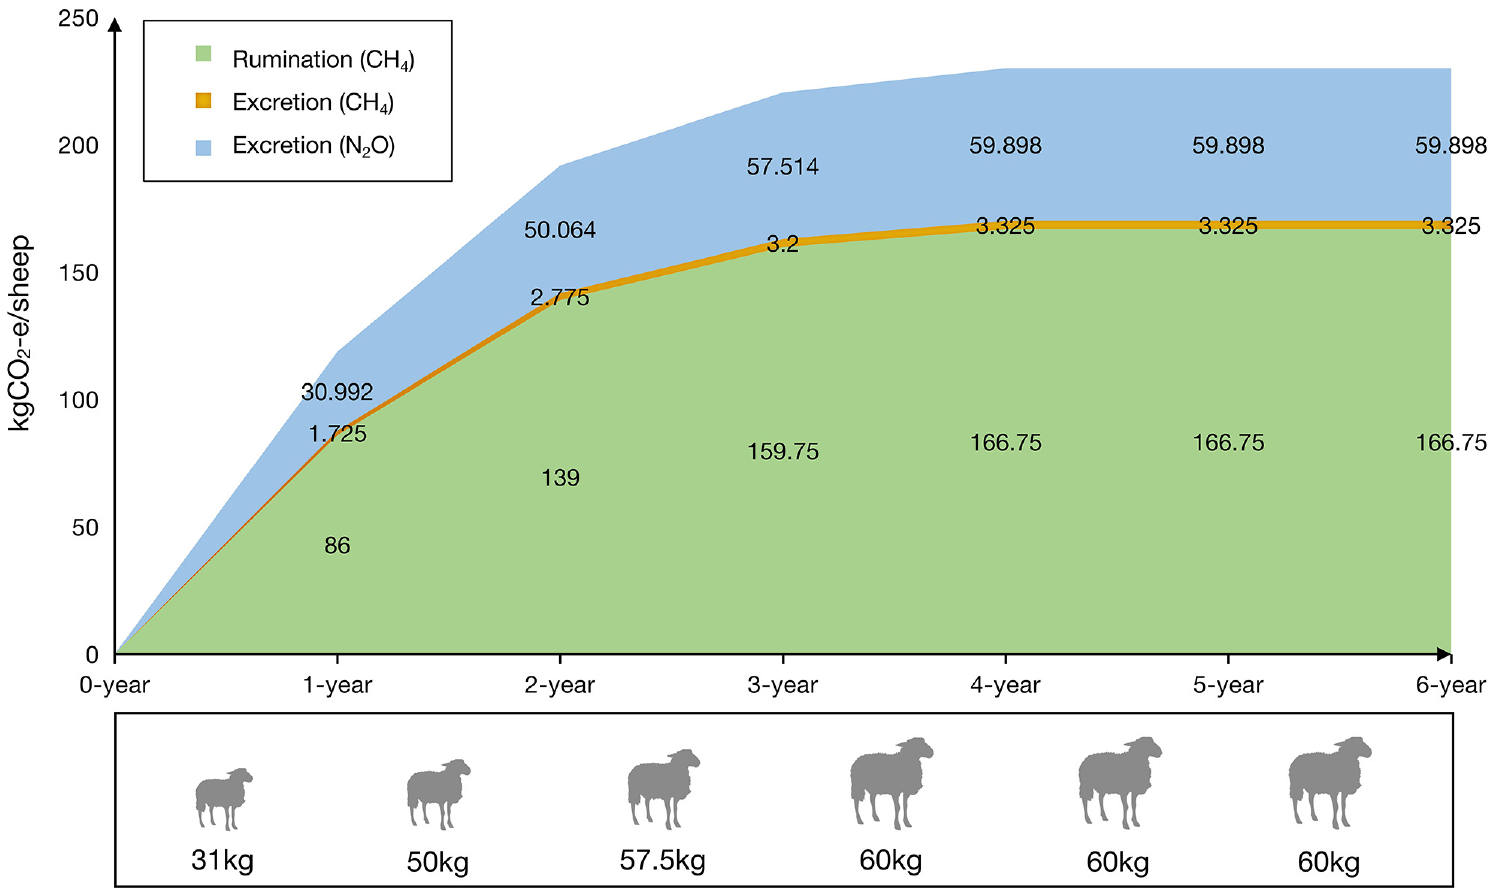
Carbon footprint results from sheep rumination and excretion.
The economic allocation method, the PMA method, and the mass allocation method were used to allocate greenhouse gases produced by the rumination and excretion of sheep. The allocation results are shown in Figure 3. The choice of allocation method can have an impact on the carbon footprint results from sheep rumination and excretion. The highest result of greenhouse gas emissions from rumination and excretion was 686.493 kg CO2-e/sheep when the economic allocation method was used during the 5-year productive lifespan. The result using the PMA method was 455.844 kg CO2-e/sheep and the lowest result using the mass allocation method was 198.193 kg CO2-e/sheep. Over a 6-year productive lifespan, the economic allocation method for rumination and excretion resulted in the highest greenhouse gas emissions of 891.457 kg CO2-e/sheep. The result using the PMA method was 561.632 kg CO2-e/sheep and the result using the mass allocation method was 281.755 kg CO2-e/sheep. The highest carbon footprint was calculated using the economic allocation method, about three times higher than the mass allocation method. The results of the PMA method were about twice as high as those of the mass allocation method. The selection of allocation method has a large influence on the carbon footprint results of sheep rumination and excretion.
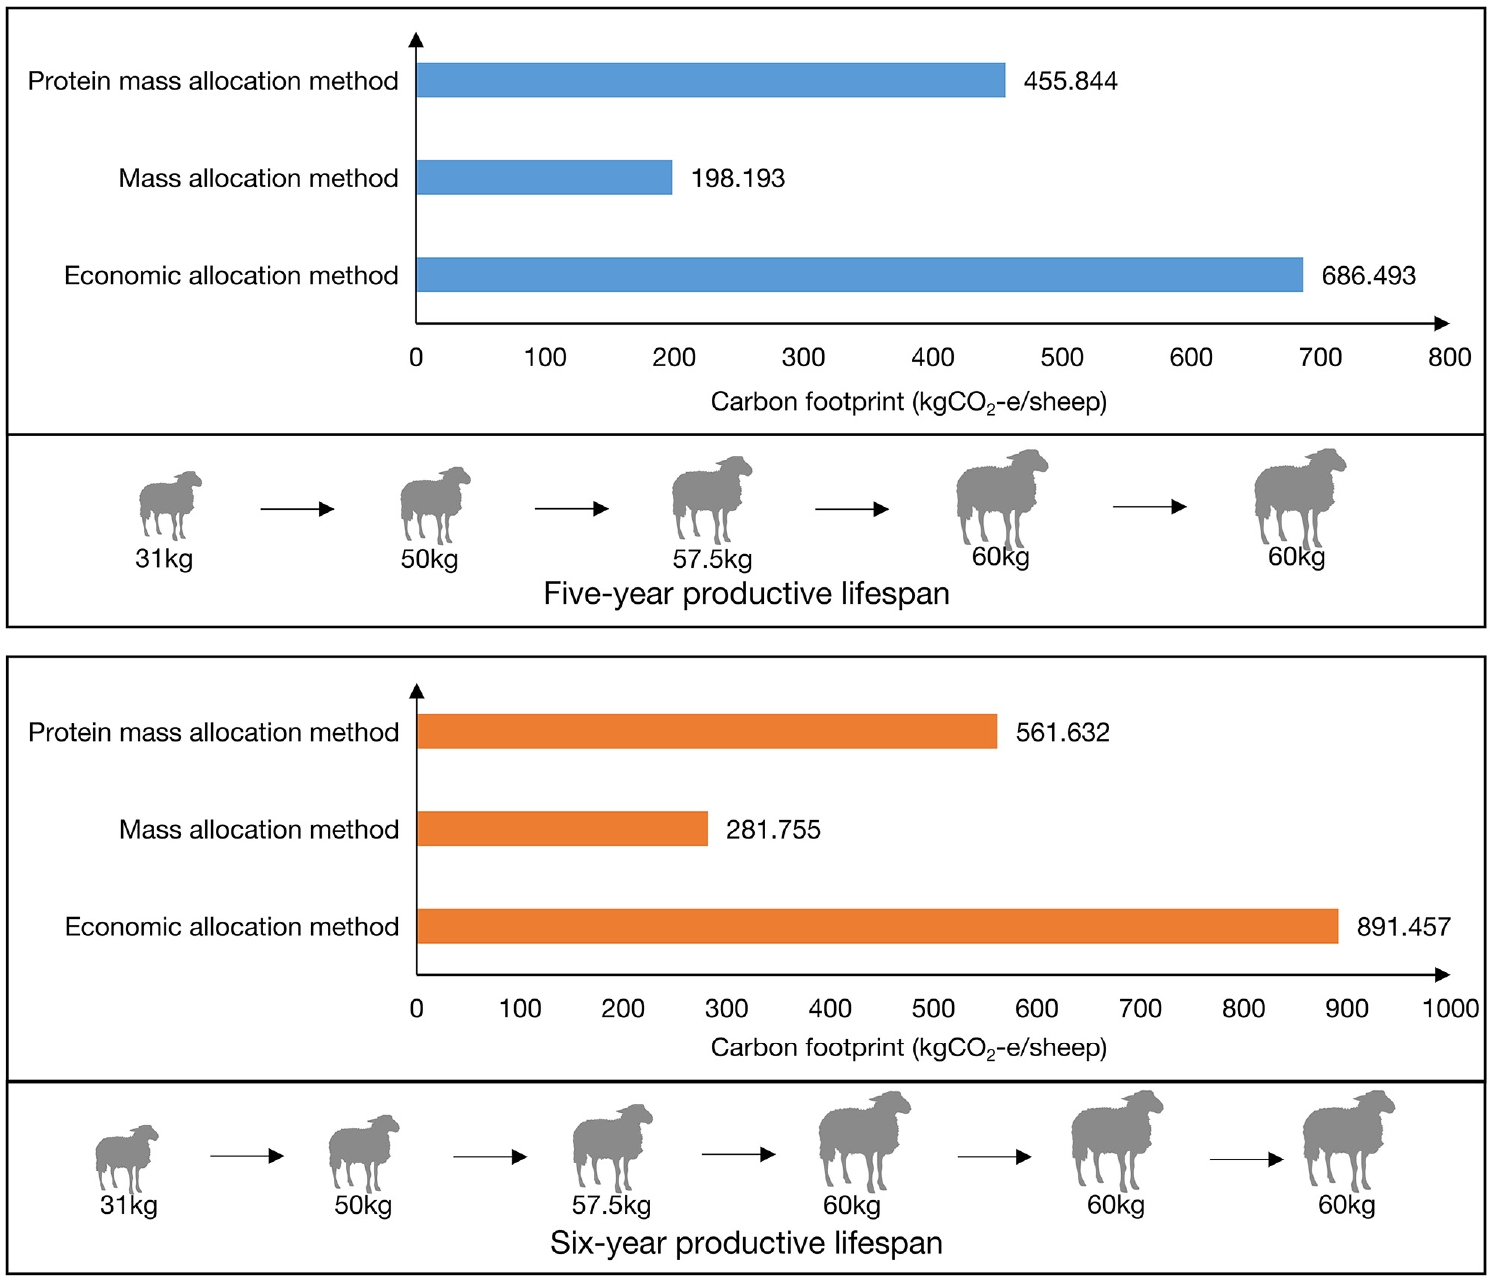
Carbon footprint results of rumination and excretion of each sheep.
Total Carbon Footprint of Wool
At the raw material acquisition stage, the total greenhouse gas emissions of 1 kg greasy wool produced on the farm are shown in Figure 4. The carbon footprint of 1 kg wool produced by sheep over a 5-year productive lifespan was 14.158–49.040 kg CO2-e. The carbon footprint of 1 kg of wool under a 6-year productive lifespan was 16.743–52.882 kg CO2-e. The results produced by the 6-year productive lifespan were higher than those produced by a 5-year productive lifespan, indicating that the longer the productive lifespan, the more greenhouse gas emissions produced by the production of 1 kg wool. At the cradle to farm-gate stage, the use of breeding methods to target sheep production performance and select sheep with excellent performance for breeding, or strengthening the survival of the fittest method to timely plucking of low-producing sheep can help reduce the carbon footprint. 28 Factors such as wool yield, types of co-products, and annual shearing all have an impact on the carbon footprint of wool. When the wool yield of sheep increases, it will reduce the carbon footprint of per kg wool. When farms produce milk, lamb, or other valuable products in addition to wool and meat, these co-products should also be allocated, reducing the carbon footprint per kg of wool. The carbon footprint per kg of wool will also decrease when annual shearing per sheep increases.
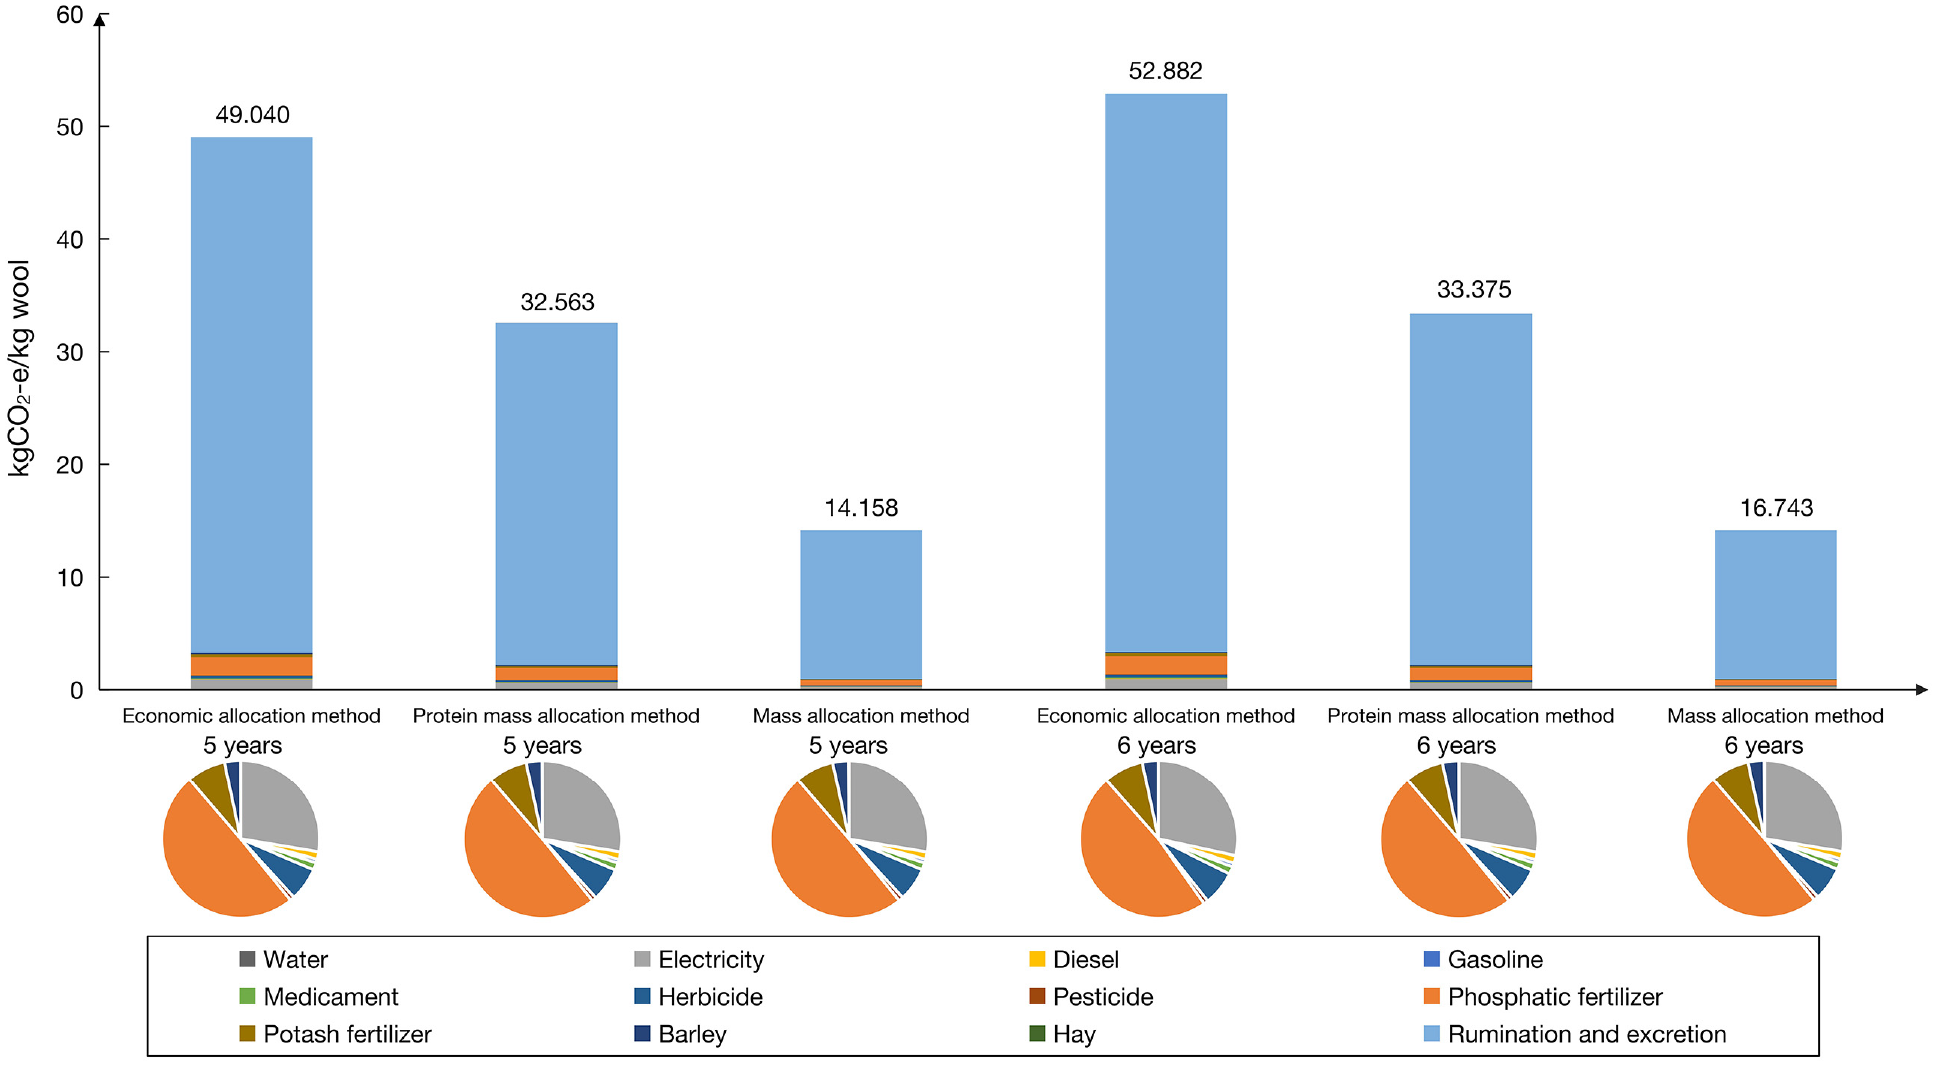
Carbon footprint results for 1 kg of wool produced on farms.
During the raw material acquisition stage of wool, various energy and material inputs as well as sheep’s activities such as rumination and excretion emitted greenhouse gases into the atmosphere. Of these, sheep rumination and excretion produced the most greenhouse gases, accounting for about 78.91–93.65%. In this study, the carbon footprint of rumination and excretion was calculated using a standard model published by the IPCC. This literature used different calculation methods to calculate the carbon footprint of rumination and excretion. The quantitative methods of CH4 emission from rumination by sheep in the literature mainly included instrumental measurement and model estimation. Among the instrumental measurement methods, the respiration chambers method, in vitro incubation method, and sulfur hexafluoride method are widely used. 29 The most widely used model estimation method was the standard model published by the IPCC. The CH4 and N2O emissions from sheep manure and urine can be calculated according to the different levels of methods proposed by the IPCC guidelines or based on models proposed in previous literature.26,30–32 When different methods are used to calculate the carbon footprint of rumination and excretion, the comparability between the results is poor. For greenhouse gas emissions from sheep regurgitation and excretion, optimizing the feed composition during raising sheep, artificially adding methanogenic bacteria inhibitors appropriately, or changing the treatment method of excretion can reduce greenhouse gas emissions from sheep. 28
After rumination and excretion, phosphate fertilizer produced the most carbon emissions, followed by electricity and potassium fertilizer. Feeds required for sheep feeding such as herbicides and barley also produced greenhouse gas emissions. In this literature, indirect emissions from energy and heat production, indirect emissions from the input of farm materials, direct emissions from energy consumption such as diesel and gasoline, and direct emissions from rumination and excretion activities of sheep were taken into account, respectively, when calculating the wool carbon footprint. However, the data list used in the literature was not detailed enough and the data collected were not comprehensive, which will lead to inaccurate carbon footprint accounting results. The main data list for the cradle to farm-gate stage includes electricity and steam; materials such as feed (wheat, protein pellets, grains), fresh water, chemicals, petroleum, fertilizers, pesticides, pharmaceuticals, packaging materials, and so on; fuel oil, fuel oil (transportation), wood, coal, oil, natural gas, liquefied gas, and other energy; and the rumination and excretion of sheep on farms. The input of electricity, steam, and farm materials will produce indirect emissions. Energy consumption and rumination and excretion of sheep will generate direct emissions.
In the calculation of wool’s carbon footprint, using different allocation methods can have a very significant impact on the results. Under the same productive lifespan, the results of greenhouse gas emissions for 1 kg wool with different allocation methods were different. The results were highest when the economic allocation method was used. The second was the PMA method. The results obtained by the mass allocation method were the lowest. Various allocation methods can be used to allocate the carbon footprint of wool and its co-products. When allocation cannot be avoided, ISO recommended first using the underlying physical or biological cause–effect relationship (e.g. mass, protein, energy) to allocate the input, and second, adopting economic relations to allocate the co-products. 27 IWTO and LEAP recommended allocating small ruminant meat and other non-human edible products in order based on biophysical relationships, physical properties (e.g. mass, protein, or energy content), or based on market price.33–35 The allocation methods adopted in the literature included system extension, biophysical allocation, PMA, mass allocation, economic allocation, etc. The most widely used allocation methods in the literature were system expansion and PMA, followed by economic allocation and mass allocation. In this article, the carbon footprint of wool was calculated using the three most commonly used allocation methods: the PMA method, economic allocation method, and mass allocation method. Compared with the three allocation methods, the carbon footprint calculated by the mass allocation method was lower than that for other methods. The carbon footprint calculated in the literature using the PMA method ranged between 7.83 kg CO2-e/kg wool and 31.5 kgCO2-e/kg wool.9,10,15,16 Due to factors such as farm area allocation and allocation proportion, the results fluctuated greatly. When using the PMA method, the results of this study were 32.563–33.375 kg CO2-e/kg wool, which was close to the results of the literature because the same PMA ratio was used. 12 The results calculated using the mass allocation method in this article were 14.158–16.743 kg CO2-e/kg wool. The difference between the carbon footprint calculated by the mass allocation method in this article and the literature was related to wool yield, sheep weight, productive lifespan, and other factors. The carbon footprint results became higher when sheep wool production was high and the productive lifespan was long. The carbon footprint calculated in the literature using the economic allocation method was distributed between 6.58 kgCO2-e/kg wool and 35.8 kg CO2-e/kg wool.10,11,14,18 The result of this study was 49.040–52.882 kg CO2-e/kg wool. The carbon footprint of different studies fluctuated greatly due to market price fluctuations, subsidies, or price interventions.
Conclusion
The main objective of this study was to extend the carbon footprint accounting data for the raw material acquisition stage of wool in Australia, improve the carbon footprint calculation method and the accuracy of the carbon footprint calculation results of wool and provide a reference for wool product carbon footprint calculation.
Based on ISO 14067 and PAS 2050 standards, this article calculated the carbon footprint of wool in Victoria by using the CNTAC-LCAPlus.19,20 In this article, 20,000 sheep in the Victoria region were selected, and the weight of the sheep was fitted. Two scenarios of 5-year and 6-year productive lifespans were used to calculate the carbon footprint of wool using three different allocation methods: mass allocation, economic allocation, and PMA. The results showed that the carbon footprints of 1 kg wool produced by sheep under 5 and 6 years of productive lifespans were 14.158–49.040 kg CO2-e and 16.743–52.882 kg CO2-e. Among them, rumination and excretion accounted for the largest carbon footprint with 78.91–93.65%. The longer the productive lifespan and the heavier the sheep, the greater the greenhouse gas emissions from their rumination and excretion, and the more the greenhouse gas emissions from the production of 1 kg of wool. In addition to rumination and excretion, phosphate fertilizer produced the most carbon emissions, followed by electricity, potash fertilizer, and so on. Under the same productive lifespan, the greenhouse gas emissions of 1 kg wool calculated by different allocation methods were different. The results were highest when the economic allocation method was used, followed by the PMA method. The result calculated by the mass allocation method was the smallest. We calculated the carbon footprint of wool in Victoria and analyzed the influence of weight, productive lifespan, allocation method, and other factors on the carbon footprint. This study provides a reference for the subsequent carbon footprint accounting and the formulation of carbon footprint standards for wool products at cradle to farm-gate stage to reduce the carbon footprint of the wool industry.
The method adopted in this study can also be applied to the calculation of the carbon footprint of other wool-producing regions, which can help promote energy conservation and emission reduction in the textile industry. However, due to the limitations of the authors, there are still some research gaps in this study and further discussion is lacking. In this study, the allocation methods were the mass allocation method, economic allocation method, and PMA method. The proportion of the PMA method was set according to the allocation proportion in the literature. Subsequent studies can continue to explore the biophysical relationship between wool and its co-products and optimize the allocation proportion and allocation method, to make the carbon footprint calculation results of wool products more accurate. The wool industry’s carbon footprint can also be reduced through research into improving farm soil health and regenerative farming.
Footnotes
Declaration of conflicting interests
The author(s) declared no potential conflicts of interest with respect to the research, authorship, and/or publication of this article.
Funding
The author(s) disclosed receipt of the following financial support for the research, authorship, and/or publication of this article: The authors are grateful to Hangzhou Philosophy and Social Science Planning Project (M23JC054), Soft Science Research Project of Zhejiang Provincial Innovation Center of Advanced Textile Technology (ZX2022002R), Excellent Graduate Thesis Cultivation Foundation (LW-YP2022049), Science Foundation of Zhejiang Sci-Tech University (ZSTU) under grant (22202009-Y) for providing funding support to this research.