
Abstract
Nylon fibers were the first synthetic fibers to be produced on an industrial scale, and they are one of the most consumed synthetic fibers due to their visual and usage properties. Reactive dyes have been commercially produced since the mid-20th century, and they are mostly preferred in dyeing cellulosic fibers. The most important property of reactive dyes is their ability to make covalent bonds within the fiber. Mordants are used mainly in the application of natural dyes to hold and retain the dye molecules in the fiber. In this paper, nylon fabrics were dyed with three reactive dyes having different reactive groups (monochlorotiazine, trifluoropyrimidine and monochlorotriazine/vinylsulfone) in the presence of three chemical mordants (iron (II) sulfate, potassium aluminum sulfate and tannic acid) to obtain better exhaustion and coloration properties. Pre-mordanting, meta-mordanting, and post-mordanting processes were used for dyeing. The dyeings were performed at two dyeing concentrations (0.5% and 2% owf), and at three pH levels (pH 2, 4, and 6). The percentage of dyebath exhaustion (%E), the percentage fixation of the dye which exhausted (%F) and the overall percentage fixation (%T) were calculated after pyridine extraction. Wash and light fastness tests were applied on the dyed samples. The results were discussed via %E, %T and CIELAB color differences (ΔEab*). The results revealed that mordant usage improved the coloration properties of reactive dyes on nylon fabrics. The %E and %T results changed according to the independent variations of pH level, mordant chemical and mordanting method. The correct pH level and mordanting method gave the best dyeing and fastness results for the dyes under test.
Introduction
In 1938, Du Pont publicly announced the discovery of “super-polyamides” to which the general term nylon had been ascribed; nylon 6,6, the first commercially available wholly synthetic textile fiber, was marketed in 1939. The term nylon now refers to members of a generic class of synthetic polyamides derived predominantly from aliphatic monomers. Polyamides are polymers whose structural units contain amide groups (—CONH—) as recurring integral parts of the main polymer chain. Although a variety of polyamides are now manufactured and are marketed under various trade names, the two most important nylon textile fibers are nylon 6,6 and nylon 6. 1 Nylon 6,6 fibers, spun from polyamide polymer poly-hexamethylene-diamine-adipate, have been always required to be dyed in deep shades of high wash fastness. 2
The presence of terminal amino groups in nylon fibers imparts substantivity toward ionic dyes, especially acid dyes, direct dyes and reactive dyes. Of the various types of dye that can be used to dye nylon fibers, acid dyes are the most popular, with 1:2 pre-metallized acid dyes being used when high wet fastness is required.1,3,4 The coloration of nylon is usually achieved with acid dyes. 5 These attack the nylon via ion–ion linkages between cationic, protonated, amino end groups of the nylon (NH3+) and the anionic sulfonate residue of the dye (Dye-SO).3–6
In the case of dyes for cellulosic fibers, high wet fastness has most often been achieved by the use of fiber-reactive dyes: these function by reacting chemically with the cellulose, thus forming covalent links between fiber and dye.5,7–9
Reactive dyes for cellulose resemble acid dyes in their basic structure, but additionally possess one or more fiber-reactive groups, their name being derived from their ability to react chemically with groups on the fiber. In the mid-1950s Rattee and Stephen showed that dyes containing a dichlorotriazinyl reactive group are capable of reacting with cellulosic fibers, in the presence of alkali, to form covalent dye to fiber bonds. Subsequently, research into the chemistry and the application of reactive dye focused overwhelmingly on cellulosic fibers.4,7,8,10 Considerably less attention has been centered on reactive dyes for polyamide fibers. Thus, compared with the vast number of reactive dyes for cellulose, relatively few reactive dyes have been introduced specifically for polyamide fibers. 11 It is known that some reactive dyes which were developed for cellulosic fibers can be covalently fixed at the boil to nylon at slightly acidic pH. Under these conditions, covalent bonds form between the dye and the amino groups of nylon, without the need for an alkaline fixation step. 4
The most noticeable commercial ranges of reactive dyes for nylon have been reported as the Stanalan and Erifast dyes.4,5 Other water soluble dyes possessing electrophilic reactive groups such as heterobifunctional (MCT/VS), 3 chlorofluoropyrimidies, 12 α-bromoacrylamido dyes, 13 chlorotriazines and vinylsulfones, 14 as well as some reactive disperse dyes,15,16 have also been evaluated.
Although acid and metal-complex (premetallized) dyes are mostly preferred for the coloration of nylon fibers, dyeing nylon fibers with reactive dyes holds an alternative class of dyes having the possibility of strong dye–fiber bonds which could lead to higher fastness properties, for example, especially wash fastness.
Lewis and MacDougall researched dyeing nylon 6,6 with vinyl sulfone reactive dyes and revealed that only about 30% of the terminal amino groups were available for covalent reaction with the dye and concluded that fiber crystallinity and build-up of fixed negative charges were responsible for the effect. 2
Soleimani-Gorgani and Taylor focused on different dyeing properties of nylon with reactive dyes and concluded that fixation levels appeared to be independent of the number of either reactive groups or chromophore units and the major determination of dye fixation appeared to be associated with the shape of the molecule and the type, not the number, of reactive groups; 4 covalent bond fixation of the four derived monofunctional reactive monochlorortriazinyl dyes, differing only in degree of sulfonation, increased with increasing levels of sulfonation but their fixation efficiency reduced with increasing concentration of dye applied; 5 one or two cationic groups including dyes with different reactive systems were synthesized and they all fixed efficiently to nylon under alkaline conditions with fixation and build-up being fully comparable to markets’ leading anionic reactive dyes. 17
Burkinshaw and Gandhi researched the dyeing of conventional decitex and microfiber nylon 6,6 with reactive dyes and concluded that commercial chlorodifluoroprymidinyl reactive dyes were found to yield optimum color yield under acidic conditions (pH 4), and good build-up and level dyeings were obtained on both fabrics; 12 only one of the three commercial α-bromoacrylamide reactive dyes displayed good build-up on both conventional decitex and microfiber nylon 6,6 fabrics at pH 4, but it was observed that a large proportion of adsorbed dye was unfixed and removed by wash-off. 13
Burkinshaw and Wills researched the optimum pH value for dyeing nylon 6,6 with vinyl sulfone and chlorotriazine dyes and concluded that it lay between pH 5 and pH 6 where good exhaustion and high fixation were achieved. However, the results implied that the dyeing behavior of the dyes was pH-dependent and also varied between dyes. 14 Two of the studies12,13 were performed in the absence of electrolyte and proprietary leveling agent, and generally syntan treatment did not improve the wash fastness of the dyeings.
Kim et al. 18 researched the dyeing characteristics of nylon, cotton and N/C (nylon/cotton) mixture fabrics with reactive-disperse dyes containing a sulfatoethylsulfone group and concluded that washing fastness and rubbing fastness of dyed nylon, cotton and N/C fabrics with the reactive-disperse dyes were excellent, while light fastness was moderate. Kim et al. 19 (the same research team) also researched dyeing properties of nylon, polyethylene terephthalate (PET), and N/P (nylon/polyester) mixture fabric with reactive-disperse dyes having a sulfatoethylsulfone group and concluded that the reactive-disperse dyes were found to be adequate for the one-bath, one-step dyeing of N/P mixture fabric when applied at pH 5 and 120ο.
Baig et al. evaluated the effect of three organic salts on the dyeing of cotton fabric using four reactive dyes. They studied the effect of organic mordants on different dyeing parameters such as fastness properties, color yield and K/S value and concluded that the organic salts including sodium citrate, potassium acetate and ammonium acetate showed comparable fastness properties to those obtained in the case of conventional salts. Out of these three salts sodium citrate showed better fastness properties as compared to other salts, and organic salts showed higher K/S values when lower concentrations were applied. 20
Hosen et al. utilized turmeric (Curcuma longa L.) extract for cotton fabric dyeing. In addition, bio-mordants (derived from citrus lemon and Colocasia esculenta bulk) and metallic mordants (potassium dichromate and potash alum) pre-treatments were carried out to upturn the overall uptake of dyes into the fabric interior. The resulted color-strength (K/S) of bio-mordant pretreated samples was two times higher than that of the metal mordanted sample. They claimed the utilization of turmeric extract to be a useful dye source with citrus lemon and Colocasia esculenta bulk extract as a biomordant. 21
Repon at al. compared the dyeing properties of cotton knitted fabric dyed with banana floras stem (BFS) sap and reactive dye. The specimens dyed with BFS sap showed excellent color level and durability characteristics similar to the reactive dye except for light fastness, and the cost of natural dyeing was almost half that of the reactive dyeing. 22
The research about the usage of metallic mordants in reactive dyeing of nylon fabrics failed and no useful scientific data about the subject were found during the literature research.
This research focused on the usage of two metallic and one bio-mordant in reactive dyeing of nylon fabrics. The purpose was to research better dyeing, coloration and fastness properties with the usage of mordants with commercial reactive dyes which were specially used for cellulosic dyeing. The results showed that the percentage exhaustion and percentage dye fixation properties of reactive dyes were improved depending on the type of mordant, dyeing pH and the selected mordanting method. Each of the selected reactive dyes had its own best dyeing performance with different combinations of mordant, dyeing pH and mordanting method.
Materials and Method
The dyeing properties of commercial reactive dyes for cellulosic fibers were investigated on nylon fabric for different mordants, three dyebath application pH levels and three mordanting methods via absorbances of dyeing liquors and color measurements of the dyed samples. The results were reported as percentage exhaustion (%E), and overall percentage fixation (%T) besides color differences (ΔEab*) of the resultant dyeings. The methodology which was given in former papers3–5,13–15 was used.
Hundred percent nylon 6,6 fabric which was woven from 140/136 (denier/filament number) yarns in warp (49 threads/cm) direction and from 70/68 (denier/filament number) yarns in weft (39 threads/cm) direction was used. The fabric had a 2/1 twill weave and had a unit weight of 176 g/m2. The fabric was scoured under mill conditions in a pretreatment bath (pH 9) including a nonionic washing agent (4 mL/L) at 60°C for 60 min to remove the impurities. The fabric was dried and stentered in the mill at 195°C for 60 s prior to dyeing.
Dyeing experiments were carried out using a laboratory type sample dyeing machine (Ataç, Turkey). In all, 5 g pieces of fabrics were dyed at a liquor ratio of 20:1, using stainless steel dye pots. Dyebaths contained fabric sample, dyestuff, pH chemicals and mordants when necessary. Two different dyeing concentrations, that is, 0.5%, and 2% owf (on weight (mass) of fiber/fabric) were applied. Reactive dyes which had three different reactive groups; monochlorotriazine (MCT), trifluoroprymidine (TFP) and MCT/vinylsulfone (VS) were used (no C.I. names were allocated). All the dyes had a navy-blue hue. Dyeing profiles (as mordanting methods) given in Figure 1 were used. The initial dyeing temperature was selected as 30°C and a 102°C maximum dyeing temperature was used. In each dyeing process, the temperatures were increased by 2°C/min where necessary. Dyeings continued at 102°C for 60 min and later the temperature was decreased to 40°C by 4°C/min. At the end of dyeing, the dyed fabric samples were removed and rinsed in cold tap water at a 100:1 liquor ratio for 10 min to remove the unfixed dye which was left on fiber surfaces. Dyed and rinsed samples were not treated further and the cleared samples were left to dry under laboratory conditions prior to color measurements, and further extraction and fastness tests.
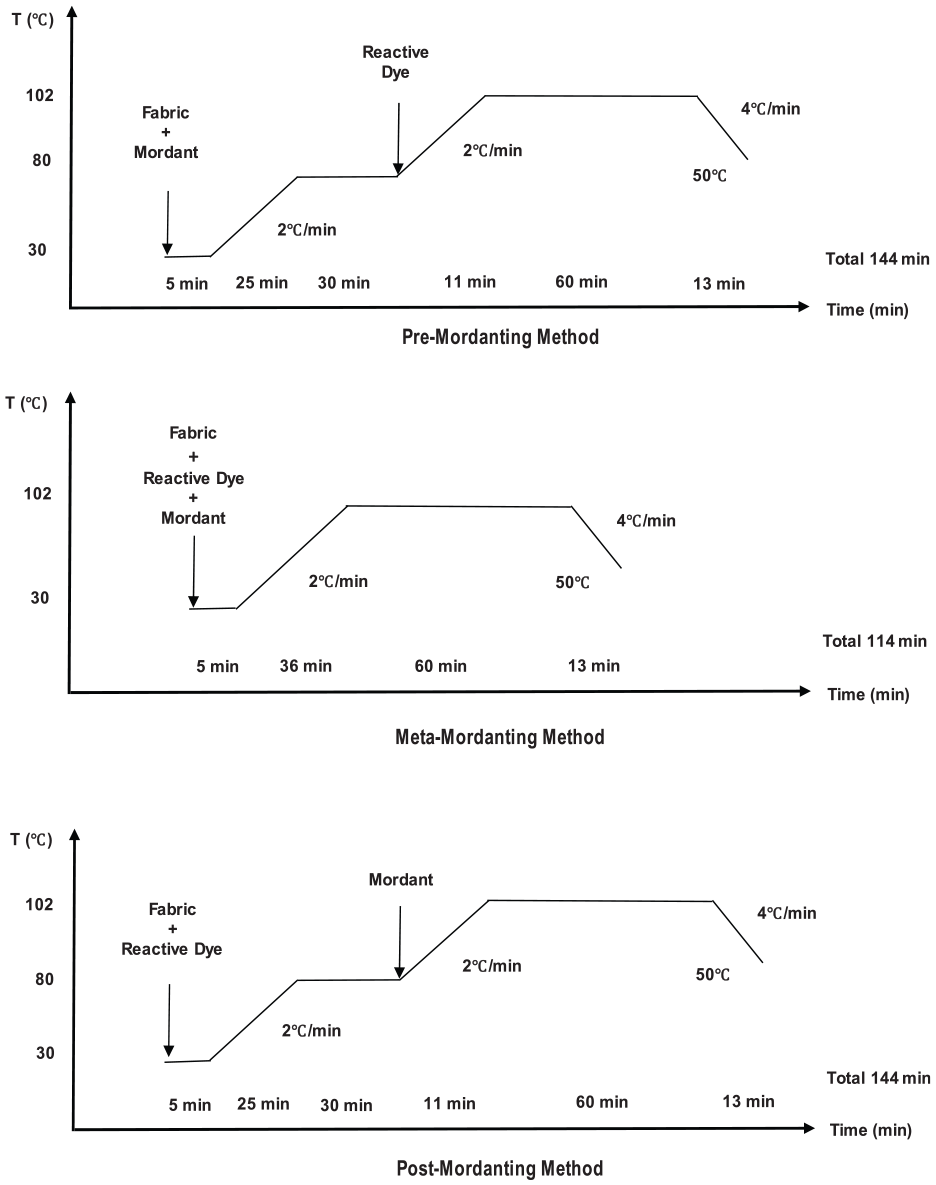
Dyeing profiles used in the experimental part.
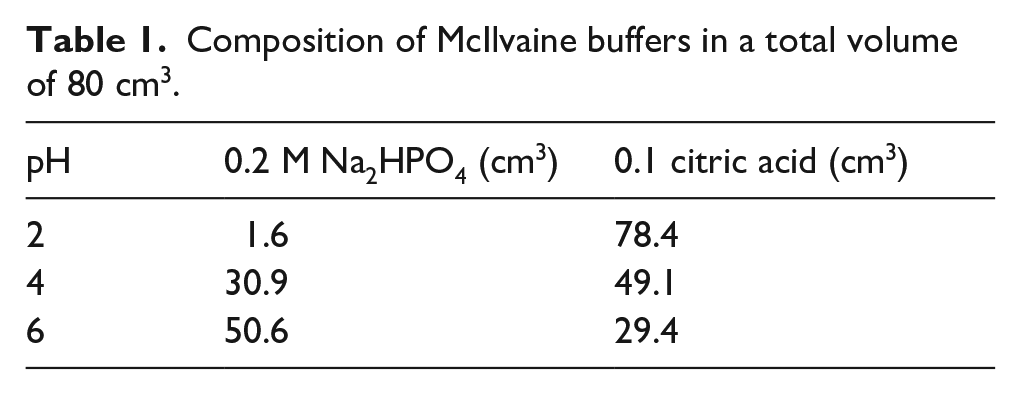
The pH of the dyeing liquors was adjusted according to McIlvaine buffers (Table 1). The pH of the dyeing liquors was carefully checked and adjusted when necessary with a pH meter. Three different pH levels of pH2, pH4 and pH6 were employed. Alkaline dyeings were not performed depending of the unfavorable results in former papers3,13,14 and also the mordants used in the experimental research were stable in acidic medium.
Composition of McIlvaine buffers in a total volume of 80 cm3.
Two metallic mordants; iron (II) sulfate heptahydrate (FeSO4·7H2O), potassium aluminum sulfate dodecahydrate (KAl(SO4)2·12H2O) (potassium alum, or alum), and one bio-mordant, tannic acid (C76H52O46), were used as mordants. They were supplied in laboratory grade and used as received from their packs with only very short contact with air.
The wash fastness test was performed according to ISO 105-C06:2010 A2S test (4 g/L ECE reference detergent WOB, 1 g/L sodium perborate, 150 mL liquor volume, 40°C, 45 min.). 23 The wash fastnesses of fabric samples were evaluated with color measurements in order to present a clearer understanding.
The light fastness test was performed according to the ISO 105-B02:2014 test. 24 The test lasted for 96 h in order to observe the behavior of the fabrics under long term exposure conditions. The duration of 96 h could be matched to L6 to L4 (blue wool standard) fading exposure. During the light fastness test, the test specimens were cut in 4 cm × 10 cm dimensions and they were placed in the exposure chamber attached to the appropriate sample holders. Similar to the wash fastness test, the light fastness of fabric samples was evaluated with color measurements in order to present a clearer understanding.
Color measurements on the dyed samples and transmittance measurements of the dyeing liquors were performed by using a reflectance/transmittance spectrophotometer (Datacolor 600, Switzerland) between 400 and 700 nm under D65/10° illuminant and specular component included (SCI) mode. Fabric samples were folded twice to achieve a four layers of fabric thickness. Four reflectance measurements were performed at different positions on the dyed fabric samples and the average percentage reflectance was recorded. Color coordinates (L*, a*, b*, C*, and h°), color strength (Kubelka–Munk values) (K/S) (λmax for the blue dyes were observed at 620 nm), and color difference values (ΔEab*) (CIELAB 1976) were obtained from the color assessment software.
Color properties of the nylon fabric prior to dyeing were as follows: L*, 92.12; a*, 0.09; b*, 9.34; C*, 9.34; h°, 89.47; YI Yellowness Index E313–15, 17,70; CIE WI Whiteness Index, 37.46; K/S = 0.16 (at 400 nm) (all the measurements were taken and reported under D65/10°).
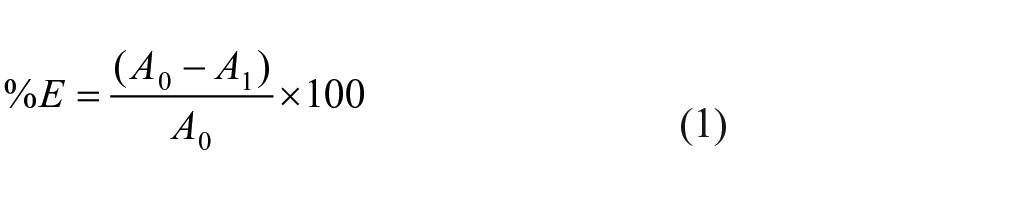
The extent of dye exhaustion was determined by transmittance measurements. The absorbance of each dyebath solution before and after dyeing process was measured using a 1 cm quartz cell housed in a Datacolor 600 spectrophotometer at the λ max of each dye after appropriate dilution. The percentage of dyebath exhaustion (%E) was calculated by using Equation (1), where A0 and A1 are the absorbance of the dyebath before and after dyeing, respectively3–5,13–17
Determination of the degree of dye fixation was performed via Soxhlet extraction by aqueous alkaline pyridine solution and color measurement. A sample of 1 g of dyed fabric was immersed in 150 cm3 of aqueous 20% (prepared by using distilled water) pyridine solution. The temperature was rapidly raised to the boiling point and treatment continued at the boil under reflux for at least 6 h until no further dye was removed from the fiber.
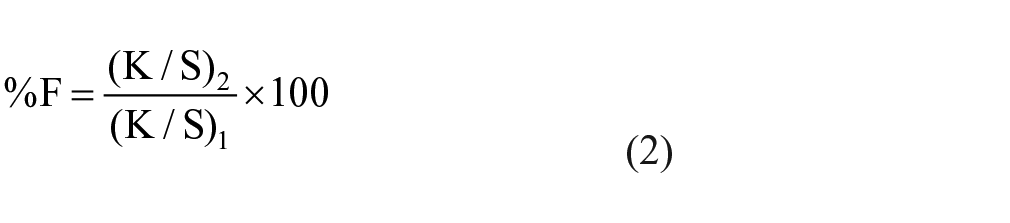
The stripped dyeings were thoroughly rinsed in tap water for 10 min (at 100:1 liquor ratio) and allowed to dry under laboratory conditions. The percentage fixation of the dye which exhausted, %F, was determined according to Equation (2) where (K/S)1 and (K/S)2 represent, respectively, the color strength of the dyeings before and after stripping of any unfixed dye from fiber surfaces with aqueous pyridine. It is assumed that K/S values are proportional to the concentration of dye on the fiber under the concentration of the dyeings employed3–5,13–15
Equation (3) represents the overall percentage fixation, %T, (overall fixation efficiency of dye) obtained from percentage of dyebath exhaustion (%E) and percentage fixation of the exhausted dye (%F)
Color difference (ΔEab* or ΔE*) values were calculated according to the CIELAB (1976) color difference formula (Equation (4)) where ΔL* is the difference between lightness axis (L*) coordinates, Δa* is the difference between red–green axis coordinates (a*) coordinates and Δb* is the difference between yellow–blue axis (b*) coordinates (Δ = coordinate of the sample—coordinate of the standard). 25
The dyeing profile of meta-mordanting (Figure 1) was used to perform dyeings which did not contain any mordant. The results were presented with the term “blind dyeing” in the tables and figures where necessary.
Results and Discussion
% Exhaustion and % Fixation Values
All the ionic dyes that penetrate inside nylon fibers do not have to form strong ionic (in case of acid dyes) or covalent bonds (in case of reactive dyes) with the ionized groups of the macromolecules and some amount of dye could stay in the amorphous regions of the fibers via relatively weaker bonds such as hydrogen and van der Waals forces. Under these circumstances, the dyes could stay in a loose state in the amorphous regions. Under wet conditions (washing or laundering medium) water molecules which penetrate into the fiber could break the weak bonds (such as hydrogen bonds) between the ionic dyes and fiber molecules; the loosely bonded dyes could become water soluble again. These dyes could migrate outside the fiber and can lower the wash fastness properties of the dyed goods; they could stain the adjacent fabrics. Both results are because of dye loss and these losses could cause color change.
The application of metallic mordants could have the possibility of improving the wash fastness properties of reactive dyed nylon fabrics. These mordants could retain the loosely bonded dyes in fibers which results in an increase in wash fastness properties.
Nylon 6,6 fabric samples were dyed at two dyeing concentrations (0.5% and 2% owf) and at three pH levels (pH2, pH4, pH6) with three reactive dyes that had different reactive groups (MCT, TFP and MCT/VS) via three mordanting methods (pre-, meta-, and post-mordanting). Color strength (K/S), percent exhaustion (%E) and overall percent fixation (%T) of the dyeings are presented in Tables 2 and 3. %F values are not presented in order not to increase the data in the paper, but they were used in the calculation of %T (Equation (3)).
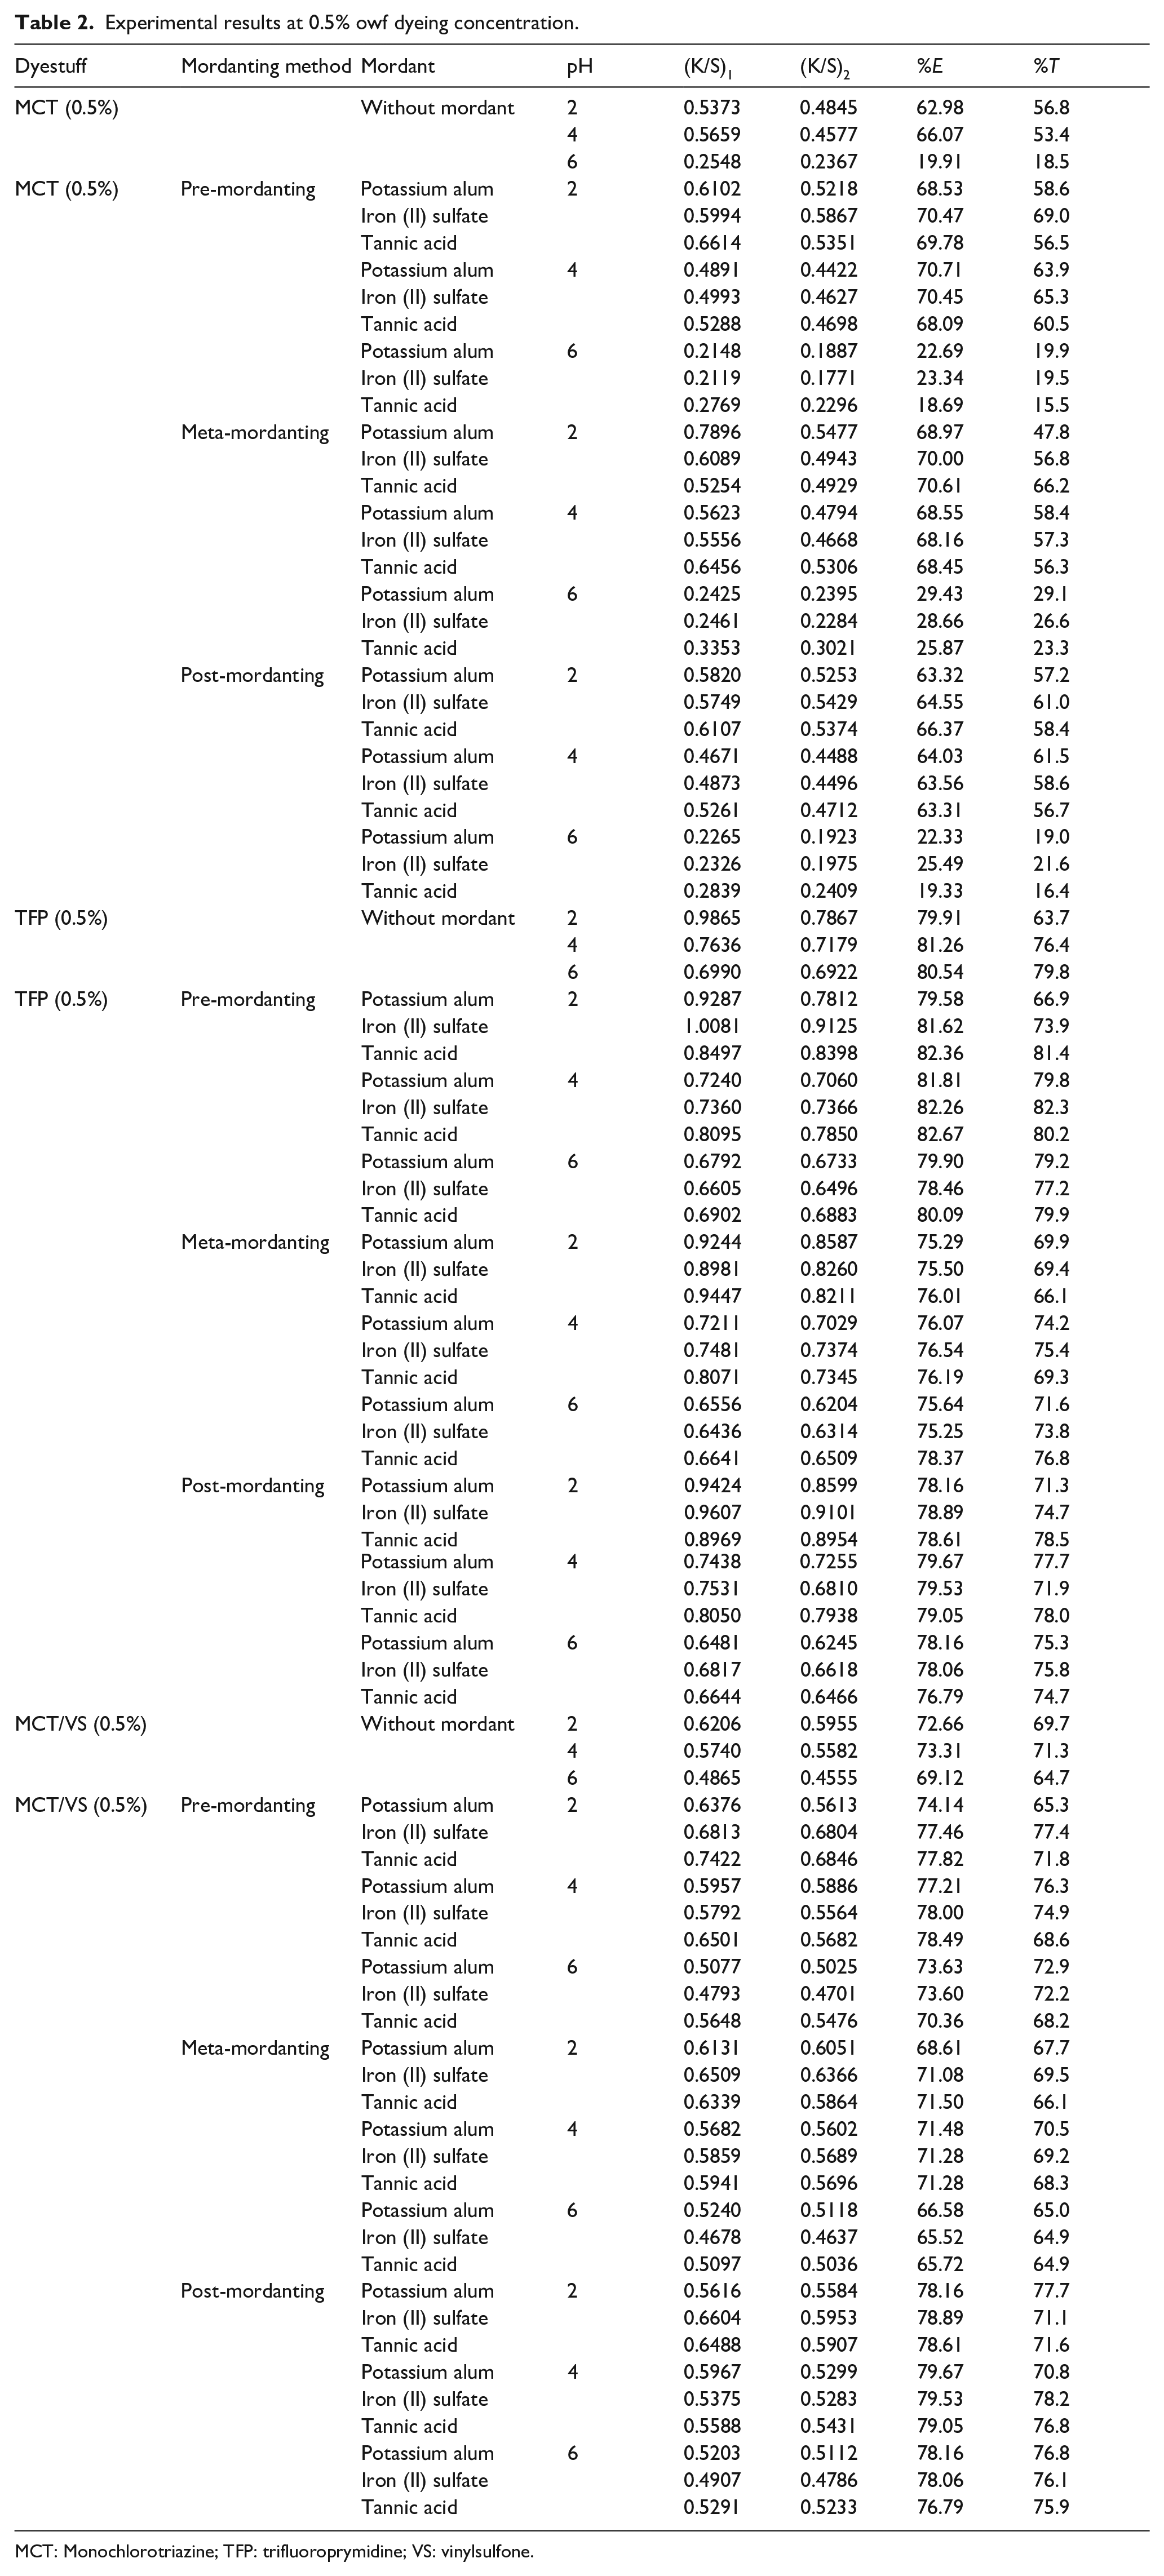
Experimental results at 0.5% owf dyeing concentration.
MCT: Monochlorotriazine; TFP: trifluoroprymidine; VS: vinylsulfone.
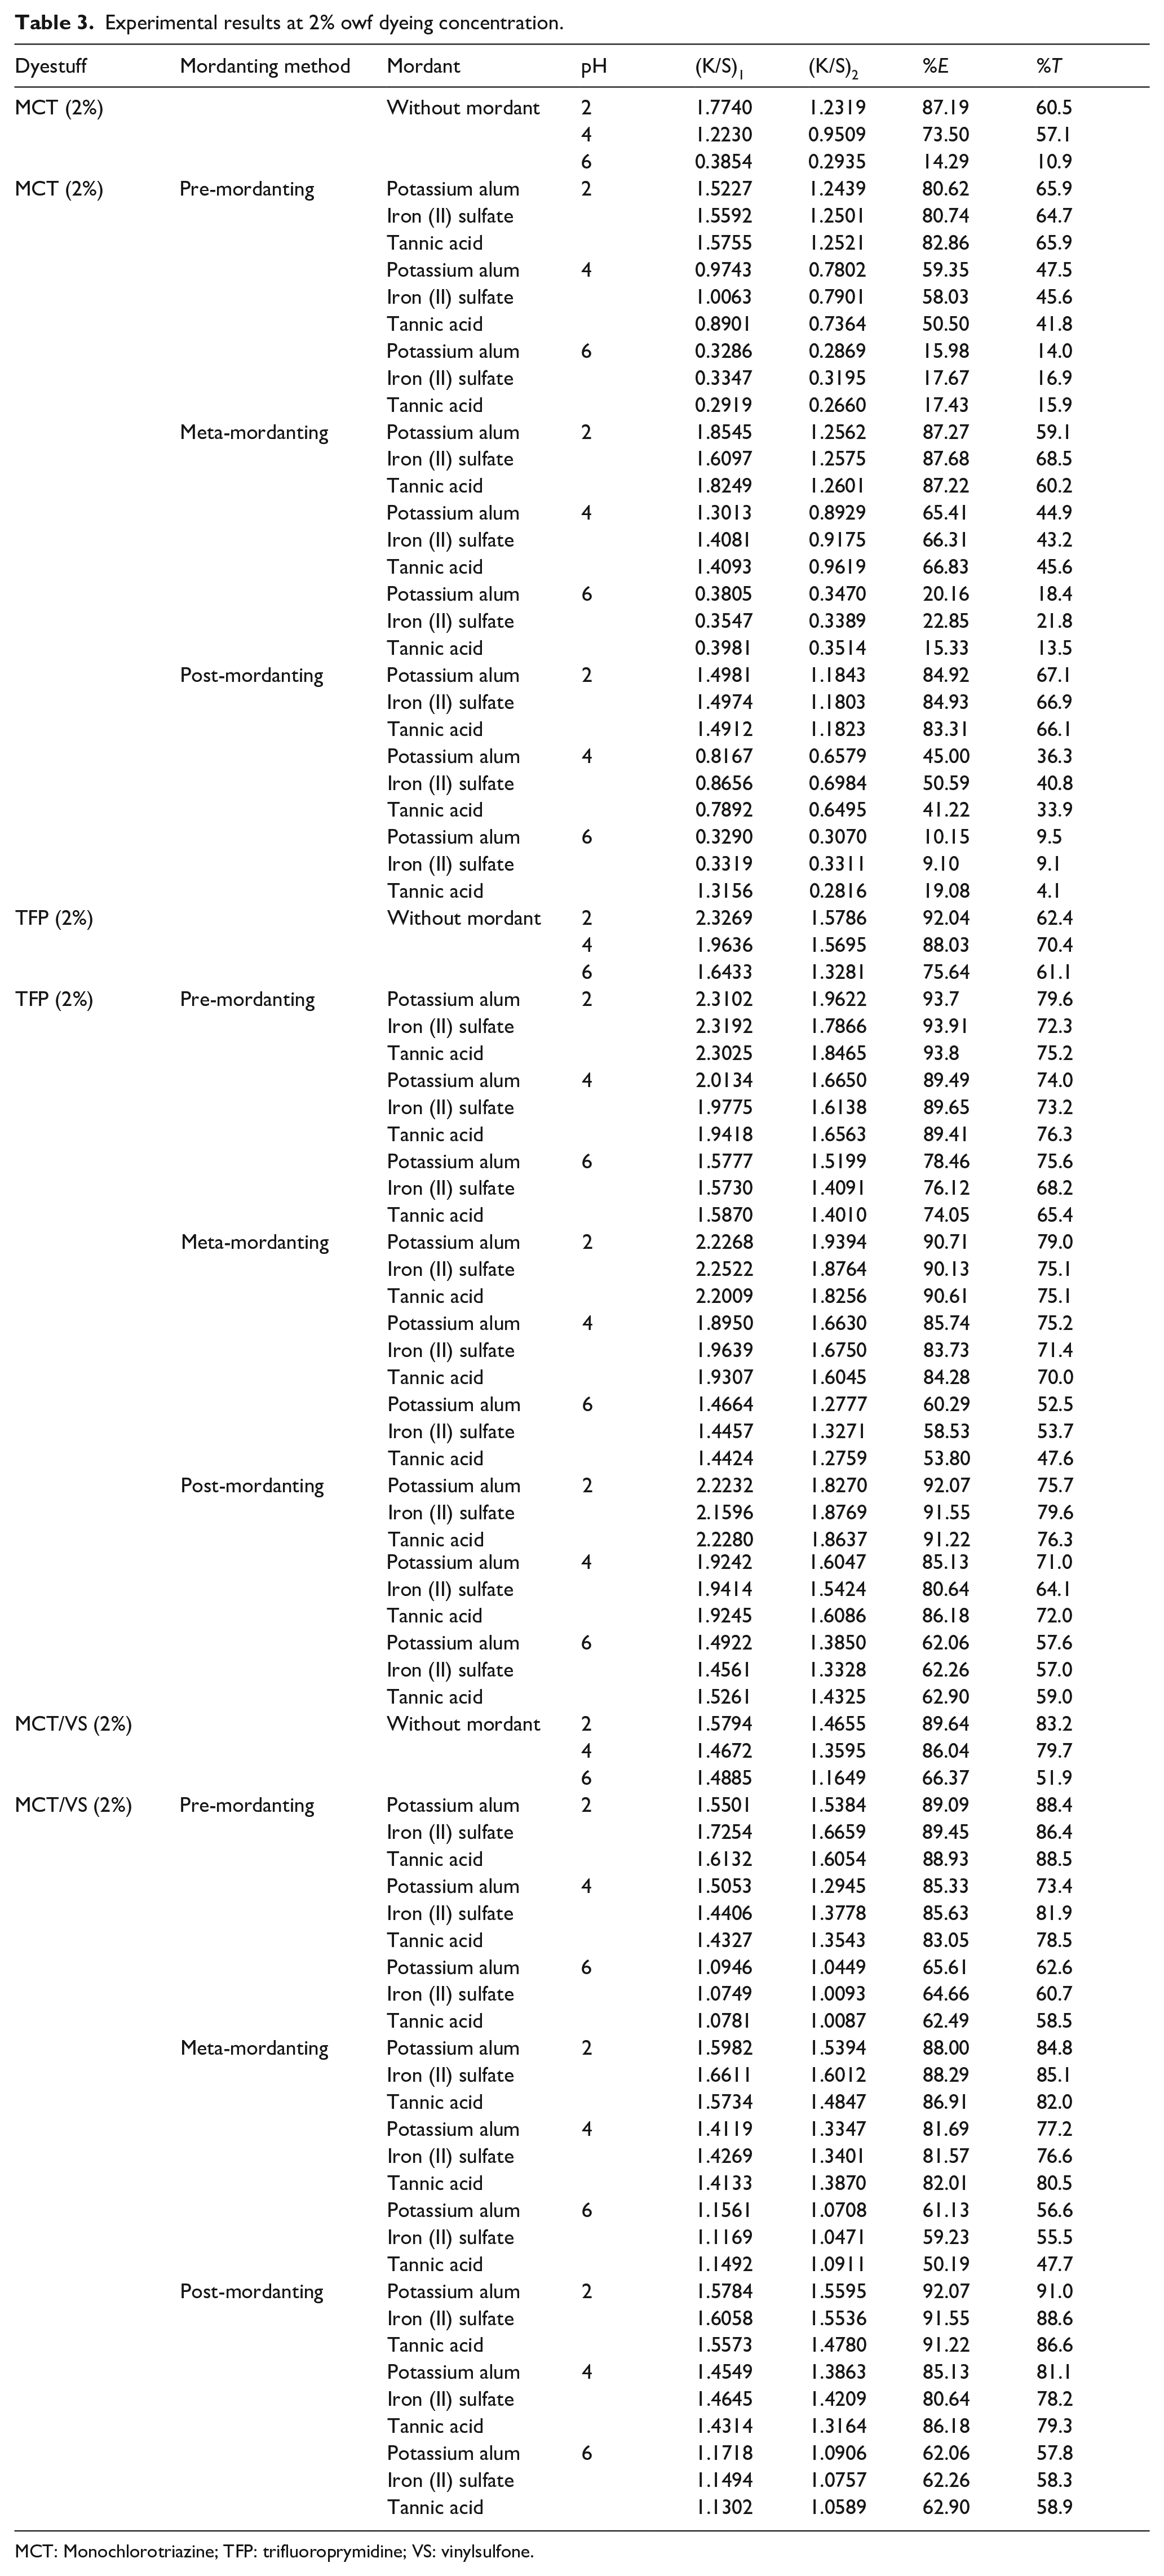
Experimental results at 2% owf dyeing concentration.
MCT: Monochlorotriazine; TFP: trifluoroprymidine; VS: vinylsulfone.
Color strength (K/S) values before ((K/S)1) and after ((K/S)2) dyeing besides percentage exhaustion (%E) and overall percentage fixation (%T) of the dyeing experiments performed at 0.5% owf dyeing concentration are presented in Table 2. The corresponding results of blind dyeing (without mordant usage, performed according to the meta-mordanting dyeing profile in Figure 1) are presented above the corresponding values of each reactive group.
The experimental results of the MCT reactive dye applied at the dyeing concentration of 0.5% owf are presented in the upper part of Table 2. When the blind dyeing was performed at pH 2 and pH 4, the MCT reactive dye had similar corresponding %E and %T values. The lowest values were obtained at pH 6. These results showed that pH 6 was not suitable for the blind dyeing of MCT reactive dye and satisfactory dye exhaustion and fixation were not obtained. Besides, the results of the blind dyeing were in correlation with the mordant existing dyeings which are presented just below in Table 2.
When the mordanting methods were compared with each other, it was observed that the highest %E values were obtained at pre-mordanting methods while lower %E values were obtained at meta- and post-mordanting methods. However, %T values of all the mordanting methods were quite similar to each other at the corresponding pH values of 2, 4, and 6. Besides, their %T values were higher than those for blind dyeing.
When the mordant chemicals were compared with each other, it was observed that tannic acid gave the lowest %E and %T values with both blind and three mordanting methods. Alum and iron II sulfate resulted in similar %E and %T values at the three pH levels and three mordanting methods.
When the application pH levels were considered with regard to the mordant chemicals, the lowest %E and %T values were obtained at dyeings which were performed at pH 6 regardless of the mordanting method or the mordant chemical used. The %E and %T values of the dyeings at pH 2 and pH 4 were quite similar to each other at the corresponding mordanting methods. %E values at pH 6 were much lower than those at pH 2 and pH 4 which also led to the lowest %T values at all the mordanting methods.
An overall discussion of the %E and %T results of the 0.5% owf MCT reactive dye implied that alum and iron II sulfate usage at pH levels of 2 and 4 increased dye-pick up, build up and fixation properties of the dye at all the mordanting methods. MCT reactive dye could not perform acceptable dyeings at pH 6. The usage of tannic acid did not improve the dyeing results and the post-mordanting method was less effective in dyeing than the other two methods when %E values were considered. Alum generally performed better at pH 4 and iron II sulfate generally performed better at pH 2. All the mordants failed to perform good exhaustion and fixation at pH 6.
The experimental results of the TFP reactive dye applied at the dyeing concentration of 0.5% owf are presented in the middle part of Table 2. When the blind dyeing was performed, the TFP dye had close corresponding %E and %T values at all the pH levels, the values at pH 6 being the highest of all, the lowest values were obtained at pH 2, and opposite to the results obtained for MCT reactive dye. The results showed that almost the same %E values were obtained at all the pH values but %T was the lowest at pH 2. Satisfactory %T was not obtained at pH 2 which was the opposite at the MCT reactive dye. Similar blind and mordant existing results were obtained for the TFP reactive dye.
When the mordanting methods were compared with each other, it was observed that almost the highest %E and %T values were obtained at pre-mordanting method. The %E values obtained at pre- and post-mordanting methods were very close to each other, however %T values for the pre-mordanting method were slightly higher than that of post-mordanting. When the numerical differences between %E and %T values were taken into account, the highest numerical differences were observed at meta-mordanting method.
When the mordant chemicals were compared with each other, it was observed that all the mordants gave similar %E and %T values and only slight differences were obtained among the mordants depending on application pH levels. For that reason, it could be more suitable for TFP reactive dye to discuss the success of mordants considering their application pH levels. When the application pH levels were considered with regard to the mordanting chemicals, alum performed worse than the other two mordants at pH 2 and tannic acid performed almost the same as the other mordants at all pH levels despite the corresponding results obtained for tannic acid at MCT reactive dye.
An overall discussion of the %E and %T results of the 0.5% owf TFP reactive dye implied that exhaustion and fixation performances of the dye did not show great differences among mordanting methods, mordant chemicals and the applied pH levels. The lowest fixation results were obtained at the meta-mordanting because of the lower %E values than the other two methods. Performances of the mordant chemicals changed with mordanting method and application pH levels which indicated that usage of alum at pH 2 always had the lowest %T values. Dye pick-up, dye build-up, exhaustion and the fixation properties of the TFP reactive dye were quite insensitive to the mordanting method, mordant chemicals and applied pH levels, just the opposite to the behaviors obtained with MCT reactive dye. In most cases usage of tannic acid resulted in better %T values indicating that it could be the most suitable mordant chemical for the TFP reactive dye regardless of the mordanting method and application pH level used. Application of TFP reactive dye with tannic acid at pH levels of 2 and 6 with pre- and post-mordanting methods could be considered as the most appropriate conditions.
The experimental results of the MCT/VS reactive dye applied at the dyeing concentration of 0.5% owf are presented in the bottom part of Table 2. When the blind dyeing was performed, the MCT/VS dye had different %E and %T values at all the pH levels, the values at pH 6 being the lowest of all, similar to the MCT reactive dye but the opposite to the TFP reactive dye. The highest and the lowest %E and %T values of the MCT/VS reactive dye changed in accordance with the mordanting methods and application pH levels of the dyeing.
When the mordanting methods were compared with each other, it was observed that the highest %E and %T values were obtained with the post-mordanting method. Meta-mordanting method resulted in the lowest %E and %T values while the values obtained at pre-mordanting were close to the ones obtained at post-mordanting. When the numerical differences between the %E and %T values were taken into account, the lowest differences were obtained with the meta-mordanting method, the method being the least effective one for the MCT/VS reactive dye.
When the mordant chemicals were compared with each other, it was observed that their performances changed with application pH levels. All the mordant chemicals resulted almost the same %E and %T values at the application pH levels. Similar to the TFP reactive dye, it could be more suitable for the MCT/VS reactive dye to discuss the success of the mordants depending on their application pH levels. When the application pH levels were considered with regard to the mordant chemicals, alum and iron II sulfate performed closely to each other but tannic acid performed lower than the other two mordants regardless of the mordanting method and application pH levels. However, the relatively lower %E and %T values obtained with tannic acid were not as inferior as the ones obtained at MCT reactive dye. Especially, the values obtained at pH 6 were close to the ones obtained at pH 2 and pH 4, for which the results were much different than that of the MCT reactive dye.
An overall discussion of the %E and %T values of the 0.5% owf MCT/VS reactive dye implied that lower exhaustion and lower fixation were obtained with the meta-mordanting method but distinct differences were not obtained among mordanting chemicals and application pH levels. The lowest fixation results were obtained at meta-mordanting because of the relatively lower %E values than with the other two methods for which the results correlated with the TFP reactive dye. Performances of the mordant chemicals changed in accordance with mordanting methods and application pH levels, similar to the discussion given for the TFP reactive dye, which indicated that the match of mordant chemical and pH level did not result in meaningful values for a certain application. According to the %E and %T results, meta-mordanting at pH 6 should be avoided because of the lowest possible results and post-mordanting at all pH levels could be used for the maximum dye build-up.
Color strength (K/S) values before ((K/S)1) and after ((K/S)2) dyeing besides percentage exhaustion (%E) and overall percentage fixation (%T) of the dyeing experiments performed at 2% owf dyeing concentration are presented in Table 3. The corresponding results of blind dyeing (without mordant usage, performed according to the meta-mordanting dyeing profile in Figure 1) are presented above the corresponding values of each reactive group. A quick review of Tables 2 and 3 shows that there were distinct differences between the %E and %T values of the two dyeing concentrations depending on the dye concentration % owf, mordanting methods, mordant chemicals and application pH levels.
The experimental results of the MCT reactive dye applied at the dyeing concentration of 2% owf are presented in the upper part of Table 3. When the blind dyeings were performed, the MCT dye had similar %E and %T values at pH 2 and 4 and the lowest values were obtained at pH 6 correlating to the corresponding results presented in Table 2. However, the %E and %T results were comparatively higher than the corresponding ones in Table 2. Similar to the results presented in Table 2, pH 6 was not suitable for bling dyeing of MCT reactive dye and satisfactory %E and %T were not observed. Besides, the results of blind dyeing were in correlation with mordant existing dyeings which are presented below, again in close correlation with the results presented in Table 2.
When the mordanting methods were compared with each other, it was observed that %E and %T values considerably changed with mordanting method, mordant chemicals and application pH levels, especially the %E and %T values changed with changing pH levels. The highest %E values were obtained with the meta-mordanting method but the corresponding %T values were lower than those obtained with the pre- and post-mordanting methods.
When the mordant chemicals were compared with each other, it was observed that iron II sulfate usually gave the highest %E and %T values at the three mordanting methods, similar to the findings presented in Table 2. Alum and iron II sulfate resulted in similar %E and %T values but their performances differed at different pH levels.
When the application pH levels were considered with regard to the mordanting chemicals, the lowest %E and %T values were obtained at dyeings which were performed at pH 6 regardless of the mordanting method or the mordant used, similar to the findings in Table 2. However, opposite to the findings in Table 2, %E and %T values showed considerable differences from each other between pH 2 and pH 4. Better exhaustion and fixation results were obtained at pH 2.
An overall discussion of the %E and %T results of the MCT reactive dye applied at 2% owf implied that similar to the results presented in Table 2, alum and iron II sulfate usage at pH levels of 2 and 4 increased the dye build-up, exhaustion and fixation properties of the dye at the three mordanting methods. MCT reactive dye could not perform acceptable dyeings at pH 6. The usage of tannic acid did not improve the dyeing results very much. The %E and %T results at 2% owf dyeing concentration were prone to the application pH level and the best results were obtained at pH 2 regardless of the mordanting method and the mordant used. Application pH 2 level being the best, iron II sulfate usually performed better than the other two mordants, correlating to the results presented in Table 2. Application pH level governed the %E and %T results.
The experimental results of the TFP reactive dye applied at the dyeing concentration of 2% owf are presented in the middle part of Table 3. When the blind dyeing was performed, the TFP reactive dye showed the best %E value at pH 2 but the best %T value at pH 4 which were quite different from the corresponding results in Table 2. Similar to the MCT reactive dye which had better %E and %T values at 2% owf than 0.5% owf, the TFP reactive dye had higher %E and %T values than the corresponding ones in Table 2. The lowest values were obtained at pH 6 which is opposite to the behavior given in Table 2. However, these findings were similar to the findings of the MCT reactive dye just above. The results showed that %E and %T values differed from the others when application pH levels changed, and opposite to the findings in Table 2, there were great numerical differences between %E and %T values especially at pH 2 and pH 4.
When the mordanting methods were compared with each other, it was observed that the highest %E and %T values were obtained with the pre-mordanting method, similar to the values given in Table 2. However, the %E and %T values of all the mordanting methods were very close to each other and exhaustion and fixation values changed mainly according to the applied pH level in each mordanting method. When the numerical difference between %E and %T values were taken into account, the highest numerical differences were obtained with the meta-mordanting method, again similar to the corresponding differences obtained in Table 2.
When the mordanting chemicals were compared with each other, it was observed that all the mordanting chemicals resulted in high exhaustion and fixation values at pH 2 and pH 4. When pH 6 was discussed against pH 2 and pH 4, pH 6 caused low %E and %T values at all the mordants. Generally, all the mordanting chemicals performed their best in pre-mordanting method for both %E and %T results.
When the application pH levels were considered with regard to the mordanting methods and mordanting chemicals, the lowest %E and %T values were observed at dyeings which were performed at pH 6 regardless of the mordanting method or the mordant chemical used, opposite to the corresponding findings presented in Table 2. High %E and %T levels were obtained at application pH levels of 2 and 4 but the corresponding values at pH 6 were apparently lower than the other two pH levels.
An overall discussion of the %E and %T results of the 2% owf TFP reactive dye showed that distinct differences from the corresponding values presented in Table 2 were obtained when the application pH levels were taken into account. The %E and %T values were the highest for pH 2 and pH 4, and they were the lowest for pH 6 at all the mordanting methods regardless of the mordant chemical used in Table 2. The highest %E and %T values were obtained usually at application pH 2. Being different from the corresponding values presented in Table 2, dye build-up, exhaustion and fixation properties of the 2% owf TFP reactive dye changed in accordance with the application pH levels and it did not show distinct differences between mordanting methods and mordant chemicals. Higher exhaustion and fixation values were obtained at pH 2 and pH 4 at all the mordanting methods and mordant chemicals than the corresponding ones obtained in Table 2. The differences between the values presented in Tables 2 and 3 implied that the success of the TFP reactive dye changed in different ways as the dyeing concentration increased. At low dyeing concentration (0.5% owf), the choice of the mordant chemical seemed to be important while at high dyeing concentration (2% owf) application pH level was observed to be more important. Generally, the best exhaustion and fixation values were obtained with the pre-mordanting method.
The experimental results of the MCT/VS reactive dye applied at the dyeing concentration of 2% owf are presented in the lower part of Table 3. When the blind dyeing was performed, the MCT/VS reactive dye had different %E and %T values at all the pH levels, the values at pH 6 being the lowest of all, similar to the result obtained for MCT reactive dye in the upper part of Table 3 and also similar to the corresponding values of MCT/VS dye presented in Table 2. When the %E and %T values of all the three reactive dyes were considered, the MCT/VS reactive dye resulted in similar behavior, especially when application pH levels were taken into account; the lowest %E and %T values were obtained at pH 6.
When the mordanting methods were compared with each other, it was observed that the highest %E and %T values were obtained at pre- and post-mordanting methods. However, the corresponding results obtained with meta-mordanting were close to the other two methods which implied that the choice of the mordanting method affected the results to a lesser extent when compared with the dyeing concentration of 0.5% owf in Table 2. When the numerical differences between %E and %T values were taken into account, the differences between the values were much lower than the corresponding differences obtained for the MCT and TFP reactive dyes. The results implied that high %E values resulted in high %T values for the independent variables of the experimental part.
When the mordant chemicals were compared with each other, it was observed that their performances changed with the application levels of pH, similar to the MCT and TFP reactive dyes in Table 3. The %E and %T values of all three mordanting methods and the three mordant chemicals were close to each other in the corresponding pH levels, and exhaustion and fixation values changed mainly according to the applied pH level in each of the mordanting methods, similar to the MCT and TFP reactive dyes in Table 3. When the %E and %T results of 0.5% owf dyeing concentration (Table 2) were considered with the corresponding results of 2% owf dyeing concentration (Table 3), it was observed that the dyeing performance was in close relation to the applied dyeing concentration and the independent experimental variables affected the resultant exhaustion and fixation values in relation to the applied dyeing concentrations.
When the mordanting chemicals were compared with each other, it was observed that all the mordanting chemicals resulted in high exhaustion and fixation values at pH 2 and pH 4, similar to the MCT and TFP dyes in Table 3. The highest %E and %T values in Table 3 were obtained with dyeing MCT/VS reactive dye when the results of all three dyes were taken into account. Similar to the MCT and TFP dyes, dyeing at pH 6 gave the lowest exhaustion and fixation values.
An overall discussion of the %E and %T results of the 2% owf dyeing concentration of MCT/VS reactive dye implied similar changes were observed in the corresponding results of MCT and TFP reactive dyes at 2% owf. The exhaustion and fixation properties of the MCT/VS reactive dye changed especially with the application pH level at 2% owf dyeing concentration; the change was not observed in Table 2 at 0.5% dyeing concentration. The highest %E and %T values were obtained at application pH levels of 2 and 4. Besides, the numerical differences between %E and %T were considerably small when compared with the corresponding values obtained for MCT and TFP reactive dyes. Similar to the results presented in Table 2, high exhaustion and fixation levels were obtained at the three mordanting methods and for all the mordant chemicals, the ones at pH 6 being the lowest of all. It could be concluded that the best %E and %T values were obtained at pH 2 for all three mordants and for the three mordanting methods.
The %E and %T values presented in Tables 2 and 3 according to mordanting methods, mordant chemicals and application pH levels implied that TFP and MCT/VS reactive dyes produced better exhaustion and fixation behaviors at a 2% owf dyeing concentration. All three reactive dyes were sensitive to the application pH level of pH 6, and they resulted in lower %E and %T values than the ones obtained at pH 2 and pH 4. The meta-mordanting method generally resulted in lower %E and %T values than the other two methods, probably because of ionic interactions of the opposite charges in the dyeing liquor when the chemicals were present at the same time in the dyebath. The effectiveness of the mordant chemicals changed in accordance with % dyeing concentrations, mordanting methods and application pH levels. They usually performed better at pH 2 and pH 4. For TFP and MCT/VS reactive dyes, dyeing at 0.5% owf with the application pH level of 6 resulted similar %E and %T values when the corresponding values obtained at pH 2 and pH 4 were considered. Dyeing at 2% owf with an application pH 6 resulted in lower %E and %T values with all three reactive dyes. The lowest exhaustion and fixation results were observed with MCT reactive dye at 0.5% owf dyeing concentration while the highest exhaustion was observed with TFP reactive dye at 2% owf and the highest fixation was obtained with MCT/VS reactive dye at 2% owf dyeing concentration. An overall consideration of %E and %T results presented in Tables 2 and 3 implies that although the exhaustion and fixation results of the three dyes have some common behaviors depending on the mordanting method, mordant chemical and application pH level, the MCT/VS reactive dye showed the best performance.
ΔE* Color Difference Values
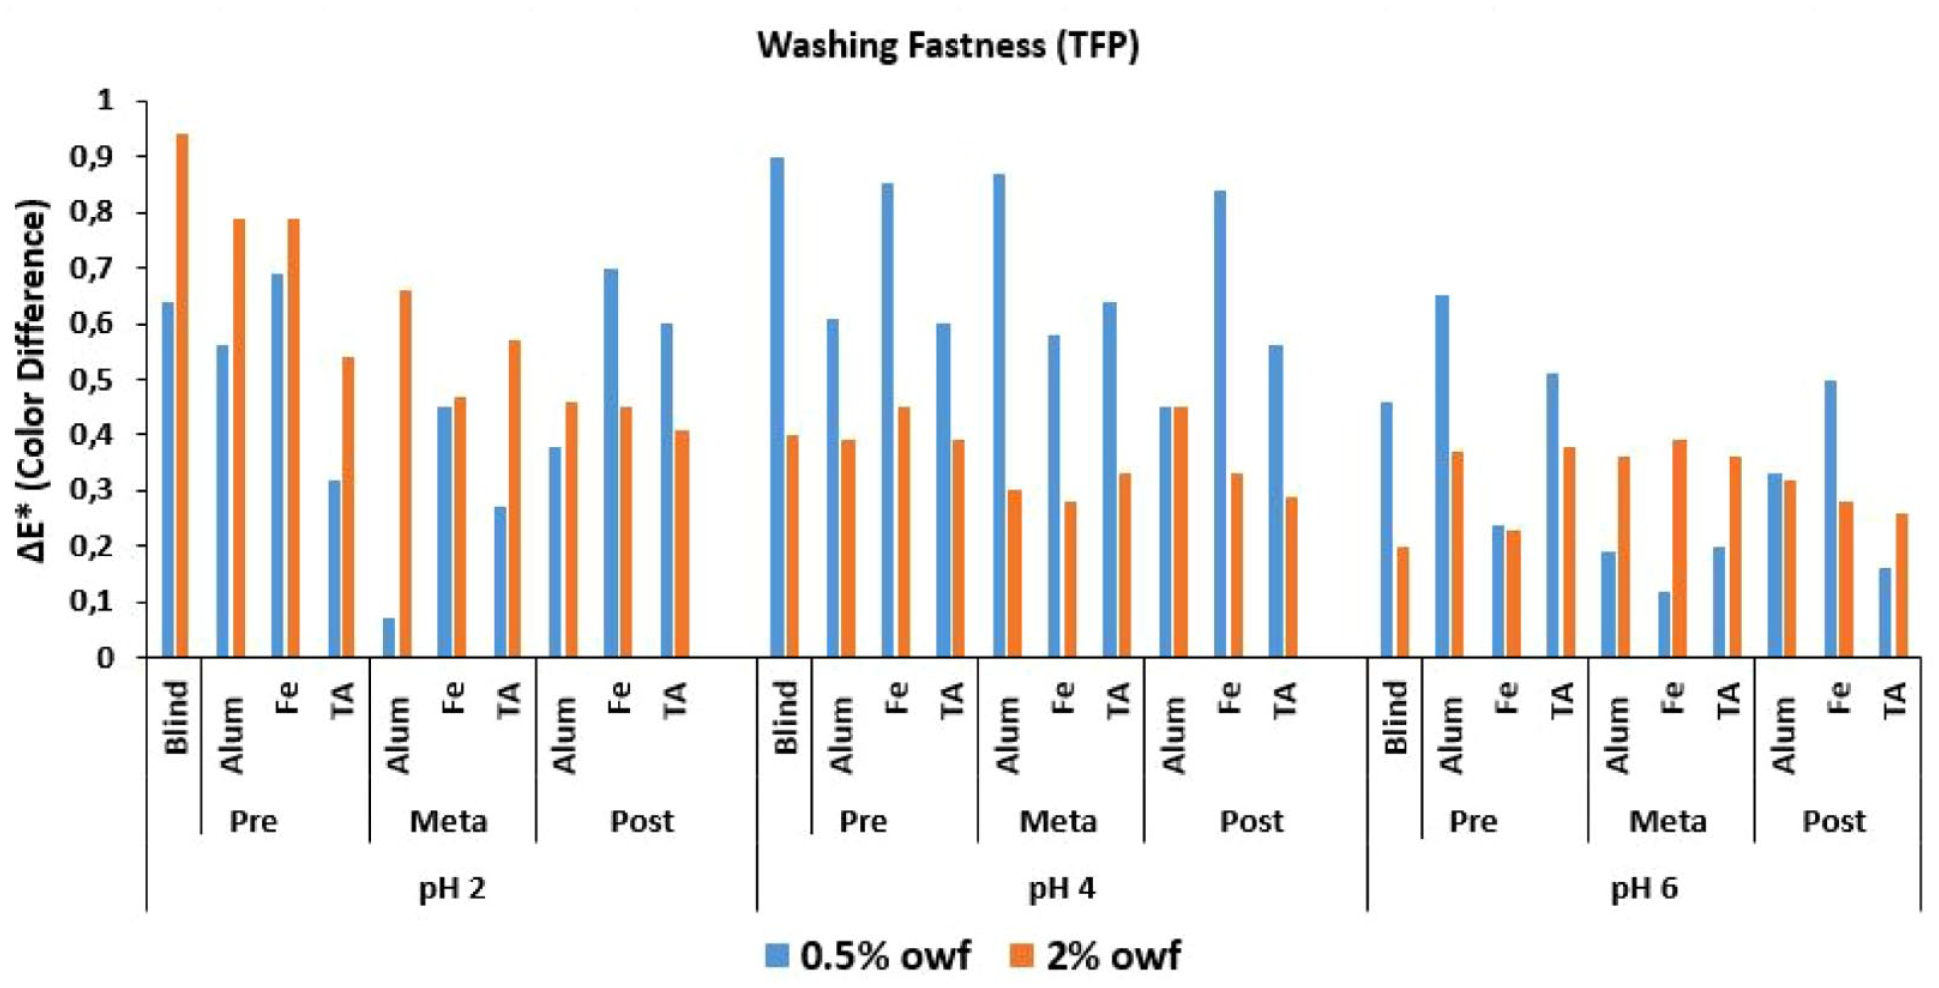
The ΔE* color difference values of the three reactive dyes applied at 0.5% and 2% owf dyeing concentrations are presented (with three mordanting methods, for three chemical mordants and at three pH levels) after pyridine extraction for MCT reactive dye (Figure 2), for TFP reactive dye (Figure 3) and for MCT/VS reactive dye (Figure 4) in the corresponding figures. ΔE* was calculated between the original dyed sample (taken as reference) and the same sample after pyridine extraction (taken as sample). In the figures “blind” is used for the dyeings without any mordant, “Alum” is used for dyeings including potassium aluminum sulfate, “Fe” is used for dyeings including iron (II) sulfate and “TA” is used for dyeings with tannic acid mordants.
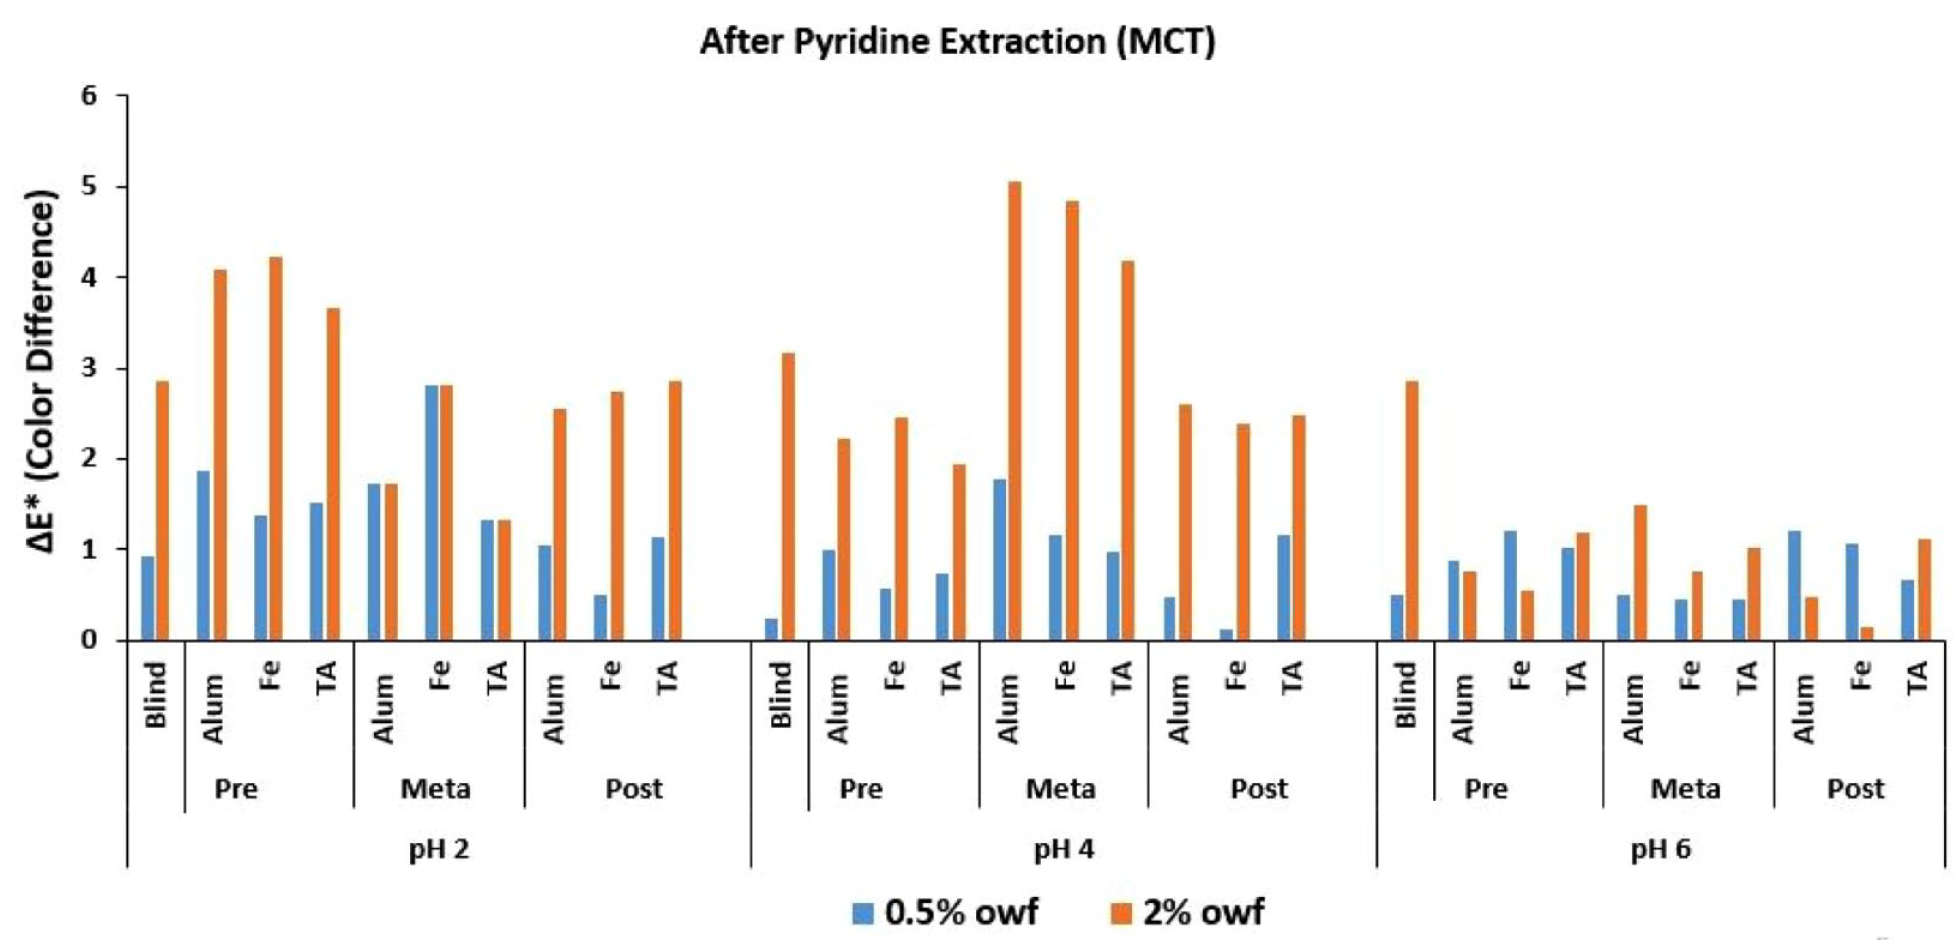
ΔE* values of MCT reactive dye after pyridine extraction.
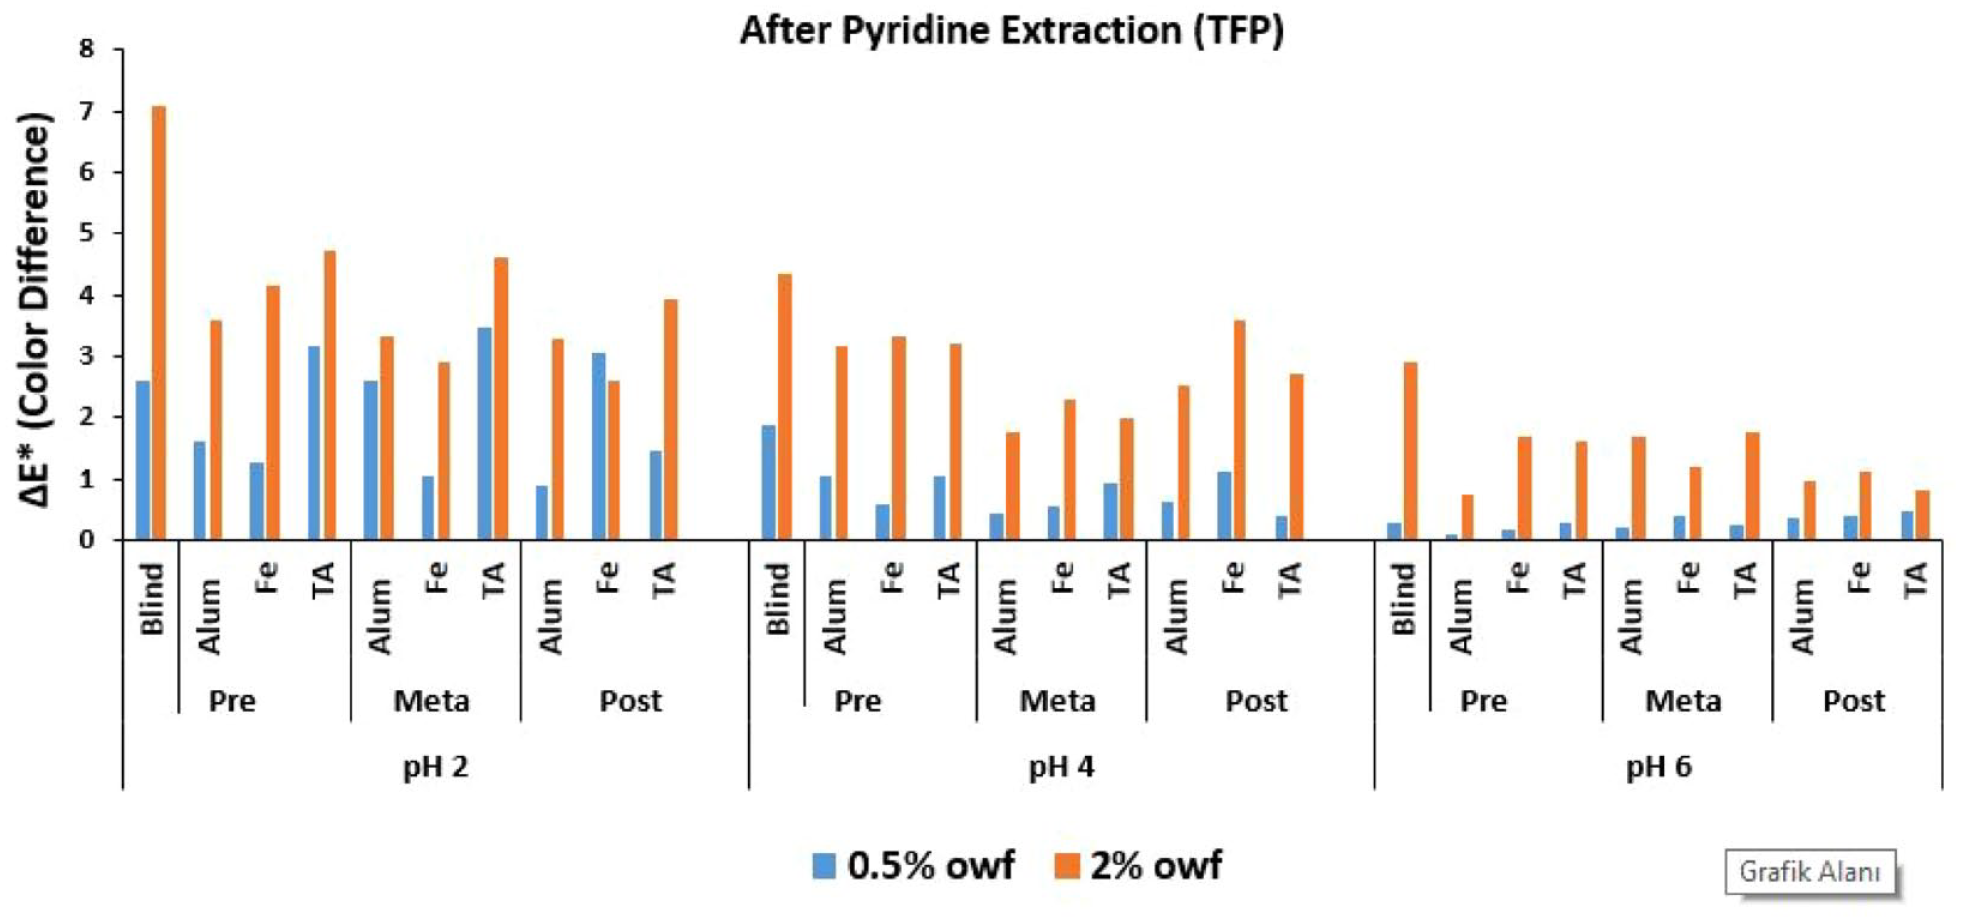
ΔE* values of TFP reactive dye after pyridine extraction.
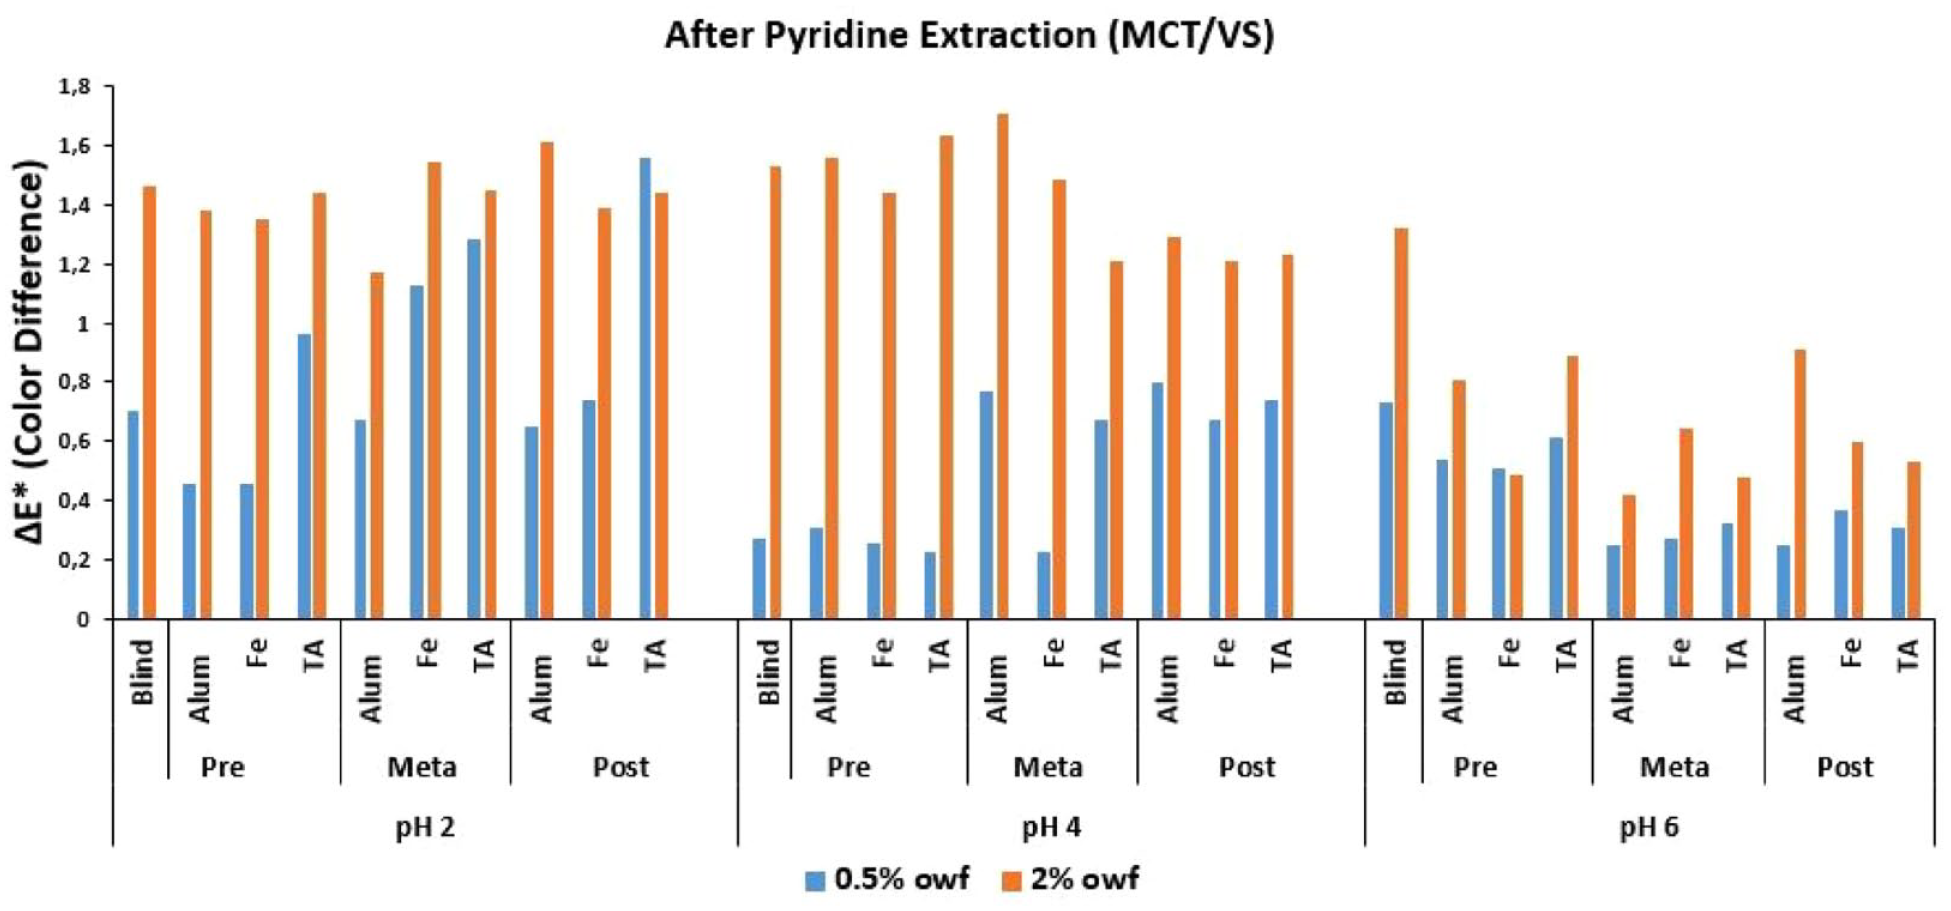
ΔE* values of MCT/VS reactive dye after pyridine extraction.
In Figure 2, where the ΔE* values obtained for the MCT reactive dye are presented, almost all the ΔE* values are above 1.0 indicating that visual color differences were obtained. In all, the 2% owf dyeing concentration showed higher ΔE* values than 0.5% owf in most cases and remarkable differences were observed. The ΔE* results revealed that the numeric differences changed basically with the application pH level. The highest color differences were obtained at dyeings performed at application pH 2 and pH 4 levels. The lowest color differences were obtained at application pH 6 which were due to the very low results of %E and %T at this pH level in both Tables 2 and 3. Generally, 0.5% owf dyeing concentration showed relatively smaller color differences than 2% owf at pH 4 than at pH 2.
In Figure 3 where the ΔE* values obtained for the TFP reactive dye are presented, the highest ΔE* values were obtained at 2% owf dyeing concentration and at application pH levels of 2 and 4, similar to the ΔE* values presented in Figure 2 for the MCT reactive dye. The lowest ΔE* values were obtained at pH 6. However, different from the %E and %T results of the MCT reactive dye (in Tables 2 and 3) the TFP reactive dye had high exhaustion and fixation levels at 0.5% owf dyeing concentration at all the pH levels, mordant chemicals and mordanting methods in Table 2. Especially, the application level of pH 6 had satisfactory exhaustion and fixation levels, opposite to the MCT reactive dye. The ΔE* values of TFP reactive dye were the highest for 0.5% owf and 2% owf dyeing concentrations at pH 2. The TFP reactive dye had relatively low color differences at pH 6 like the MCT reactive dye but their corresponding %E and %T values were much different. The reason for the low ΔE* values of TFP reactive dye at application level pH 6 was due to its high %E and %T values at this pH level while the reason for the low ΔE* values of MCT reactive dye at application level pH 6 was its low %E and %T values. These findings reveal that color differences of the dyes should be discussed by taking exhaustion and fixation levels into consideration because the highest and the lowest exhaustion and fixation levels resulted almost in the same numerical ΔE* values.
In Figure 4 where the ΔE* values obtained for the MCT/VS reactive dye are presented, the results are much different from the corresponding ones presented in Figures 2 and 3. Relatively low ΔE* values were obtained for the MCT/VS reactive dye. Almost all the ΔE* values obtained for 0.5% owf dyeing concentration were below 1.0 indicating that visual color differences could be hardly observed. Besides, the ΔE* values obtained for 2% owf dyeing concentration were below 2 and most of them were in the range of 1–1.5, indicating small visual color differences would be possible.
An overall discussion of Figures 2–4 revealed that the lowest ΔE* values were obtained at dyeings performed at pH 6. The MCT/VS reactive dye had the lowest ΔE* values at all the pH levels which could be the result of its high exhaustion and fixation values presented in Tables 2 and 3. However, it must be kept in mind that both high and low exhaustion and fixation properties resulted in small ΔE* values for different reasons. This observation was the most revealed at dyeings which were performed at pH 6. For this reason, exhaustion, fixation and color difference values must be discussed taking all the numerical results into account.
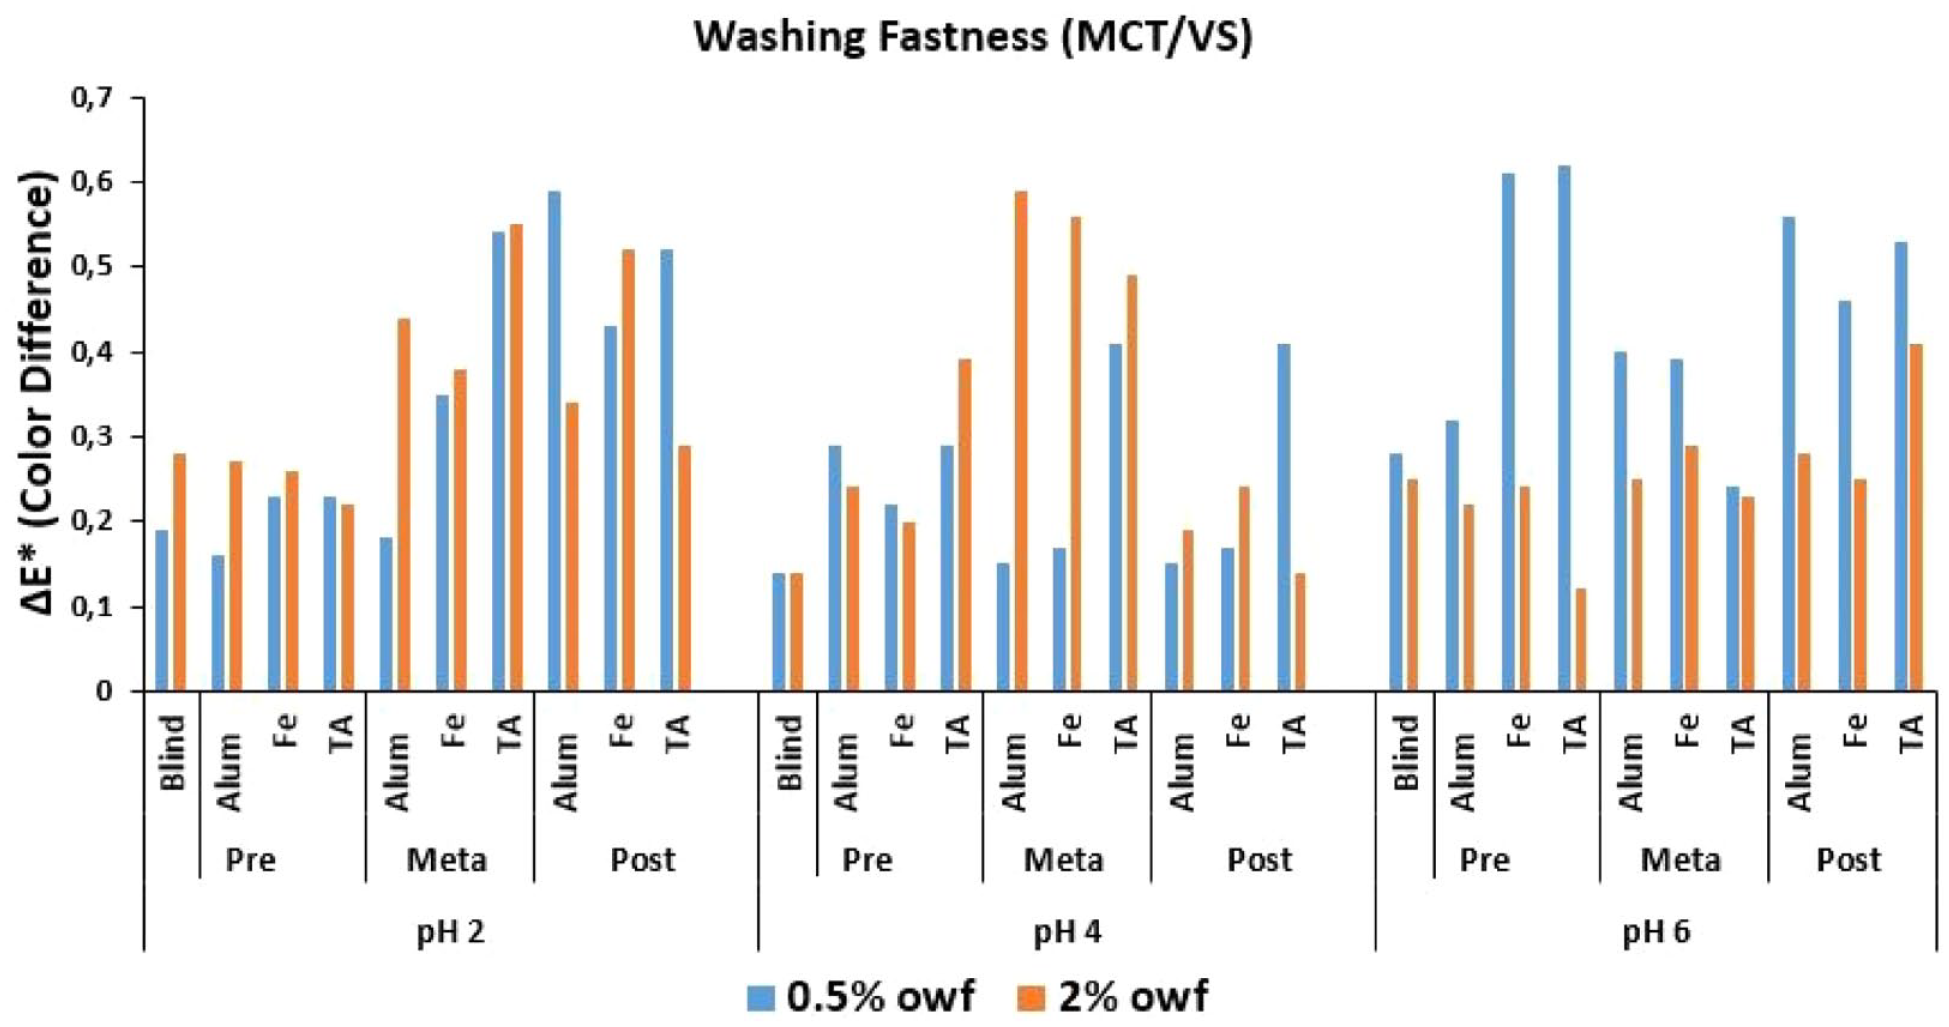
The ΔE* color difference values of the three reactive dyes applied at 0.5% and 2% owf dyeing concentrations are presented (with three mordanting methods, for three mordants and at three pH levels) after a wash fastness test for MCT reactive dye (Figure 5), for TFP reactive dye (Figure 6) and for MCT/VS reactive dye (Figure 7) in the corresponding figures. ΔE* was calculated between the original dyed sample (taken as reference) and the same sample after the wash fastness test (taken as the sample). All the ΔE* values were below 1.0 indicating that visual color differences were hard to observe between reference and sample colors. The ΔE* color difference values obtained for the MCT reactive dye are presented in Figure 5. When the ΔE* values in Figure 5 were considered, it was observed that generally a 0.5% owf dyeing concentration resulted in higher ΔE* values than the 2% owf dyeing concentration with pre- and meta-mordanting methods. The pyridine extraction had extracted the dye from fiber surfaces in an efficient way and the ΔE* values of 2% owf dyeings were remarkably higher (Figures 2–4). However, a relatively strong wash fastness test was applied (A2S) and the relatively low ΔE* values implied that a successful coloration was performed with acceptable wash fastness properties.
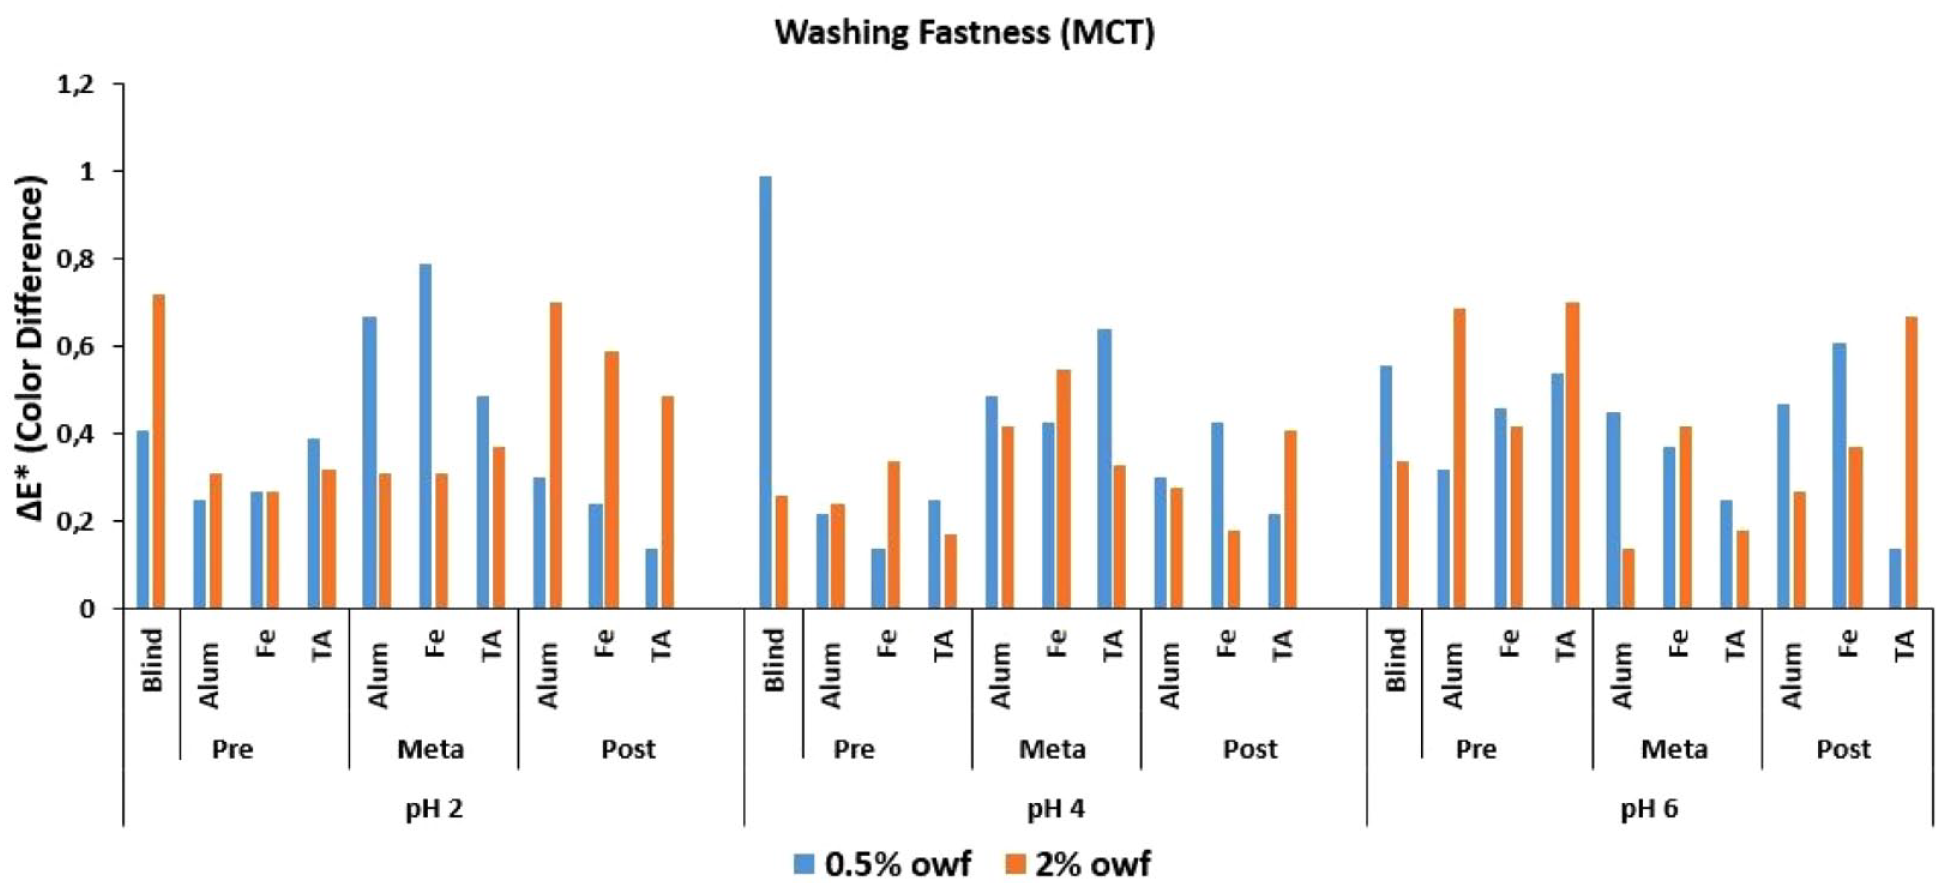
ΔE* values of MCT reactive dye after wash fastness test.
ΔE* values of TFP reactive dye after wash fastness test.
ΔE* values of MCT/VS reactive dye after wash fastness test.
The ΔE* color difference values obtained after a wash fastness test for TFP reactive dye are presented in Figure 6. Similar to the ΔE* values presented in Figure 5 for the MCT reactive dye, all the ΔE* values were below 1.0 which indicated that visual color differences were hard to observe between reference and sample colors. In connection with Figure 3, the relatively lowest ΔE* values were obtained for pH 6 dyeings. Besides, the ΔE* values obtained at 0.5% dyeing concentration were usually higher than that of 2% owf, showing similarity to the ΔE* values presented in Figure 5.
The ΔE* color difference values obtained after the wash fastness test for MCT/VS reactive dye are presented in Figure 7. Similar to the ΔE* values presented in Figure 5 for the MCT reactive dye, and in Figure 6 for the TFP reactive dye, almost all the ΔE* values were below 1.0 which indicated that visual color differences were hard to observe between reference and sample colors. Especially the ΔE* values obtained at 0.5% owf dyeing concentration were higher than those of 2% owf dyeing concentration at dyeings performed at pH 6. The %E and %T values obtained at 2% dyeing concentration at pH 6 were remarkably higher than those obtained at 0.5% owf dyeing concentration (Tables 2 and 3). Lower %E and %T values for 0.5% owf dyeing concentration resulted in slightly higher ΔE* values. However, all the ΔE* values were under 1.0 after the wash fastness test at the mordant dyeing experiments.
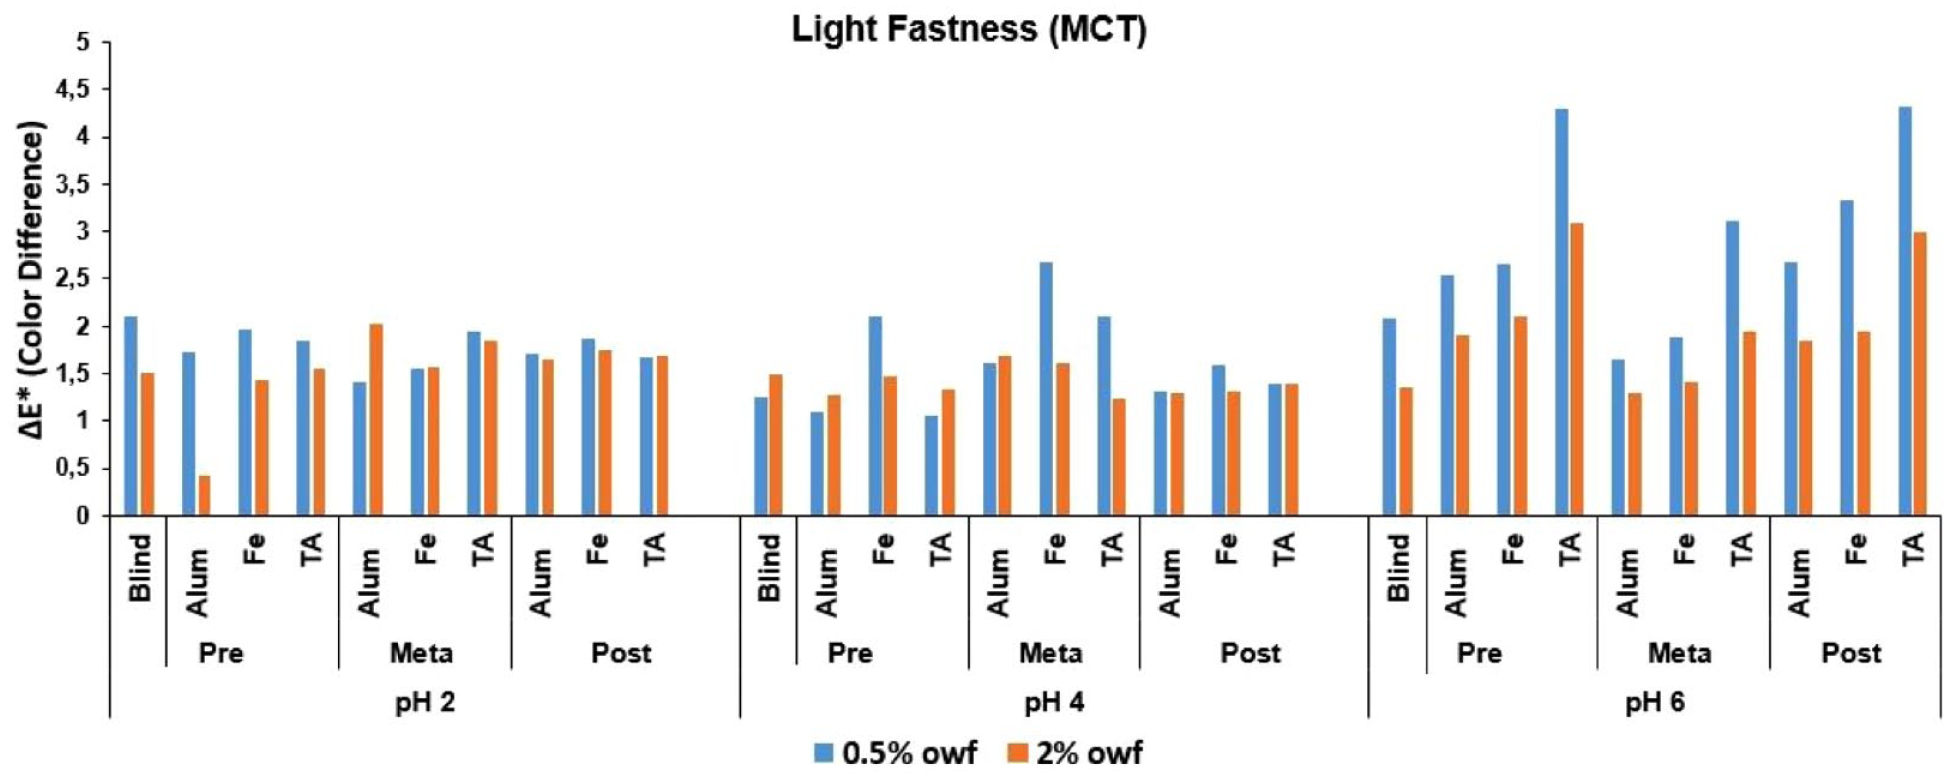
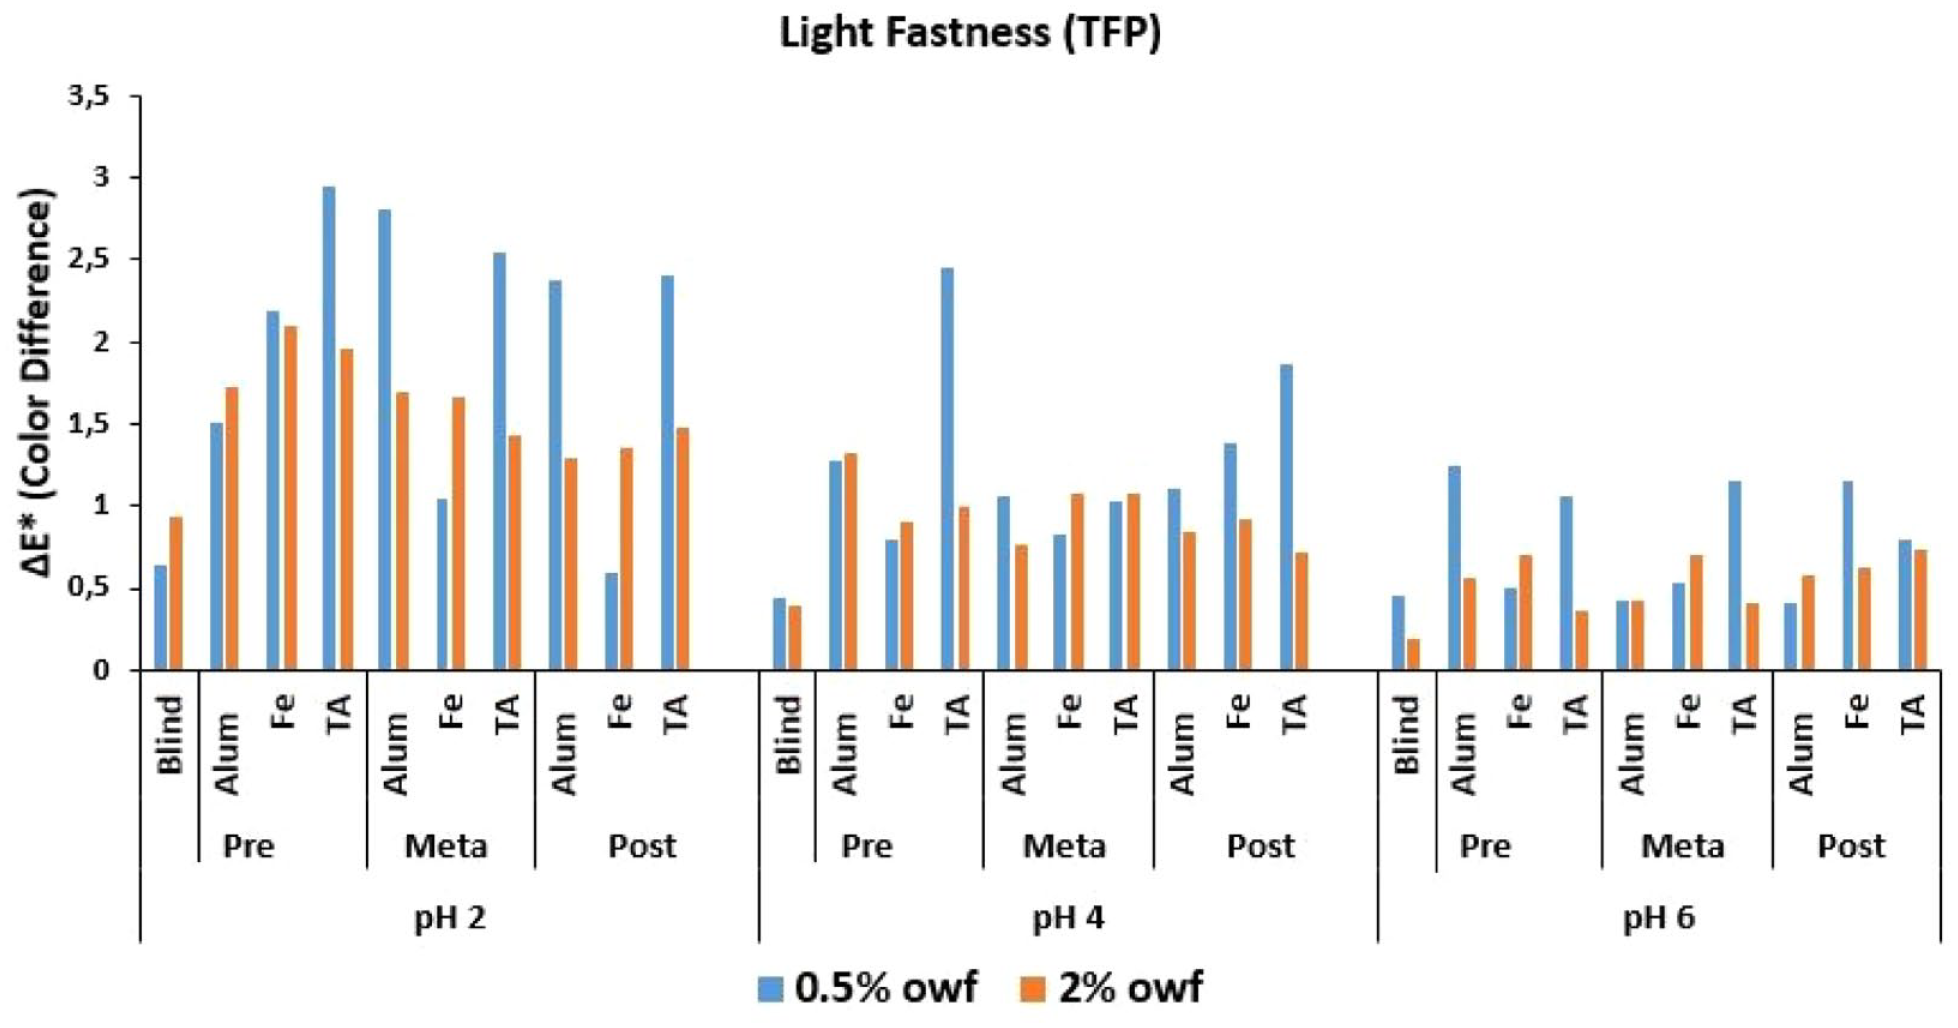
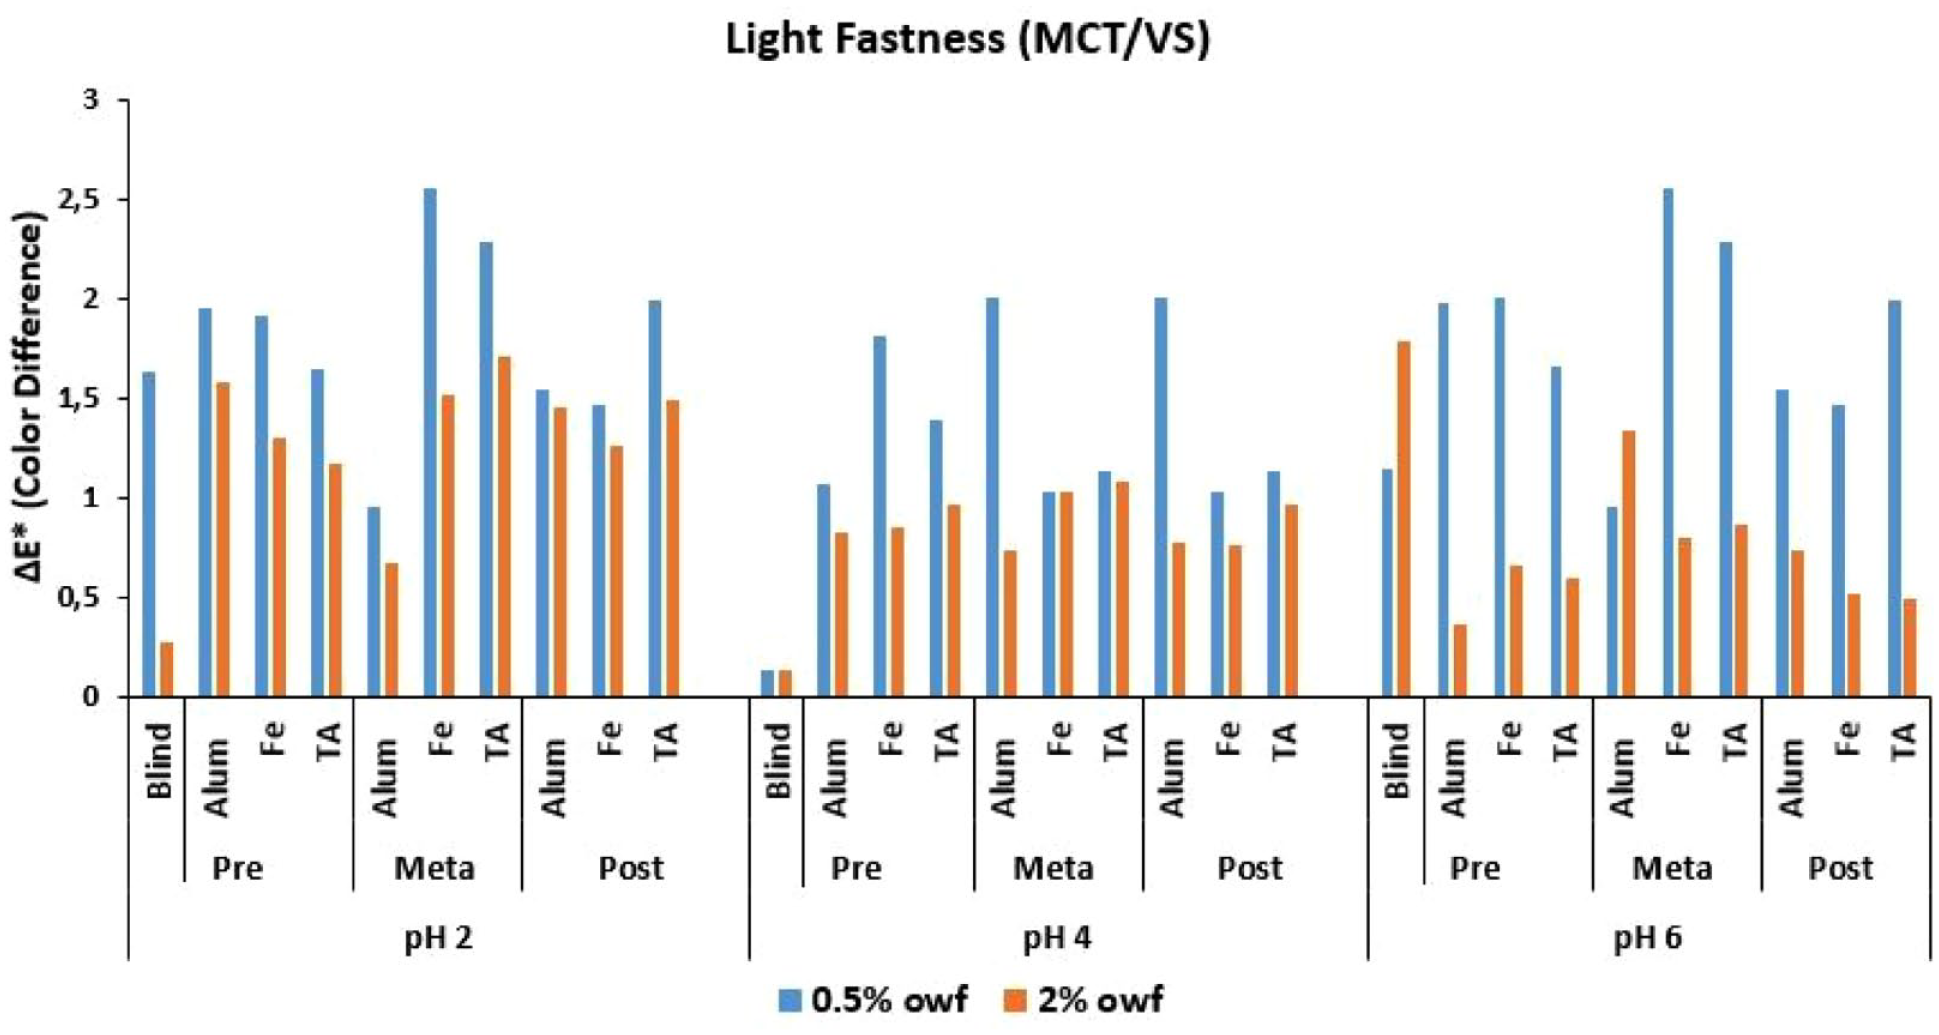
The ΔE* color difference values of the three reactive dyes applied at 0.5% and 2%owf dyeing concentrations are presented (with three mordanting methods, for three mordants and at three pH levels) after the light fastness test for MCT reactive dye (Figure 8), for TFP reactive dye (Figure 9) and for MCT/VS reactive dye (Figure 10) in the corresponding figures. ΔE* was calculated between the original dyed sample (taken as reference) and the same sample after the light fastness test (taken as sample) after 96 h of exposure. Ninety-six hours of exposure corresponds relatively to an L6–L4 shade change and a ΔE* value of 2.5. The ΔE* values were over 1.0 indicating that visible color differences were obtained after light fastness test. Nylon fibers are prone to the effects of light and dyed nylon fibers and fabrics could result in low light fastness grades due to the molecular fine structure. When nylon fabrics are stored in direct sunlight, the amine-end groups in the exposed areas suffer oxidative degradation and these areas will exhibit a lower affinity for anionic dyes. 26 A similar behavior could take place in the dyed fabrics and color loss could be observed because of the oxidative effect of the light fastness test on fiber and dye structures. ΔE* color difference values obtained for MCT reactive dye after the light fastness test are presented in Figure 8. Compatible with light fastness grade information for the % owf dyeing concentrations, which indicated that the color fastness of a deep dyeing of a particular dye often differs markedly from that of a pale dyeing of the same dye on the same material and stating that in the case of exposure to light, it is generally found that the deeper the dyeing the higher its fastness is in respect of change in color on exposure, 27 the deeper dyed nylon fabric samples (2% owf) had lower ΔE* values than lighter dyed (0.5% owf) fabric samples. Almost the same ΔE* values were obtained at dyeings performed at pH 2 and pH 4. The ΔE* values obtained at pH 6 were considerably higher than those of pH 2 and pH 4. This result was consistent with %E and %T values in Tables 2 and 3 which had the lowest numerical values.
ΔE* values of MCT reactive dye after light fastness test.
ΔE* values of TFP reactive dye after light fastness test.
ΔE* values of MCT/VS reactive dye after light fastness test.
The ΔE* color difference values obtained after light fastness test for the TFP reactive dye are presented in Figure 9. Similar to the ΔE* values in Figure 8 for the MCT reactive dye, the values were usually in the range of 1.0 or above. Opposite to the ΔE* values in Figure 8 for the MCT reactive dye, the lowest ΔE* values were observed at dyeings performed at pH 6. %E and %T values at pH 6 for the TFP reactive dye were almost the highest ones at pH 6 when compared with the corresponding results at pH 2 and pH 4 in Tables 2 and 3. The lowest %E and %T values after dyeing and the highest ΔE* values after the light fastness test were observed for dyeings performed at pH 6 for the MCT (Figure 8) reactive dye while the results were just the opposite for the TFP reactive dye. This finding revealed the close relation between exhaustion, fixation and fastness color change, and implied that drawing a conclusion just taking one variable into account could result in misleading information and conclusions.
The ΔE* color difference values obtained after the light fastness test for the MCT/VS reactive dye are presented in Figure 10. Almost all the ΔE* values were over 1.0 for the 0.5% owf dyeing concentration and almost all the ΔE* values were close to or lower than 1.0 for the 2% owf dyeing concentration. MCT/VS reactive dye had higher %E and %T values at 2% owf than 0.5% owf, and high exhaustion and fixation values resulted in low ΔE* values for the MCT/VS reactive dye. These ΔE* results were consistent with the ones presented in Figures 4 and 7.
An overall discussion of the ΔE* values presented in Figures 2–10 revealed that generally successful dyeings were obtained with the usage of metallic mordants. The ΔE* results showed distinct differences after pyridine extraction and after light fastness tests. The increase in dyeing concentration resulted in increased dye loss after extraction but resulted in lower ΔE* values after the light fastness test. ΔE* values obtained after wash fastness test were generally with in the limit of 1.0 or lower than 1.0 which indicated that visual color differences could be hardly observed after the test.
Low numerical ΔE* values were obtained at dyeings both with high and low exhaustion and fixation levels. These findings revealed that taking ΔE* values into consideration to make a final conclusion in the success of the dyeings could lead to an incorrect result. Although %E and %T and ΔE* values give information about the success of the dyeings, they should be taken into account in a cumulative way to reach a final and correct conclusion.
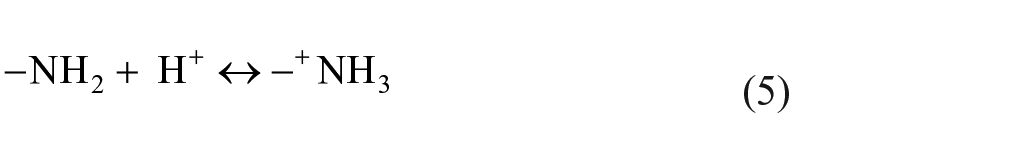
It was stated in the Introduction part that some reactive dyes, which were developed for cellulosic fibers, can be covalently fixed to nylon fibers at slightly acidic pH dyeing medium at the boil. Under these conditions, covalent bonds form between the dye and amino groups of nylon, without the need for an alkaline fixation step.9,12,28 As indicated by Burkinshaw and Gandhi12,13 and Burkinshaw and Wills, 14 under acidic conditions the terminal amino groups in the nylon fiber will be protonated according to Equation (5). Under these conditions an equilibrium will be established according to the number of hydrogen protons in the dye bath and in the fiber. Being in close contact with the amino groups in the fiber, the anionic reactive dyes will be adsorbed on the protonated terminal amino groups in the fiber via ion–ion forces under acidic dyeing conditions. Taking the equilibrium presented in Equation (5), it could be discussed that at any given time, the amino group in the fiber will exist in its non-protonated form, and can react with the adsorbed dye. With decreasing pH of the dye bath, the equilibrium will move to the right and the number of available nucleophilic amino groups will decrease. Three pH levels were used in this study, being pH 2, 4, and 6, and in the case of pH 6, the extent of dye fixation would be expected to be higher than that at pH 2 and pH 4.12,14 Besides, the same conclusion could be made between pH 2 and pH 4. Under low pH conditions in the dye bath, it can be considered that the anionic dye can have the chance to be attracted strongly to the protonated amino end group in the fiber, and an unprotonated amino end group can attack the reactive group of the adsorbed dye molecule which results in a dye–fiber reaction. The experimental exhaustion, fixation and color difference results presented in this study revealed that in order to make a clearer discussion and conclusion, all the experimental variables should be considered together. The exhaustion and fixation levels of the dyes changed mainly according to their reactive groups and application pH levels. The mordanting method and the mordant chemical used in dyeing gave correlating results with the reactive group and dyeing pH level.
The experimental results obtained in this research revealed that metallic mordants could be used in reactive dyeing of nylon fabrics. However, the success of the functional reactive groups changes with correlation of the mordanting method, mordant chemical and application pH level, besides % owf dyeing concentrations. The mordant concentration was chosen as the possible lowest one considering the environmental aspects of commercial dyeings. Better exhaustion and fixation results were obtained with higher mordant concentrations in the unpublished part of the research and higher mordant concentrations could be used in conventional dyeings whenever environmental restrictions allow.
Conclusion
Nylon fabric was dyed with three reactive dyes having different functional groups in the presence of three chemicals mordants at two different dyeing concentrations by applying three mordanting methods and three dyeing pH levels. Exhaustion and fixation properties were researched along with wash fastness and light fastness by the extraction and color measurements. The results revealed that nylon fabric could be dyed with reactive dyes in the presence of chemical (metallic) mordants. However, the independent variables (mordanting method, mordant chemical, application pH level, and dye concentration) applied in dyeing experiments showed that the dependent variables (%E, % T, ΔE* and fastness) do not change uniformly. The dyeing results were prone to the experimental variables. TFP and MCT/VS reactive dyes performed better than MCT reactive dye. A complex correlation was obtained among mordanting methods, mordant chemicals and pH levels. Usually lower exhaustion and fixation levels were obtained at meta-mordanting than with the other two methods. An application pH level of 6 generally caused lower exhaustion and fixation at 2% dyeing concentration. Alum and iron II sulfate resulted in similar values but the results obtained with tannic acid changed very much with experimental variables. Environmentally accepted metallic mordant concentration could be used in reactive dyeing of nylon fabrics with optimized mordanting methods and pH levels.
Footnotes
Acknowledgements
The authors thank Bursa Uludag University Scientific Research Projects Coordination Unit for the financial support (Project No. FYL-2021-332) which made this research possible. The authors thank Bursalı Tekstil San. ve Tic. A.Ş. for its kind support in the usage of laboratory facilities. The authors thank Dr Mehmet Tiritoglu for his kind support in the experimental part.
Declaration of conflicting interests
The author(s) declared no potential conflicts of interest with respect to the research, authorship, and/or publication of this article.
Funding
The author(s) disclosed receipt of the following financial support for the research, authorship, and/or publication of this article: This study was supported by Bursa Uludag University Scientific Research Projects Coordination Unit (Project No. FYL-2021-332).