
Abstract
Textile wastewater treatment is a complex process that requires a range of chemicals and generates hazardous sludge. This article evaluates a chemical-free, floating treatment wetlands system for the treatment of textile wastewater containing reactive red and reactive yellow dyes. Two aquatic plants, Eichhornia crassipes Solms and Pistia stratiotes L., were selected and vegetated in the system. The efficacy of the system was enhanced by inoculation of two pollutant-degrading and plant growth-promoting bacteria: Bacillus cereus and Bacillus subtilis. The eight treatments were designed with different combinations of plants and bacteria. The performance of the system was evaluated through key parameters of electrical conductivity, total dissolved solid, total suspended solids, biological oxygen demand, chemical oxygen demand, and dye concentration for the treated wastewater. The best treatment achieved the optimized plant–bacteria synergism and exhibited good reductions in the physicochemical parameters and the values of all the wastewater parameters were within the limits set in the standards of National Environmental Quality Standards and Zero Discharge of Hazardous Chemicals Program.
Keywords
Introduction
Textile wastewater is harmful for the ecosystem when it is discharged into water bodies with no or minimum treatment. Wastewater treatment prevents water pollution and protects the ecosystem. In textile manufacturing, the textile processing division discharges the highest quantities of hazardous wastewater containing different chemicals and dyes.1,2 In the textile wastewater, the disposal of dyes has many issues such as color contamination, complex structures of dyes, low biodegradability, and the formation of toxic effluents. In the textile dyeing process, up to 40% of the dye remains unfixed and enters into the water bodies. 3 The reactive dyes are extensively used in the textile industry and are the major hazardous contaminants in the textile wastewater. The reactive dyes have more stability and low degradability due to their complex aromatic structures. For the removal of textile dyes from the wastewater, the existing literature studied various methods such as solidification and stabilization, ion exchange, chemical precipitation, disinfection, ozone-based oxidation, adsorption, sedimentation, flocculation, floatation, coagulation, osmosis, neutralization, reduction, oxidation, electrolysis, and membrane filtration. However, these conventional methods have many disadvantages such as low efficiency for color removal, generation of high quantities of hazardous sludge, high concentration of acid to maintain pH, high cost, frequent fouling of the membrane, need for various pre-treatment processes, and the highly concentrated dye sludge. These physical and chemical techniques consume more energy and chemicals. Biological techniques are cheaper and more eco-friendly compared with oxidation/physical techniques. 4
Biological techniques use microbes such as bacteria, algae, and fungi. In the existing literature related to biological techniques, most of the studies used various microbes to remove reactive dyes, some studies used plant-based treatment (phytoremediation), and some studies used plant–microbe synergism (Table 1).
Literature related to the removal of reactive dyes using biological techniques.
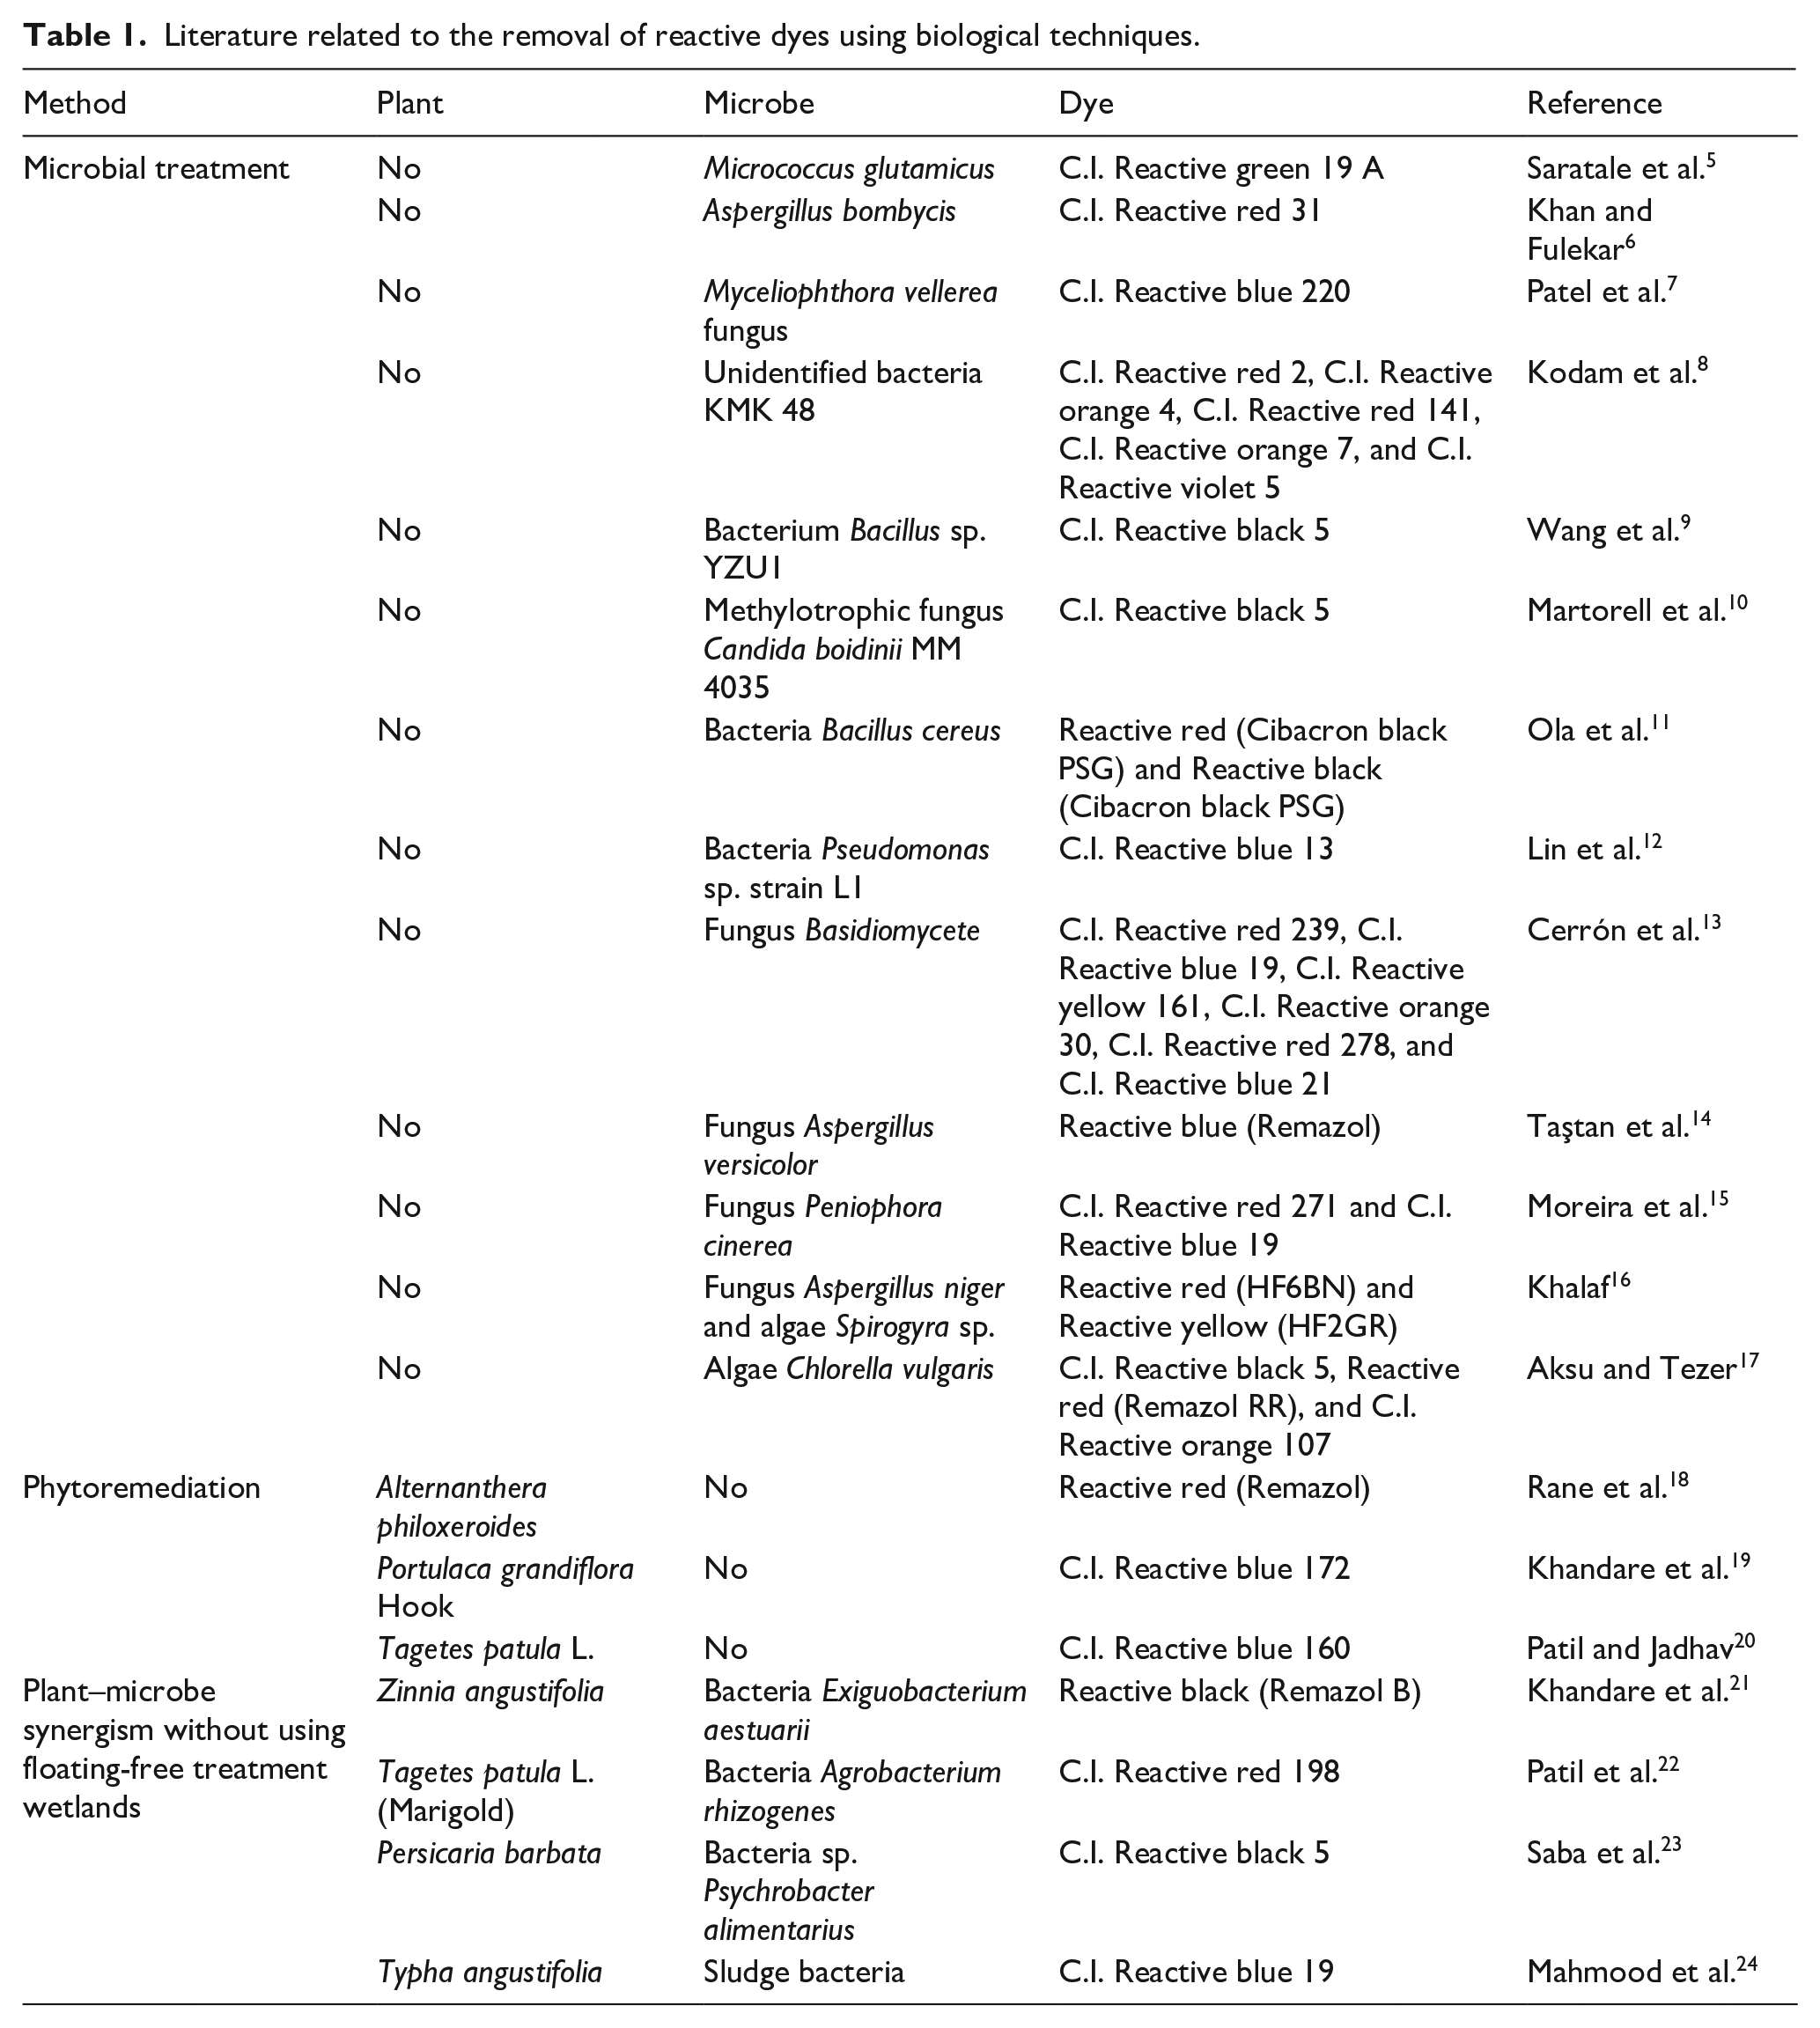
It can be observed that only one study used the bacteria Bacillus cereus without plants and floating wetland to remove reactive red and reactive black dyes from the wastewater and even in that case the reactive red and black dyes were different than this article. 11 Similarly, another researcher has reported the use of two plants, Eichhornia crassipes and Pistia stratiotes, in plant-based treatment of general (non-textile) wastewater but without bacteria assistance and floating treatment wetlands (FTWs). 25 FTWs are a more cost-effective and energy-saving technique as compared to the other biological techniques. The detailed mechanism of plant–bacteria synergism in FTWs can be found in the literature. 26 With reference to the studies related to plant–microbe synergism in FTWs, one study used the microbe Bacillus cereus for sewage effluent treatment, 27 another research used microbe Bacillus subtilis for the treatment of wastewater from an oil field, 26 and a third study used the plant Pistia stratiotes for the removal of heavy metal Cr. 28 It can be concluded that there is no research that used the plants Eichhornia crassipes and Pistia stratiotes and the microbes Bacillus cereus and Bacillus subtilis for the removal of dyes from the wastewater in the floating-free treatment wetlands. Hence, this article used the plants Eichhornia crassipes and Pistia stratiotes and microbes the Bacillus cereus and Bacillus subtilis for the removal of reactive red and reactive yellow dyes from wastewater in an FTW system. In the proposed system, this article evaluates the physicochemical parameters for eight different treatments designed with different combinations of the plants and bacteria. Figure 1 has been developed by authors to understand the mechanism of the plant-assisted microbial method. It can be observed that the plants absorb nutrients and other contaminants through their roots by a phyto-uptake process.
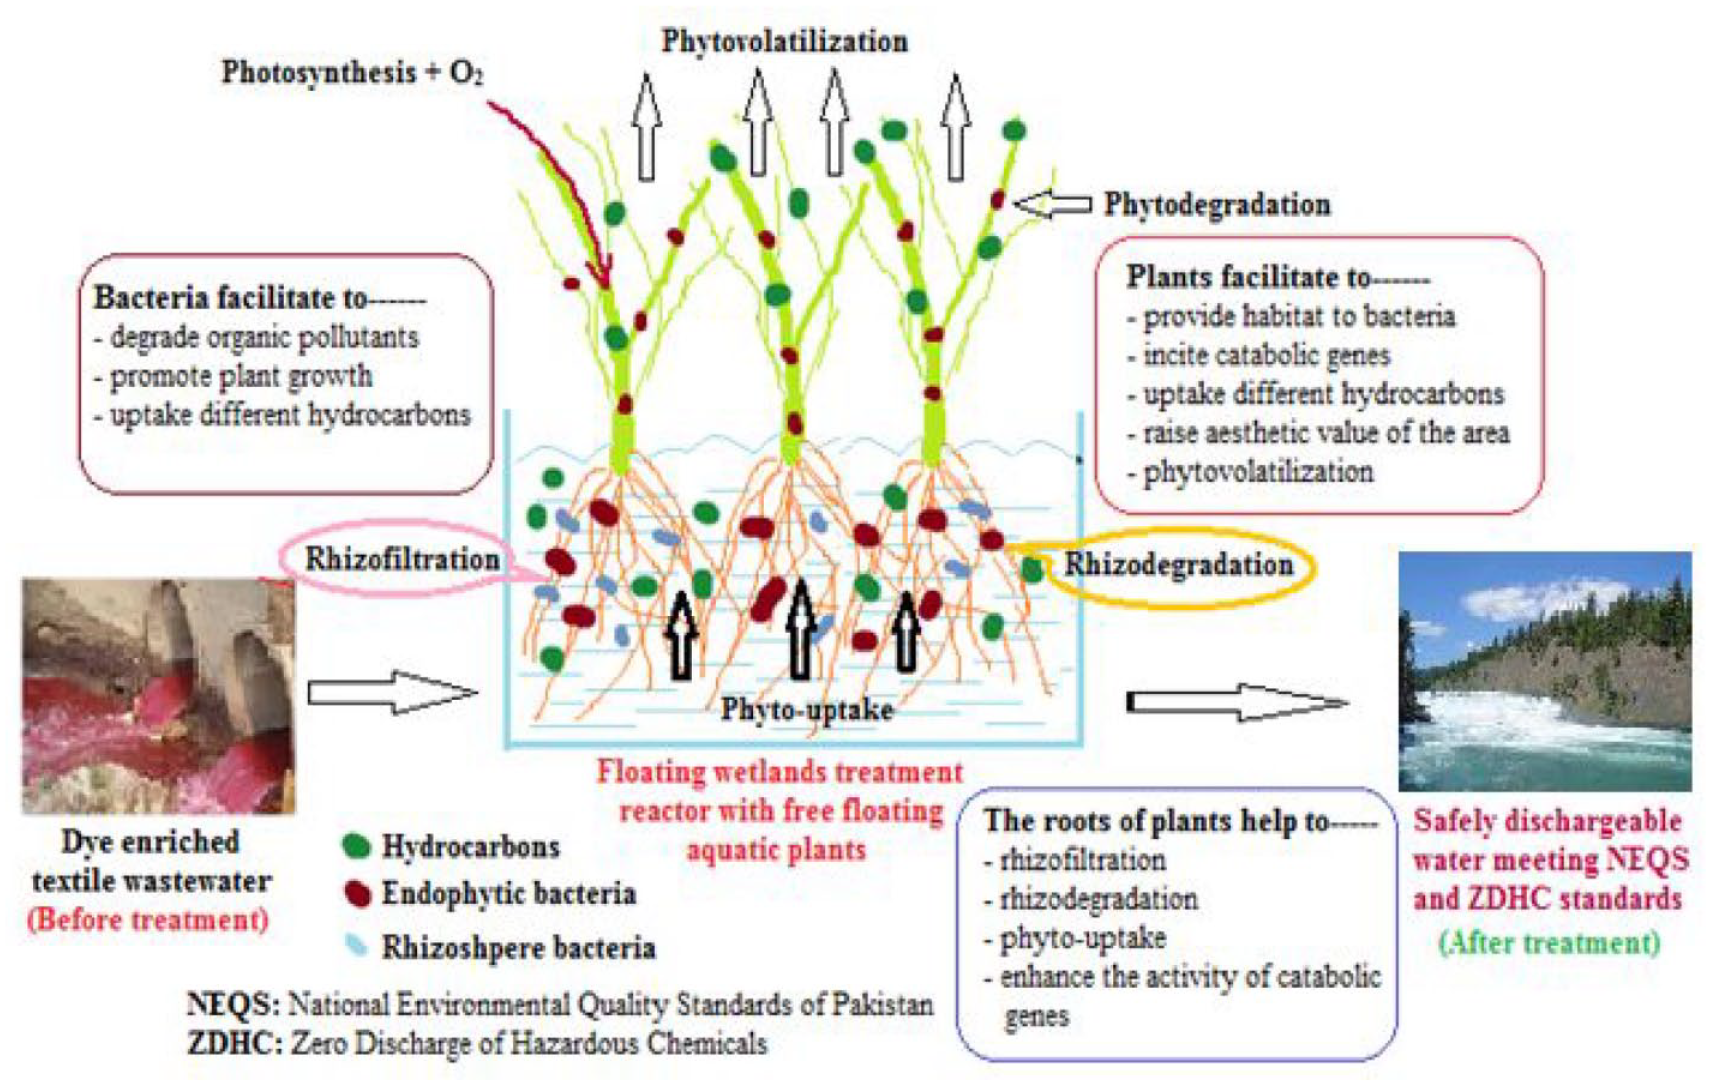
Mechanism of the plant-assisted microbial method.
Materials and Methods
The reactive red (Bezaktiv HP-3B) and reactive yellow (Bezaktiv HP-NP) Azo dyes were supplied by the chemical company “CHT” and both were commercial dyestuffs. For each dye, the textile wastewater solution was prepared using water, 1.0 g/L dye, 5.0 g/L Glauber’s salt, and 0.4 g/L soda ash, and it was termed the control solution. Glauber’s salt and soda ash were laboratory-grade chemicals purchased from ICI Pakistan. These are the typical ingredients of reactive dyeing. The two bacterial strains Bacillus cereus and Bacillus subtilis were collected from the Soil Microbiology and Biochemistry Laboratory of the Institute of Soil and Environmental Sciences, University of Agriculture Faisalabad, Pakistan where these strains were previously isolated with accession numbers LK 939133 and LK 939130, respectively, using general purpose agar media (glucose peptone agar media) with the composition “Glucose 1.5 ml/L, Ammonium sulfate 0.5 ml/L, Potassium hydrogen phosphate 0.5 ml/L, Peptone 0.5 ml/L, Magnesium sulfate hepta hydrate 0.1 ml/L, and Agar 20 ml/L using dilution plate technique.”29,30 Media plates were inoculated with soil solution and incubated at 28±2°C for 72 h. Colony-forming units (CFUs/g soil) from each soil sample were calculated. The bacterial isolates were assessed for their potential to biodegrade polycyclic aromatic hydrocarbon using Bushnell–Haas broth in 24-well microtiter plates. 31 To verify plant growth-promoting characteristics, bacteria were also tested for ACC deaminase activity. 32 The developed strains were stored at 4°C and used as per the specified time in treatment reactors. Before applying them to treatment reactors, they were acclimatized for 30 min in ambient conditions.
The two plants Eichhornia crassipes and Pistia stratiotes exist abundantly in many fresh and wastewater bodies located in the surroundings of Lahore and Faisalabad, which are the hub of textile industry in Pakistan. These plants flourish well in wastewater bodies naturally from July to December. Fully grown plants were collected from the local water bodies located in the surroundings of Faisalabad city and then the plants were rinsed with fresh water to remove any impurities and later stored in water tubs of circular shape having 76 cm diameter and 30 cm depth under ambient conditions for the development of the nursery (Figure 2). To survive in the textile wastewater, they were acclimatized’ to the textile wastewater for 1 week with increasing ratios of tap water and textile wastewater (i.e. 100:0, 80:20, 60:40, 40:60, 20:80, and 0:100). After getting immunity, the plants flourished well in the pure textile wastewater and increased their population to double within 10 days.
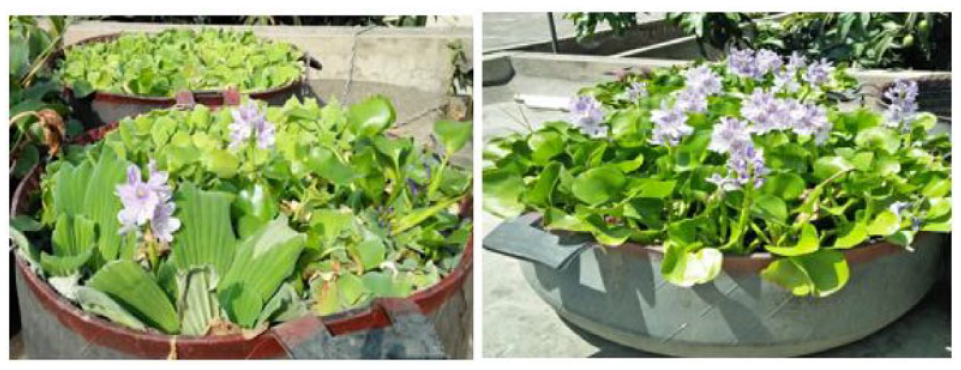
Plant storage and nursery development.
In this research, laboratory scale FTW reactors were developed. The FTW system was designed in transparent polyethylene containers (39 cm × 28 cm × 20 cm) of 10 L capacity. In each container, 10 L of solution was prepared for each dye separately. For each dye, one reactor (C) for “Control solution” and eight reactors (T1–T8) for treatment were developed as provided in Table 2.
Description of control solution and eight treatments.
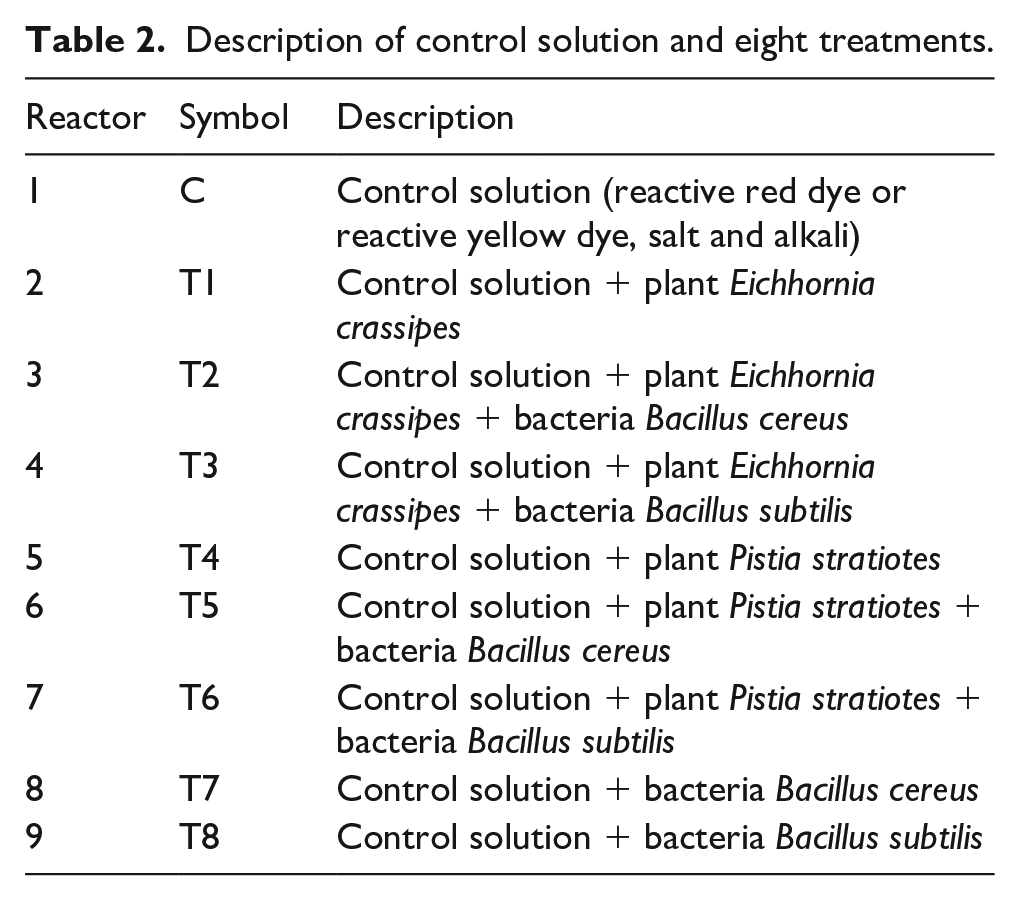
Five samples of Eichhornia crassipes or Pistia stratiotes were selected for each reactor involving plants (T1 to T6). The roots of all plants were washed thoroughly and put into a specific reactor. During the experiments which involved bacteria, each plant was dipped in 500 mL of broth of a bacterium for 40 min to improve the interaction between the plant and bacterium. Then these plants were transferred to the required treatment reactor. After the completion of treatment reactors, a 500 mL sample of textile effluent was taken from each reactor in a transparent plastic bottle that had been washed thoroughly with distilled water. Each sample was taken after four retention time intervals including before treatment, 24, 48, and 72 h. Then, the physicochemical parameters of treated wastewater were determined in terms of pH, electrical conductivity (EC), total dissolved solids (TDS), total suspended solids (TSS), biological oxygen demand (BOD), chemical oxygen demand (COD), and dye concentration. pH, EC, TDS, and BOD were measured by the respective digital meters. TSS was measured by the filtration method. COD was tested by the reflux method. Dye concentration was measured by a ultraviolet–visible (UV/Vis) spectrophotometer. For dye concentration measurement, maximum absorbance for red and yellow were scanned on the spectrophotometer as 600 and 550 nm, respectively. These values were kept as a standard during the analysis of other samples of the experiment. For each physicochemical parameter, the mean of three values was obtained and their standard errors were calculated. The comparison of the obtained values was made with the industrial and municipal wastewater quality standards set in the National Environmental Quality Standards (NEQS) and zero discharge of hazardous chemicals (ZDHC). Table 3 presents the limits set by these two quality standards.
Symbols, units, and standards for wastewater parameters.
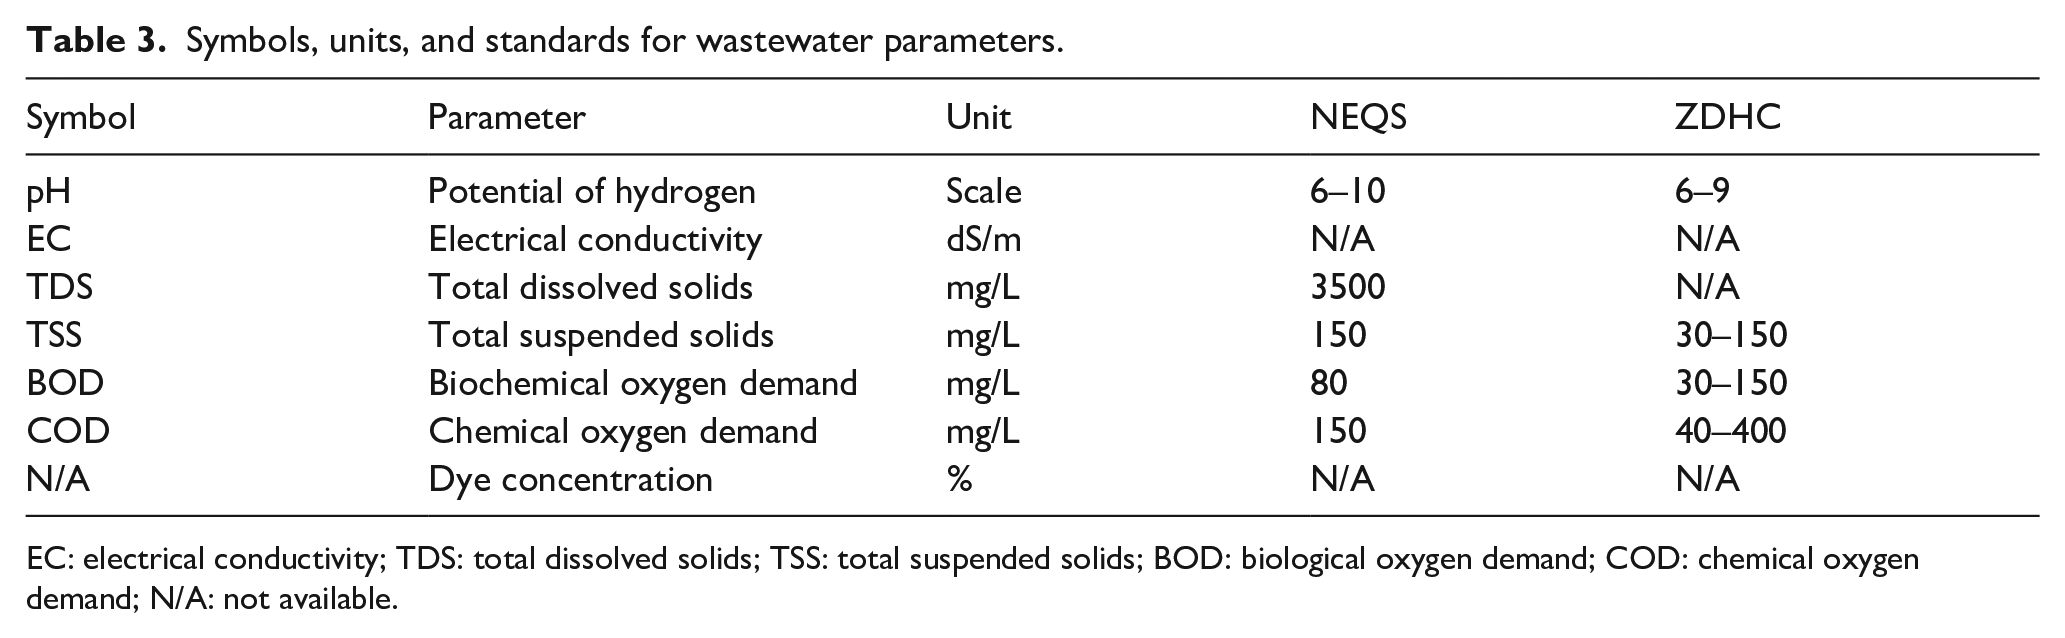
EC: electrical conductivity; TDS: total dissolved solids; TSS: total suspended solids; BOD: biological oxygen demand; COD: chemical oxygen demand; N/A: not available.
Test Methods
pH Measurement
In this study, an ML.1010 pH meter of HANNA instruments was used to measure the pH of untreated and treated samples after calibrating it with 4 and 9 pH standard buffer solutions. This is a direct reading instrument with an electrode and pH-indicating digital reflector or screen.
EC and TDS Measurement
In this study, the EC and TDS of samples were measured using a portable HACH CO150 EC and TDS measuring meter. This meter measures both the EC and TDS of liquid samples with the help of an electrode that is dipped in the solution and the meter reflects the reading of EC and TDS in digital form on its screen. Before starting the measurements, the instrument was calibrated with standard solutions of known EC and TDS values. After calibrating the instrument, the treatment samples were tested for EC and TDS.
TSS Measurement
The TSS of the solution under this study was measured by applying a filtration method. A filter paper of 1.2 µm pore size was taken. Its dry weight was calculated. Then, a sample of 50 mL was taken from the dye-enriched solution and filtered through this filter paper. After this, the filter paper was oven dried at 105°C temperature for 24 h using an electric oven from Memmert Germany and then its dry weight was noted. The TSS was calculated from the weight difference of the filter paper before and after filtration.
BOD Measurement
Organic pollutants are highly oxygen demanding. Carbon is the most important factor. Oxygen is used for the degradation of the carbon, which is measured by a standard test called the BOD 5-day test (the amount of dissolved oxygen (DO) per liter). Thus, the DO is the basis of the BOD test. The five day biochemical oxygen demand (BOD5) of the solution was measured by a BOD meter BD 600 of Lovibond Company England. The range for the BOD5 measurement was set from 0 to 200 mg/L.
COD Measurement
The COD of the sample solution in this study was measured applying the standard reflux method. Potassium dichromate in the presence of sulfuric acid was used as an oxidizing agent in the determination of COD. A known volume of water sample was refluxed with a known volume of potassium dichromate and sulfuric acid in the presence of mercuric sulfate to neutralize the effect of chlorides and silver sulfate (catalyst). The remaining amount of potassium dichromate after completing reflux was titrated against ferrous ammonium sulfate using ferroin as an indicator. The amount of K2Cr2O7 used is proportional to the oxidizable organic matter present in the sample. After adopting the standard procedure, the COD was calculated as follows:

where,
A = mL of ferrous ammonium sulfate used for blank,
B = mL of ferrous ammonium sulfate used for the sample water, and
N = normality of ferrous ammonium sulfate.
Color Concentration Measurement
Color concentration was measured by a UV/Vis spectrophotometer, JENWAY 6305, UK. The maximum absorbency was set according to the solution. The basic principle of UV/Vis spectrophotometry is based on the Beer–Lambert Law. According to this law, when a beam of monochromatic light is passed through a solution having absorbing substance, the decrease in the rate of the radiation intensity directly relates to the concentration of the solution. This law is generally expressed through the following equation:

Here, A = absorbance,
I0 = intensity of light upon sample cell,
I = intensity of light departing the sample cell,
E = molar absorptivity,
L = length of the sample cell, and
C = concentration of solute.
Results and Discussion
Figures 3–5 present the effect of different treatments and retention times on the different parameters. In each figure, each value is the mean of three repeats. The error bars show the standard errors among these three repeats.
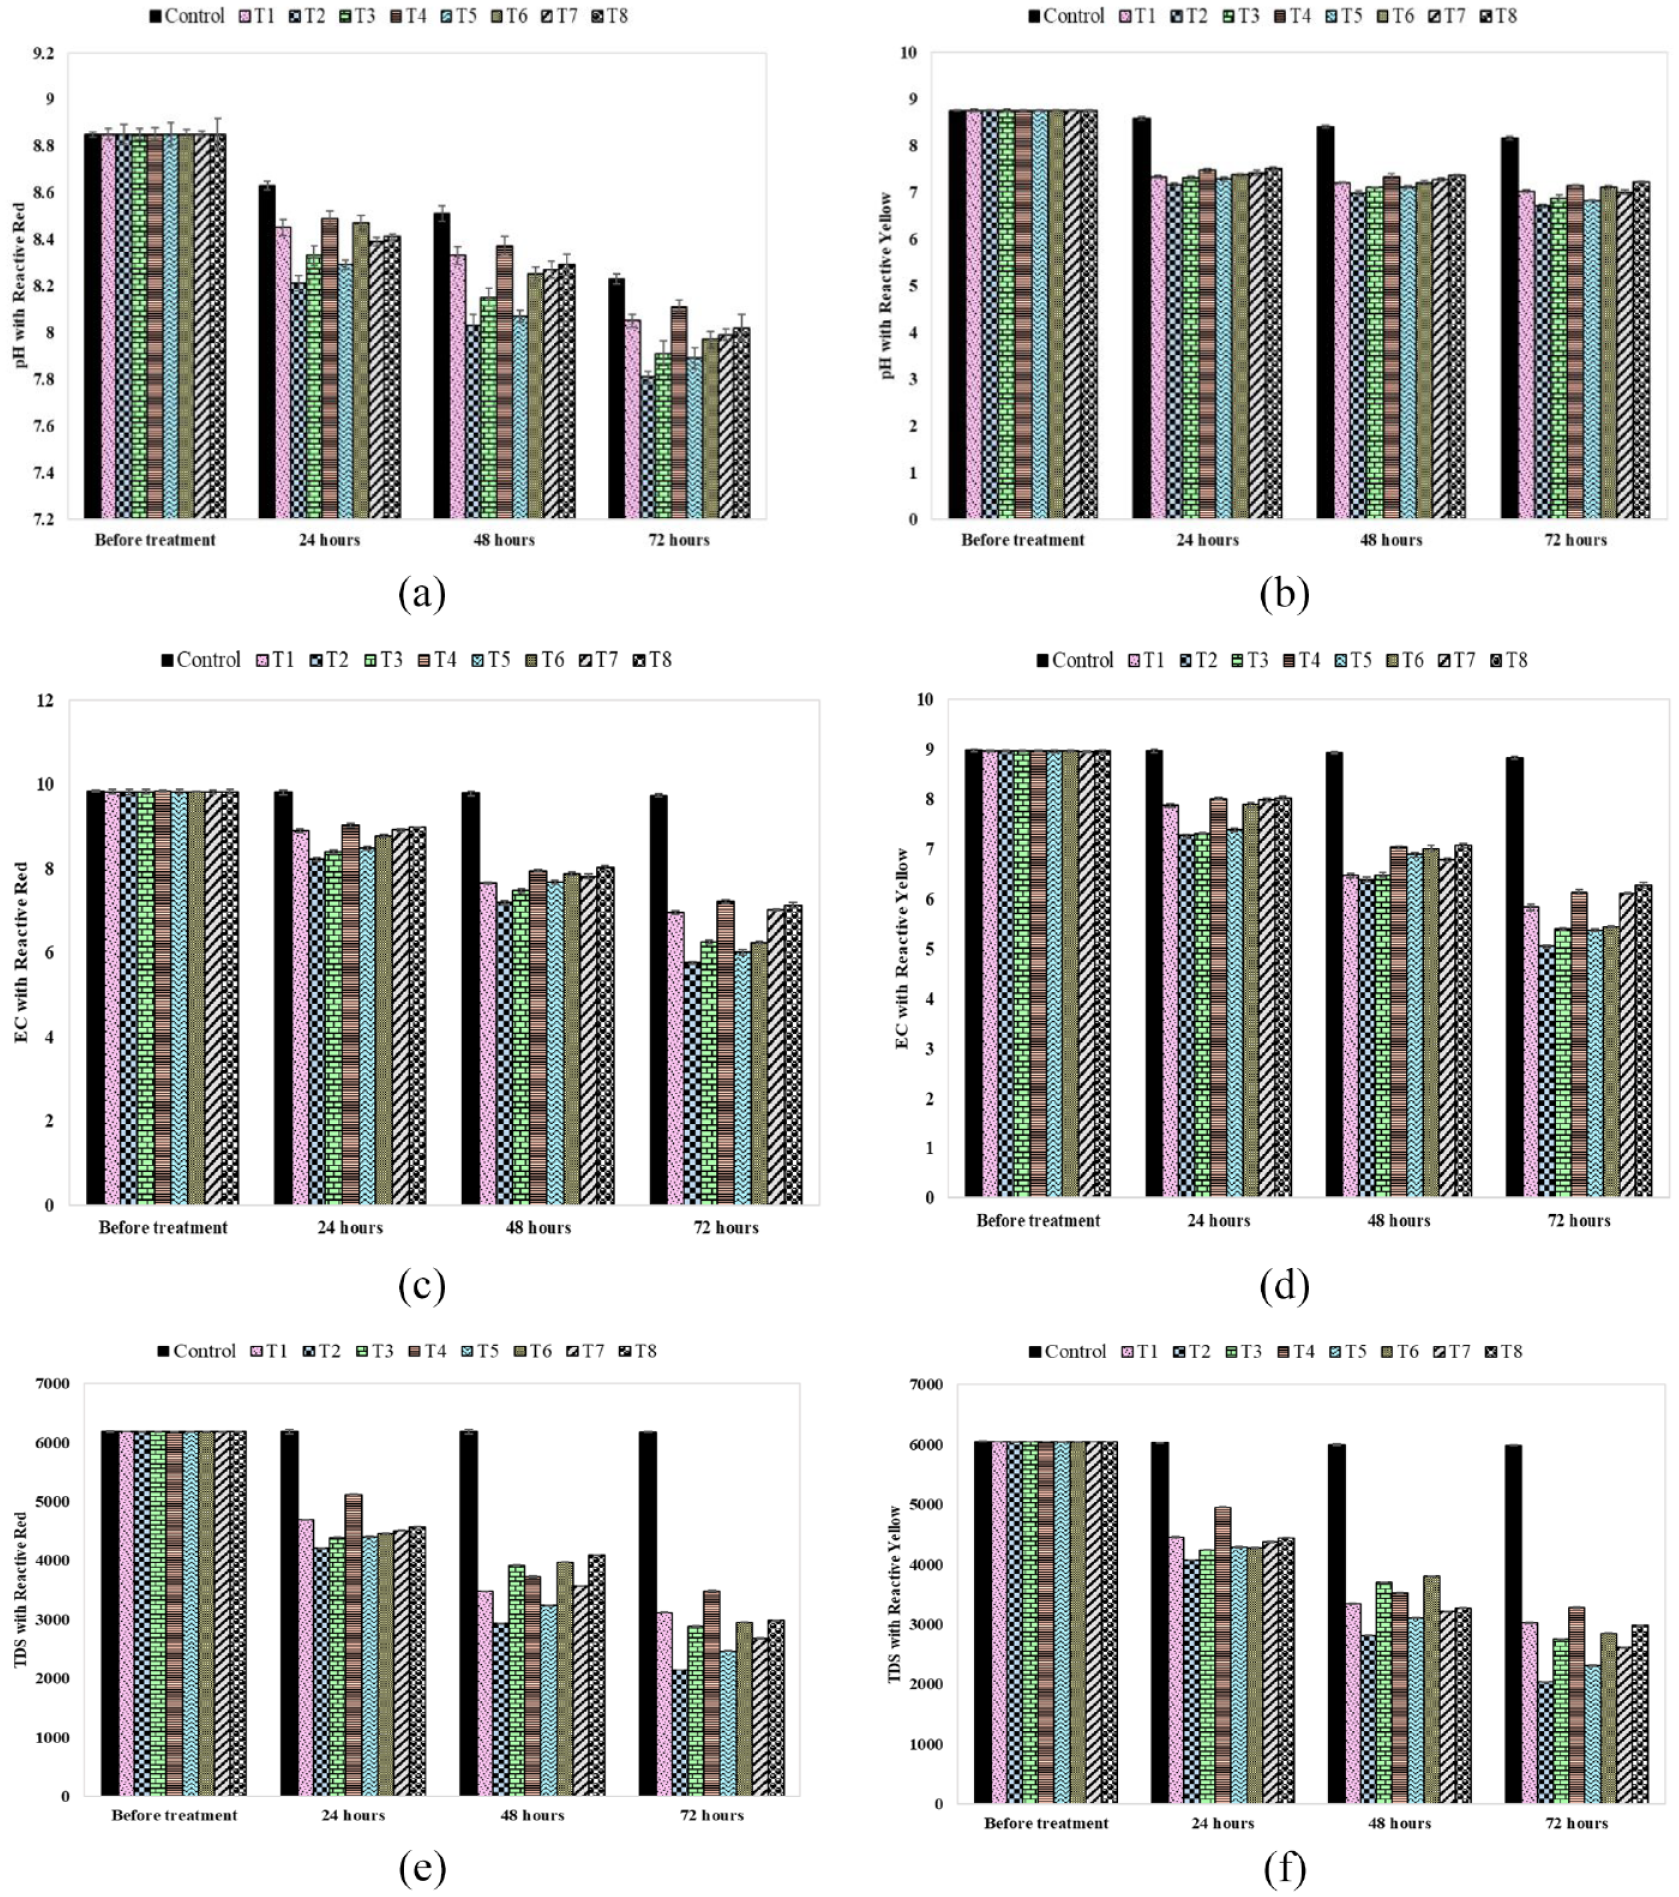
The pH, EC, and TDS of dye wastewater for different treatments and retention times: (a) pH values for reactive red dye, (b) pH values for reactive yellow dye, (c) Electrical conductivity for reactive red dye, (d) Electrical conductivity for reactive yellow dye, (e) TDS for reactive red dye, and (f) TDS for reactive yellow dye.
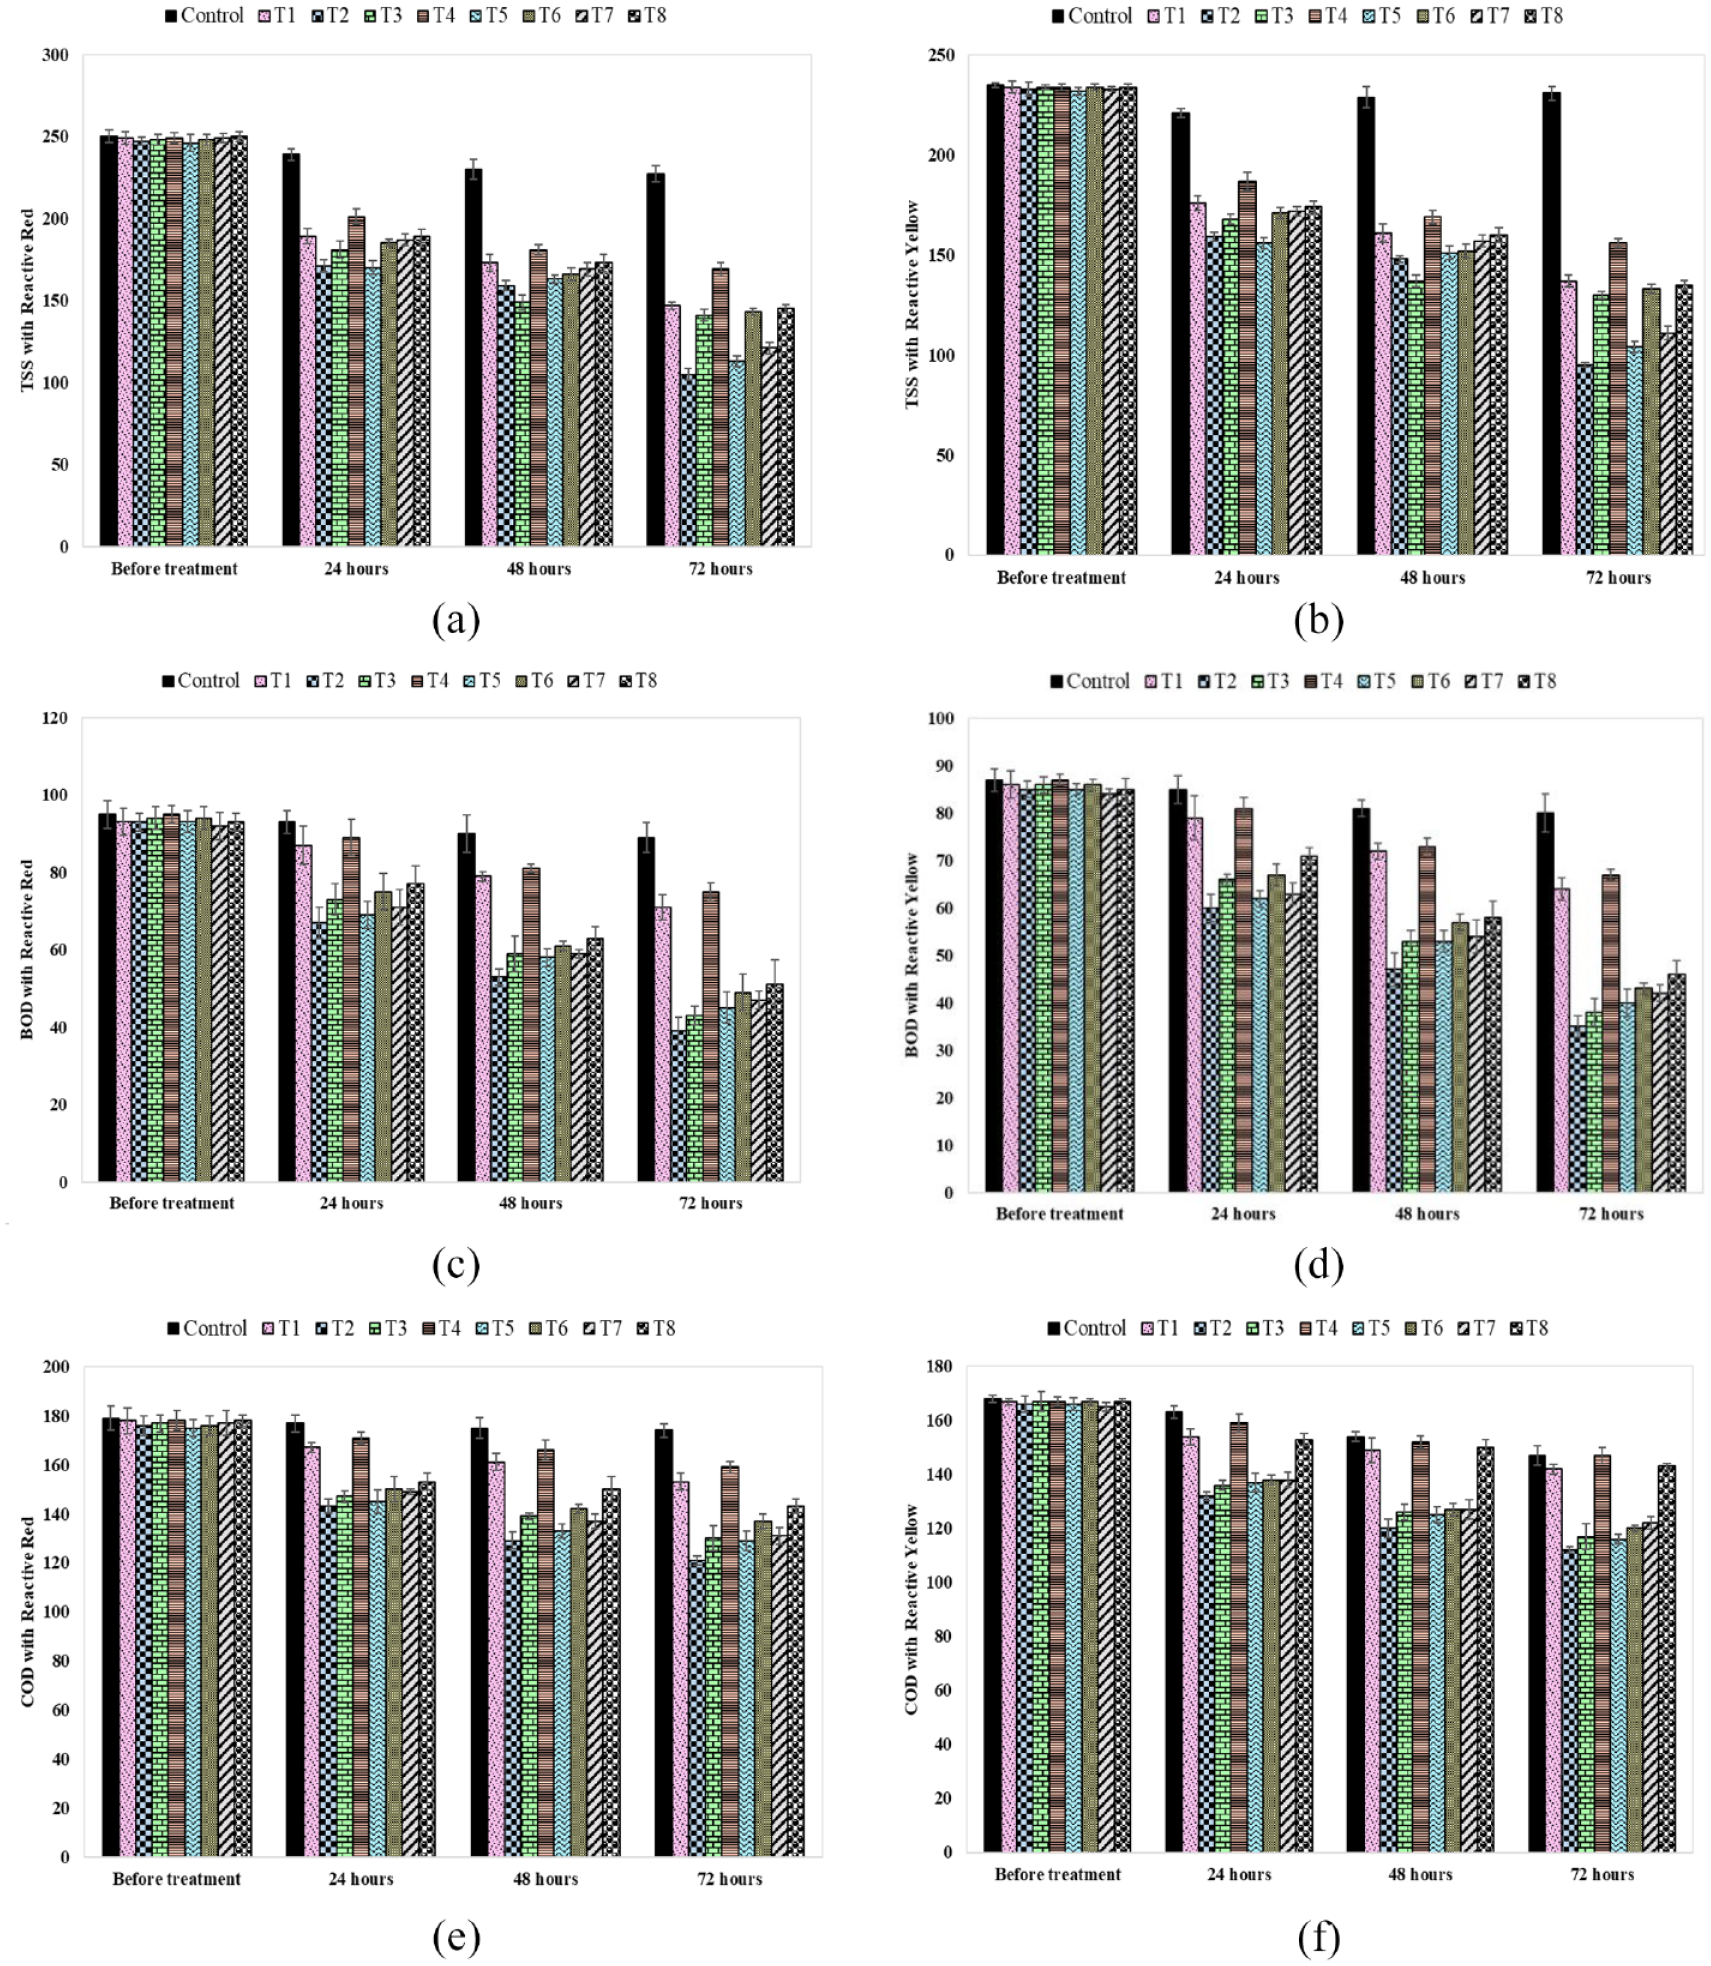
TSS, BOD, and COD of dye wastewater for different treatments and retention times: (a) TSS for reactive red dye, (b) TSS for reactive yellow dye, (c) BOD for reactive red dye, (d) BOD for reactive yellow dye, (e) COD for reactive red dye, and (f) COD for reactive yellow dye.
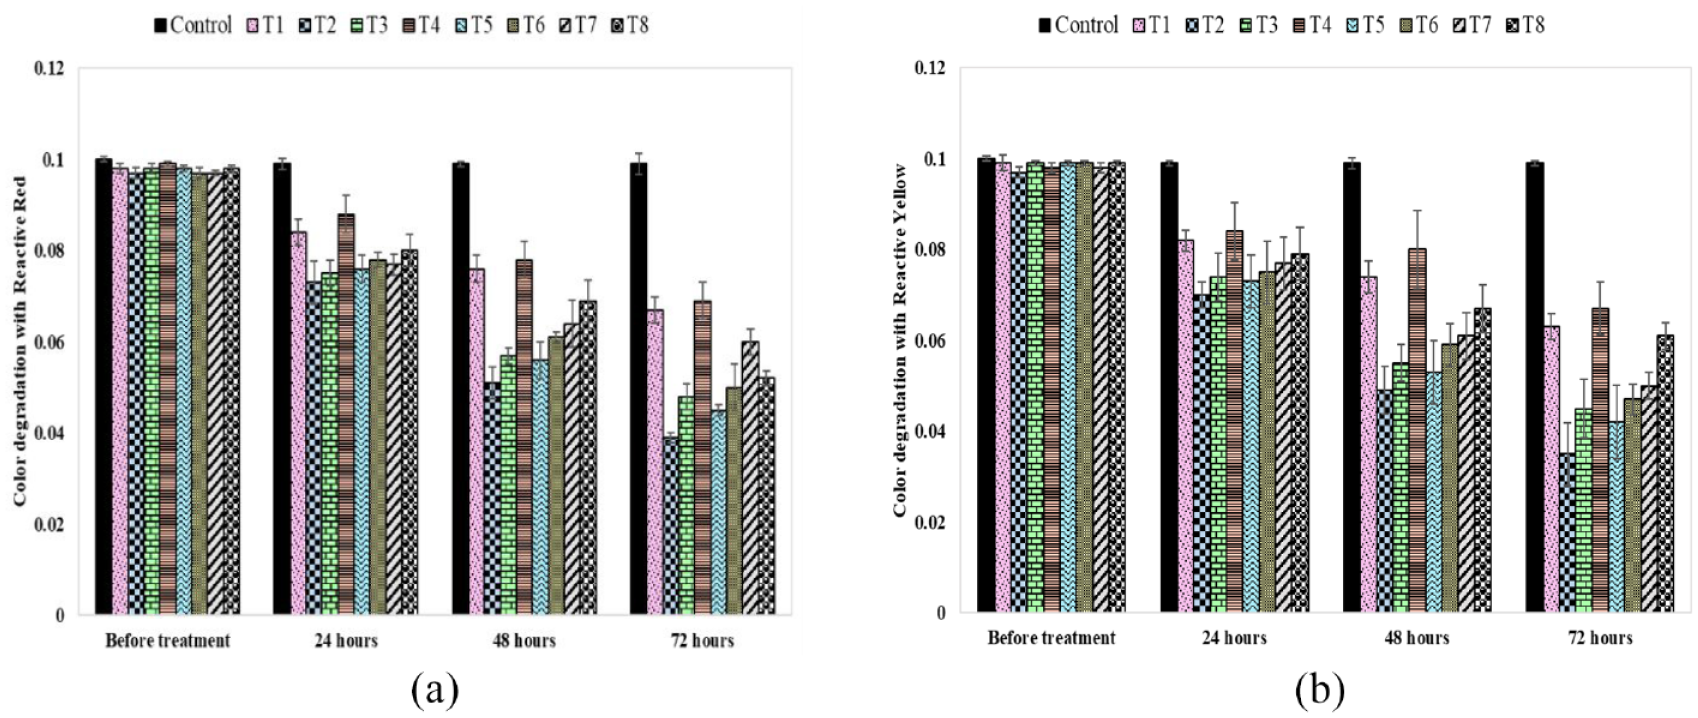
Dye concentration of dye wastewater for different treatments and retention times: (a) dye concentration for reactive red dye and (b) dye concentration for reactive yellow dye.
Effect of Different Treatments and Retention Times on pH Value
Figure 3(a) presents the pH values obtained from the wastewater containing reactive red dye. It was observed that the pH values for control solution and each treatment (T1 to T8) decreased with a gradual increase in retention time. The same trend can be observed for the reactive yellow dye, Figure 3(b). Table 2 provides the description of the control solution and eight treatments from TI to T8. In the case of reactive red dye, the pH of the control dye mixture was 8.85 at the start, which reduced to 8.23 after 72 h, while the control solution exhibited a 7% pH reduction when the retention time was increased to 72 h. In this case, the treatment T2 (control solution + plant Eichhornia crassipes + bacteria Bacillus cereus) exhibited s pH of 7.81, which is the highest pH reduction after 72 h (11.75%) among all the other treatments. Hence, treatment T2 resulted in the lowest pH, which is close to neutral pH. After T2, the treatments T5 and T3 exhibited more pH reduction in 72 h than the remaining options (T1, T4, T6, T7, T8, and control solution). For reactive red dye, the pH reduction of the treatments T1 to T8 was 16–40% more than that of the control solution. It can be concluded that the combination of the plant Eichhornia crassipes and the bacteria Bacillus cereus provided the best alternative to remove the reactive red dye from the textile wastewater.
Similarly, in the case of reactive yellow dye, the treatment T2 (control solution + plant Eichhornia crassipes + bacteria Bacillus cereus) demonstrated the highest pH reduction (23.4%) among all the other treatments. It can be observed that for reactive yellow dye, the pH reduction of the treatments T1 to T8 was 62–71% more than that of the control solution. It was also noticed that in the case of reactive yellow, the treatments containing the plant Eichhornia crassipes and the bacteria Bacillus cereus (T1, T2, T3, T5, and T7) reduced pH values more than the remaining treatments. The reduction in pH is due to the production of organic and inorganic acid anions with the passage of time. Also, the degradation of pollutants causes the creation of dissolved carbon dioxide and carbonic acid in the effluent leading to pH reduction. In addition, the inoculation of bacteria helps the plants to cope with pollutant stress and improves the biomass of the plant with time, which improves the pollutant up-take ability. Furthermore, the microbes degrade the organic matter and release the organic acids leading to a decrease in pH value of the wastewater.
Effect of Different Treatments and Retention Times on EC
Figure 3(c) presents the EC for the wastewater containing reactive red dye. It was observed that the EC for the control solution and each of the eight treatments decreased with a gradual increase in retention time. The same trend can be observed for the reactive yellow dye, Figure 3(d). In the case of reactive red dye, the EC of the control dye mixture was 9.83 dS/m at the start, which reduced to 9.73 dS/m after 72 h. The control solution exhibited a 1.01% reduction in EC when the retention time increased to 72 h. In this case, the treatment T2 (control solution + plant Eichhornia crassipes + bacteria Bacillus cereus) exhibited a 41.28% reduction in EC, which is the highest among all the other treatments. After T2, the treatments T5, T6, and T3 exhibited more EC reduction than the remaining treatments. For reactive red dye, the EC reduction of the treatments T1 to T8 was 96–98% more than the control solution. A similar trend was observed when the reactive yellow dye wastewater was treated with treatments T1 to T8. T2 treatment exhibited a 43.64% reduction in EC, which is highest among all the other treatments. After T2, the treatments T5, T6, and T3 exhibited a greater EC reduction than the remaining treatments. For reactive yellow dye, the EC reduction of the treatments T1 to T8 was 94–96% more than the control solution. It can be concluded that the combination of the plant Eichhornia crassipes and the bacteria Bacillus cereus provided an excellent alternative to remove the reactive yellow dye from the textile wastewater (T2). In addition, bacteria Bacillus cereus combined with Pistia stratiotes provided the second best alternative to remove the reactive yellow dye from the textile wastewater (T5). The third priority may be given to the combination of each of the two plants with bacteria Bacillus subtilis. Treatments with a single plant or a single bacteria provided the least reduction in EC.
The considerable reduction in EC may be due to the plant growth. Plants take up the nutrients from the wastewater and decrease its EC through uptake or root adsorption. The combined effect of plant and bacteria increases the pollutant removal ability. Plants provide the habitat and nutrients to bacteria. The bacteria increase the plant biomass through their plant growth activities. This is the basic mechanism by which the combined use of plant and bacteria increased the reduction in EC of the effluent with time.
Effect of Different Treatments and Retention Times on TDS
Total dissolved solids (TDS) is an important parameter in measuring the efficiency of wastewater treatment. Therefore, TDS was measured for both reactive dye wastewaters with all treatments T1 to T8. It was observed that the TDS for the control solution and each treatment decreased with a gradual increase in retention time. In the case of reactive red dye, the TDS value of the control dye mixture was 6185 mg/L at the start and reduced to 6179 mg/L after 72 h. The control solution exhibited a 0.1% reduction in TDS when the retention time increased to 72 h, Figure 3(e). However, T2 treatment exhibited a 65.35% reduction in TDS, which is the highest among all the other treatments. For reactive red dye, the TDS reduction of the treatments T1 to T8 was 99.77–99.85% more than that of the control solution. A similar trend was observed in the case of reactive yellow dye, Figure 3(f). T2 treatment demonstrated a 66.23% reduction in TDS. The TDS reduction of the treatments T1 to T8 for reactive yellow dye was 97.86–98.52% more than that of the control solution. The considerable reduction of TDS from the wastewater is due to the fact that the plant roots in phytoremediation processes facilitated enough surface area for the adsorption, uptake, and accommodation in plant tissues and oxygenated rhizosphere for inorganic and organic matter oxidation. In addition, the presence of pollutant-degrading bacteria boosted this process by degrading, transforming, and mineralizing the pollutants.
Effect of Different Treatments and Retention Times on TSS
The TSS was also measured for all treatments T1 to T8. The TSS value of the control red dye mixture was 250 mg/L at the start and reduced to 227 mg/L after 72 h. The control solution of reactive red dye exhibited a 9.2% reduction in TSS when the retention time increased to 72 h, Figure 4(a). T2 exhibited a 57.49% reduction in TSS, which is the highest among all the other treatments. The TSS reduction for the treatments T1 to T8 was 71–84% more than that of the control solution. On the contrary, for the reactive yellow dye containing wastewater, the T2 treatment demonstrated a 59.23% reduction in TSS. Figure 4(b), while the TSS reduction of the treatments T1 to T8 was 94–97% more than that of the control solution. The considerable decrease in the TSS value is due to the plant–bacteria partnership. The root structure of the plants provides more sites for microbial attachment, filtering, and trapping of suspended particles. The presence of plant growth-promoting, and pollutant-degrading bacteria enhanced this factor by growing the dense root system of the plant along with degrading and mineralizing the pollutants.
Effect of Different Treatments and Retention Times on BOD
The BOD is one of the important parameters for wastewater treatments. The BOD value of the control red dye mixture was 95 mg/L at the start and reduced to 89 mg/L after 72 h (6.32% reduction). Treatments T1 and T4 (which contain a single plant) provided the least BOD reduction for both the reactive red and reactive yellow dyes. The T2 treatment exhibited 58.06%, Figure 4(c), and 58.82%, Figure 4(d) reductions in BOD for reactive red and reactive yellow dye wastewater, respectively, while, in the case of reactive red dye, the BOD reduction of the treatments T1 to T8 was 70–89% more than that of the control solution. The above observations show that the plant–bacteria coalition degraded the textile dye-enriched effluent more effectively. Hence, the plant–bacteria synergic mechanism reduced the BOD of the solution more efficiently. This reduction is related to the increase in dissolved oxygen of the wastewater because of the presence of plants, which results in oxidation reaction, which leads to the degradation of organic pollutants. The bacterial inoculation enhanced the removal because of their aptitude to transform and decompose organic matter.
Effect of Different Treatments and Retention Times on COD
In this research, the chemical oxygen demand (COD) for the wastewater was also assessed. The COD value of the control red dye mixture was 179 mg/L at the start and reduced to 175 mg/L after 72 h (2.23% reduction). In line with the previous results, the T2 treatment showed a 31.25% reduction in the COD for the reactive red dye wastewater, Figure 4(e), and a 32.53% reduction in COD for the reactive yellow dye wastewater, Figure 4(f). The T1 to T8 treatments exhibited 79–93% more COD reduction than the control solution for the reactive red dye. The reduction in the COD of the effluent is due to the fact that the presence of plants in wastewater depletes the dissolved CO2 during the time of high photosynthesis activity. Consequently, the dissolved oxygen of water increases, which creates aerobic conditions in wastewater. This phenomenon leads to aerobic bacterial activity that reduces the COD. The presence of plant growth-promoting bacteria improves this reduction process.
Effect of Different Treatments and Retention Times on Dye Concentration
Dye concentration is one of the key parameters in assessing the efficiency of the dye-enriched wastewater treatment methods. It was observed that the dye concentration for each treatment decreased with a gradual increase in retention time. In the case of the reactive red dye, the color concentration value of control dye mixture was 0.1% at start and reduced to 0.099% after 72 h. This shows that the control solution exhibited a 1% reduction in color concentration when the retention time was increased to 72 h. However, the T2 treatment demonstrated a 59.79% reduction in dye concentration, Figure 5(a). After T2, the treatments T3 and T5 exhibited more dye concentration reduction than the remaining treatments. Similarly, the T2 treatment for reactive yellow dye exhibited a 63.92% reduction in dye concentration, Figure 5(b). It can easily be noticed that the combination of plant (Eichhornia crassipes) and bacteria (Bacillus cereus) provided an excellent alternative to decolor the reactive yellow and reactive red dye from the textile wastewater (T2). The considerable reduction of dye concentration is due to the presence of plants and microbes in the treatment reactor. The plants remove the dyes through the mineralization and decomposition of contaminants. The bacteria decolorize the dye with the reductive breakage of its azo chromophore group as both the dyes used in this research are azo-based. Therefore, color degradation of wastewater is due to the adsorption/absorption by the plants through its roots and shoot system and better results were obtained when bacteria were also present along with plants to enhance the dye degradation. In addition, the microbes improve the root growth of plant, and the extended roots of plants boost the growth and metabolism of microbes leading to the enhanced biodegradation of color. In this research, chromophores from the treated plant material were not extracted and analyzed. However, in future, such studies can lead to interesting findings.
Table 4 presents a comparison of the best treatment, T2, with industrial and municipal wastewater quality standards (NEQS and ZDHC). It was found that the best treatment, T2, exhibited values of all the wastewater parameters within the limits set in the standards NEQS and ZDHC. It clearly reflects the effectiveness of the selected plant and bacteria efficiency in the optimized floating wetland method for both dyes.
Comparison of the best treatment (i.e. T2) with NEQS and ZDHC.
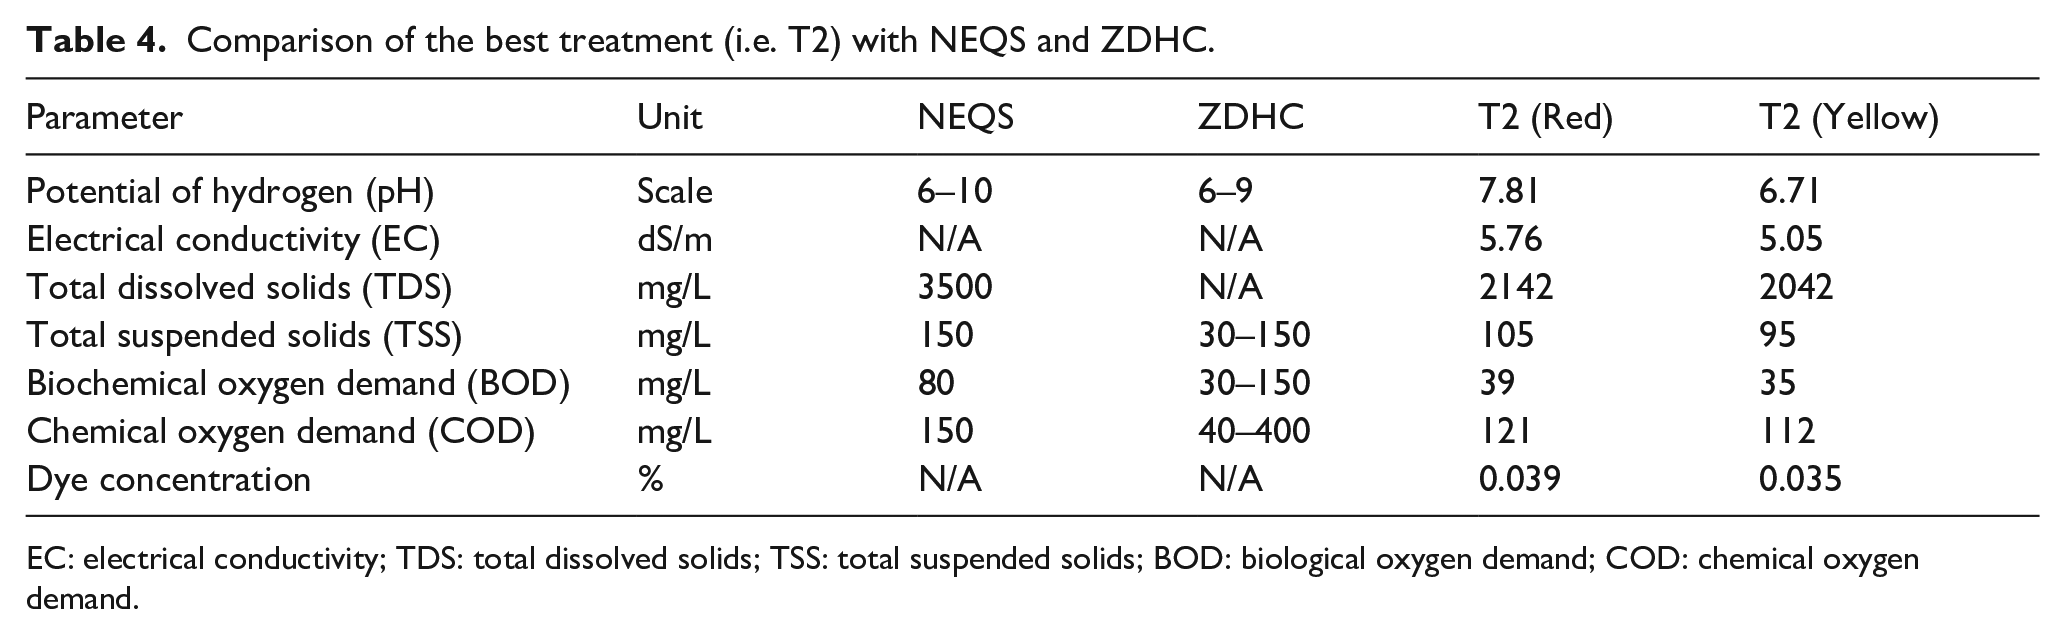
EC: electrical conductivity; TDS: total dissolved solids; TSS: total suspended solids; BOD: biological oxygen demand; COD: chemical oxygen demand.
The system presented in this research is effective at a laboratory scale; but, at bulk level, it will require a comparatively large area of land or greater time. Although the best results are obtained after 72 h of retention, results after 24 h and especially 48 h are close to those at 72 h, so this technique can be used with above lesser hours considering the space and capacity of the mill. Similarly, another challenge with this system will be the plants; but they are locally available and keep growing under suitable conditions. Nevertheless, when the plants no longer provide treatment, they will become waste and will be dumped similar to the remains of the conventional wastewater sludge and waste.
Conclusion
This article investigates the behavior of physicochemical parameters of an FTW system with two plants and two bacteria to remove the reactive red and reactive yellow dyes from the textile wastewater. This article identified the best treatment among the eight treatments. The best treatment was T2, which was a combination of control solution containing a dye, plant Eichhornia crassipes, and bacteria Bacillus cereus. With reference to the control solution, the best treatment, T2, resulted in the following reductions after 72 h of retention time: 40% more pH reduction for reactive red dye compared with control solution, 71% more pH reduction for yellow, 98% more EC reduction for red, 96% more EC reduction for yellow, 99.85% more TDS reduction for red, 98.52% more TDS reduction for yellow, 84% more TSS reduction for red, 94% TSS reduction for yellow, 89% more BOD for red, 86% BOD reduction for yellow, 93% more COD reduction for red, 86% more COD reduction for yellow, 98.33% more reduction in dye concentration for red, and 98.44% more reduction in dye concentration for yellow. The above findings suggest that the best treatment, T2, has significantly reduced the wastewater pollution compared with the control solution and before treatment. The performance of the best treatment, T2, was comparable with the well-known industrial and municipal wastewater quality standards. After the best identified treatment, T2, there are some other treatments, which provided good reductions of wastewater parameters and can be ranked as follows: T2 > T5 > T3 > T7. In the above top ranked treatments among the eight treatments, it can be observed that all the four treatments contain either plants (Eichhornia crassipes) or bacteria (Bacillus cereus). Eichhornia crassipes, being a hyper accumulator, proved to be a good choice for textile wastewater treatment due to its capability to survive in harsh conditions. In addition, it was found that the treatments T1 and T4, which contained a single plant without bacteria, provided lower BOD reduction, COD reduction, and dye concentration reduction for both dyes. Furthermore, the treatment T8, which contained only bacteria Bacillus subtilis, provided lower BOD reduction. It can be concluded that the plant–bacteria synergism provides the best alternative to reduce the maximum pollution. This article successfully achieved plant–microbe synergism in an FTW system to remove reactive dyes from the textile wastewater. Nevertheless, further research work is required to overcome the drawback of the requirement of a comparatively large land are for such a system and longer treatment time to replace the conventional wastewater treatment methods at bulk level. However, the proposed process is a green, aesthetically pleasant, chemical free, and economical wastewater remediation technique. In addition, this novel technique may provide a cost-effective alternative to the expensive and complex wastewater techniques.
Footnotes
Declaration of conflicting interests
The author(s) declared no potential conflicts of interest with respect to the research, authorship, and/or publication of this article.
Funding
The author(s) received no financial support for the research, authorship, and/or publication of this article.