
Abstract
The textile industry generates large volumes of dye-contaminated wastewater, posing significant environmental risks. This study aims to optimize the adsorption of textile dyes from wastewater using activated carbon through a general factorial design. The research investigates the effects of key variables, including activated carbon type (powdered and granular), contact time, carbon dosage, salinity, and temperature, on dye removal efficiency. A comprehensive analysis using ANOVA identifies the most significant factors and their interactions. The study also integrates machine learning models, such as Gaussian process regression (GPR) and artificial neural networks (ANN), to predict adsorption outcomes. The results demonstrate that granular activated carbon (GAC) and lower salinity significantly enhance dye removal efficiency. ANN models outperformed GPR in predictive accuracy, achieving an R2 value of 0.85 compared to GPR’s 0.71. The findings provide optimized operational parameters that can be applied in the textile industry for efficient wastewater treatment and environmental compliance.
Keywords
Introduction
The textile industry is a worldwide market that involves products created by fibers, threads, or yarn. Examine the significance of the textile industry, study the major classes of textiles, and learn the human and economic benefits of the same. The industry plays several vital roles in terms of social and environmental responsibility while influencing the critical aspects of today’s life. 1 The textile industry has also contributed much to the rise of environmental awareness and shift in consumer behavior. It contributes much to the global economy in terms of vast revenues, promoting economic development in so many countries thus increasing recognition for the textile industry to adopt more sustainable practices. 2 The textile industry consumes 93 billion cubic meters of water annually, which accounts for 4% of all freshwaters withdrawn worldwide. Textile manufacturing processes require enough amounts of water. Water baths are used widely in the application of dyes, specialty compounds, and finishing chemicals to textile substrates. 3 Fabric preparation often also includes scouring and bleaching, each of which requires extensive water and results in extensive wastewater. 4 Water usage in textile activities varies widely, with an overview showing that 90%–95% of the water utilized in manufacturing is typically wasted.5,6
Wastewater treatment has been under research, and new treatments are being introduced to treat the water released by industries. Wastewater treatment is also used to remove dye effluents from textile industries. 7 Textile industrial waste usually contains high levels of commercially available dyes that interfere with the environment, both visually and biologically, by blocking light penetration. Research has indicated that dyes are toxic to aquatic life, and increasing the use of azo dyes shows that a vast majority of these dyes and their reaction products, such as aromatic amines, are highly carcinogenic. 8 Nissanka et al. investigated the wastewater treatment process’s ability to absorb textile dyes and remove them, as well as future sustainability considerations. 9 Most countries of the world are adopting legislation and guidelines concerning dye effluents. Because many commercial colors resist aerobic digestion, light, heat, and oxidizing agents, treating wastewater containing color is challenging. 10 Researchers have developed a number of biological and physio-chemical techniques for color extraction from textile effluents. The treatment of wastewater in the textile industries is essential because most of the manufacturing processes in textiles involve a high number of impurities. Textile wastewater usually contains high levels of organic compounds, solid particles, dyes, heavy metals, and other chemicals. If discharged raw, it can cause serious health hazards to agriculture as well as aquatic life. 11 Operators of industrial wastewater treatment systems face challenges that might seriously affect the running of the system. These fall into five main categories: energy use, footprint and facilities, treatment chemical costs, and handling sludge. 12 According to Islam et al. wastewater treatment systems need a lot of energy to run their treatment machinery. Energy is frequently the highest operating cost of a treatment system. 13
The footprint and technology needed for treating new pollutants have been included in discharge licenses, along with increasingly rigorous discharge constraints and compliance. In some cases, production is prioritized over pollution prevention. Chemicals are used in many industrial wastewater treatment systems to aid in the efficient removal of pollutants from the wastewater. 14 Textile industries need to introduce an extensive wastewater treatment system to mitigate environmental pollution and fulfill regulatory standards. Moreover, water preservation practices such as recycling and reuse can further decrease the environmental footprint of textile manufacturing processes. According to Alemu et al. recent challenges with the supply chain have made treating industrial wastewater more challenging. Creating new technologies has become necessary due to product shortages, replacements, and price increases. To maintain operational goals and objectives, wastewater operators have had to get creative. 15 Rapidly altering technologies, industrial items, and applications are producing a global waste problem and polluting the environment. Improper garbage management may jeopardize public health and the environment. 16 Ali Imessaoudene et al. have investigated Congo red dye removal using zeolite as an adsorbent, highlighting the impact of pH, kinetic studies, and the comparison of zeolites with activated carbon. 17
Textile dye adsorption is a specific process in treating the textile industry’s wastewater. Effective explorations and optimizations of the textile industry dye adsorption method can be performed using the factorial design when analyzing various factors dealing with adsorbent characteristics. Statistical models can be applied to experimental results using ANOVA, regression analysis, and similar methods used in estimating the effectiveness of dye removal under various circumstances and in maximizing process parameters to meet performance goals. 18 Factorial experiments conducted at lab scale provide insight into the up scaling of the dye adsorption process up to the industrial production scale. Using factorial design to optimize dye removal, individuals can analytically identify the most significant factors affecting dye removal from wastewater and optimize the treatment method to achieve extreme efficiency. According to Eid Alkhatib et al., the use of activated carbon in treating textile dyes in wastewater effluents, the importance of adsorption techniques by specifying the types of activated carbons and dyes used, the significance the response variable, and the methodology for calculating adsorption capacity. 19
Artificial Neural Networks (ANN) have recently gained attention in textile dyeing for their ability to model nonlinear relationships and predict complex dyeing behaviors with high accuracy. Haji and Vadood used ANN models optimized by genetic and swarm-based algorithms to predict color coordinates of cotton fabrics dyed with madder and weld mixtures. The gray wolf-optimized ANN achieved the lowest prediction error, confirming ANN’s potential in natural dye modeling. 20 Eyupoglu et al. applied ANN to predict dyeing characteristics of bio-mordanted wool fabrics dyed with beetroot extract. The model achieved R2 values above 0.97, demonstrating strong accuracy in eco-friendly dyeing prediction. 21 In a study by Eyupoglu et al. ANN was used to predict K/S values in merino wool dyed with natural dye extracted from horse chestnut shells. The model performed well, highlighting ANN’s usefulness in microwave-assisted natural dyeing. 22 ANN was also applied by Eyupoglu et al. to model the dyeing properties of air plasma-treated wool dyed with Rubia tinctorum. The ANN accurately predicted color parameters, showcasing its suitability for modified textile surfaces. 23 Another work by Eyupoglu et al. used a feed-forward neural network to predict dyeing performance of wool dyed with Hibiscus sabdariffa after plasma treatment. The model yielded strong agreement with experimental results. 24 Hamri et al. 25 have modeled the wastewater treatment of the textile industry by examining the efficiency of acid treatment using the integrated approach of GPR-PSO. The model demonstrated high predictive performance with R2 0.997 and RMSE 1.139, effectively capturing the adsorption trend. Similarly, Gadekar and Ahammed 26 have combined response surface methodology (RSM) with an artificial neural network (ANN) for the prediction of dye removal by adsorption using water treatment residuals. The model predicts the trends exceptionally well with R2 0.98. The optimal result was achieved when pH was 3.0, WTR 30 g/L, and dye concentration 75 mg/L. Leon et al. 27 have used ANN for the prediction of the biosorption of dye removal from textile wastewater modified by adding sugarcane. The experimental results fit very well with the prediction model by having R2 0.928 and MSE 0.013. Aghilesh et al. 28 have optimized the biosorption of textile wastewater using agricultural waste such as sugarcane bagasse and peanut hulls using a combined approach or RSM-ANN-ANFIS. The model predicts the biosorption with R2 0.90.
From the available literature, it can be concluded that a few studies have reported on the adsorption of dyes from wastewater used by industries. This study aims to optimize the dye removal process from textile effluents by integrating experimental design and predictive machine learning techniques. This research proposes a systematic approach for optimizing dye removal from textile effluent using factorial design and ANOVA for parametric study. Many researchers have applied activated carbon for dye adsorption in their work, but this study has investigated the factors influencing the adsorption capacity systematically in terms of type of activated carbon, contact time, amount of activated carbon, and salinity. The novelty of this work lies in the combined use of a full factorial design for interaction analysis and the comparative evaluation of GPR and ANN for adsorption prediction, an approach not previously reported in this context. In contrast with previous studies, this research examines individual parameters and their interconnection, making the approach even better. Finally, machine learning models such as GPR and ANN have been applied to predict adsorption outcomes, which gives an additional flavor of prediction with optimization. The key contribution of this study is the development of a data-driven, experimentally validated framework that can guide textile industries in adopting efficient and sustainable wastewater treatment strategies. The study provides the optimized working conditions to be used in the removal of the dyes, which will be very suitable for the textile companies to help them improve their wastewater treatment. By addressing wastewater treatment, this research also promotes environmental sustainability practices. In addition, this approach improves the existing practices in the removal of dyes. It increases the understanding of adsorption trends and predictive modeling, providing direction for further research on industrial wastewater treatment.
Materials and methods
Materials used
The powdered activated carbon (PAC) and granular activated carbon (GAC) used in this study were purchased from the local market in Peshawar, Pakistan. The PAC had an approximate particle size of 200 mesh, while the GAC consisted of granules ranging from 1 to 2 mm in size. Both forms of activated carbon were used as adsorbents for dye removal and were used as received, without further modification. The PAC, due to its fine particle size, offers a larger surface area for adsorption, while the GAC, with larger particles, is advantageous for effective filtration and handling in larger-scale setups. The Vat Blue 1 dye (CI 73015), commonly known as Indigo, is a water-insoluble vat dye with an indole-based structure (C16H10N2O2) and was obtained in powder form from a local textile supplier to be used as a model pollutant in synthetic wastewater. Sodium dithionite (Na2S2O4, ≥ 85% purity) was procured from a local laboratory supplier and used as a reducing agent to convert the dye to its soluble leuco form. To stabilize this reduced form and prevent precipitation, sodium hydroxide (NaOH) was also added to maintain an alkaline pH during the reduction process. Instant sea salt (commercial grade) was used to simulate salinity levels in the wastewater. All solutions were prepared using double-distilled water to avoid contamination.
A magnetic stirrer was employed to ensure continuous mixing of the activated carbon with the wastewater, allowing uniform dispersion and maximizing contact for efficient dye adsorption. After treatment, a simple physical filtration method was used to separate the activated carbon from the solution. To analyze the dye concentration in treated samples, a Shimadzu UV-1800 spectrophotometer was used. The treated solution was poured into a cuvette and placed in the spectrophotometer’s sample compartment. This device measures light absorbance in the ultraviolet and visible spectrum and was essential in determining the concentration of dye remaining after treatment. The UV Probe software was used to operate the spectrophotometer, acquire data, and process absorbance spectra for further analysis.
Method
Figure 1 illustrates the methodology followed in this study, beginning with sample preparation. A synthetic wastewater solution was prepared by dissolving Vat Blue 1 dye in distilled water to simulate industrial textile effluent. This approach allowed for a controlled analysis of adsorption behavior by eliminating variability and interference from unknown constituents commonly found in actual wastewater. For experimental purpose, a 50 mL beaker was used, filled with a 1:5 ratio of the prepared dye solution and distilled water. Methodology.
Since Vat Blue 1 is water-insoluble, sodium dithionite was used as a reducing agent to convert it to its soluble leuco form before mixing with activated carbon. The solution was freshly prepared and kept covered to minimize oxidation and precipitation during the 2–4 h contact period. The solution was heated to 40°C temperature. Instant sea salt was added for salinity, e.g., 10% of 50 ml solution means 5 ml salt, and it was converted into grams or 10 g. The activated carbon (AC) was added, and the amount was 15 g/L, which means 0.75 g will be added to 50 ml. The solution was then mixed with a stirrer and left for 2 h according to contact hours so that activated carbon (AC) could adsorb the dye molecules onto its porous surface.
To minimize oxidation and precipitation of Indigo during the 2 and 4 h adsorption process, the reduced leuco-indigo solution was freshly prepared, and the mixture was kept covered throughout the experiment to limit oxygen exposure. Mild stirring was applied to ensure uniform dispersion. After contact, the solution was filtered to remove activated carbon and any potential precipitates. Although the dark color of activated carbon may mask any blue precipitate visually, no sediment was detected in the filtrate, and the UV-Vis absorbance remained stable across replicates, suggesting effective mitigation of oxidation.
The contact times of 2 and 4 h were selected based on prior studies indicating that adsorption equilibrium for dye removal using activated carbon is typically achieved within this timeframe. For instance, Kouhi et al. reported that methylene blue adsorption onto oak charcoal-based activated carbon reached equilibrium within 180 min.
29
Similarly, Wasilewska et al. observed that the adsorption of aromatic organic compounds on activated carbon achieved equilibrium within comparable durations. These timeframes are also practical for industrial applications, balancing efficiency and operational feasibility.
30
The solution was first filtered using a simple filtration method to remove particulate matter. Absorbance measurements were then carried out using a Shimadzu UV-1800 spectrophotometer. The cuvette was filled with the treated solution and placed inside the sample compartment. A wavelength scan ranging from 300 nm to 700 nm was performed using UV Probe software. To determine the dye’s λmax, a focused scan between 610 and 640 nm was conducted, as Vat Blue 1 is known to exhibit maximum absorbance within this range. The λmax was confirmed at 620 nm and was used for all subsequent concentration measurements. This wavelength corresponds to the oxidized form of Indigo, as UV-Vis analysis was performed after the adsorption and filtration steps, during which the dye reoxidized from its leuco state.
31
This selection was based on both literature evidence and preliminary UV-Vis scans, ensuring accurate quantification of dye concentration and consistency with reported absorbance maxima for oxidized Indigo.32–34 To validate the linearity of absorbance with respect to dye concentration, a calibration curve was developed using standard solutions of Vat Blue 1 as shown in Figure 2. The resulting plot confirmed a strong linear relationship (R2 = 0.99), supporting the application of the Beer–Lambert Law in this research. Calibration curve for Vat Blue 1 dye at 620 nm.
Design of experiment (DOE)
In order to test the effects of various factors on the ability of activated carbon to remove dyes from wastewater, the experiments are planned based on a systematic experimental design approach called general full factorial design. 35 The parameters considered in the current study are type of activated carbon, contact time, carbon quantity, and salinity, which affect the extent of the adsorption process. 36 A general full factorial design is preferred over other design of experiment techniques because it enables the study of the main effects of factors and their interactions as well. 37 One advantage of using factorial design is that it uses all the possible combinations of variables in the system which ensures that all blends of variables are tried out. In this study, analysis of variance was used to evaluate the impact of input variables (activated carbon type, contact time, amount of carbon used and salinity) on the response variable (adsorption capacity of activated carbon) and their significance. 38 ANOVA is carried out at a 95% confidence interval, so a p-value below 0.05 is considered significant.
Factors and their levels.

UV - Vis spectroscopy
It is an essential analytical technique used in this research to measure the concentration of dye remaining in wastewater after treatment with activated carbon. By detecting the absorbance of light in the ultraviolet and visible spectrum, this method helps quantify the extent of dye removal. The principle of the technique is based on the fact that different dyes absorb light at specific wavelengths, allowing for the determination of dye concentration before and after adsorption. In this study, UV-Vis spectroscopy enables accurate monitoring of adsorption efficiency by measuring the reduction in dye concentration in the treated wastewater, thereby verifying the effectiveness of the optimized parameters. 41 This non-destructive, rapid technique is essential for tracking the performance of the activated carbon under varying conditions in the factorial design.
The primary mechanisms responsible for the adsorption of dye molecules onto activated carbon include pore diffusion, electrostatic interactions, π–π stacking, and van der Waals forces. Activated carbon possesses a high surface area and a porous structure, which facilitates the diffusion of dye molecules into its micropores and mesopores. Electrostatic interactions occur between the charged surface of the activated carbon and the oppositely charged dye molecules, particularly significant under pH and salinity conditions that influence surface charge. In the case of aromatic dye compounds, π–π interactions between the dye’s aromatic rings and the graphitic planes of carbon also contribute to adsorption. Additionally, weak van der Waals forces support the physisorption of dye molecules, making activated carbon highly effective for dye removal from aqueous solutions.
Beer Lambert Law
According to the Beer-Lambert equation, sample concentration, and path length for a given material sample are proportional to light absorption.
42
The following is the expression for the Beer-Lambert law:
The result would be in the form of mol/L (moles per liter) which was then converted to mg/L (milligrams per liter) by multiplying molar mass and 1000. The molar Mass of Vat Blue dye here is 385.27 g/mol. So, for each experiment, the absorbance value is converted into concentration in the same way. To ensure the accuracy of absorbance-based measurements, a blank correction using distilled water was performed before each spectrophotometric reading to eliminate background absorbance. Additionally, a calibration curve was established using standard solutions of Vat Blue 1 dye in distilled water to verify the linear relationship between absorbance and concentration. These steps helped account for potential interferences from the wastewater matrix and ensured the reliability of concentration values derived using the Beer Lambert Law. The absorbance value ranges from 0.271 to 1.081 for the experiments. Finally, this concentration value is subtracted from the initial concentration (before treatment), which is same for every experiment.
Change in concentration = concentration before treatment − Concentration after treatment
Experimental results for design.

Machine learning models
In this research, machine learning models such as Gaussian process regression (GPR) and artificial neural network (ANN) were used, which are discussed below.
Gaussian process regression (GPR)
It is a nonparametric machine learning model used to determine the probability distribution of all the possible functions.
43
In GPR, the Gaussian process prior is defined as mean function m(x) and covariance function k (x, x′). It uses Gaussian process prior which is a mean of covariance function k (x, x′) and function m(x) as indicated in equation (3).

The kernel has two hyperparameters: the length scale l and signal variance σ 2 , as we determine that GPR has several benefits such as handling low volume of data and the possibility of interpreting the variance of the forecast. The reason for choosing GPR is that this model not only provides point estimates but also quantifies uncertainty, allowing for a better understanding of the confidence in predictions. It relies on kernel-based learning, where covariance functions define relationships between input features, making it particularly effective in capturing smooth variations in adsorption behavior and ensuring robust predictions even with limited data.
Artificial neural network (ANN)
ANN is primarily a system of neuronal networks, artificial or biological. Neural networks are capable of working with any input, and that is why only the best possible outcomes are achieved without redesigning the output parameters. An ANN works in the same way. The particles of a controller are neurons, which transform input data from parameters into corresponding output. 44 First, it has three layers; the first one is the input layer, which gets signal information, does assessments or selects features from the external environment. The input normalization occurs in the training phase of the algorithm. It increases the total precision of the network, thereby making numerical consistency of networks. As a result, the input is implemented in the hidden layer. The weight of the input neuron specifies a gradient or a measure of the intensity. Finally, the calculated output goes to the output layer.45,46 The reason for choosing ANN is that it has the ability to approximate highly nonlinear and complex functions without requiring prior assumptions about the data distribution, making it a powerful tool for modeling adsorption processes. Unlike traditional regression models, it can automatically learn and optimize feature representations, capturing intricate interactions between variables without explicitly defining them.
Analysis and discussion
Normal probability plot
It is used to compare the distribution of residuals to a theoretical normal distribution test to ensure that the residuals are normally distributed, which is an assumption required for accurate inference in parametric statistical tests. The blue dots in Figure 3 show the data point from the experiment, and the red line shows the normal line for the normal distribution. The Anderson test for normal distribution is carried out at a 95% confidence interval, which results in a P value greater than 0.05, showing that the data is normally distributed and can be used for further analysis. Normal probability plot.
Analysis of variance (ANOVA)
ANOVA result.

The analysis of two-factor interactions reveals that several combinations significantly impact the adsorption process. Interactions such as A × B (p = 0.002), A × C (p < 0.001), A × D (p = 0.003), B × E (p < 0.001), and C × E (p < 0.001) demonstrate the importance of these pairs of factors when considered together. However, some interactions, such as A × E (p = 0.784) and B × C (p = 0.205), are not statistically significant, indicating that these combinations do not notably influence the adsorption process. The three-factor interactions further emphasize the complex interplay between variables. Interactions such as A × B × C (p < 0.001), A × B × E (p = 0.042), A × C × E (p < 0.001), and B × C × E (p < 0.001) are significant, suggesting that these combinations contribute substantially to optimizing adsorption capacity. Conversely, interactions like A × B × D (p = 0.24) and C × D × E (p = 0.639) are insignificant, reflecting their limited impact.
Main effect plot for delta concentration
Figure 4 shows the main effect plot for the change in concentration, which clearly shows that with Granular Activated Carbon (GAC), the dye removal concentration increases, while for Powdered Activated Carbon (PAC), it is lower. This result, although differing from typical expectations, is supported by studies showing that GAC can outperform PAC in specific conditions due to its structural integrity, extended contact time, and effectiveness in continuous adsorption systems. GAC’s lower attrition rate and its ability to be regenerated for repeated use also contribute to its long-term efficiency in dye removal applications.
47
Additionally, the adsorption process is primarily governed by van der Waals forces and electrostatic interactions, where negatively charged dye molecules interact with the positively charged surface of activated carbon. In lower-salinity environments, reduced ionic interference enhances these electrostatic attractions, leading to improved adsorption efficiency. The concentration slightly decreases with the increase of contact time. However, there is a slight increase in concentration with the increase in the amount of Activated Carbon (AC). A slight increase in dye removal concentration with the increase in the amount of Activated Carbon (AC) occurs because more adsorbent surface areas become available for the dye molecules to adhere to. However, the rate of increase may slightly differ as adsorption sites become saturated, leading to diminishing returns in further dye removal efficiency.
48
For temperature, there is a decrease in concentration with an increase in temperature. In the case of salinity, we can see there is a very slight decrease in concentration when the salinity is increased to 5%, but when the salinity is increased to 10%, there is a drastic decrease in the removal concentration. Increased salinity can disrupt the ion exchange and adsorption processes in wastewater treatment, leading to reduced efficiency in dye removal. At higher salinity levels, competitive adsorption of ions might overwhelm the activated carbon’s capacity, causing a drastic decrease in removal efficiency.
49
Main effect plot for delta concentration (change in dye concentration after treatment).
Interaction plot for delta concentration
The interaction plot illustrated in Figure 5 shows how various factor combinations influence the mean change in dye concentration (ΔConcentration) during the adsorption process. The factors analyzed include the type of activated carbon (A: granular activated carbon [GAC] and powdered activated carbon [PAC]), contact time (B: 2 and 4 h), amount of activated carbon (C: 15 and 25 g), salinity (D: 20 and 40 g/L), and dye concentration (E: 0.010, 0.050, and 0.100 g/L). The interaction between the type of activated carbon (A) and contact time (B) shows that increasing the contact time from 2 to 4 h leads to a decrease in ΔConcentration for both GAC and PAC. However, PAC exhibits a steeper decline, suggesting its higher sensitivity to shorter durations. This indicates that PAC achieves better adsorption performance in shorter timeframes compared to GAC because PAC has a significantly larger surface area and smaller particle size compared to GAC. This smaller particle size increases the availability of adsorption sites by exposing more surface area for the interaction between the dye molecules and the activated carbon. In addition, the reduced diffusion path length in PAC allows dye molecules to access its internal pores more quickly. In GAC, the larger particle size results in longer diffusion paths, which slow down the adsorption process, thus making PAC more efficient under time-constrained conditions.
50
Similarly, the interaction between carbon type (A) and carbon amount (C) reveals that while GAC shows minimal improvement with increased carbon dosage, PAC significantly reduces ΔConcentration with a higher carbon amount, reflecting its superior adsorption capacity. Interaction plot for delta concentration.
The interaction between contact time (B) and carbon amount (C) highlights that increasing the carbon dosage from 15 to 25 g has a more pronounced effect at shorter contact times (B = 2). At longer contact times (B = 4), the change is less significant, suggesting diminishing returns in adsorption efficiency over time. At shorter contact times, the higher initial concentration gradient allows increased carbon dosage to provide more active sites, significantly enhancing dye adsorption. At longer contact times, equilibrium is approached, and many sites are already occupied, leading to diminishing returns with additional carbon. 51 This implies that optimizing carbon dosage is particularly important for shorter durations, where the rate of dye removal is higher. Furthermore, the interaction between carbon type (A) and salinity (D) demonstrates that PAC consistently outperforms GAC across all salinity levels. However, as salinity increases, the performance of PAC decreases more substantially, indicating its greater sensitivity to ionic interference in highly saline environments. These ions can occupy the active adsorption sites or alter the electrostatic interactions between dye molecules and PAC, thereby reducing their adsorption efficiency. 52
The interactions between dye concentration (E) and other factors, such as carbon type (A), carbon amount (C), and salinity (D), provide additional insights. PAC performs better than GAC across all initial dye concentrations but experiences a sharper decline in ΔConcentration at higher concentrations (E = 0.100 g/L). This reflects saturation effects, where the active adsorption sites on PAC become saturated more quickly at higher dye loads. 53 Similarly, increasing salinity (D) significantly reduces ΔConcentration at lower dye concentrations (E = 0.010 g/L), but this effect diminishes at higher concentrations, likely due to competition between dye molecules and ions in saline solutions.
Machine learning prediction models
In this research, machine learning prediction models such as Random Forests, Gradient Boosting Machines (GBM), Support Vector Machine (SVM), Gaussian Process Regression (GPR), and Artificial Neural Network (ANN) were also applied for further prediction after doing experimental work and analysis. While all models were evaluated, only GPR and ANN are discussed in detail due to their superior predictive accuracy on this dataset. The performance of Random Forest, GBM, and SVM was comparatively lower and did not provide significant additional insights, so they were excluded from further analysis. Among these techniques, the GPR and ANN give us the best results which are discussed below.
GPR result
In this study, Gaussian Process Regression (GPR) was applied to predict dye adsorption outcomes, leveraging 96 data points collected from experiments. These data points were split into two sets: 80% for training the model (76 data points) and 20% for testing (20 data points). The model’s performance was assessed using key metrics, such as the R-squared (R2) value and the Root Mean Square Error (RMSE).
The R-squared value (R2 = 0.71) in Figure 6 indicates that approximately 71% of the variance in the dye adsorption data could be explained by the GPR model, which demonstrates a reasonable predictive capability. An R2 value closer to 1 would suggest a stronger model fit, so while this result is not perfect, it shows that the GPR model effectively captured a majority of the data trends. The RMSE value (RMSE = 3.09) in Figure 6 measures the average magnitude of prediction errors. In this context, the RMSE suggests that, on average, the predicted dye adsorption values deviate from the actual values by about 3.09 units, which provides a tangible measure of the model’s prediction accuracy. A lower RMSE value is generally preferred, so there is potential for improvement in the model, but this value is still within an acceptable range for preliminary predictions. The model was run using a 5-fold cross-validation process, where the dataset was randomly divided into five equal parts, with four parts used for training and 1 part for testing. This process was repeated five times to ensure that the model’s predictions were not biased by a particular data split and to make the model more robust. GPR result for delta concentration.
Model hyperparameters.

ANN result
Artificial Neural Networks (ANN) were also employed to predict the dye adsorption outcomes using the same dataset of 96 data points. Like GPR, 80% of the data (76 points) were used for training and 20% (20 points) for testing. However, the ANN produced significantly better results compared to GPR, as shown in Figure 7. ANN results for delta concentration.
The R-squared value (R2 = 0.85) for the ANN model in Figure 6 indicates a much stronger correlation between the predicted and actual values compared to GPR. With 85% of the variance in the dye adsorption data explained by the ANN, the model demonstrated a high level of predictive accuracy, outperforming the GPR. The RMSE value (RMSE = 2.30) in Figure 7 reflects the lower average error in predictions compared to GPR, with an error margin of 2.30 units. The lower RMSE suggests that the ANN model is more precise in predicting dye adsorption outcomes.
Comparison of machine learning models
After applying both models, the role of GPR as a fair predictor is well supported, but the ANN reveals a higher value of R2 and a lower value of RMSE as compared to GPR. The higher accuracy of ANN recommends its use in real-world application for dye adsorption prediction as compared to the other techniques because the adsorption process is highly nonlinear, influenced by factors such as activated carbon type, contact time, salinity, and temperature. ANN, with its multi-layer architecture and activation functions, effectively models these complex relationships, whereas GPR assumes a smoother function space. ANN also excels in learning and generalizing from large datasets with intricate interactions, while GPR, relying on kernel functions, may struggle to fully capture adsorption dynamics. Additionally, ANN performs better in high-dimensional data by optimizing weights across multiple layers, whereas GPR faces scalability issues as the dataset grows. Moreover, ANN is more robust to data variability and experimental noise due to its iterative learning process, whereas GPR’s sensitivity to noise can lead to less accurate predictions. To validate the assumptions of these machine learning models and confirm their robustness, diagnostic plots were generated. Figure 8 presents the residuals versus predicted values, and Q-Q plots for both ANN and GPR models. The residuals appear randomly distributed with no discernible patterns, and the Q-Q plots confirm normality. These diagnostics support the reliable and appropriate implementation of both models for predicting dye adsorption. Diagnostic plots for ANN and GPR models confirming prediction accuracy and residual normality.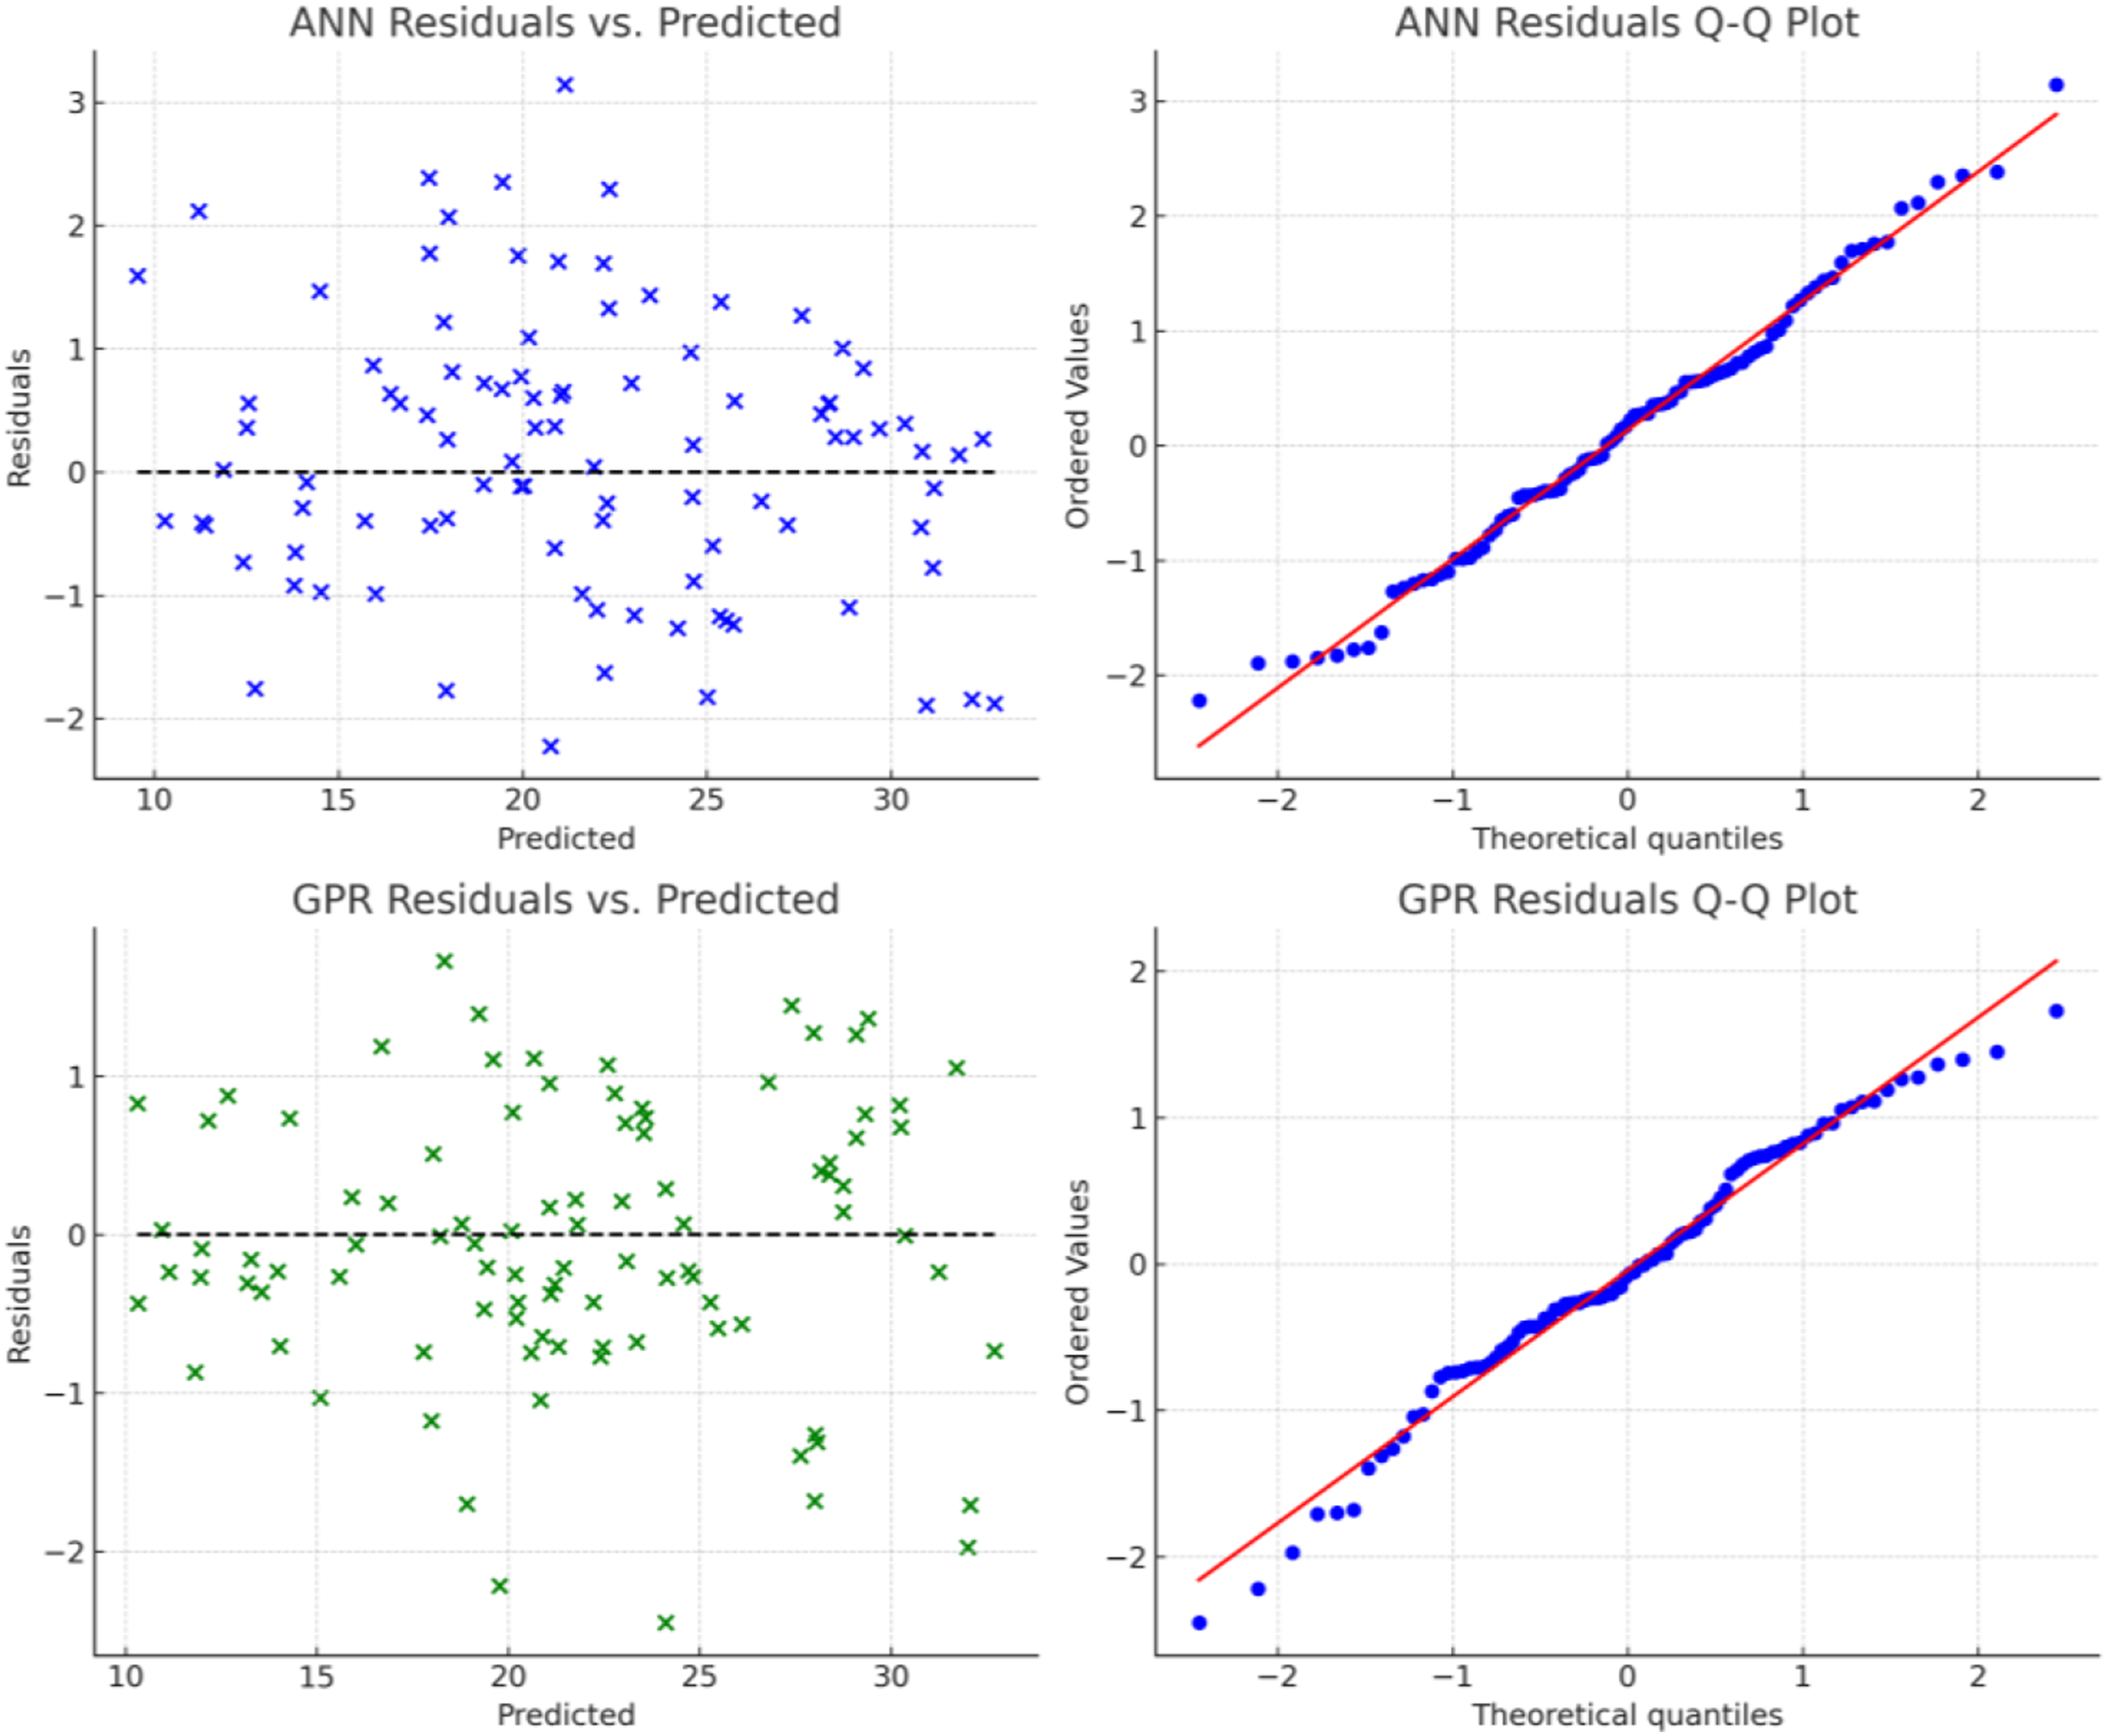
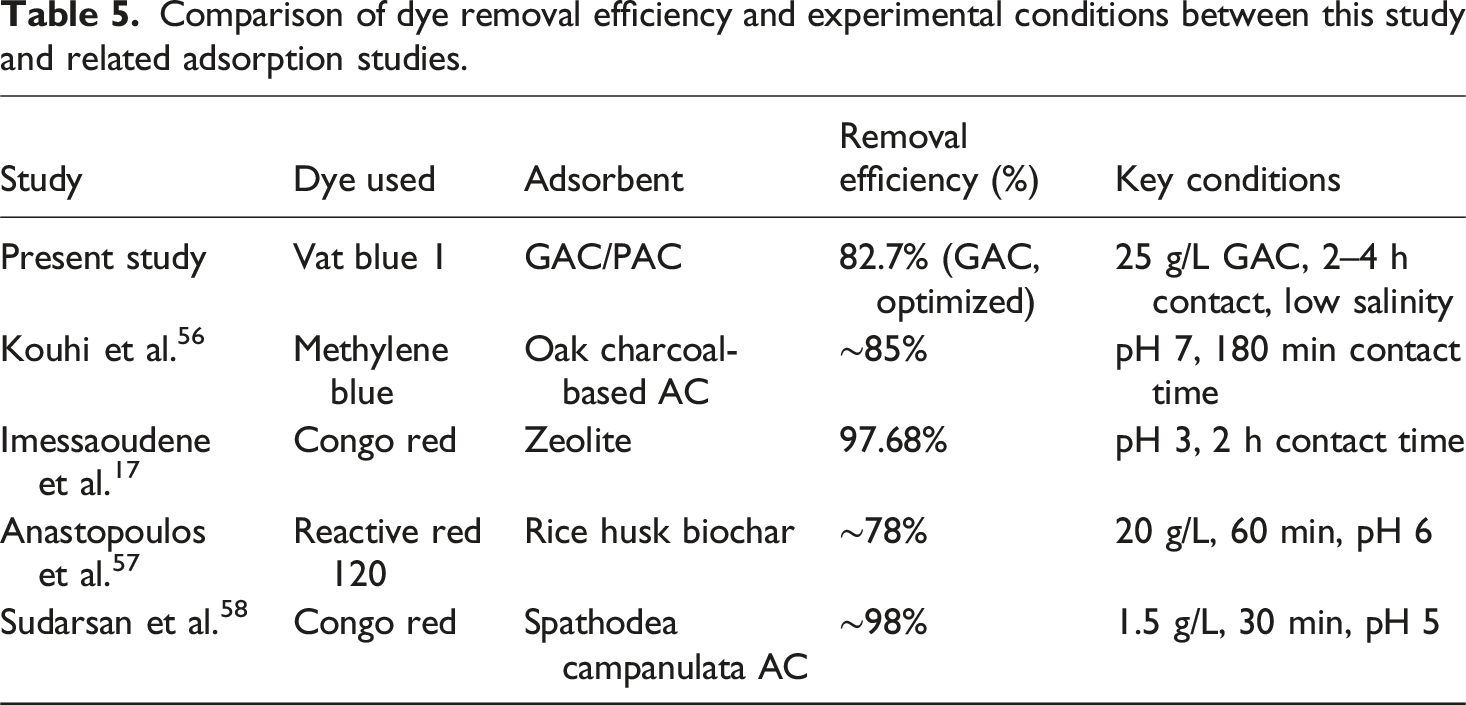
Comparison of dye removal efficiency and experimental conditions between this study and related adsorption studies.
Comparison of industrial and best parameters used
Comparison of industrial and best parameters used.

Conclusions
This research effectively improved the dye removal from textile wastewater by activated carbon through full factorial design. According to the obtained results, the type of activated carbon and the salinity levels have the highest impact on the adsorption capacity. Among all the tested activated carbon types, the granular activated carbon (GAC) is deemed more effective compared to powdered activated carbon (PAC) when the salinity level is relatively low. The real-world experimental results were supported by the machine learning models used, particularly ANN, to provide credible predictions of adsorption capacity at different conditions. Thus, the present study provides a strategy with a factorial design to attain the efficiency of the dye removal processes with minimum utilization of resources and provide effective solutions for wastewater treatment. They go a long way in helping solve the pollution problems of the textile industry and the environment.
It should be noted that this study focused exclusively on Vat Blue 1, a water-insoluble dye, which provided a controlled basis for parameter optimization. However, the findings may not fully generalize to other dye classes such as azo, reactive, or acid dyes, which differ in molecular structure and adsorption behavior. Similarly, while this study assumes activated carbon particularly GAC as the most effective adsorbent, its high cost, regeneration challenges, and environmental impact present limitations. To improve the generalizability and sustainability of dye removal processes, future studies should investigate a broader spectrum of dyes and consider alternative adsorbents such as agricultural by-products, biochar, and zeolites, which offer promising low-cost and eco-friendly solutions. Additionally, the machine learning models used in this study were developed on a relatively small and controlled dataset. Although the models demonstrated high accuracy, their performance may be limited when applied to larger, more diverse, and noisier datasets typical of real-world industrial settings. Future research should validate these models using cross-validation techniques and out-of-sample testing with data sourced from multiple textile facilities to ensure their robustness and generalizability in practical applications.
The method developed in this research can be adapted for other industries like food and beverage, pharmaceutical, chemical, and others that generate wastewater from the dye. Future work can employ central composite design (CCD) and response surface methodology (RSM) to fine-tune the optimization process even more. Furthermore, the possibility of the regeneration and recycling of the GAC requires a feasibility study in terms of costs and impact on the environment. Future studies should also consider a detailed cost-benefit analysis and life-cycle assessment to evaluate the economic and environmental feasibility of implementing GAC based treatment systems at industrial scale. This includes comparing operational costs with alternative materials and quantifying the environmental footprint of carbon regeneration processes. Larger implementations of machine learning models, for instance, incorporating more ensemble mechanisms or fused models, would consequently improve the existing predictive capability in complex adsorption systems. Furthermore, it would also be helpful in seeking other forms of effective, low-cost adsorbents from agricultural or industrial residual wastes in large-scale wastewater treatment processes.
Footnotes
Funding
The authors disclosed receipt of the following financial support for the research, authorship, and/or publication of this article: The author extends their appreciation to the Deanship of Scientific Research, the King Khalid University of Saudi Arabia, for funding this work through the Large Groups Research Project under grant number: (RGP.2/437/45).
Declaration of conflicting interests
The authors declared no potential conflicts of interest with respect to the research, authorship, and/or publication of this article.
Data Availability Statement
All data is available within the manuscript.
Appendix
Experimental results for design.
No.
Type of activated carbon (AC)
Contact time
Amount of activated carbon (AC)
Temperature
Salinity
Δ concentration
1.
PAC
4
25
20
0.01
24.56
2.
GAC
4
15
20
0.01
31.01
3.
GAC
4
25
20
0.01
30.36
4.
GAC
4
15
40
0.01
23.18
5.
PAC
2
15
20
0.1
29.25
6.
GAC
2
15
40
0.01
28.77
7.
GAC
2
25
20
0.05
29.06
8.
PAC
4
15
40
0.1
12.87
9.
GAC
2
15
40
0.01
28.89
10.
GAC
4
15
20
0.1
13.18
11.
GAC
4
15
20
0.1
17.22
12.
GAC
4
15
40
0.1
13.12
13.
PAC
4
25
20
0.1
13.73
14.
PAC
2
25
40
0.01
24.65
15.
PAC
4
15
40
0.05
20.05
16.
GAC
4
15
20
0.05
20.11
17.
GAC
2
15
40
0.1
19.07
18.
PAC
2
15
20
0.01
17.56
19.
PAC
2
15
40
0.05
21.25
20.
GAC
4
15
20
0.01
23.88
21.
PAC
2
25
40
0.1
10.98
22.
GAC
4
25
20
0.05
32.76
23.
PAC
2
25
20
0.1
14.05
24.
PAC
2
15
40
0.1
22.68
25.
PAC
4
15
20
0.1
21.75
26.
GAC
4
25
40
0.05
31.04
27.
GAC
4
25
40
0.01
26.76
28.
GAC
2
15
20
0.01
30.36
29.
PAC
4
25
40
0.01
19.67
30.
GAC
2
25
20
0.05
30.03
31.
GAC
4
15
40
0.01
23.67
32.
GAC
4
15
40
0.05
18.54
33.
PAC
4
15
40
0.1
11.89
34.
GAC
4
25
20
0.01
28.85
35.
GAC
2
25
40
0.01
20.62
36.
PAC
4
25
20
0.05
15.95
37.
GAC
2
15
20
0.1
22.03
38.
GAC
2
25
20
0.1
21.8
39.
PAC
2
15
40
0.01
11.14
40.
PAC
2
25
20
0.05
26.24
41.
GAC
4
25
40
0.1
23.76
42.
PAC
2
25
40
0.05
24.4
43.
GAC
4
25
20
0.05
31.98
44.
PAC
2
15
40
0.05
20.7
45.
GAC
4
25
20
0.1
19.24
46.
GAC
4
15
40
0.05
16.81
47.
PAC
2
25
20
0.01
28.85
48.
PAC
4
15
20
0.05
22.93
49.
PAC
4
25
40
0.1
10.89
50.
PAC
4
25
40
0.05
13.32
51.
PAC
4
15
40
0.05
21.78
52.
GAC
2
25
20
0.01
17.87
53.
GAC
2
25
20
0.01
18.89
54.
PAC
2
25
40
0.1
11.68
55.
PAC
2
15
20
0.05
24.48
56.
GAC
2
25
40
0.01
20.9
57.
GAC
4
25
40
0.01
29.7
58.
GAC
2
25
20
0.1
21.24
59.
GAC
4
15
40
0.1
15.32
60.
PAC
2
25
40
0.05
24.18
61.
PAC
4
15
20
0.01
26.33
62.
PAC
2
25
40
0.01
24.85
63.
PAC
2
15
20
0.05
23.67
64.
PAC
4
15
20
0.05
24.88
65.
PAC
4
25
40
0.05
13.55
66.
GAC
2
15
40
0.05
20.59
67.
PAC
4
25
40
0.01
19.8
68.
GAC
4
25
20
0.1
24.33
69.
PAC
2
15
40
0.01
10.95
70.
GAC
2
25
40
0.1
20.73
71.
GAC
2
15
20
0.05
17.05
72.
GAC
2
25
40
0.05
30.36
73.
PAC
2
15
40
0.1
21.98
74.
GAC
2
15
20
0.01
30.94
75.
PAC
4
25
20
0.01
24.29
76.
PAC
2
25
20
0.1
15.01
77.
GAC
4
25
40
0.1
18.84
78.
PAC
4
25
20
0.1
12.87
79.
GAC
4
15
20
0.05
19.93
80.
GAC
2
25
40
0.1
19.84
81.
GAC
2
15
20
0.05
18.21
82.
PAC
4
15
20
0.01
26.76
83.
PAC
4
25
20
0.05
16.14
84.
PAC
4
15
40
0.01
21.66
85.
PAC
2
25
20
0.05
25.53
86.
GAC
2
15
40
0.05
20.89
87.
PAC
2
15
20
0.1
27.76
88.
PAC
4
25
40
0.1
9.89
89.
PAC
2
15
20
0.01
17.05
90.
PAC
4
15
20
0.1
20.25
91.
GAC
2
15
40
0.1
19.83
92.
PAC
4
15
40
0.01
21.86
93.
GAC
2
25
40
0.05
30.09
94.
GAC
4
25
40
0.05
30.77
95.
PAC
2
25
20
0.01
28.57
96.
GAC
2
15
20
0.1
21.63