
Abstract
This study provides empirical evidence that parcel-level socioeconomic indices can be reliably inferred from urban form using deep learning. Building on a representation that links cadastral parcels with digital surface models, we train EfficientNet variants to predict return on investment (ROI)—used here as a representative parcel-level economic indicator—directly from volumetric form. Across more than 24,000 parcels in a North American city, the models exhibit stable convergence and consistent generalization, capturing systematic variations across residential, commercial, and industrial morphologies. Although errors increase in dense commercial cores—where financial volatility and vertical complexity are highest—predictions remain bounded and preserve spatial gradients of ROI. The learned embeddings further reveal coherent manifolds structured by building massing, footprint geometry, and block configuration, indicating that the model extracts underlying spatial principles that correlate with economic outcomes. These findings demonstrate that urban form encodes measurable signals of economic performance and establish morphological learning as a viable pathway for integrating financial, environmental, and socio-cultural indices into form-based urban analysis and design.
Keywords
Introduction
In recent years, the advent of deep learning in urban analysis has brought into sharp relief a fundamental issue: how should urban form data be formatted? The problem is not a mere matter of convenience and efficiency. The representation of form determines the scope of learnable patterns, and thereby shapes the kinds of questions we can pose through form. Without a consistent and robust format, model training becomes unstable, and the discovery of complex or previously obscured spatial relationships is hindered.
Urban form research has developed a rich tradition of using measurable indicators—including density, coverage ratios, block size, and sky-view factors—to describe particular dimensions of physical form. These metrics provide valuable insights and remain central to many comparative and descriptive analyses. Yet, because such indicators summarize selected attributes into low-dimensional metric representations, they inevitably offer a partial perspective, and may not capture the full continuity of form or the contextual interplay among built elements that are often important in morphology-oriented analyses.
As demonstrated in prior studies, metric-based approaches are often global in scope, and less suited to capturing the finer-grained spatial nuances, multi-scalar relationships, and latent structural patterns (Rhee, 2025). Such aspects become more pronounced when training deep learning models or conducting cross-city analyses that require consistent and contextually complete input data.
In earlier work, we therefore proposed an alternative data format specifically designed to represent urban form for deep learning (Rhee, 2025). This representation allowed deep learning models to capture spatially coherent morphological features of urban space in a stable and consistent way. Through comparative case studies, we demonstrated that the format could be used not only to encode buildings and their surrounding contexts but also to support classification and descriptive analysis of morphological patterns across cities.
The present study extends this line of inquiry. It asks whether such a representation might serve a more ambitious role: moving beyond the classification and description of form to explore whether morphological features encode signals associated with social, cultural, or economic indices. Such indices rarely yield to linear correlation or simple causal models; they are shaped by non-linear, multi-layered, and often implicit dependencies that extend beyond what conventional analytical approaches. The challenge, then, is to determine whether a format devised for urban form—when coupled with deep learning—can surface these hidden structures and make legible patterns that remain obscured under traditional methods.
This article reports on an initial experiment toward that end. By employing the novel format in relation to the return on investment (ROI) index, we demonstrate how the representation of urban form can operate not only as a descriptive tool but also as a means of surfacing potential structural associations between form and index.
In this study, ROI is used not because it is the central object of inquiry, but because it represents a class of socioeconomic indices that are frequently assumed to relate to urban space while, in practice, arising from highly complex and often opaque interactions. Its multifaceted nature makes it an instructive test case: if a morphology-based representation can surface meaningful signals in relation to ROI, then it may hold promise for exploring other similarly intricate indicators. Accordingly, ROI functions here as an illustrative example rather than the primary theoretical focus of the investigation.
This, in turn, highlights a broader role for computational morphology: not merely as a tool for representing built form, but as a methodological bridge that links spatial configuration to the social and economic conditions with which it is interwoven.
Background
Quantitative studies of urban form developed around relatively direct measures of morphology. Early work on density and compactness proposed a variety of indices to capture how built fabric is distributed in space, distinguishing between gross and net densities, and relating them to dwelling types, land consumption, and perceived crowding (Alexander, 1993; Burton, 2002). Subsequent contributions framed the city as a kind of porous medium, introducing compactness, porosity, sinuosity, and related indicators to assess environmental performance at the district and city scales (Adolphe, 2001). Parallel efforts used digital elevation models and rasterized representations of urban texture to derive measures such as surface-to-volume ratios and façade-adjacent “passive areas,” linking these to energy demand at the building and neighborhood levels (Ratti et al., 2005). Other strands developed block- or parcel-based descriptors, including surface area and volume per projected area, building-to-land ratios, and mean heights, in order to quantify the morphological properties of city blocks and compare them across districts and cities (Yoshida and Omae, 2005; Steiniger, 2006; Rashed et al., 2003).
Recent work has expanded this tradition through large-scale morphometric analysis of street networks, blocks, and building footprints. Boeing’s quantitative measures—such as street-network orientation order, circuity, entropy, and intersection typologies—have demonstrated how urban form varies systematically across global cities and how these structural metrics relate to regional development patterns (Boeing, 2019, 2022). Fleischmann and colleagues have likewise advanced grid-based morphometrics, developing comparative indicators of block regularity, connectivity, and built-form intensity across dozens of metropolitan regions (Fleischmann, 2017; Fleischmann and Arribas-Bel, 2022). These studies have established a rich vocabulary of numerical measures for describing aspects of urban morphology.
Building on this foundation, researchers began to relate these morphometric indicators to social, economic, and environmental outcomes. Compactness and density measures were associated with questions of social sustainability, accessibility, and equity in British towns and cities, as planners sought empirical evidence for or against the compact city hypothesis (Burton, 2002). Indicators of intensity, centrality, and diversity of built form were later regressed against composite measures of livability—such as accessibility, social diversity, affordability, and economic vitality—in metropolitan regions like Vancouver, revealing broad tendencies in how built form and socioeconomic conditions covary across scales (Martino et al., 2021). Similar approaches linked density, land-use mix, and other aggregate metrics to housing prices, income distributions, or deprivation indices, mostly through linear models.
More broadly, urban form has been examined in relation to a wide array of socioeconomic outcomes, including walkability and mobility performance (Ewing and Cervero, 2010), retail vitality and footfall (Sevtsuk, 2010), demographic diversity and residential segregation (Talen and Lee, 2018; Talen, 2018), neighborhood safety and crime incidence (Hillier and Sahbaz, 2008; Armitage, 2013), environmental justice and transportation energy use (Frank et al., 2005), building cooling at microclimate scale (Maiullari, 2023), and residential property values (Tyrväinen, 1997; Song and Knaap, 2003). Studies have variously associated block size, street connectivity, parcel shapes, façade continuity, frontage conditions, network centrality, and land-use mixture with indicators such as income, accessibility, job density, vitality, crime incidence, and quality-of-life scores. In these studies, morphology appeared primarily as a set of explanatory variables, with density- or block-based indicators serving as proxies for more complex spatial processes.
The emergence of machine learning, and more recently deep learning, shifted the emphasis from pre-defined formulas to data-driven discovery. In this literature, imagery, street networks, and building footprints became the substrates for deep learning-based analysis. Yet the dominant applications were environmental: models were trained to classify land cover (Vali et al., 2020), map urban heat islands (Akintola and Neziri, 2025), predict vegetation indices (Hu et al., 2025), or estimate pollution exposure (Mazza et al., 2018).
A second line of research used street-view imagery and satellite images as proxies for socioeconomic inference. Early studies showed that convolutional neural networks could infer perceived safety and crime risk from streetscape cues (Naik et al., 2014), estimate income and demographic composition from façade-level imagery
Despite extensive work across these studies, a shared representational limitation remains. Conventional socioeconomic–morphology studies rely on low-dimensional metrics—density, block size, land-use mix, and centrality—that capture only selected attributes of the built environment and portions of the spatial continuity of form. Recent deep learning approaches shift to data-driven inference but operate largely on visual proxies such as satellite images, street-view façades, or rendered networks. These inputs privilege surface appearance, depend on lighting or camera perspective, and express the city through what is visible rather than through its underlying spatial organization. Across both lines of research, urban form is engaged in ways that highlight particular facets of its complexity—either through aggregated indicators or through imagery capturing visible surface conditions. While these approaches offer important insights, they are not intended to encode the full geometric and contextual structure of urban form in an integrated way. A representation that brings these dimensions together for deep learning would complement existing methods and create additional room for uncovering subtler associations between spatial configuration and socioeconomic conditions.
To address such limitations, our earlier work (Rhee, 2025) introduced a structural representation of urban form designed specifically for deep learning. Rather than treating form as a set of scalar metrics or as a visual façade, the study developed a parcel-centered form-encoding scheme that incorporated three-dimensional morphological information derived from LiDAR-based digital surface models (DSMs) together with the contextual forms surrounding each parcel. This representation preserved continuity, adjacency, and local configuration—properties that conventional metrics and imagery do not capture—and enabled neural networks to learn stable and distinctive morphological patterns. Through cross-city classification and clustering experiments, we demonstrated that this representational approach could extract coherent morphological features that were not attainable through image-based or metric-based methods.
Although deep learning models do not yield explicit, human-interpretable feature sets, the representational scheme used here provides a clear account of the morphological information available for learning. Because each tile embeds LiDAR-derived surface geometry together with parcel-centered spatial context, the input representation encodes a range of properties central to urban morphology, including (1) building height and height variation, (2) massing distribution and volumetric intensity, (3) parcel coverage and open–built ratios, (4) frontage alignment and setback conditions, (5) block structure and adjacency relations, and (6) local street–parcel configuration. These are precisely the kinds of geometric and configurational cues that conventional metrics or imagery struggle to preserve, and they define the scope of morphological patterns that a deep learning model can learn from this representation.
The present study asks whether this representational structure, beyond supporting classification and clustering, also contains signals associated with socioeconomic indices. Demonstrating such associations would suggest that the representation encodes aspects of spatial configurations that remain inaccessible to aggregated metrics or imagery-based proxies.
Methods
The methods used in this study employ the structural representation of urban form developed in our earlier work (Rhee, 2025), where parcel-centered urban form samples were generated from LiDAR-derived surface models and their surrounding contextual forms. Rather than reintroducing this representational scheme in detail, we retain it here as a fixed substrate in order to examine a different question: whether a representation originally designed for morphological analysis can register signals associated with socioeconomic indices. By holding the data’s representational structure design constant, the present study shifts the methodological focus from developing a new format to experimenting with the analytical capacities of the existing one—specifically, whether the encoded morphology contains information that corresponds with spatial variation in an economic indicator.
To pursue this inquiry, we conduct an empirical analysis in the City of Airdrie, a rapidly growing mid-sized North American municipality. The city provides both the fine-grained morphological data required to construct the parcel-centered urban form samples and the parcel-level assessment records needed to compute a spatially resolved return on investment (ROI) index. ROI is employed not as the central object of inquiry but as a representative socioeconomic measure that is quantifiable, spatially alignable with urban form data, and methodologically suitable for testing whether the representation can surface associations beyond purely morphological distinctions. In this context, the city serves as a case through which the broader analytical potential of the representational scheme can be assessed.
The experimental workflow proceeds in three coupled stages, each deliberately constrained to preserve the integrity of the representational format (Figure 1). In the first stage, dataset preparation, the financial index of return on investment is spatially aligned with parcel-centered urban form samples, yielding a consistent dataset that anchors geometry to measurable economic attributes. The second stage, training, probes the capacity of deep learning models under different architectures, procedures, and hyperparameter regimes, testing not merely performance but the stability of learning under controlled variation. Lastly, results are evaluated across complementary lenses: convergence of loss curves, comparative behavior of alternative loss functions, and qualitative samples that ground numerical outcomes in recognizable urban contexts. Overview of the methodological workflow, comprising dataset preparation, model training, and results evaluation.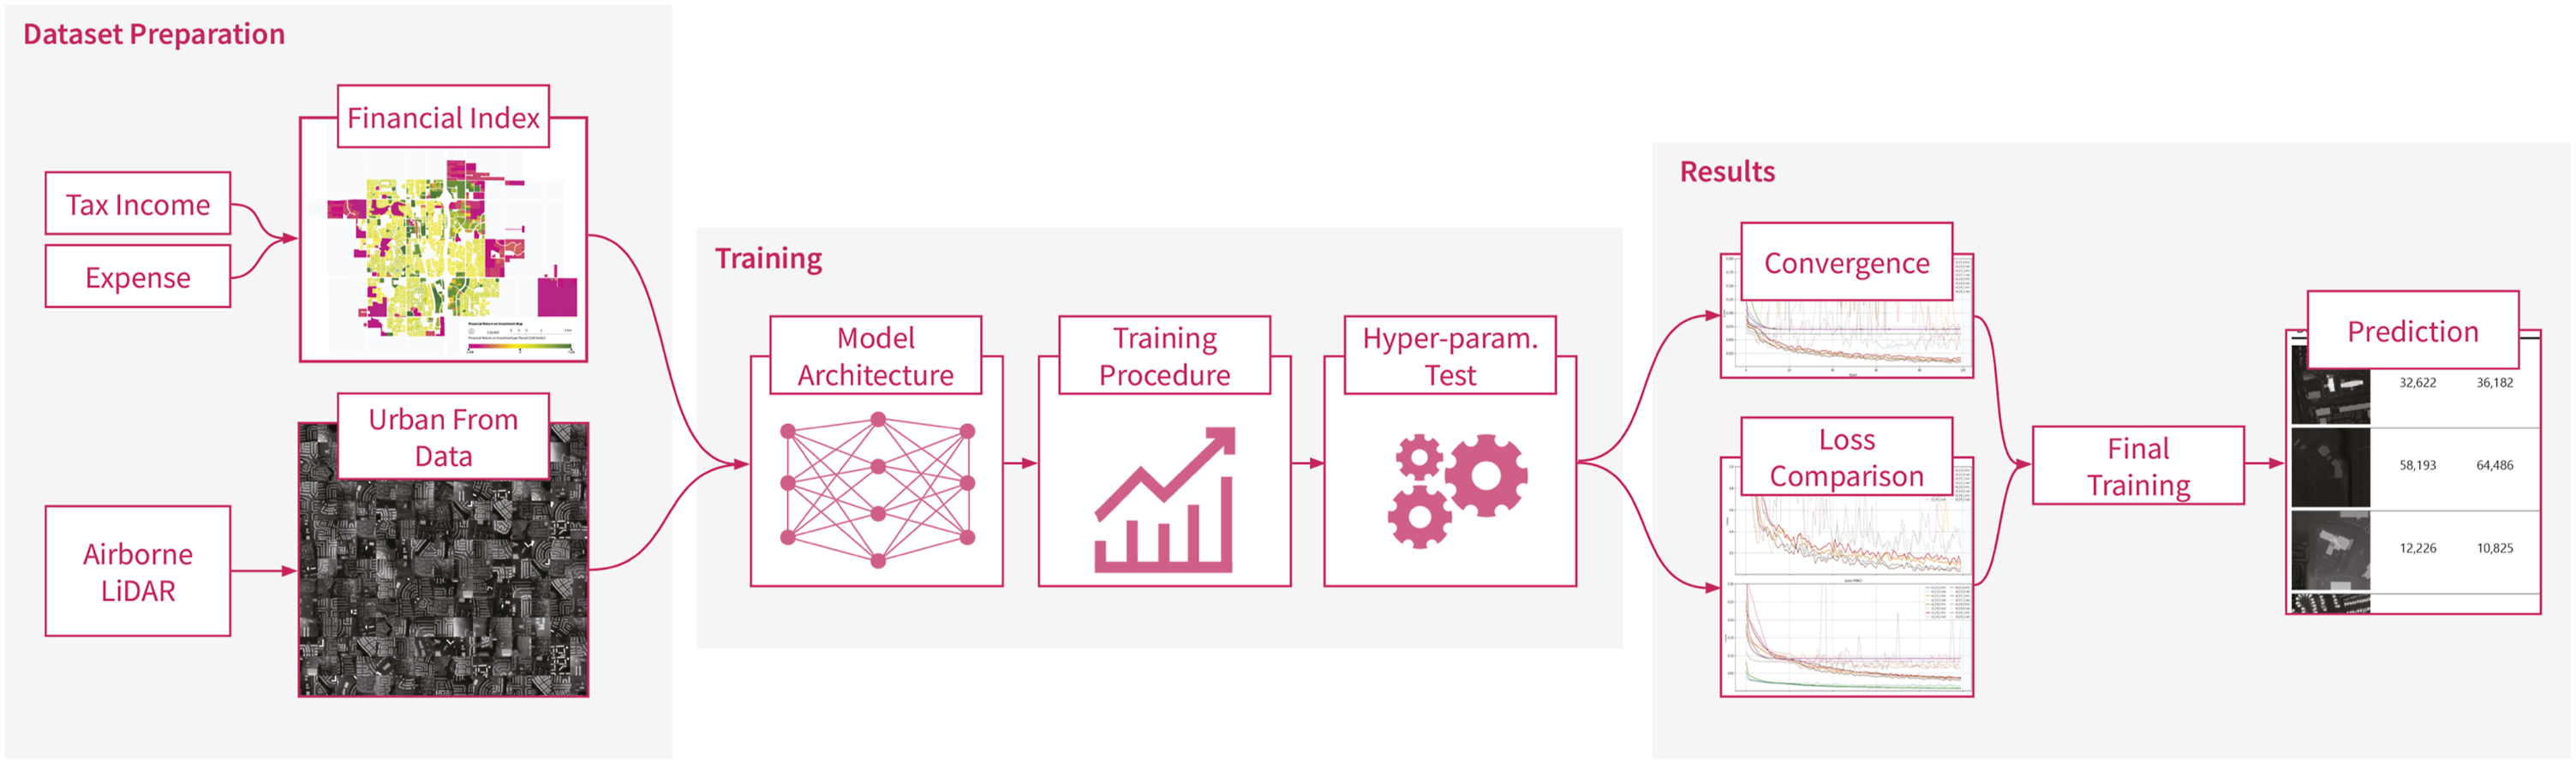
Data preparation
Financial index
ROI employed is as the financial index in this study, defined and computed at the level of individual parcels. Parcels provide an appropriate unit of analysis as they link the financial attributes of land and development directly to their geometric form. Municipal assessment records supply the evaluated property values, while development costs are derived from recorded construction and land-use. For land-use classification, we used the official municipal land-use designations provided by the city, which correspond to the zoning categories used in planning and assessment. The dataset assigns each parcel one of the following classes: Airport, Commercial, Hybrid, Industrial, Mixed Use, Public, Residential, Rural, and Future Development.
This parcel-level granularity ensures that the financial index is anchored in legally and administratively recognized units of urban land, thereby avoiding the arbitrariness that often arises when aggregating across larger spatial units such as census tracts or neighborhoods.
Formally, ROI for each parcel i was calculated using the conventional ratio of net gain to cost:

The distribution of parcel-level ROI values spans a wide range, from the largest loss of −$1, 777, 244 to the highest gain of $708, 704, with a median of only $2, 405 (Figure 2). Such disparity reflects the heterogeneity of urban development contexts but also poses challenges for stable model training, as extreme outliers dominate the scale of the response variable. To address this, ROI values were standardized using z-score normalization, Financial return on investment (ROI) mapped at the parcel level for the City of Airdrie. Values are expressed in dollars and visualized using a diverging color scale, where negative returns appear in magenta and positive returns in green. The map illustrates the spatial distribution of financial performance across residential, commercial, and industrial parcels.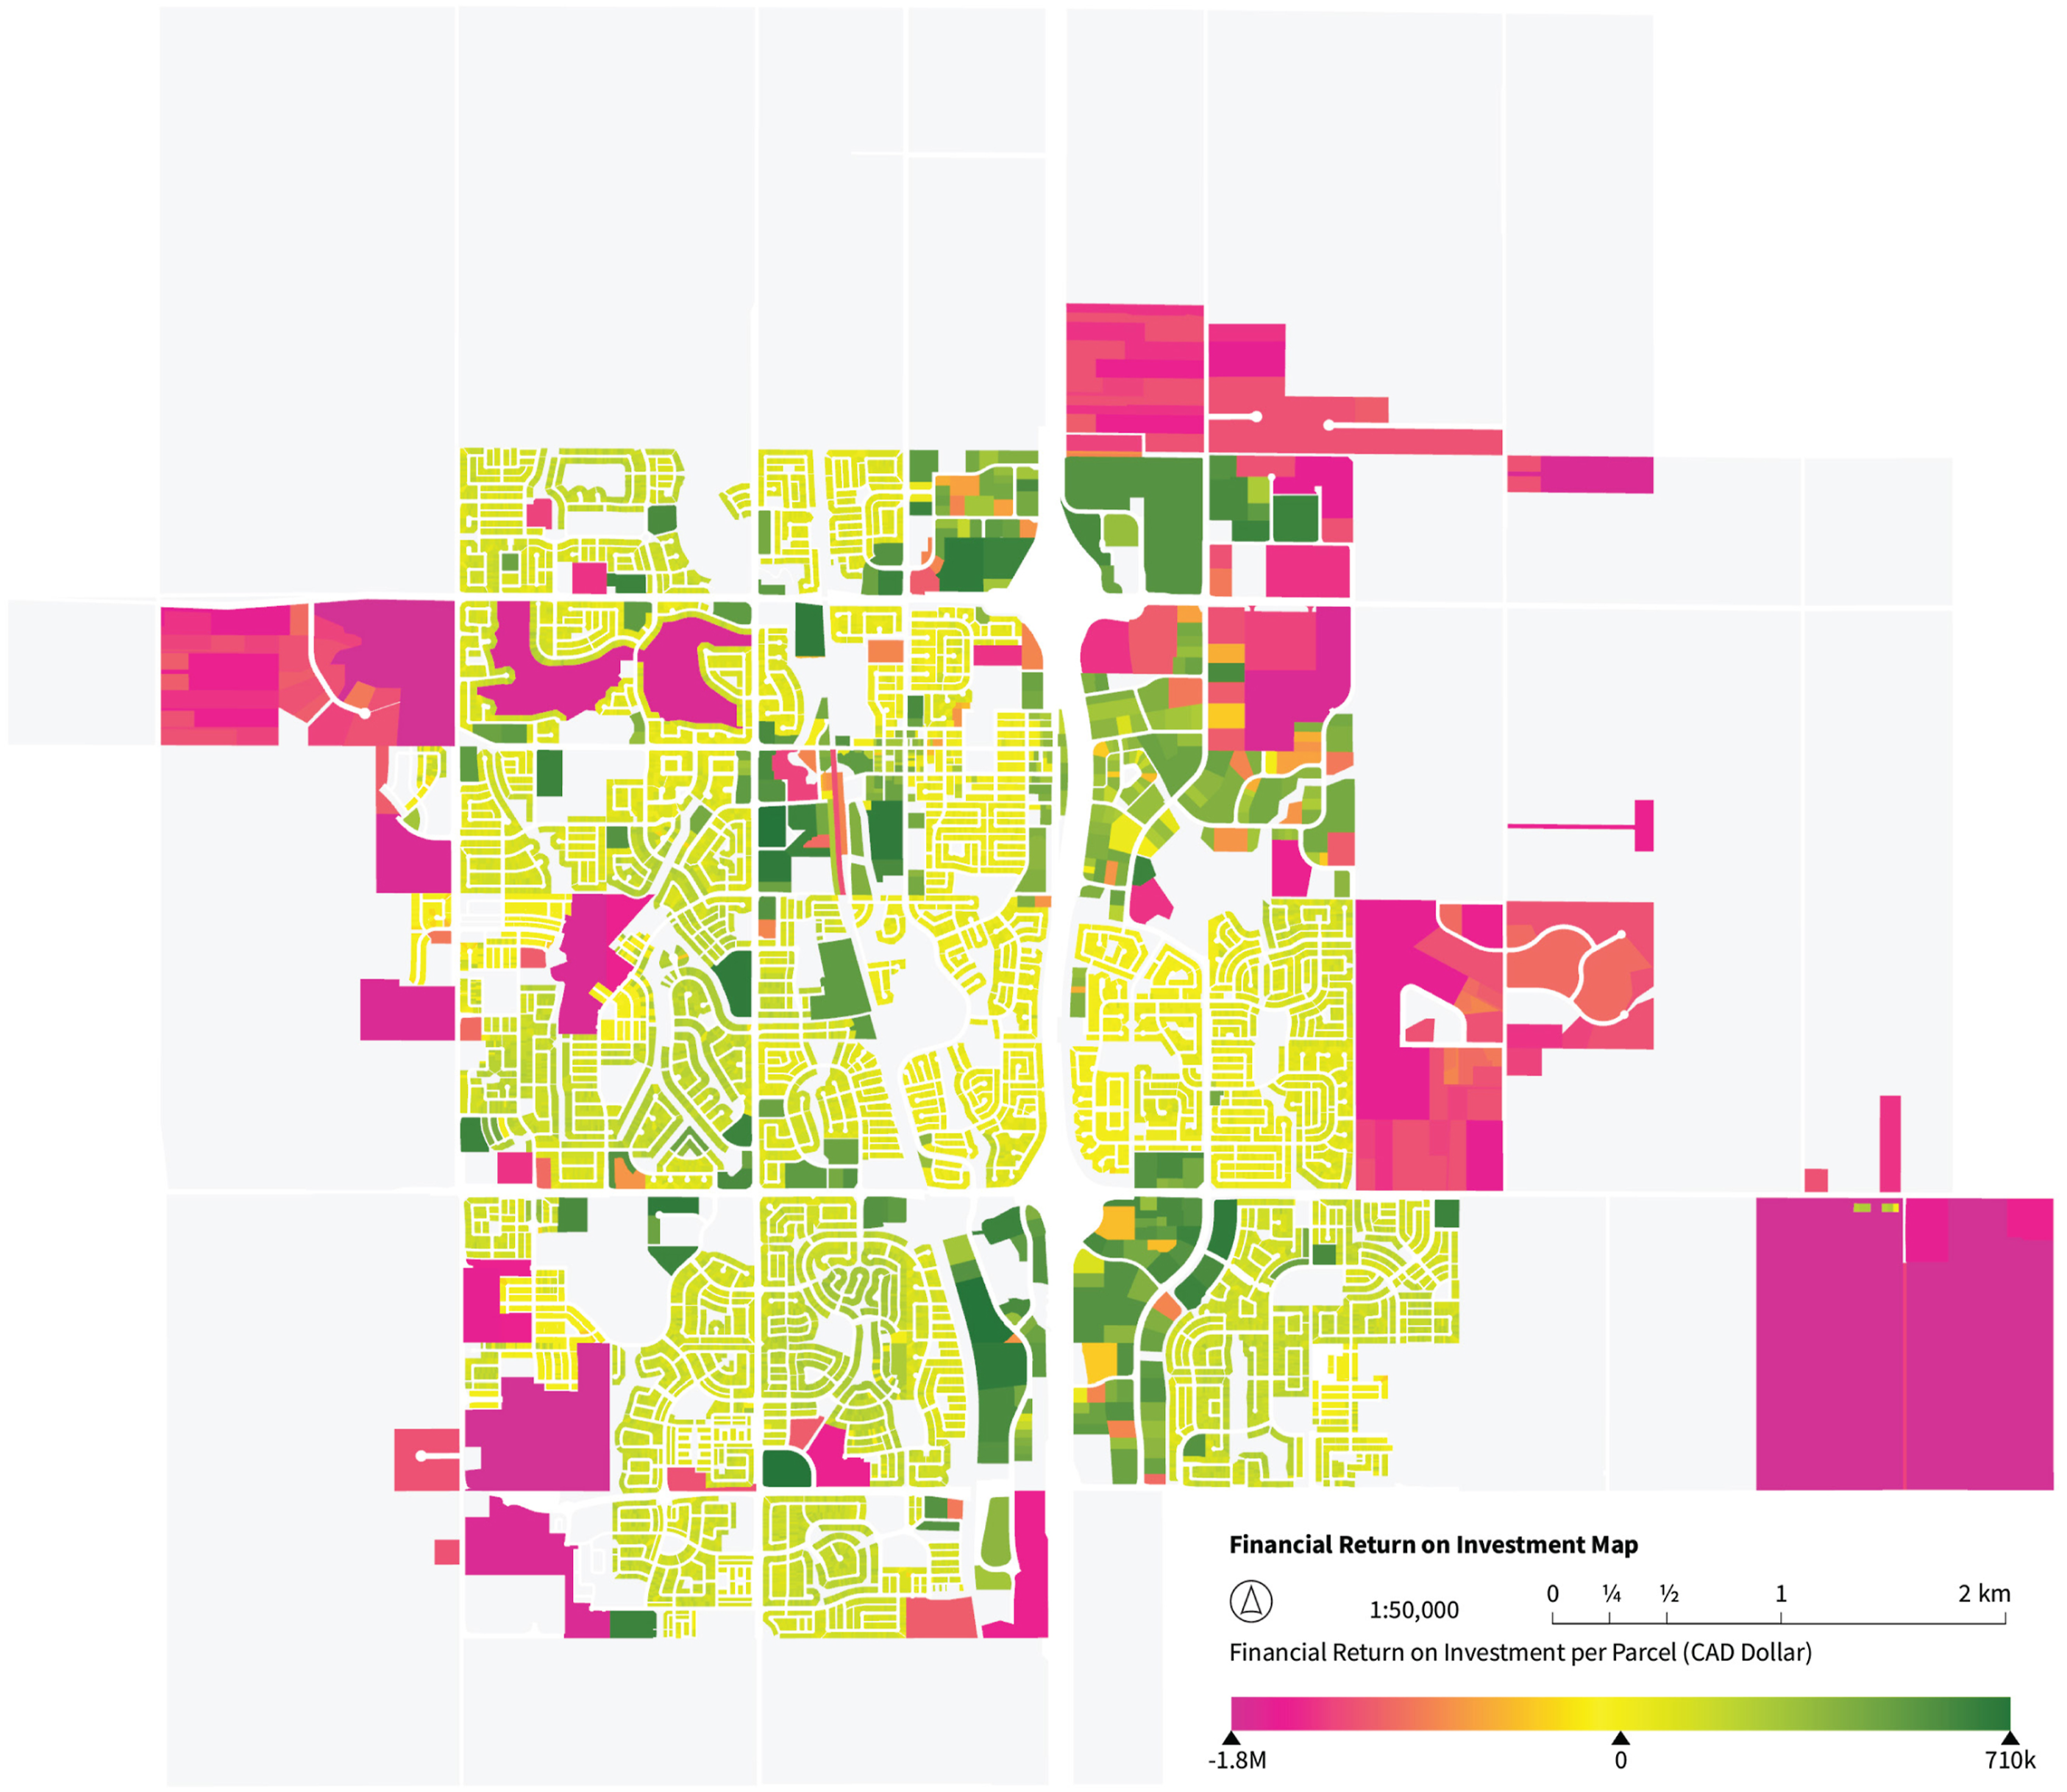

Urban form data
The representation of urban form in this study is grounded in spatial datasets that record the geometry and configuration of the city. The primary layer is a digital surface model (DSM), derived from aerial LiDAR measurements and processed into raster format. Unlike planimetric maps, the DSM encodes the volumetric articulation of buildings, vegetation, and infrastructure, thereby preserving the massing and height profiles that define the three-dimensional structure of the urban fabric. For this study, DSM rasters offer an efficient input for convolution-based models, which operate best on regular grids; point cloud alternatives demand far greater resources without clear benefits for the present form–index analysis. In this way, form is rendered not as an abstract outline but as a tangible morphology.
To complement the DSM, cadastral parcel boundaries were incorporated. These boundaries anchor urban form samples to legally and institutionally defined units of urban space. By joining parcels to their assessed financial values, the dataset situates urban forms within the economic and regulatory framework that conditions development. This pairing of volumetric form with parcel demarcation allows each sample to be understood simultaneously as a spatial object and as a bearer of financial attributes.
From these sources, we constructed a dataset in which each sample centers on a parcel and integrates the DSM representation of its geometry together with its immediate surroundings. The resulting dataset captures not only the physical form of individual buildings but also their configurational relation to adjacent parcels and networks. These samples furnish the inputs for deep learning, enabling the exploration of how the structural logic of form relates to the financial index of return on investment.
Given a set of parcel geometries {p1, p2, …, p n }, the goal was to extract a 3D representation (DSM) of the surrounding environment for each parcel by querying and processing LiDAR point clouds.
For each parcel polygon p
i
, we began by computing its centroid C
i
= (x
i
, y
i
), and defined a square spatial window E
i
centered at C
i
with buffer size b, such that

This extent was used to identify a subset of LAS
1
files

From each LAS file

To normalize terrain elevation, the ground height at the centroid was estimated using the nearest neighbor in G
i
, given by

The point cloud D
i
was then spatially filtered to include only points within the extent:

This filtered point set was rasterized into a digital surface model with cell size c, and the elevation values z were normalized by subtracting the estimated ground height, followed by scaling into the 8-bit grayscale range:


In this manner, each rasterized and terrain-normalized surface was exported as an image I i , indexed by parcel identifier and annotated with metadata such as minimum, maximum, and reference ground heights. This practice ensured not only the reproducibility of individual samples but also the systematic traceability of the dataset as a whole.
This workflow constitutes more than a technical routine: it establishes a principled pipeline through which parcel-centered LiDAR data are queried, heights are anchored to local ground conditions, and three-dimensional urban space is translated into image form. The resulting DSMs capture the volumetric and configurational character of the built environment, furnishing representations expressly suited to downstream tasks in machine learning and comparative urban analysis.
Dataset
The preparation of both urban form and ROI values yielded a paired dataset of input–output relations suitable for supervised learning. Form was encoded as parcel-centered DSM imagery, while ROI was standardized into a comparable financial index. Within this framework, the urban form data constitute the input features X, and ROI values provide the supervised labels y. The resulting dataset can thus be represented as pairs (x i , y i ), enabling the training of models to approximate the conditional distribution P(y∣x)—that is, the probability of observing a particular ROI given a specific configuration of urban form.
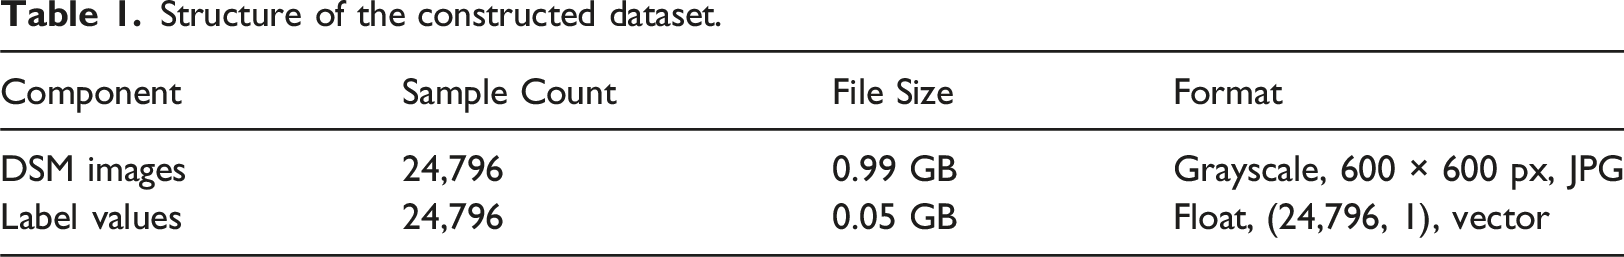
The sampling frame consisted of all parcels within the municipal boundary. To maintain representational integrity, we excluded parcels whose geometric context could not be reliably constructed. Specifically, parcels located at or near the municipal boundary—where the LiDAR footprint truncates the surrounding built form—and parcels situated in areas with severely degraded or incomplete LiDAR returns were removed from the sample. After this filtering, the final dataset consisted of 24,796 paired samples, each comprising a DSM image and an associated financial labels, ROI values. Images were stored in grayscale format at a resolution of 600 × 600 pixels as JPEG files (Figure 3), while the labels were represented as a floating-point vector of shape (24, 796, 1) (Table 1). This formulation establishes a direct bridge between morphology and economic performance, aligning the data structure with the goals of discriminative deep learning. Sample collection of DSM-based urban form data generated from the City of Airdrie. Each tile represents a 256 × 256 DSM patch extracted at the parcel scale, illustrating the diversity of residential morphologies captured by the dataset. Structure of the constructed dataset.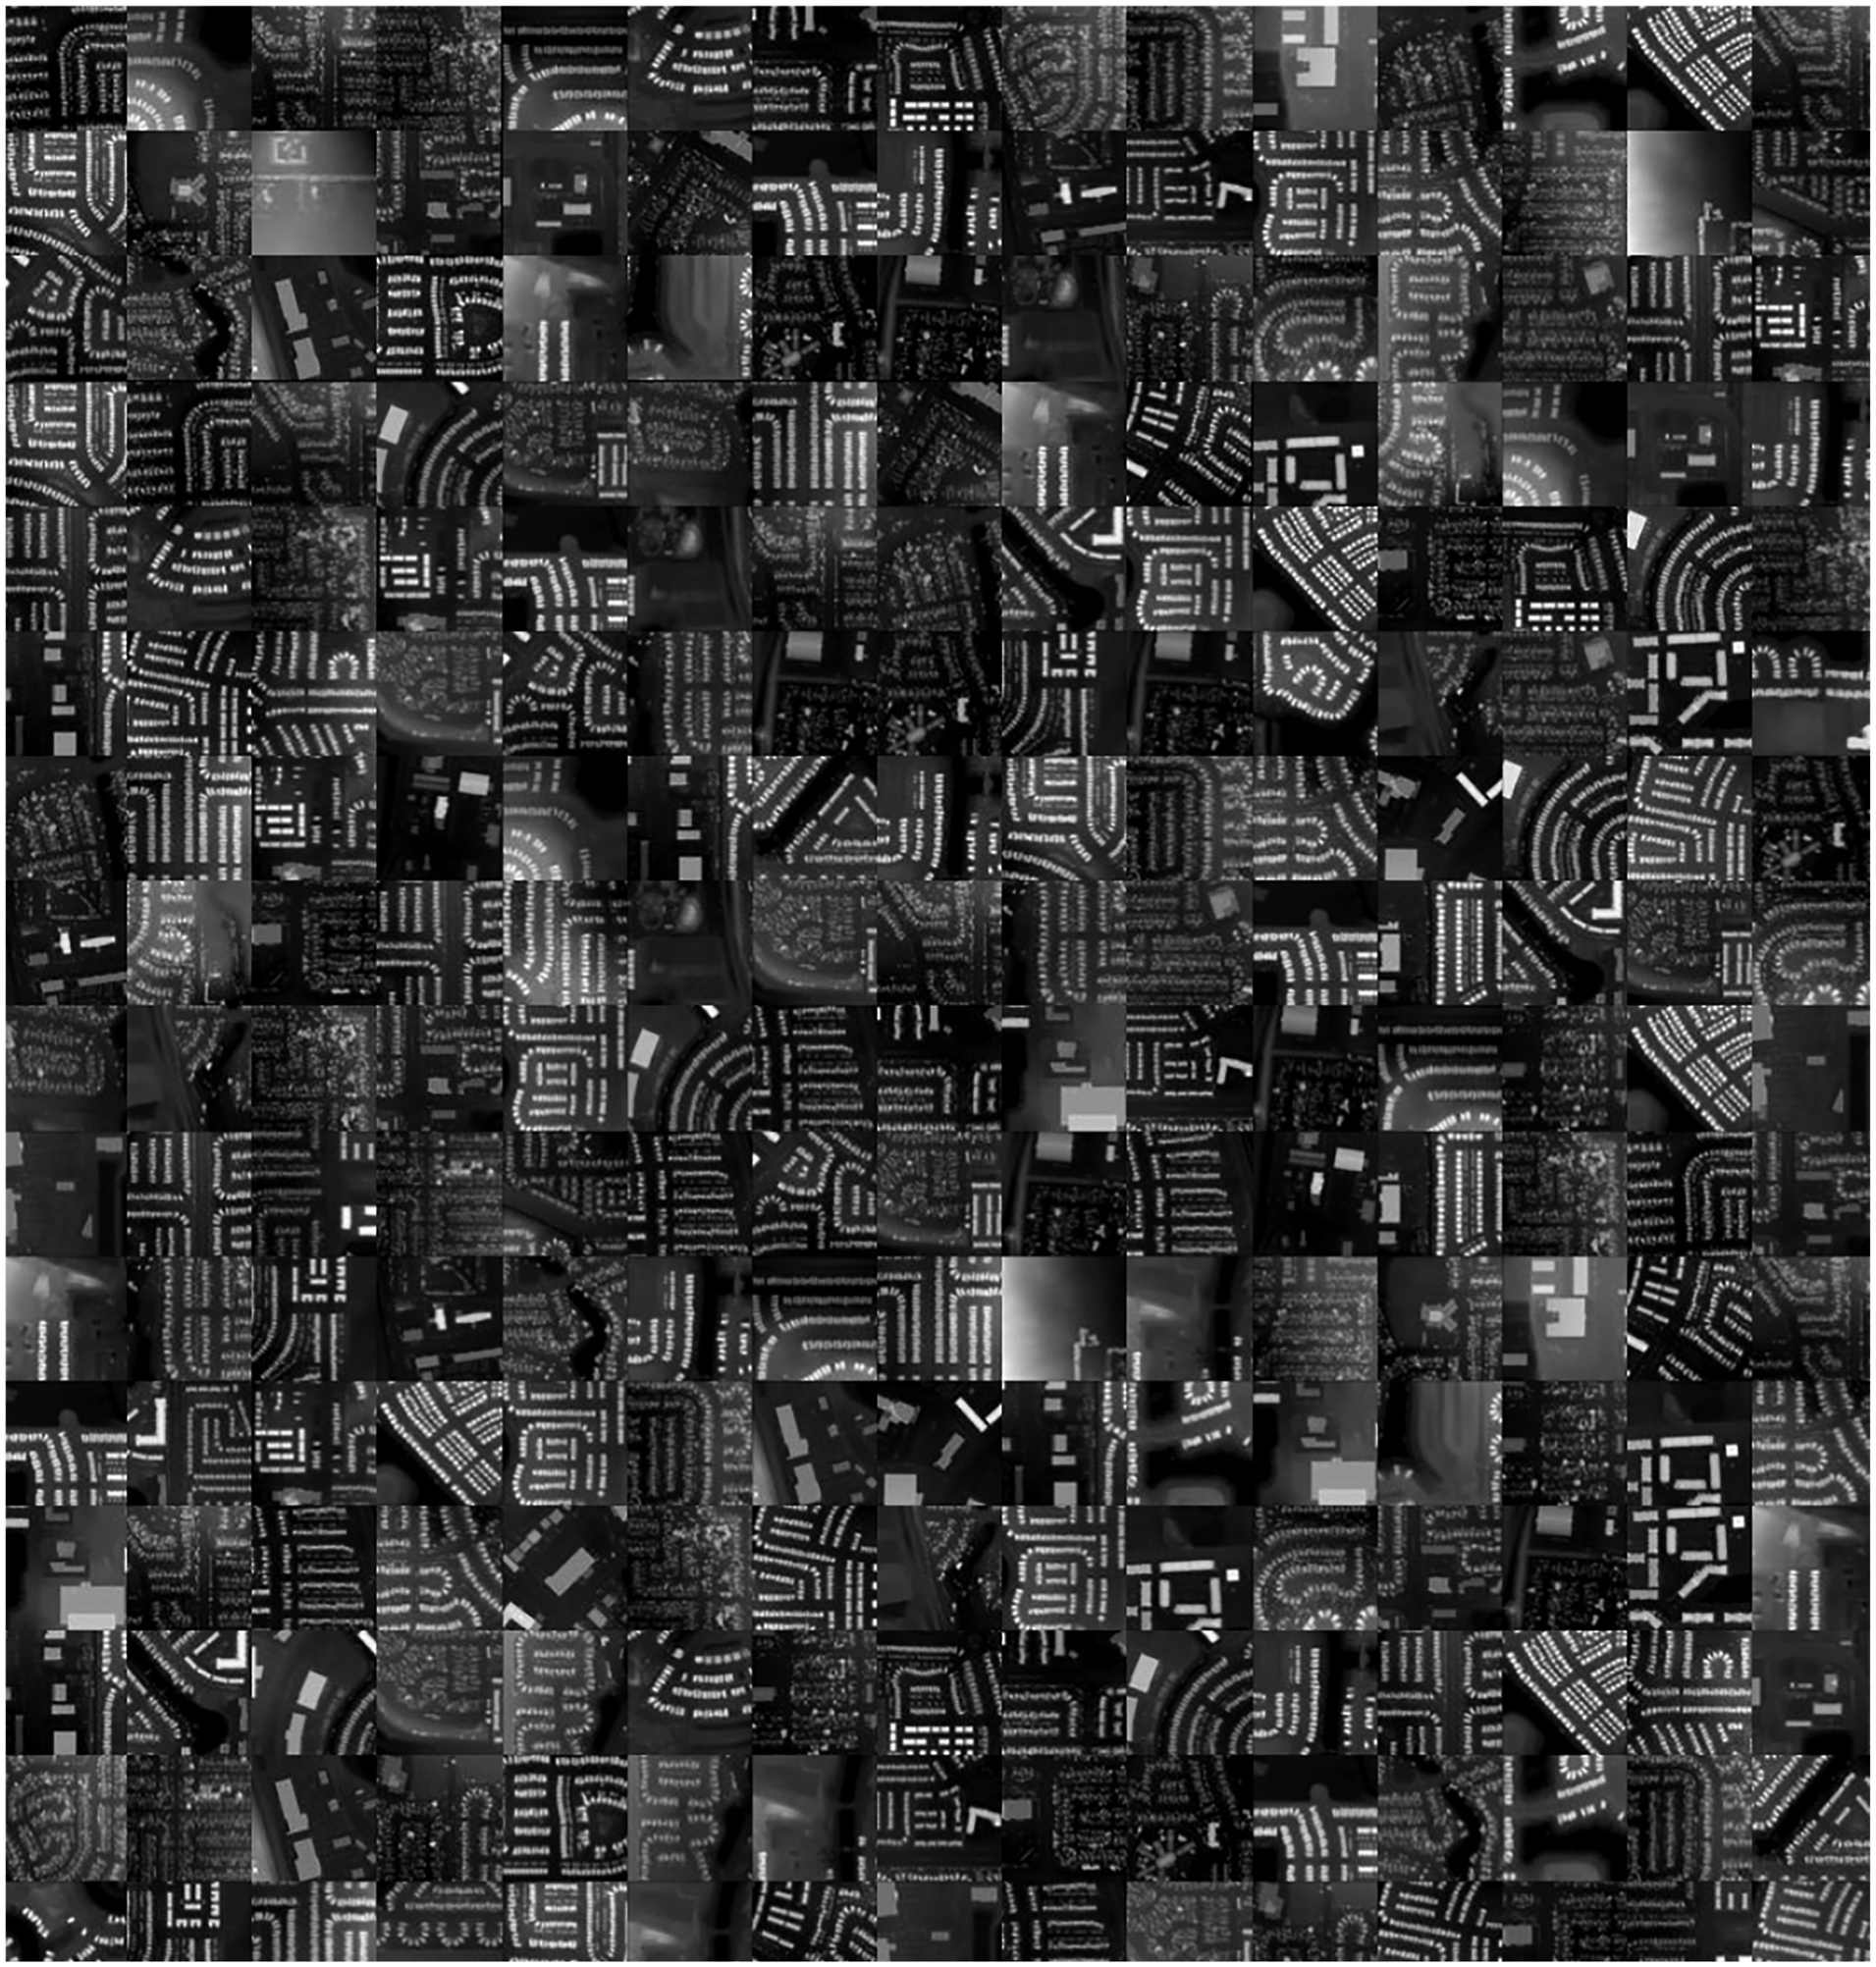
Training
Model architecture
To model the relationship between urban form and financial performance, we employed a discriminative deep learning framework based on convolutional neural networks (CNNs). CNNs have proven effective in extracting hierarchical spatial features from image-based data, making them particularly suitable for rasterized DSMs. Among various CNN backbones, we selected EfficientNet as the primary architecture due to its favorable trade-off between accuracy and computational efficiency. EfficientNet achieves this balance by employing compound scaling across depth, width, and resolution, offering high predictive power even under constrained computational resources.
In our application, each training instance was represented as a single-channel tensor, where the grayscale DSM image served as the input feature and the ROI value as the supervised label. To accommodate this structure, the first convolutional layer of EfficientNet, originally defined as

To mitigate overfitting given the relatively smaller dataset size compared to ImageNet-scale tasks, the classification head was redesigned. The final classification layer consisted of a dropout regularization layer, followed by a fully connected layer projecting to a single scalar output:
Training procedure
The dataset was partitioned into three subsets for the final training phase: 20,000 samples for training, 2796 samples for validation, and 2000 samples for testing. Data augmentation was employed to mitigate overfitting, including random rotations, translations, scaling, flipping, and contrast adjustments. Model training was performed using stochastic gradient descent with adaptive optimization. The AdamW optimizer was chosen for its balance of convergence speed and weight regularization, while cosine annealing with warm restarts was applied to modulate the learning rate, thereby promoting stable convergence.
Once the dataset and model architectures were prepared, we proceeded to train the models and evaluate their performance across various hyperparameter settings. The objective of this phase was to identify the most effective configuration for ROI prediction. We conducted experiments to evaluate the predictive performance of our model, in which DSM images were used as input features to predict ROI values. Several hyperparameter combinations were explored, including model variants (
We first examined the convergence behavior of the training and validation loss curves. Monitoring the trajectories of loss values across epochs enabled us to evaluate the stability of the optimization process, detect signs of overfitting, and ensure that the models reached meaningful minima. This analysis provided insight into the learning dynamics beyond the final predictive outcomes.
Building on this, model performance was quantitatively evaluated using the MAE computed on the standardized ROI values. For robustness, the MSE was also reported across the validation and test sets, offering complementary perspectives on predictive accuracy and error sensitivity. These evaluations allowed us to compare experimental configurations in terms of both convergence characteristics and final predictive accuracy.
Results
Convergence and performance
We begin our results by examining the convergence behavior of the models under different configurations. Evaluation is guided by three complementary loss functions where attention is paid not only to the absolute magnitude of the validation loss but equally to the relative gap between training and validation. This balance provides the clearest indication of whether models achieve stable generalization or drift into overfitting. Figure 4 and Table 2 present the comparative outcomes across architectures, dropout rates, and training modes. Training and validation loss curves for DSM-based ROI prediction across hyperparameter configurations. Results are shown for MSE (top), MAE (middle), and Huber loss (bottom), with solid lines indicating training loss and dashed lines indicating validation loss. Last-epoch training/validation losses and differences (val−trn), split by loss, model, dropout, and learning mode.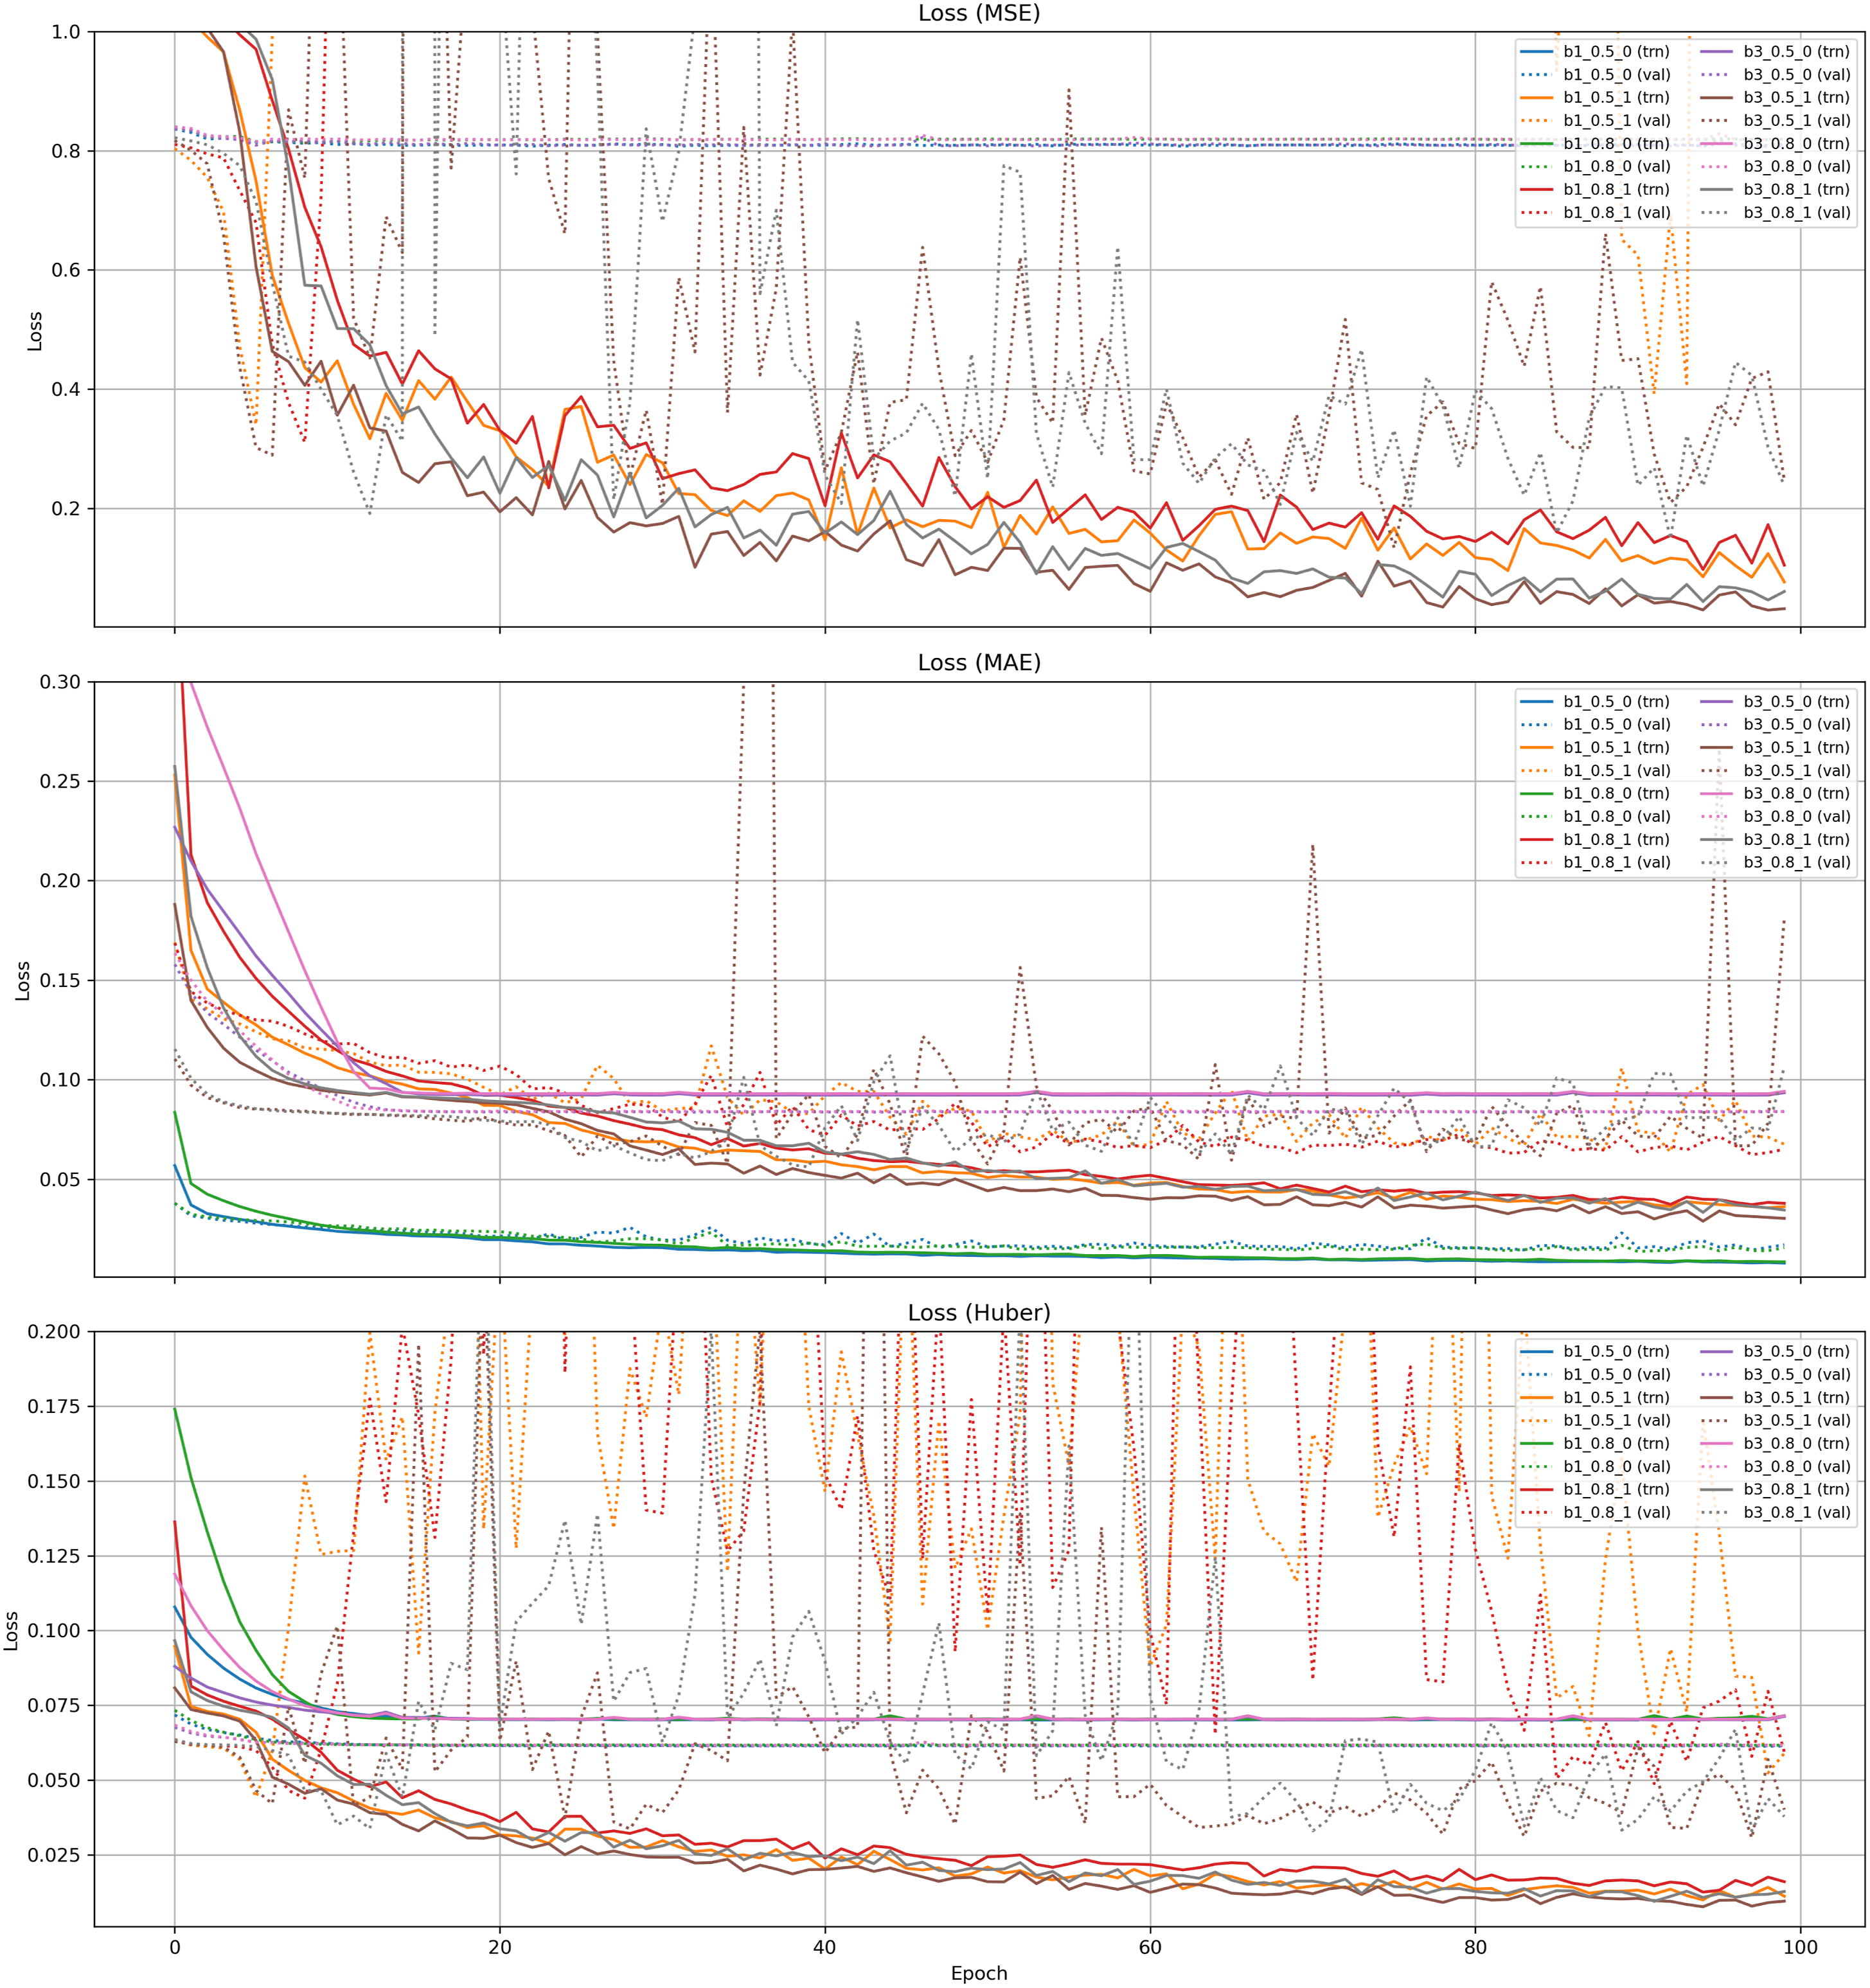
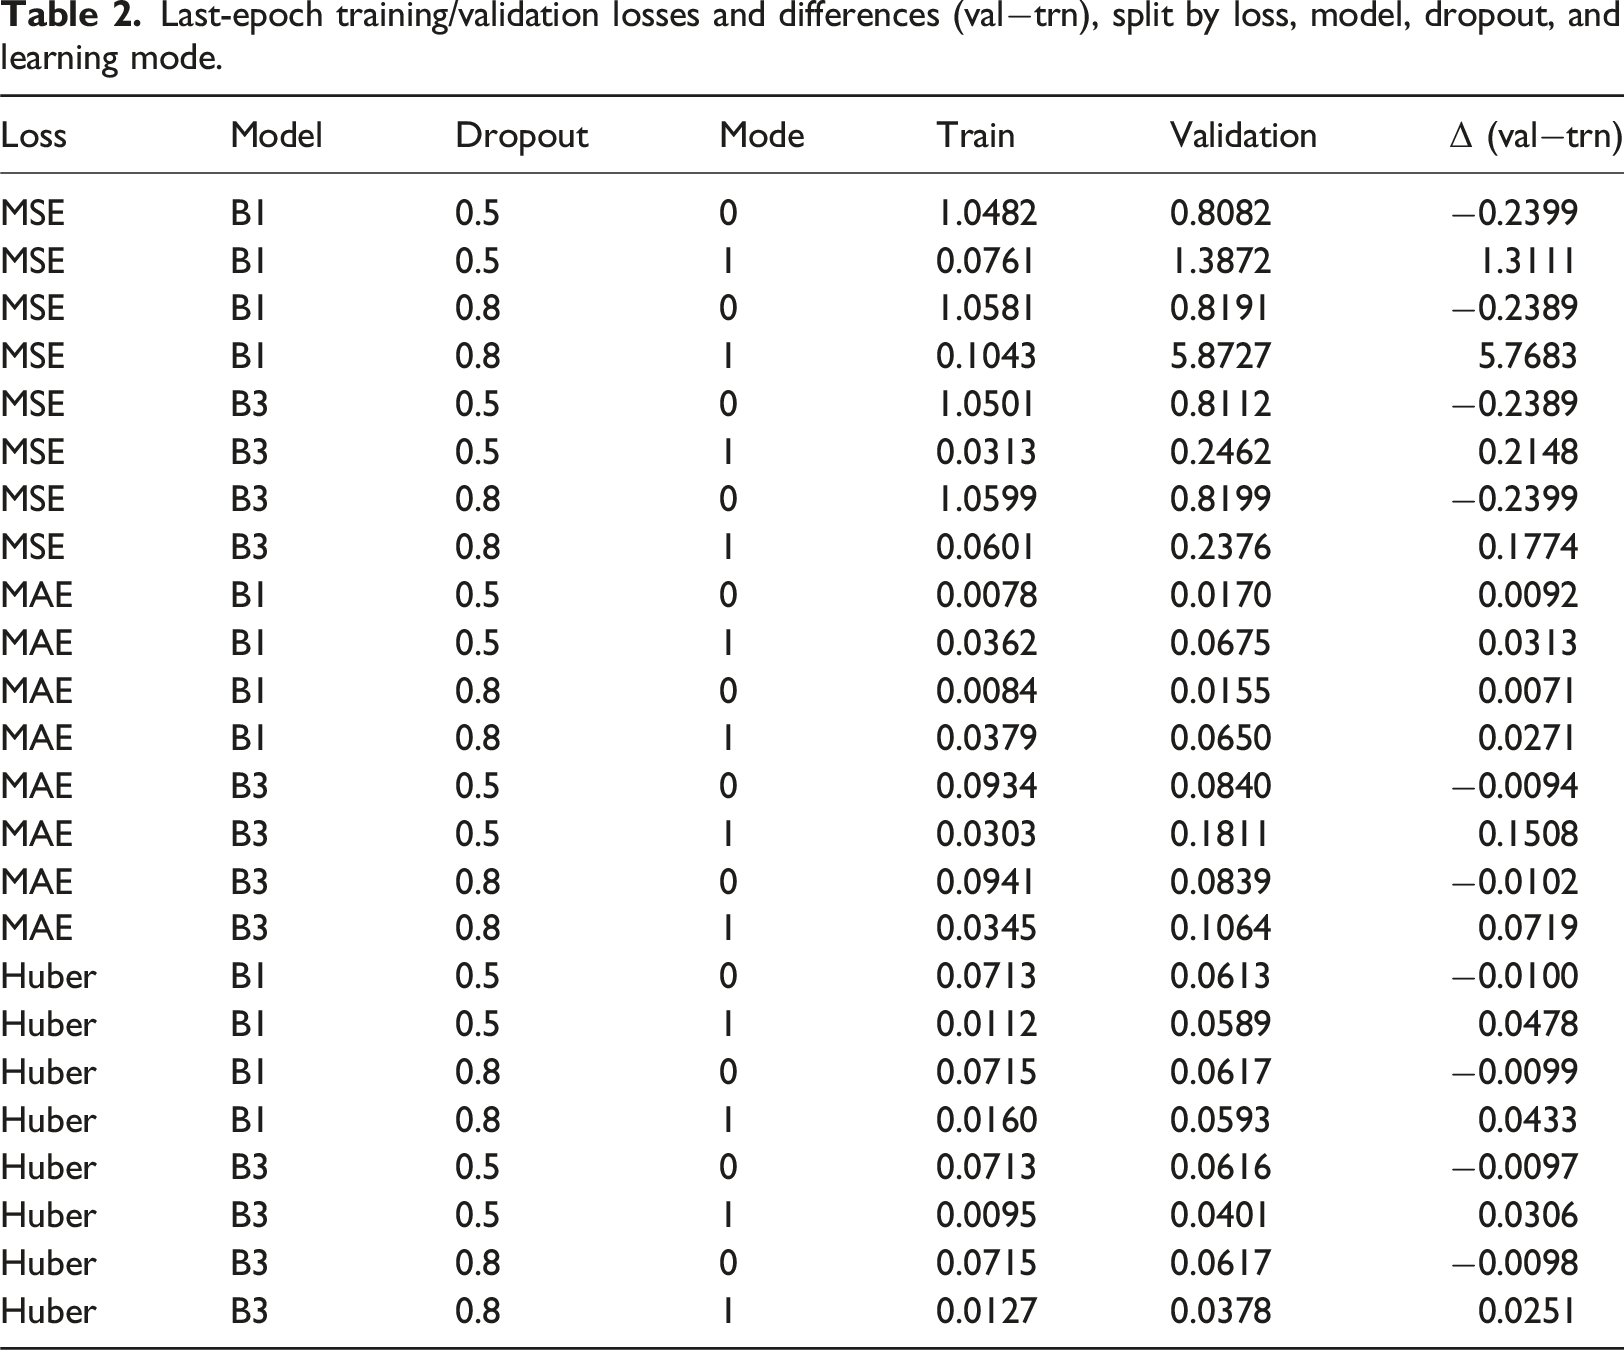
The trajectories of the learning curves are telling. Across all loss functions, training loss descends rapidly in the early epochs before stabilizing. Yet the validation curves tell two different stories: when mode is set to 0, they tend to follow the training curves in parallel, indicating stability and genuine convergence. By contrast, mode 1 runs, while initially promising, quickly reveal divergence: the validation curves lift away from the training trend, in some cases erratically, signaling overfitting. The consistency of these patterns across MSE, MAE, and Huber suggests that the issue lies not in the choice of loss but in the structural condition set by mode (Figure 4).
To make the mode effect explicit, we compute the generalization gap Δ (val−trn) at the last epoch (Table 2). Under MAE, EfficientNet B1 with mode 0 yields tiny gaps, Δ = 0.007−0.009 with validation losses 0.015−0.017, whereas mode 1 inflates the gap to 0.027−0.031. Huber shows the same pattern: mode 0 is essentially zero or slightly negative (Δ ≈ − 0.010), while mode 1 rises to 0.025−0.048. The contrast is most dramatic in MSE: for B1, mode 1 drives validation loss to 1.39 and 5.87 with Δ = 1.31 and 5.77 despite very small training losses. Even for B3, where absolute MSE values are lower under mode 1, the gaps remain large (Δ ≈ 0.18–0.25). These numbers confirm that instability is induced primarily by the training mode, not by the choice of loss (Figure 4, Table2).
Among the three loss functions, MAE consistently exhibited smoother convergence and lower validation errors (Figure 4). This relative stability can be attributed to the statistical properties of the task: while MSE penalizes large deviations quadratically and thus overreacts to extreme values, MAE imposes only linear penalties, making it more robust to the heavy-tailed and skewed distribution of ROI values. In practical terms, this meant that models trained with MAE were less distracted by outliers and instead generalized more reliably across the bulk of samples. Huber loss, designed as a compromise between the two, achieved intermediate behavior but did not match the robustness of MAE under these conditions.
The EfficientNet B3 configurations, although methodically trained, consistently fall short in generalization. Validation errors remain higher than those of EfficientNet B1, particularly evident in MAE where the difference is multiple fold. The MSE losses for EfficientNet B3 hover with negative train–validation gaps, hinting at a persistent underfitting tendency. Even in Huber, where the validation values are somewhat reasonable, the train–validation deltas remain significant enough to undermine reliability. In short, the EfficientNet B3 models appear ill-suited for this problem space: their capacity or architecture, while not without merit, cannot achieve the same balance of accuracy and stability as EfficientNet B1 (Table 2).
Model capacity interacts unfavorably with this dataset. With mode 0 and MAE, B3 converges to validation losses around 0.084 (dropout 0.5−0.8), roughly 5× higher than B1’s 0.015−0.017, and does so with negative gaps (Δ ≈ −0.009 to −0.010), indicative of underfitting or over-regularization. A similar but milder picture appears under Huber: B3 attains 0.062−0.066 versus B1’s 0.061−0.062, again with slightly negative gaps. Together with the flatter late-epoch slopes in Figure 4, this suggests that B3’s extra capacity (combined with strong dropout) does not translate into better generalization given the sample complexity and label noise of ROI.
When we turn to mode 1 experiments—especially those with EfficientNet B1 at higher dropout—the specter of overfitting is unmistakable. Training losses fall to impressively low levels, yet validation losses inflate, sometimes catastrophically so. For example, MSE validation error soars above 5, with a delta exceeding 5.7, despite training losses remaining vanishingly small (Table 2). This is not a case of marginal overfitting but a collapse of generalization. Even in MAE and Huber, where the magnitude is less dramatic, the gap remains substantial. These results are a cautionary note: structural choices in the training regime can undo otherwise strong architectures (Table 2).
Regularization helps within mode 0 but cannot rescue mode 1. For the B1 and MAE combination, raising the dropout rate from 0.5 to 0.8 under mode 0 marginally improves validation (from 0.0170 to 0.0155) while keeping the gaps small (from 0.0092 to 0.0071). Under mode 1, however, the same adjustment cannot prevent overfitting, as the MAE only decreases from 0.0675 to 0.0650 while the gaps remain substantial, declining only from 0.0313 to 0.0271. Huber follows the same trend. Thus, dropout fine-tunes stability only when the structural condition (mode 0) is satisfied.
In contrast, the most reliable outcomes emerge from EfficientNet B1 with mode 0, whether dropout is 0.5 or 0.8. Here validation losses are small, absolute deltas are negligible, and the curves chart a steady and balanced descent. MAE validation errors are as low as 0.015−0.017 with deltas under 0.01, Huber shows similar tight behavior, and even MSE maintains stable, parallel trajectories (Figure 4). These are models that converge not only mathematically but in spirit: they demonstrate the discipline of learning without overextension, and the grace of balance between fitting the known and preparing for the unknown.
In synthesis, these findings speak to a broader methodological principle. Stability and generalization are not achieved merely by minimizing error on the training set, nor by inflating architectural complexity. They emerge from careful alignment of architecture and training mode, and loss function. The lesson is that EfficientNet B1, in its disciplined simplicity, paired with mode 0’s restraint and MAE’s robustness to outliers, produces models that are both accurate and robust. Going forward, the path is clear: refine within the EfficientNet B1 + mode 0 + MAE framework, tune dropout modestly, and allow the model’s balance to speak for itself.
Qualitative predictions
The qualitative samples (Figure 5) reveal that the model captures distinct urban forms with a fair degree of accuracy across functional categories. These results were obtained using the best-performing configuration—EfficientNet-B3 with dropout 0.5 with MAE loss, trained directly on ROI prediction—and illustrate the model’s ability to generalize across commercial, industrial, and residential contexts. Qualitative results for DSM-based ROI prediction across representative urban types. Each row shows the input DSM form, the ground truth ROI, the predicted ROI, and the error (Predicted – Ground Truth). Samples span commercial (top), industrial (middle), and residential (bottom) contexts. ROI values denominated in CAD.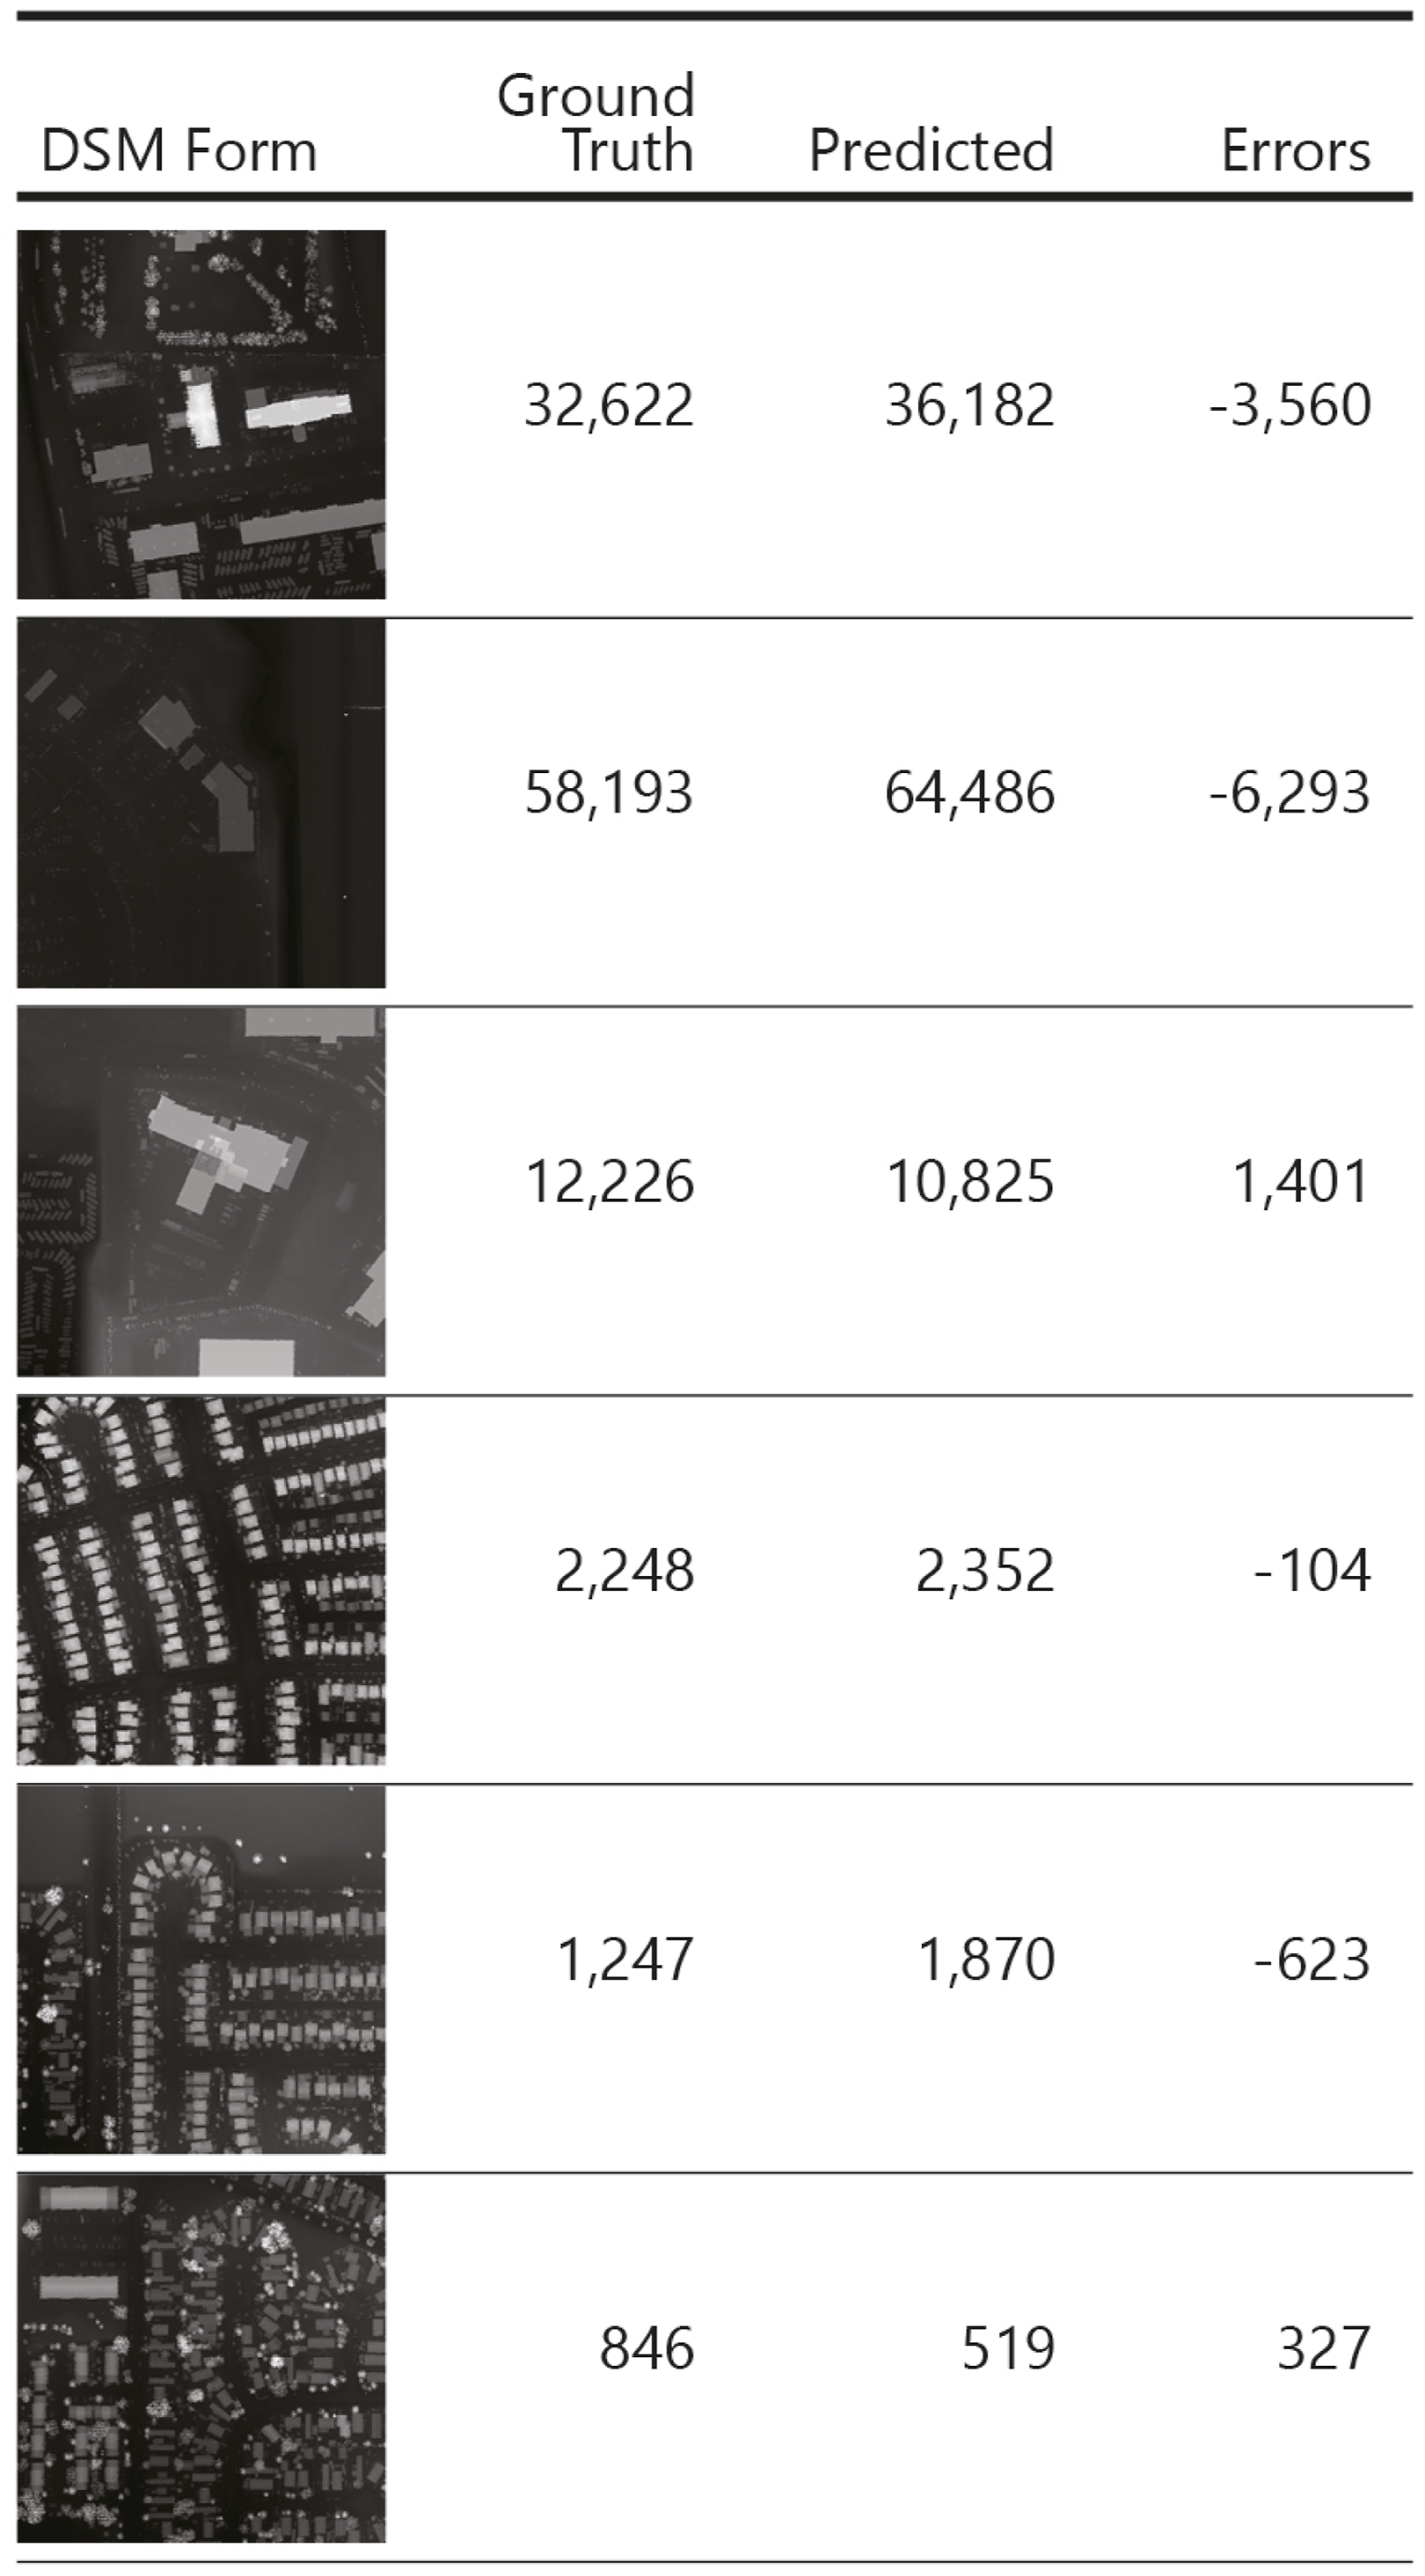
In commercial areas (first two rows), the predicted ROI values are consistently higher than the ground truth, leading to negative error terms. This pattern suggests that the model tends to slightly overestimate the scale or density of built-up mass in dense commercial cores. The effect is systematic but bounded, remaining within a range that preserves the overall morphological correspondence.
By contrast, the industrial case (third row) and residential neighborhoods (last three rows) show a more balanced behavior. The industrial sample exhibits a modest positive error, indicating mild underestimation, while residential forms span both slight overestimation and underestimation depending on the configuration. Importantly, the absolute errors in residential contexts are relatively small compared to the commercial cases, which reflects the model’s capacity to generalize well over repetitive and homogeneous housing morphologies. These results demonstrate that the network does not collapse into uniform bias but adapts differently to varying urban typologies, with higher reliability in residential and industrial contexts.
It should also be noted that raw ROI values span several orders of magnitude, with extremes exceeding millions of dollars. In this light, and given that the outputs here are expressed in normalized form, the observed deviations represent a comparatively modest error. Put differently, what might appear as visible discrepancies in the qualitative plots translate, in the financial domain, to errors that remain well within a tolerable range for parcel-level prediction.
Embedding structure
These qualitative observations point to a consistent pattern: the model responds differently to distinct morphological conditions—dense commercial cores, large-footprint industrial parcels, and repetitive residential fabrics—and its errors vary systematically with these form types. To examine whether these behaviors arise from coherent structural signals learned by the network, and not merely from local appearance, we project the model’s penultimate-layer features into a two-dimensional space using UMAP—a dimensionality reduction technique. This embedding allows us to inspect directly how the representation organizes parcels according to their underlying morphological characteristics and how these learned structures relate to both ROI and land-use categories (Figure 6). Visualization of morphological feature embeddings colored by ROI quantiles (left) and land-use class (right).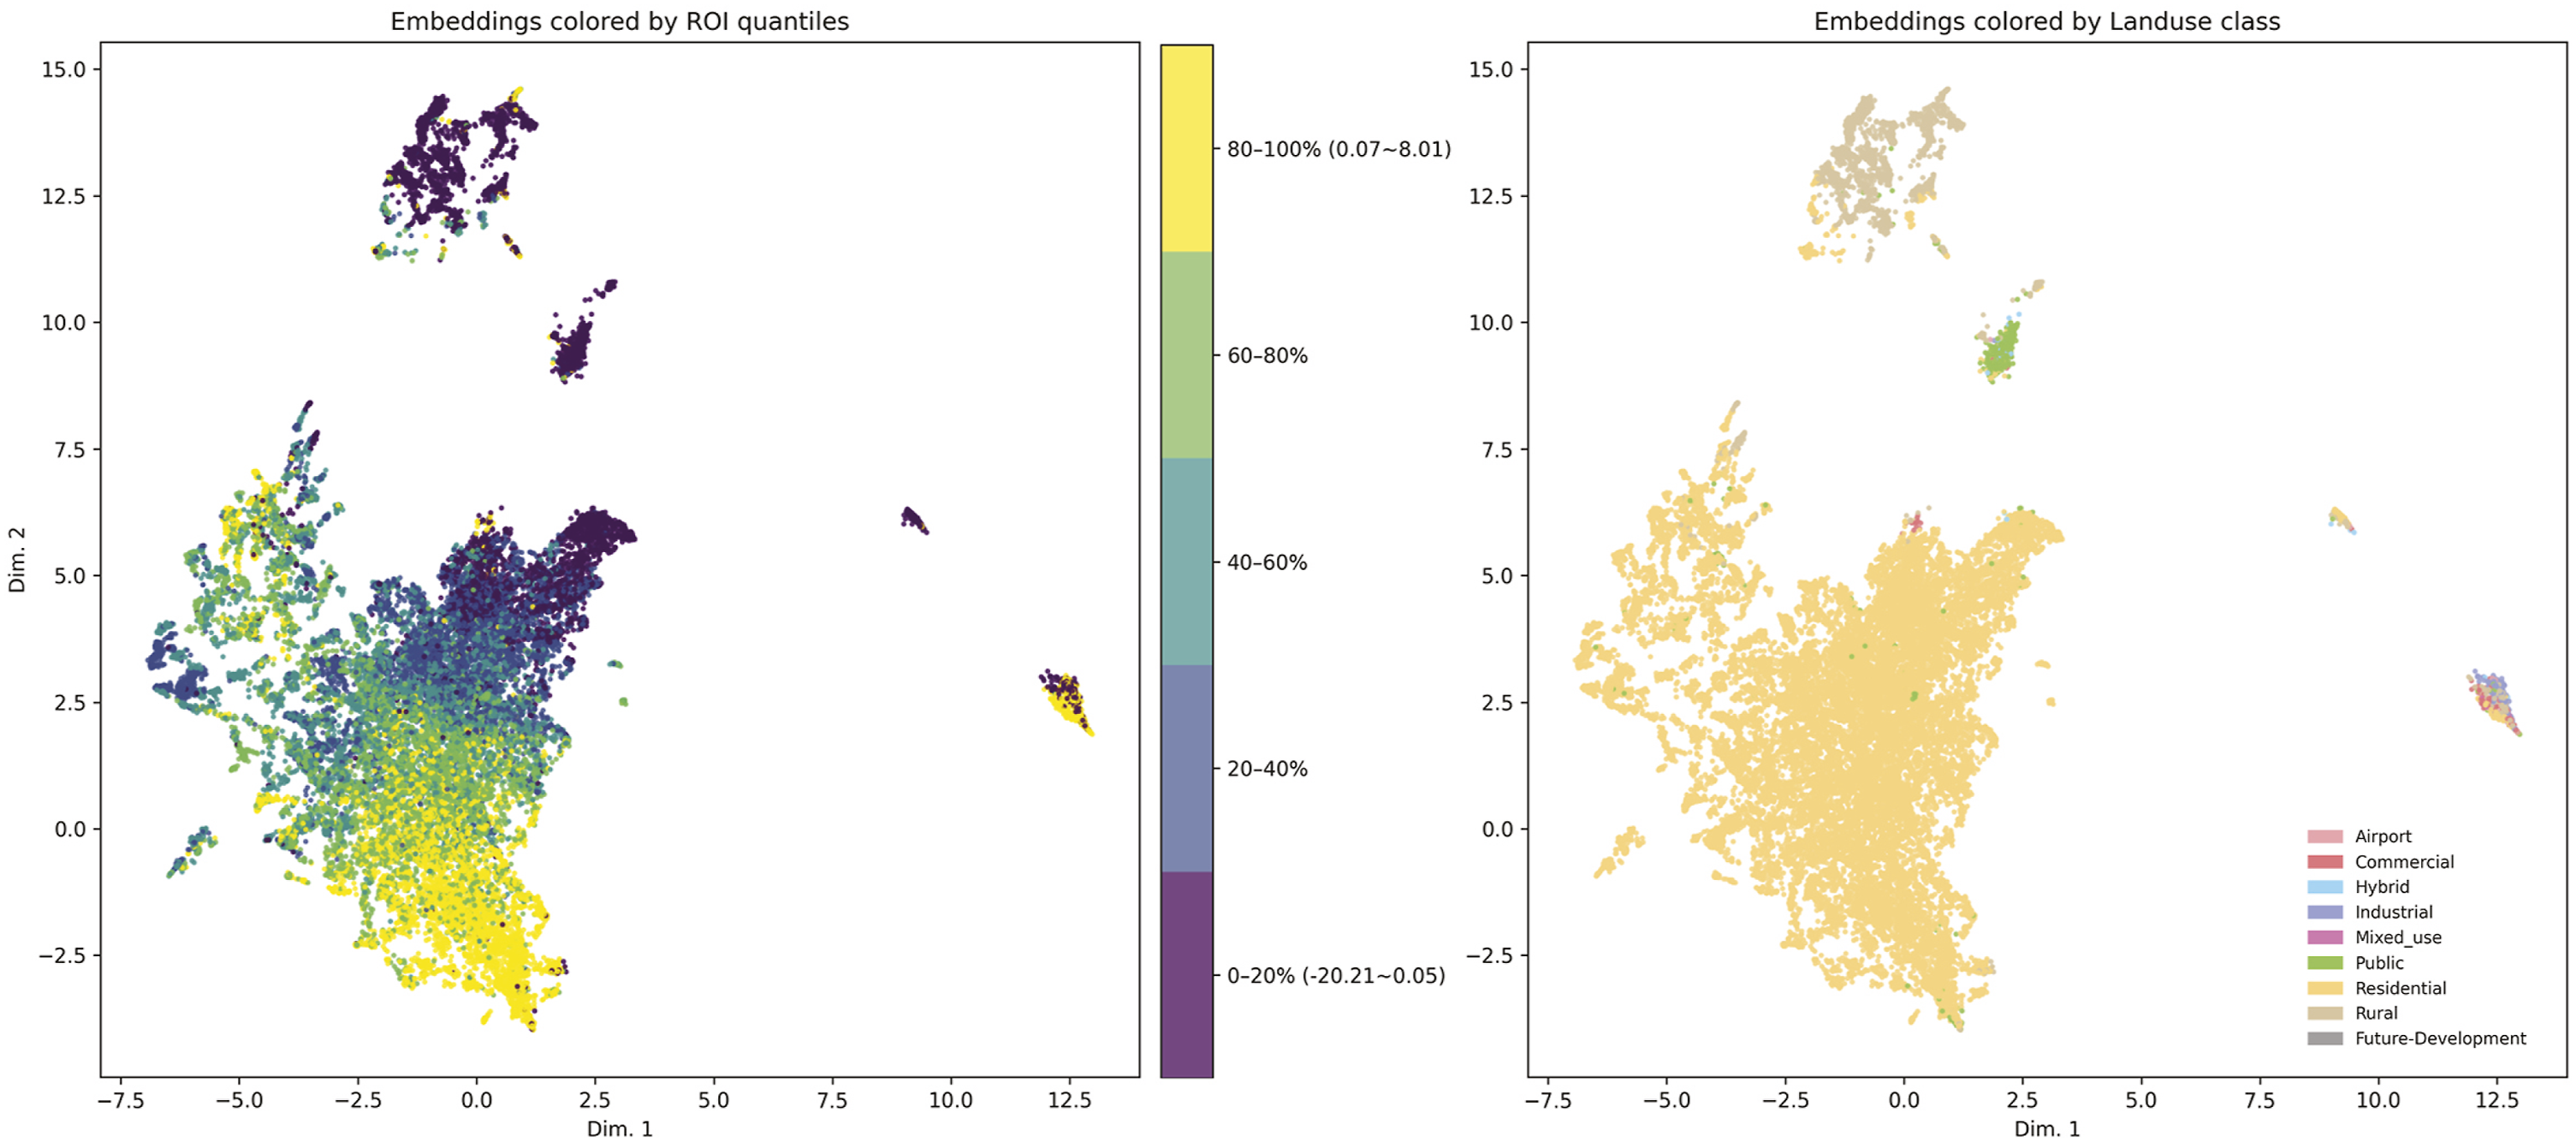
First, the ROI-colored embedding displays a clear gradient structure: parcels with low-ROI values cluster toward the upper region of the embedding, whereas high-ROI parcels concentrate toward the lower band. This organization is continuous rather than categorical, suggesting that the model learns a spectrum of form conditions associated with differing economic returns. Because ROI values were never spatially smoothed or neighborhood-averaged, this gradient indicates that the model detects morphological signatures that covary with ROI—such as the density, height variation, or massing arrangement of parcels and their immediate surroundings.
Second, when the same embeddings are colored by land-use class, a distinct pattern emerges. Nearly the entire central cloud corresponds to residential parcels, forming a dense and coherent manifold. Industrial, commercial, hybrid, and airport parcels form separate branches or islands, often at the periphery of the residential mass. These separations align with known morphological distinctions: industrial parcels tend to exhibit large footprints and low height variation; commercial parcels feature larger massing intensity and deeper setbacks; airport lands form a distinct volumetric pattern due to vast open surfaces and highly regular built forms. The fact that these land-use categories separate without supervision illustrates that the embedding captures systematic differences in building volume, coverage, footprint geometry, and block-level configuration.
Third, the structure of the embedding shows that the model is not simply re-encoding land-use: residential parcels span the full ROI gradient rather than forming homogenous clusters. High-ROI and low-ROI residential parcels occupy different regions of the residential manifold, implying that within-type morphological variation—lot depth, frontage alignment, and local height structure—contributes to ROI prediction. In other words, the representation captures finer-grained spatial variations within a single land-use class that correspond to economic outcomes.
The embeddings reveal that the learned representation organizes parcels according to underlying morphological structure: broad patterns of massing, block organization, footprint geometry, and parcel configuration. The association between this structure and ROI gradients suggests that the model leverages these form characteristics to infer economic performance, capturing signals that are not visible through aggregated scalar metrics or imagery-based proxies alone.
Conclusion
This study builds upon recent advances showing that deep learning models can extract meaningful morphological features from urban form. While these developments have enriched the descriptive and comparative analysis of urban morphology, they have left open an important question: whether the same representational strategies might also support inquiries into how spatial structure relates to broader social, cultural, or economic conditions. In this work, we extend this line of research by adapting a parcel-centered representation of urban form—originally devised for morphological analysis—to examine its capacity to predict and structure the signals associated with socioeconomic indices.
To explore how this representational strategy behaves when applied to socioeconomic inference, we implemented a discriminative deep learning approach using DSM-based inputs and tested its ability to predict parcel-level ROI. Experiments with tailored EfficientNet architectures demonstrated stable convergence and consistent predictive accuracy across diverse urban contexts. Quantitative metrics, qualitative samples, and embedding analysis confirmed that the model generalized reliably, capturing systematic differences between commercial, industrial, and residential morphologies while maintaining errors within tolerable financial thresholds.
Beyond predictive performance, the learned embeddings revealed systematic morphological signatures associated with different levels of ROI. Parcels with lower ROI tended to occupy regions of the embedding characterized by larger footprints, low height variation, expansive surface coverage, and coarse-grained block structures—patterns commonly found in industrial or low-density commercial fabrics. By contrast, parcels with higher ROI clustered in regions associated with finer-grained residential morphologies: smaller footprints, more regular frontage alignment, moderate height variation, and tighter parcel–street configurations. Importantly, these form-based gradients emerged independently of land-use labels but later aligned with them, indicating that the representation captures intrinsic morphological conditions that correspond to economic performance rather than simply reproducing zoning categories.
These findings establish the feasibility of linking urban form data to financial performance, thereby advancing the scope of computational urban morphology beyond descriptive analysis.
This study extends an emerging line of research demonstrating that deep learning models can extract rich morphological features from urban form. Whereas prior work has primarily focused on using these representations for descriptive, classificatory, or comparative analyses, our findings show that the same representational logic can also illuminate how spatial structure aligns with socioeconomic performance measures. By applying a parcel-centered DSM-based representation to the task of predicting ROI, we demonstrate that form embeddings learned for prediction encode a continuous gradient of morphological conditions corresponding to differing economic outcomes.
Rather than replacing classical or metric-based approaches to urban morphology, this work expands the analytical space in which form can be studied—allowing the built environment to be examined not only for what it is, but also for what it implies in relation to urban performance. The learned parcel representations encode many attributes central to morphological constructs—footprint geometry, frontage alignment, height structure, and parcel–street configuration—but express them in a high-dimensional form that preserves their relational complexity. Thereby, the approach complements existing morphological frameworks while providing new avenues for understanding how variations in urban form correspond to systematic differences in socioeconomic conditions. The prototype in (Figure 7) shows how these representations are operationalized in a parcel-level prediction workflow. Prototype interface demonstrating parcel-level ROI prediction directly from urban form.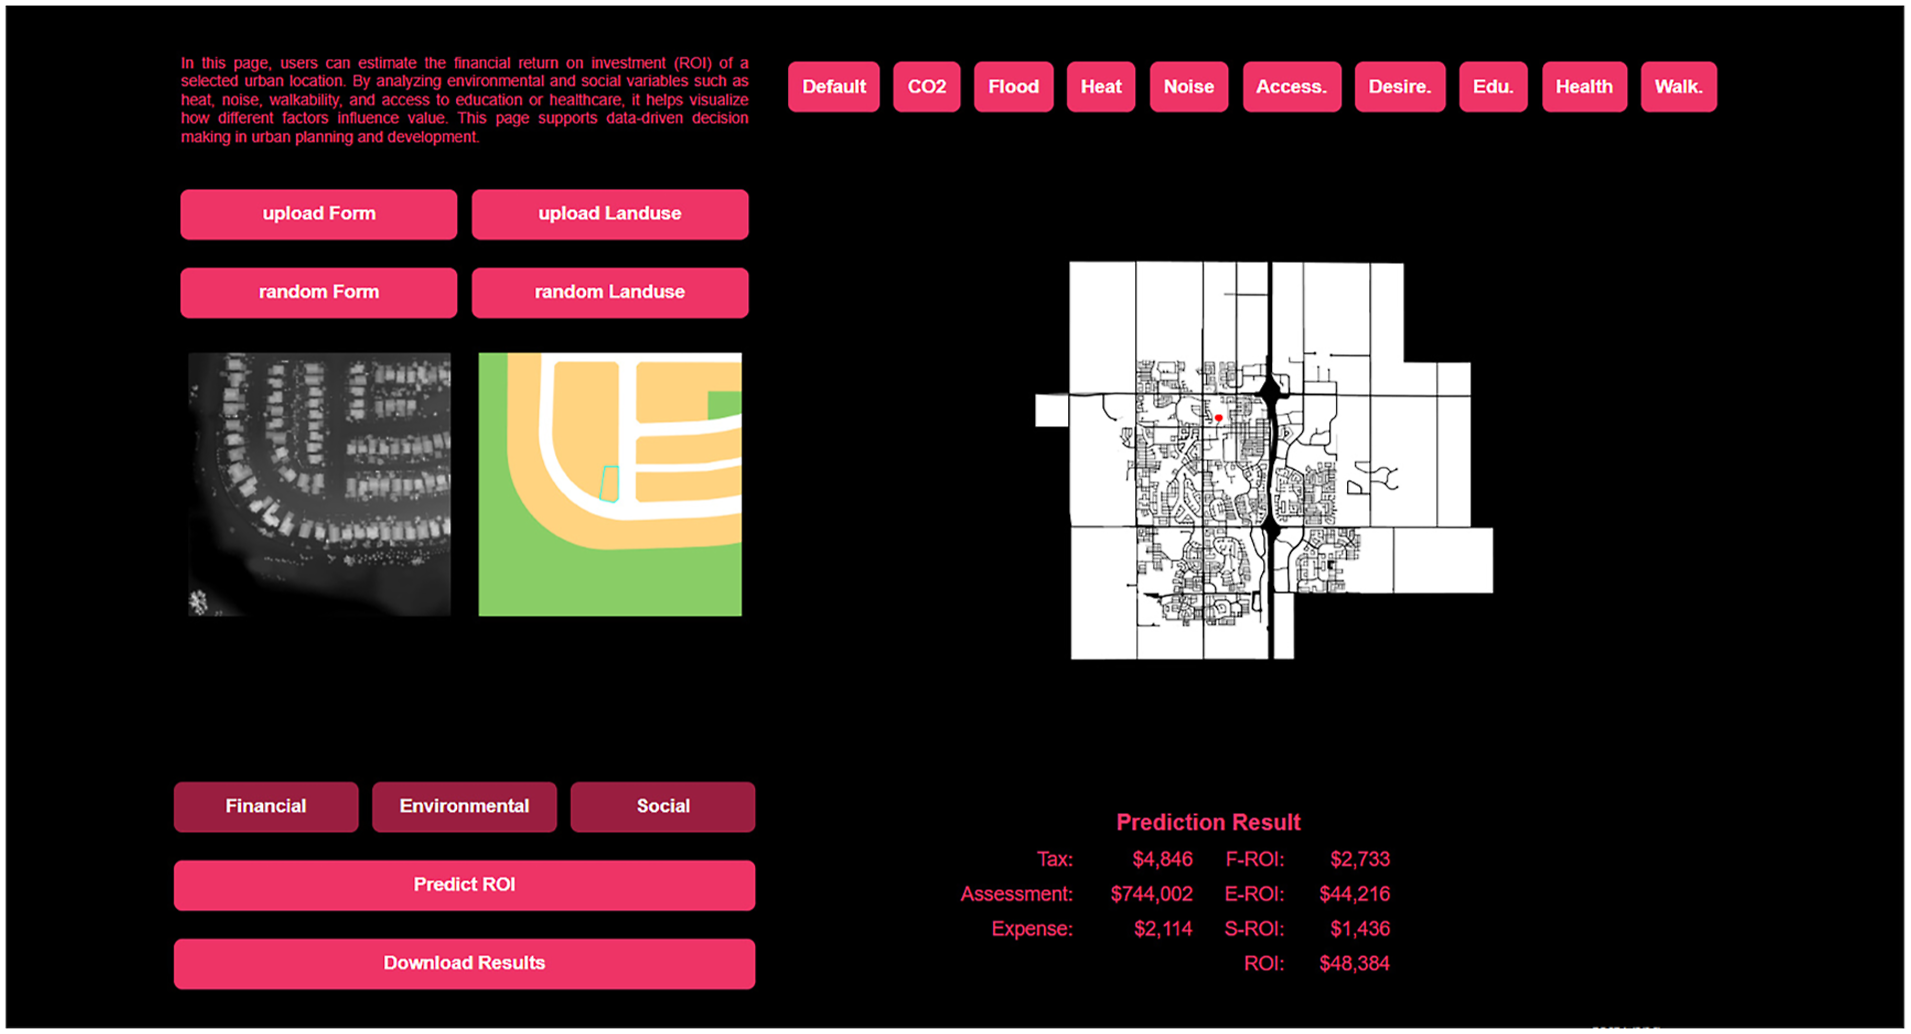
The ability to relate parcel-scale morphological structure to ROI carries several practical implications for urban planning and development practice. Morphological gradients identified in the embeddings could support redevelopment prioritization by highlighting underperforming parcels within otherwise similar fabrics; inform zoning reform by revealing which spatial configurations tend to underperform or outperform economically; and assist municipalities in evaluating the financial implications of growth patterns, particularly in quickly expanding regions. More broadly, the approach suggests that data-driven urban form representations may help planners reason about how built-form configurations shape not only spatial experience but also financial outcomes. For example, the trained model can be operationalized in permitting or planning workflows by allowing staff to input a proposed parcel configuration and obtain an estimated ROI, providing an early indication of the financial consequences of alternative development forms before approvals or investments are made.
Future work can extend this framework in several directions. Applying the method to additional performance indicators—such as equity, accessibility, environmental exposure, or housing affordability—would broaden the interpretive scope of form–performance linkages. Cross-city validation would clarify the generality of these patterns, while integrating the representations into generative or scenario-testing models could enable the exploration of alternative spatial configurations under different policy constraints. In this way, the study points toward an expanded role for computational urban morphology: one that maintains its descriptive strengths while engaging more directly with the evaluative, projective, and decision-oriented dimensions of planning and design.
Footnotes
Acknowledgment
The authors gratefully acknowledge the City of Airdrie for providing access to municipal data and the Alberta Real Estate Foundation (AREF) for financial support that enabled this research. We also thank the DESTECTIC (Laboratory for Design, Technology, and Tactics) and the CFC (Center for Civilization) for their research support and collaborative environment throughout the project.
Funding
The authors received no financial support for the research, authorship, and/or publication of this article.
Declaration of conflicting interests
The authors declared no potential conflicts of interest with respect to the research, authorship, and/or publication of this article.
Data Availability Statement
The data generated and analyzed during this study are not publicly available due to confidentiality constraints, but access may be considered by the authors upon reasonable request.