
Abstract
The rapid digitization and publication of local government records presents researchers with an unprecedented chance to study governance processes. In tandem, advances in computer science and statistics—alongside significant increases in computational power—have led to the development of “text-as-data” methods and their application to social science and policy research. This paper evaluates the potential utility of digitized public meeting minutes and video recordings for studying decision-making about technology adoption by local public agencies, using survey data on the same topic as a benchmark. Focusing on transit agencies in California, we evaluate surveys and digitized meeting records with respect to overall data availability, bias in data availability, and the types of information about technology adoption contained. We find that meeting minutes and video recordings are available for more than twice as many agencies than for a state transit agency-sponsored survey, and that the availability of digitized records is not skewed toward larger agencies, as is the case for survey data. Meanwhile, we find important complementarities with respect to the type of information available about technology adoption in these three data sources.
Introduction
Prompted by the COVID-19 pandemic, government agencies worldwide have fast-tracked their digitization initiatives, making official public records like meeting minutes and video recordings more widely accessible on the internet. Local governments have led in this trend, which gained momentum prior to the pandemic (Barari and Simko, 2023). This greater accessibility of public records not only allows citizens and non-governmental organizations to monitor government more effectively but also presents researchers with an unprecedented chance to study governance processes. Traditionally, understanding the decision-making processes within institutions relied on interviews, case studies, and surveys. Now, the increasing accessibility of government documents offers the opportunity to obtain data that complements traditional sources.
In tandem, advances in computer science and statistics—alongside significant increases in computational power—have led to the development of “text-as-data” methods and their application to social science and policy research. Responding to the exponentially increasing number of digitized texts online, researchers across a variety of fields have begun to analyze large corpuses of text to study phenomena that were typically analyzed using other types of large data sets (such as surveys or administration data) or qualitative methods. Studies cover topics such as government decision-making (Catalinac, 2016; Kinra et al., 2020), mobilization by civil society groups (Bail, 2012), and the evolution and use of concepts like “ghetto” (Jones, 2018). Within urban studies, Kinra et al. (2020) employ topic modeling, document classification, and sentiment analysis with newspaper articles and tweets to explore public opinion on driverless cars in Denmark. Brinkley and Wagner (2024) create a framework for quantitative text analysis drawing upon 461 California city general plans to assess environmental justice (EJ) integration. These diverse examples underscore the transformative potential of text-as-data analysis, potentially offering new insights and complementing traditional research methods.
While interest in analyzing Big Data has grown, scholars offer voices of caution. For example, these new types of data may not be representative of underlying populations, and extracting the information desired may be difficult given that data were typically collected or generated for non-research purposes. In this paper, we address these concerns by examining the utility of a particular type of Big Data, digitized public meeting minutes and meeting recordings. We examine its usefulness for studying decision-making by local public agencies, using survey data on the same topic as a benchmark. Our analysis focuses on decision-making regarding technology adoption by California transit agencies, which speaks to debates regarding the circumstances under which agencies innovate (Araral, 2020; Damanpour and Schneider, 2006; Feller and Menzel, 1978; Pyo, 2022; Rogers, 2014; Tavares & da Cruz, 2020; Volden, 2006).
Our analysis focuses on two concerns highlighted by the literature on Big Data but which have not received detailed and systematic treatment for digitized local meeting records: (1) data availability and bias in terms of the agencies for which data is accessible; and (2) the types of information contained in the data source, which affects the sorts of inferences that can be drawn. In the first empirical section, we examine the availability of digitized meeting records for transit agencies in California. We compare rates of publication and bias in terms of who is posting meeting minutes and recordings to an original 2022 survey administered by the study authors and the state transportation agency with these same transit agencies (Post and Ratan, 2022). In the second empirical section, we compare respective insights from each of the three types of data on the adoption of transit signal priority systems for a case where all three types of data are available, the Santa Clara Valley Transportation Authority.
Overall, we find that meeting minutes and recordings are available for more than twice as many agencies than for the state transit agency-sponsored survey. Meanwhile, while survey responses are biased toward larger agencies and special district governments, meeting minutes and recordings are posted by both small and large agencies. In other words, while influential publications have cautioned that new data sources may not be representative, and while researchers commonly turn to surveys for representative samples, we find that digitized meeting records are available for a more representative set of public agencies than survey data. Meanwhile, we find important complementarities in the types and quality of information available about technology adoption in these three data sources. Surveys allow for the collection of comparable information across agencies, including internal decision-making processes. Meeting minutes and transcriptions, on the other hand, include more granular information about public debate and efforts to obtain support from other institutions for technology adoption. These minutes and transcriptions constitute ready material for qualitative analysis and can inform survey design and text-as-data approaches.
Study rationale and research design
The increasing availability of “Big Data,” or massive datasets created in real time, has elicited enthusiasm across a wide variety of fields, especially with the growing popularity of “text-as-data” methods. 1 These methods encompass various techniques capable of extracting insights from textual data. One common approach to text analysis methods is to classify texts into categories. Sentiment analysis—or coding documents according to whether they contain words or expressions in a dictionary of terms that captures different moods—is a prime example of this approach. Alternatively, analysis can sort a subset of an entire text dataset into categories, and utilize “supervised learning methods” to sort the remaining documents (Hollibaugh, 2019). Meanwhile, “unsupervised models” like Latent Dirichlet Allocation (LDA) can be used to uncover the mixture of topics covered in each document (Hollibaugh, 2019).
Scholars describing the utility of these new data sources and analysis techniques, however, have also highlighted important challenges and limitations, including data quality, ethics, and interpretability (e.g., Grimmer et al., 2022; Kitchin, 2015; Kobayashi et al., 2018; Tonidandel et al., 2018). One key area of concern is the representativeness or “exhaustiveness” of new data sources. It is easy to assume that larger quantities of data are more representative, but that is not necessarily the case (Kitchin, 2015: 475–6; Kitchin and McArdle, 2016: 3; Tonidandel et al., 2018: 537). Another key question is the extent to which data generated for one purpose can be re-used for different analytic purposes (Kitchin, 2015).
We bring these concerns to a particular type of “Big Data”: the meeting minutes and recordings made available by thousands of local public agencies. The increasing availability of these local public records represents an important new resource for scholars of urban planning, local government decision-making, and related fields. These records can potentially serve as more easily accessible archival materials for qualitatively oriented scholars, as well as a corpus that can be analyzed using the most recent new natural language processing techniques.
In this study, we evaluate the utility of digitized public meeting records for examining technology adoption patterns in local infrastructure, with a focus on the transportation sector. To gauge the accuracy and depth of insights garnered from new digitized sources, we examine the availability, representativeness, and content of three primary data sources: (i) a survey of agencies, which serves as our benchmark; (ii) online minutes from transit agency board and committee meetings; and (iii) video recordings of the same meetings, for which one can easily generate transcriptions. 2
Among the transit-related technologies surveyed, we focus on transit signal priority (TSP) systems, which modify traffic signal timing or phasing to improve the speed and efficiency of public transit. TSP system adoption is an ideal technology to study for several reasons. First, TSP systems were adopted during the last 8 years, when digitized public recordings became more widely available. TSP systems are also useful for a wide range of agencies. In contrast, other technologies, like Computer-Aided Dispatch and Automatic Vehicle Location (CADAVL) systems, are capital intensive and only useful for large agencies managing several transit routes. Finally, the technology has diffused to a substantial number of agencies, with at least 18 agencies in California adopting systems in the last several years (see survey results below). We focus our analysis on California agencies because this allowed us to collect information about the availability of each type of data for a nearly comprehensive set of agencies. California is a also particularly informative place to study technology adoption because agencies tend to be early adopters of new technologies; we expect levels of diffusion observed there to be replicated elsewhere. Also, transit agencies in the state vary widely in terms of whether they make digitized recordings available to the public. 3
Our first analysis compares the availability of each data type (survey, online meeting minutes, and meeting recordings) among California transit agencies. We consider the percentage of agencies where data is available and examine how these agencies differ from the broader population. The survey was distributed by the authors in 2022 to a nearly comprehensive set of transit agencies in partnership with the California State Department of Transportation (Caltrans) (Post and Ratan, 2022). We compare this survey benchmark to the availability of meeting minutes and recordings for the same agencies.
We then turn to a detailed analysis of a single California agency, Santa Clara Valley Transportation Authority (VTA), to compare the insights about technology adoption that can be obtained from each data source. The Santa Clara VTA responded to the survey and publishes both meeting minutes and recordings. This allowed us to compare the extent, focus, and quality of information about the technology adoption across these three data sources.
Comparing rates of data availability and bias
According to the California State Department of Transportation (Caltrans), there are roughly 412 transit agencies in the state. In April and May of 2022, the authors conducted a survey with California transit agencies in partnership with Caltrans to track the adoption of “smart city” technology adoption in the state’s transportation sector. Together, they developed a list of 226 agencies that included National Transit Database (NTD) reporters in the state, members of the California Transit Association, and members of the California Association for Coordinated Transit (CalACT), which includes smaller and more rural service providers. The survey excluded agencies that solely provide paratransit services. Information about organization type is available for all agencies, since Caltrans manually classifies agencies.
As of 2021, 139 out of 226 agencies reported agency characteristics, including population, vehicles operating in maximum service (VOMS), revenue, and service areas, to the NTD. This allows us to assess the bias in the availability of data collected through the survey, agency websites with meeting minutes, and posted meeting recordings with respect to agency size for 139 agencies. The bias analyses therefore focus on 226 agencies with respect to agency type, and the 139 NTD reporters for agency size.
Surveying transit agencies
Caltrans distributed the survey and reminders via email in April and May 2022. Recipients were high-level managerial employees who served as the primary liaisons with Caltrans. The primary objective of this survey was to understand the drivers of “smart city” technology adoption in the transportation sector.
Distribution of transit agencies by institutional type versus data availability.
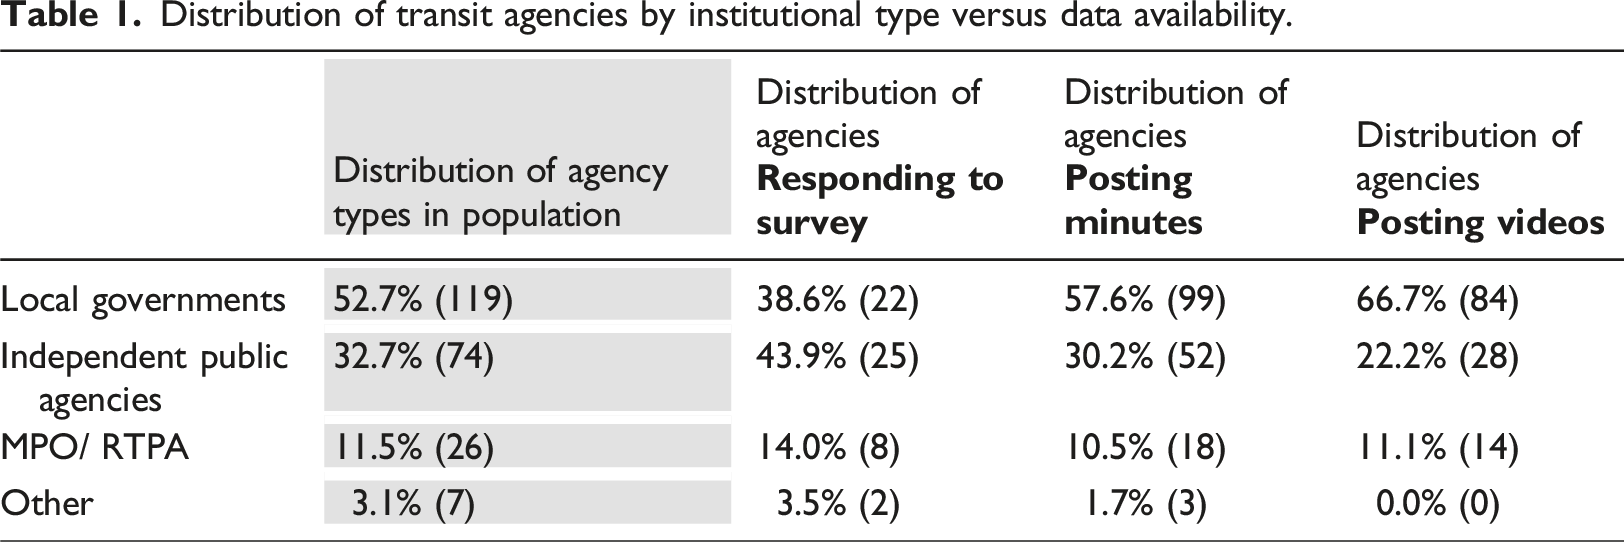
More striking differences in response rates are observed when we turn to agency size: respondents were, on average, much larger than other agencies in the state, with a mean of 141.2 vehicles operating in maximum service (VOMS), in comparison to the state average of 75.4 VOMS. This holds across various measures of agency size (Figure 1).
4
Agency characteristics by 2022 survey response status.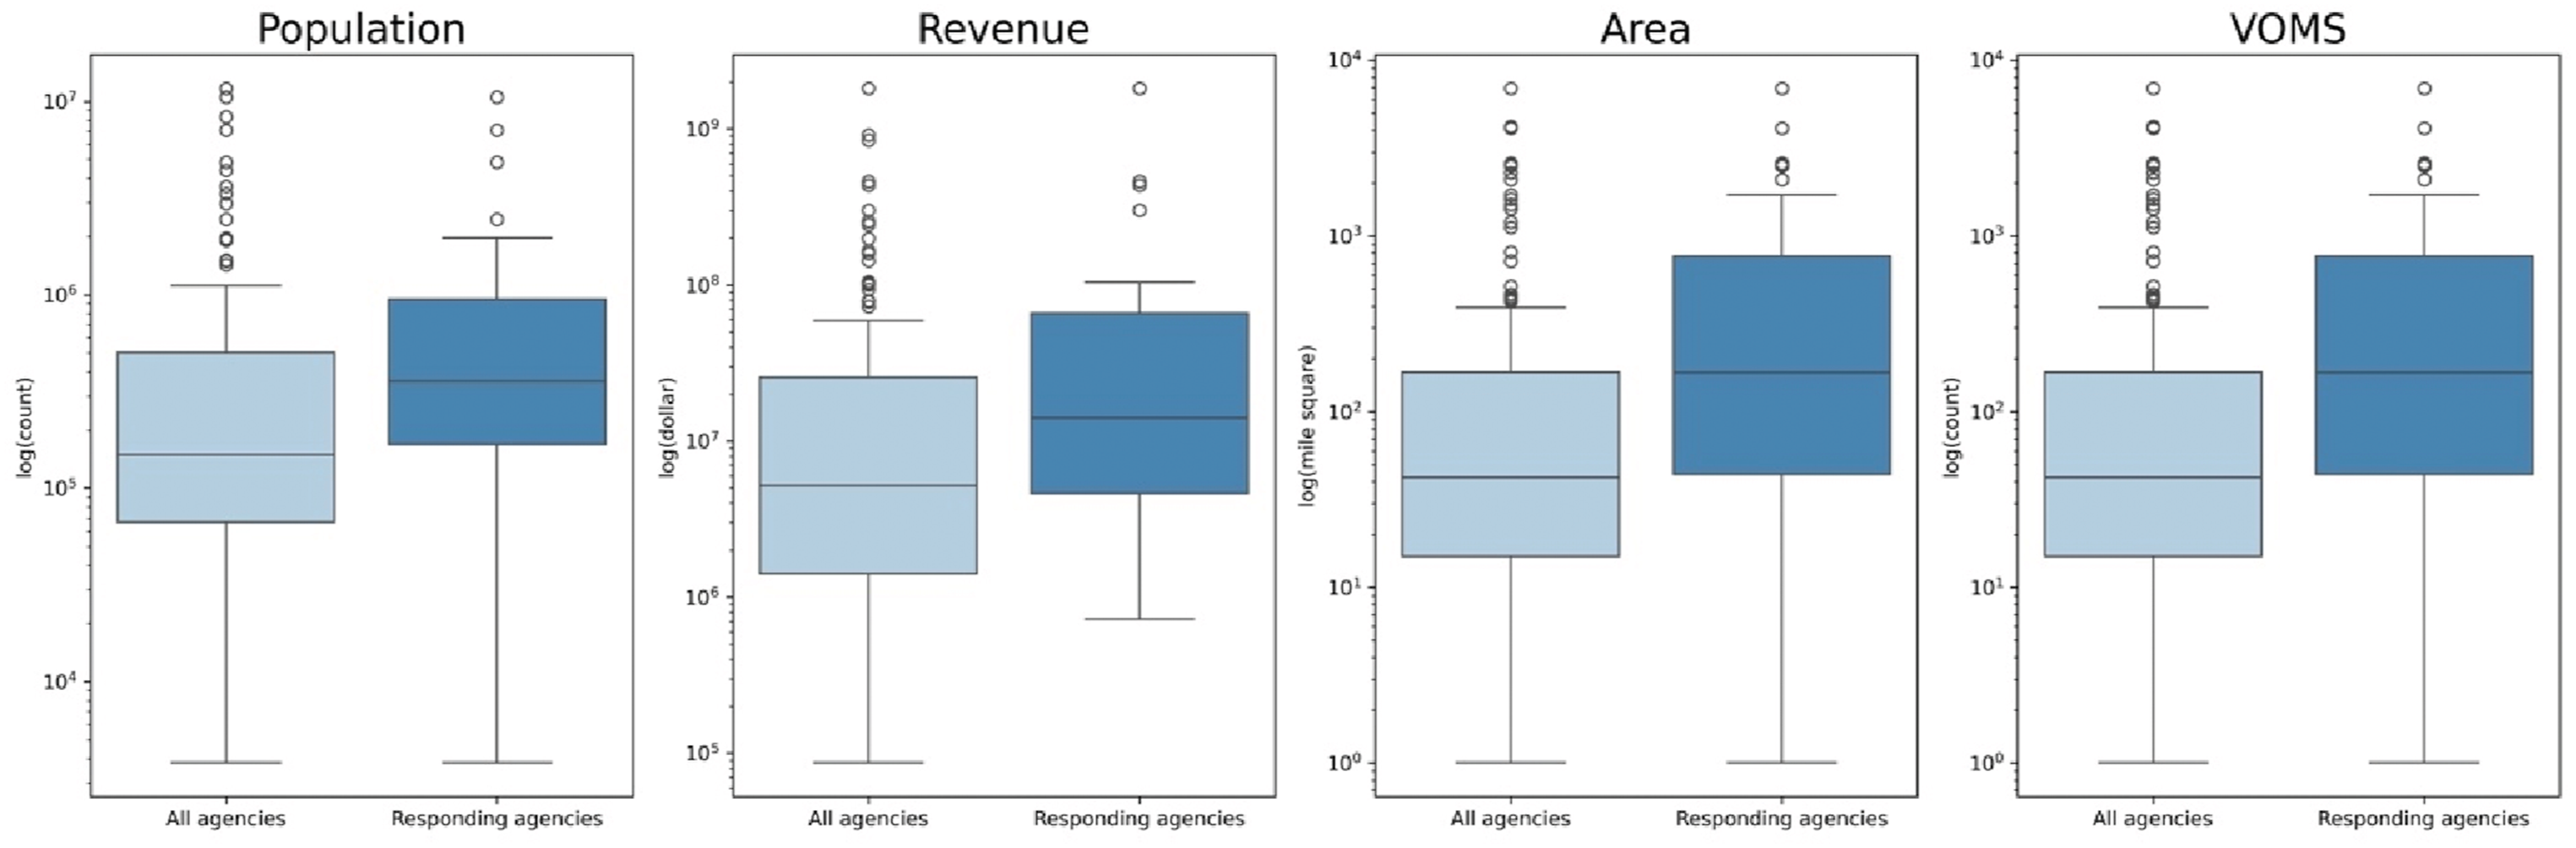
Ordinary least squares models (OLS) with a binary dependent variable are developed to assess whether the differences seen in Figure 1 are statistically significant. 5 These models show important differences in agency size between survey respondents and non-responding agencies (Table A-1). These results underscore that larger agencies—with size defined in a variety of different ways—were significantly more likely to respond to the survey than smaller ones. This indicates that simple inferences drawn from the survey data would apply more to larger agencies and would not capture the decision-making of smaller agencies.
While a variety of weighting methods have been developed to mitigate biases in survey samples, implementing these approaches requires making assumptions and judgment calls that can affect results (Gelman, 2007; Kalton and Flores Cervantes, 2003). In the case of our survey data, weighted estimates of the size of agencies adopting TSP systems, which are calculated using three popular methods, look very different from one another (see SI Appendix B).
Transit board meeting minutes
Over the past decade, numerous agencies have digitized their meeting agendas and minutes, making them accessible through their respective websites or online platforms like Granicus (Frick et al., 2021). The meeting minutes document more details of the decisions made by the agencies than the survey. We assessed the availability of meeting minutes for each of the 226 transit agencies in the author’s 2022 survey; agencies were coded as “regularly” posting meeting minutes if they published minutes for at least six meetings between July 2022 and July 2023. We chose this threshold because many agencies do not hold board meetings during the summer, and some agencies hold bi-monthly meetings. Among the 226 agencies, ∼76% (172 agencies) published meeting minutes regularly. 6 Importantly, this is much higher than the response rate to the survey carried out by the authors (see Table 1).
Of these agencies publishing minutes, 30.2% were independent public agencies, 57.6% were local governments, 10.5% were MPOs, and the remainder were others (Table 1). These percentages are close to the respective share of agencies of each type in the general population and are more similar in institutional type than those responding to the survey.
Meanwhile, agencies publishing minutes are just slightly larger than the state average across measures. Agencies publishing minutes have an average of 82.6 VOMS, slightly greater than the state average of 75.4 VOMS, as well as a slightly larger service population of 714,763 compared to the state average of 707,327 people, and again in revenue with $59 million relative to California-wide $54 million average (Figure 2). Agency characteristics by agencies publishing meeting minutes.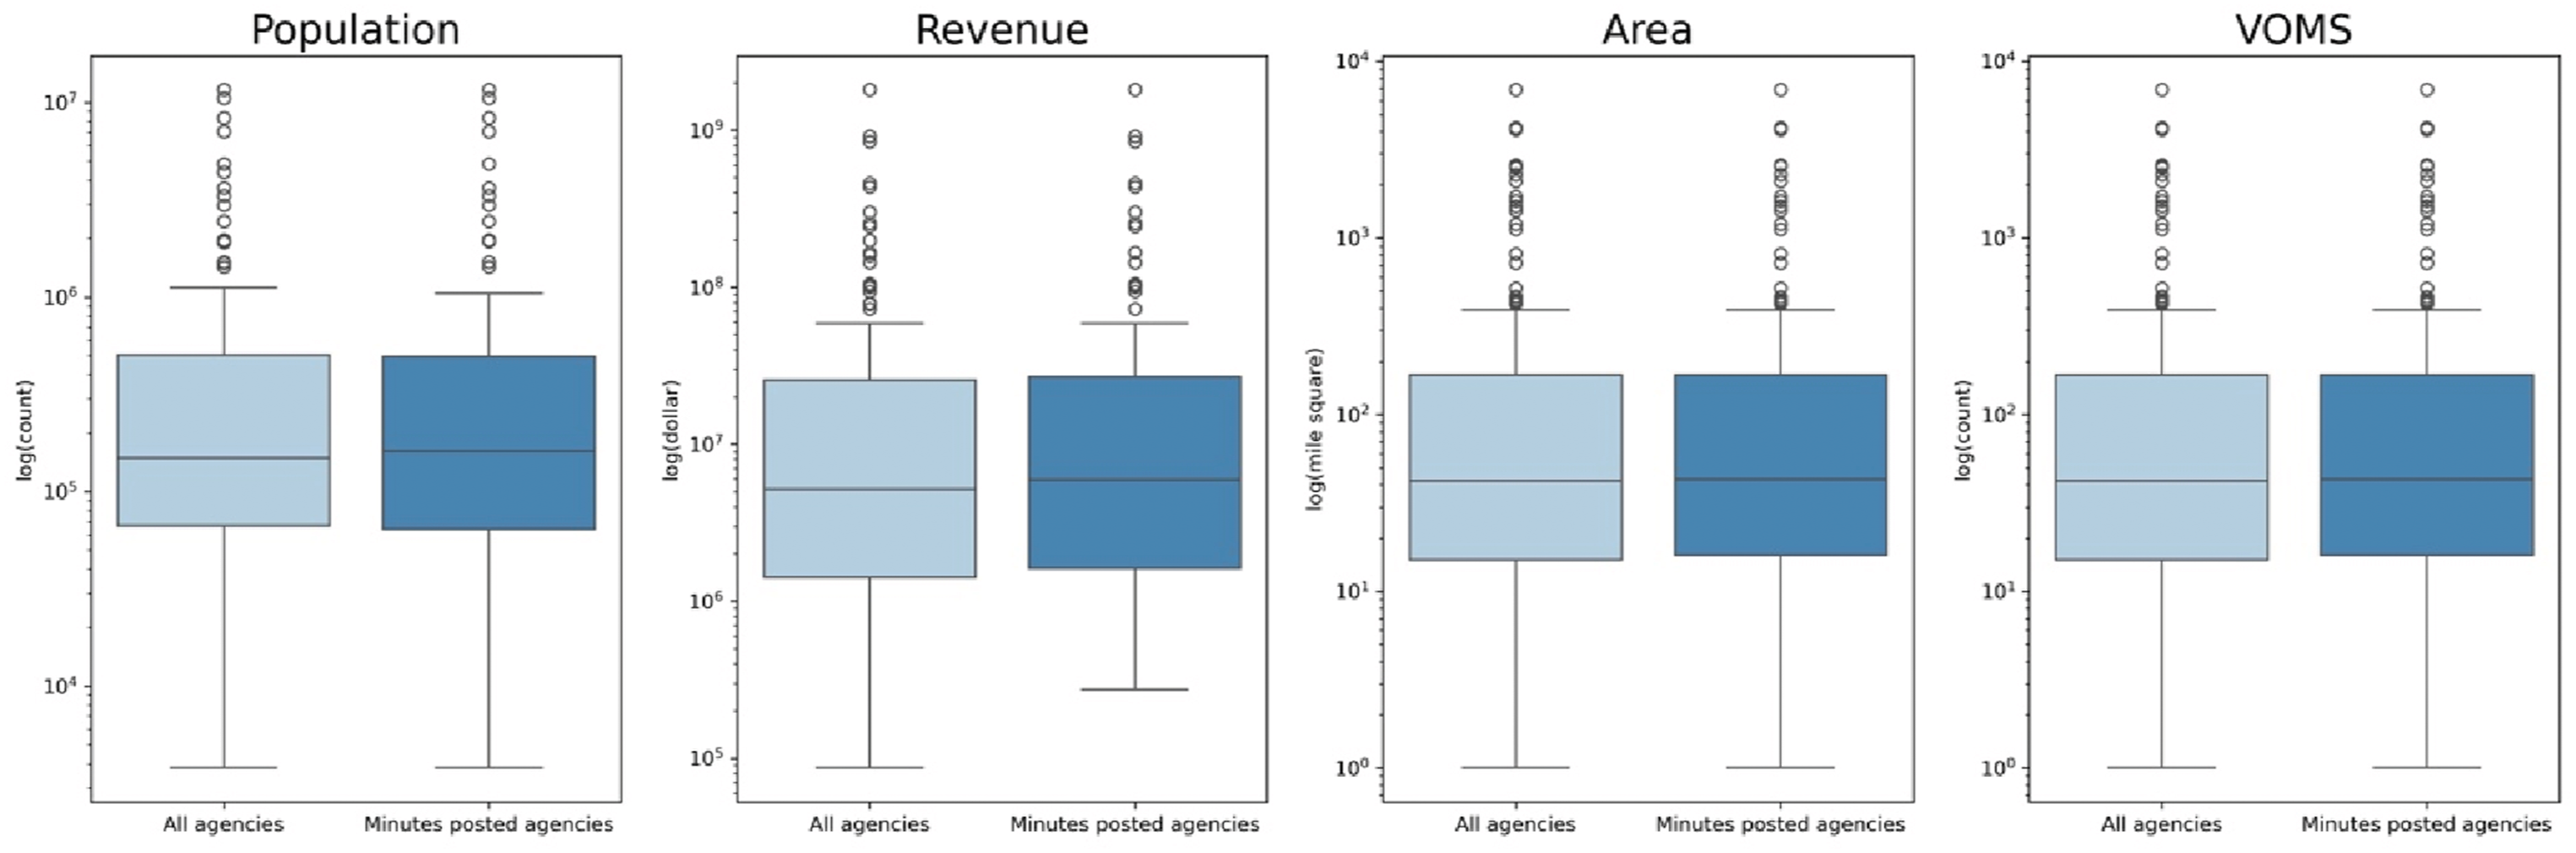
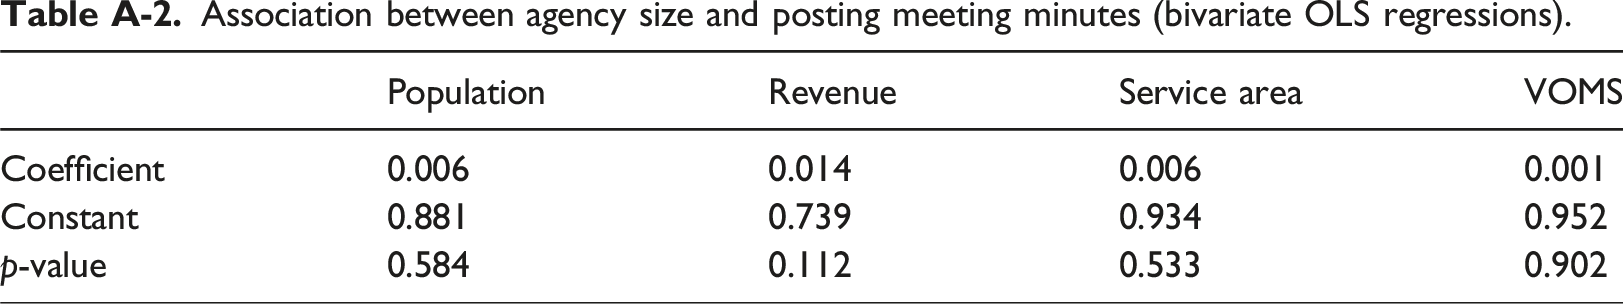
Again, we use OLS regression with a binary dependent variable to evaluate whether these differences in size between the agencies publishing and not publishing minutes are statistically significant. Our results indicate that the agencies publishing minutes are not different in size than other agencies (Table A-2). This suggests meeting minutes are available for a more representative set of transit agencies than survey responses.
Meeting recordings
In recent years, many local public agencies began publishing video recordings of their public meetings with online platforms such as YouTube, Facebook, and Granicus, as well as on their own websites (Barari and Simko, 2023). These recordings potentially offer a richer source of information compared to traditional meeting minutes, as they capture the entirety of the meeting discussions. Starting with the list of 226 agencies contacted by the authors in 2022, we evaluated whether each agency published meeting recordings at least six times between July 2022 and July 2023. We found that ∼56% (126) of the 226 agencies regularly post meeting recordings on their websites or another online platform; in other words, videos are available for more agencies than survey responses (25%), though not as often as meeting minutes (76%). Notably, local government agencies are more likely than other agencies to publish videos, whereas independent public agencies were more likely to respond to the survey (Table 1).
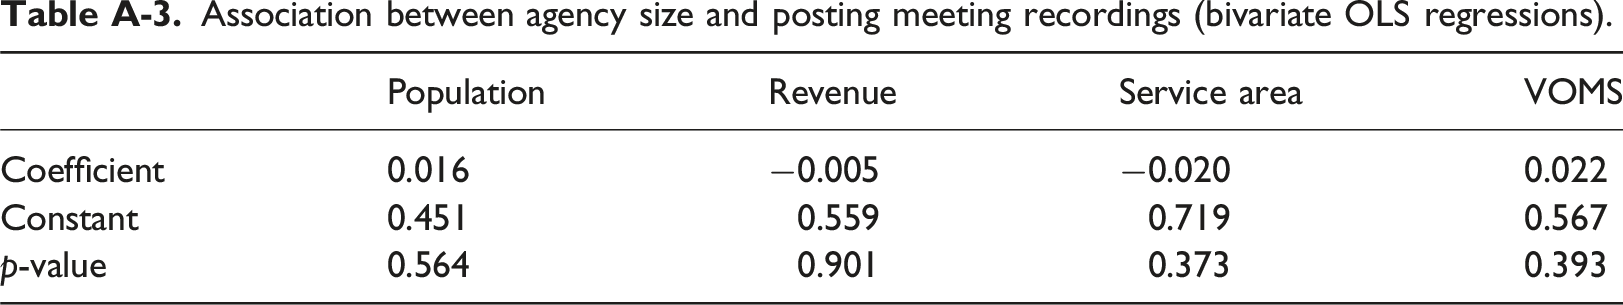
Among the 126 agencies that posted videos of meeting recordings, the NTD reports background information on 89 of them. Analyzing this subset of the data, we find that the population of agencies publishing recordings is similar in size to those not publishing, regardless of whether size is operationalized in terms of population served, revenue, VOMS, or service area (Figure 3). Agency characteristics by video publication status.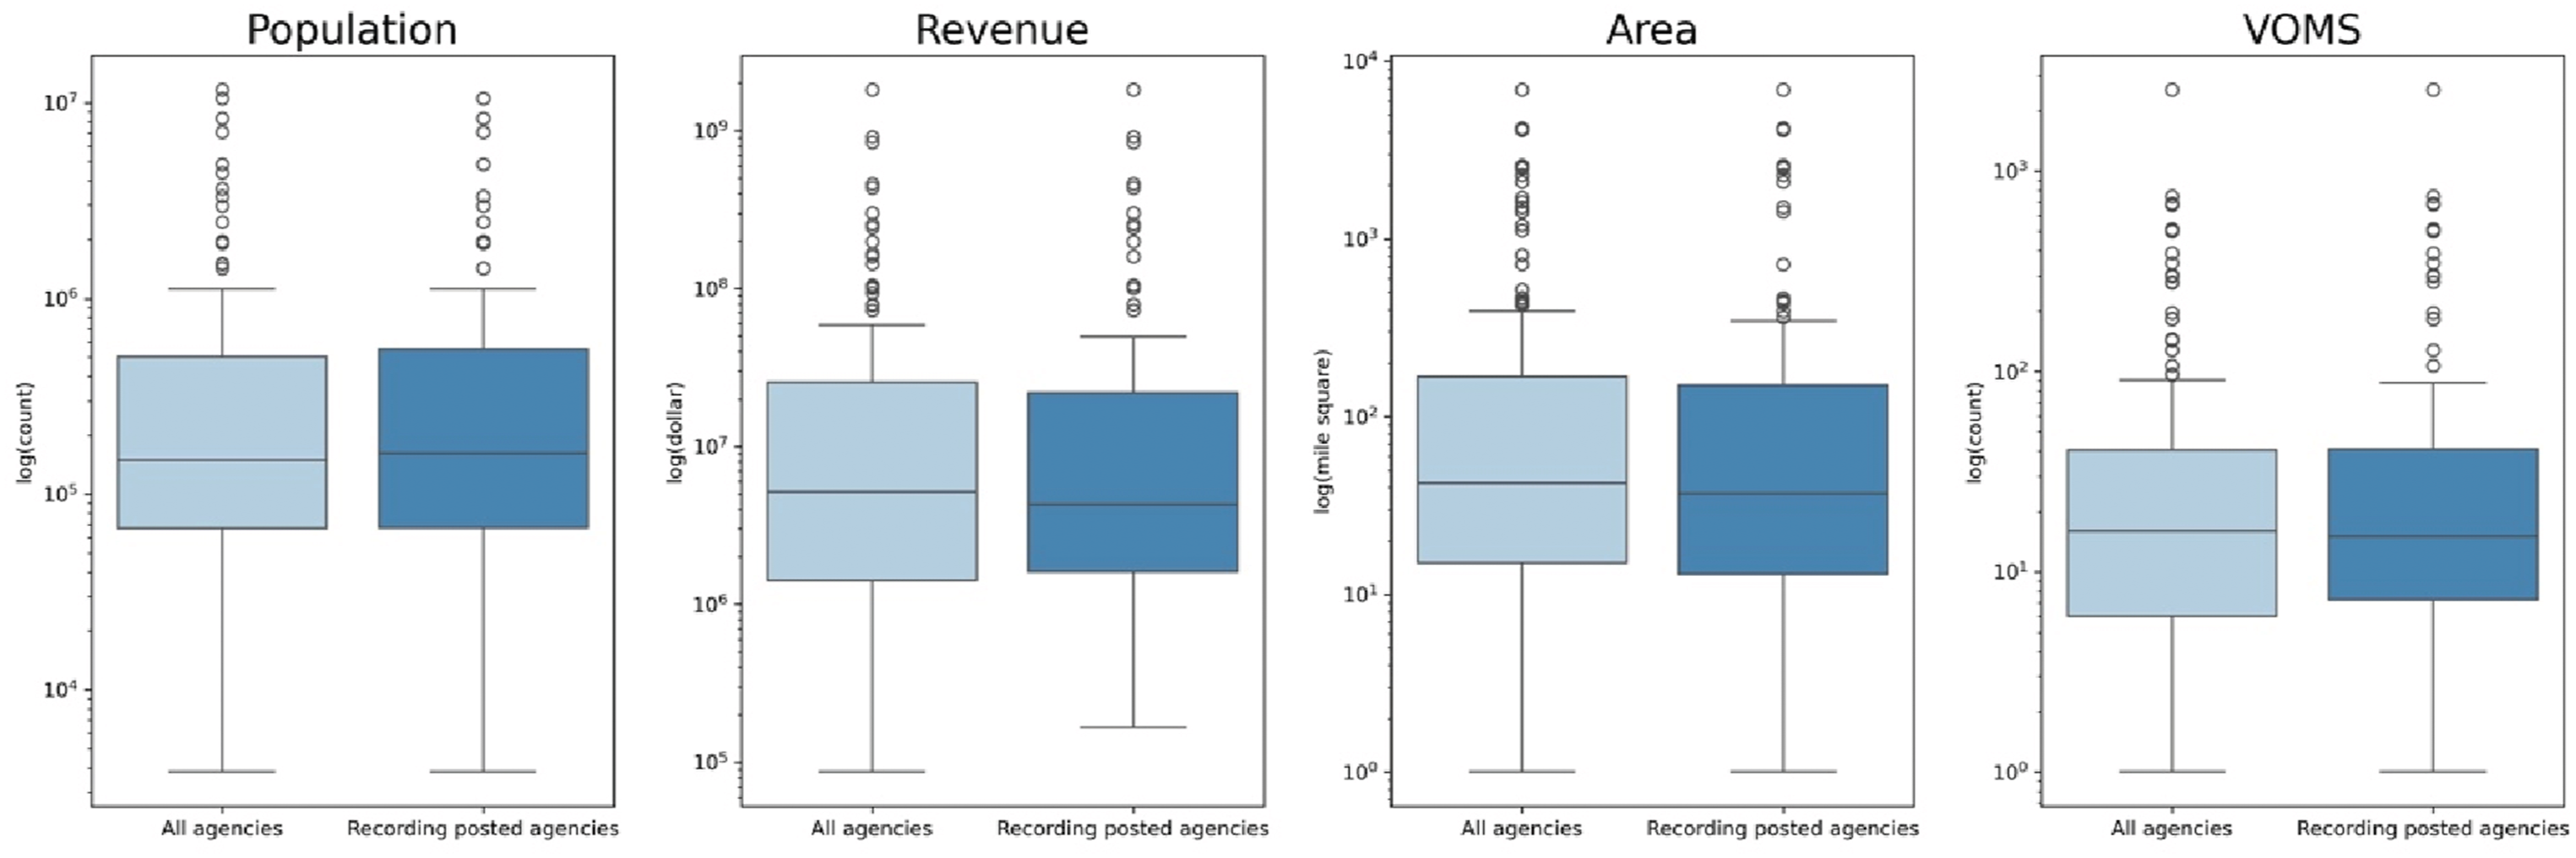
The average service area population, revenue, and VOMS are slightly higher than state averages for agencies posting recordings, with an average population within an agency’s service area of 748,181, average revenue of $73 million, and average VOMS of 99. These values are similar to state averages. Bivariate OLS models indicate these differences are not statistically significant for any of the four measures (Table A-3). This suggests that the population of agencies publishing recordings of board meetings is more similar to the population of agencies overall than is the case for surveys. As a result, this data source is potentially more useful for obtaining information that is reflective of broader patterns in the total population of agencies.
What types of insights can be gleaned from each data source?
Meeting minutes and recordings may be available for a larger and more representative set of agencies than surveys, but do they provide information that allows us to better understand the technology adoption process? To assess this question, we searched for an agency that adopted transit signal priority (TSP), where all three types of data were available, and all three types of data contained references to TSP.
To identify such an agency, we limited our focus to agencies that responded to the authors’ 2022 survey and indicated that they were piloting or had adopted TSP. We then turned to a new system offered by Firmographs that allows users to search the contents of public agency meeting minutes. 7 Firmographs identifies agency URLs manually, and then utilizes web scraping to systematically harvest minutes. They then allow subscribers to search among these text files using keywords. We used the Firmographs system to identify board meetings where TSP had been discussed between 2020 and the present. While Firmographs is a proprietary, subscription-based service, one could replicate our analysis by downloading available meeting minutes for a set of agencies and analyzing the contents of these minutes. 8 We then evaluated whether the agencies possessing relevant board meeting discussions also published their meeting recordings online during the same period.
Santa Clara Valley Transportation Authority (VTA) emerged as an ideal case given its positive response regarding TSP in the authors’ survey, evidence of TSP discussion in the board meetings, and the fact that meeting minutes and recordings have been posted since 2008 and 2020, respectively. The Santa Clara VTA is a special district that oversees bus, light rail, and paratransit operations in Santa Clara County. It also collaborates financially in regional rail endeavors such as Caltrain, Capitol Corridor, and the Altamont Corridor Express. As the county’s primary agency for managing traffic congestion, the Santa Clara VTA is also responsible for transportation planning, including tackling congestion, spearheading highway enhancements, and managing pedestrian and bicycle projects.
Data collection
To compare the type of insights one could obtain about technology adoption decision-making between survey-based approaches and new types of digitized records, we first compiled minutes and recordings from Santa Clara VTA meetings where TSP systems were discussed. To assemble relevant meeting minutes, we downloaded all minutes published between January 2015 (when TSP systems first began to catch the interest of transit agencies) and May 2023. To pinpoint discussions of smart transportation systems, we focused on the three committees: (1) General Board Meetings, (2) Technical Advisory Committee (TAC) meetings, and (3) Congestion Management Program & Planning Committee (CMPP) meetings. We then concatenated the full corpus of meeting minutes into a single file and conducted keyword searches to identify sessions which discussed TSP systems.
We also collected recordings of these same committee meetings within the same timeframe through the meeting archive website of the Santa Clara VTA, which is maintained by Granicus. 9 We used our keyword searches of the meeting minutes to identify meetings during which TSP systems were discussed. We then used the Whisper Package in Python (Radford et al., 2022) to transcribe meeting recordings corresponding to the relevant minutes.
Comparing insights from different sources
Type of information about TSP adoption available from each data source.
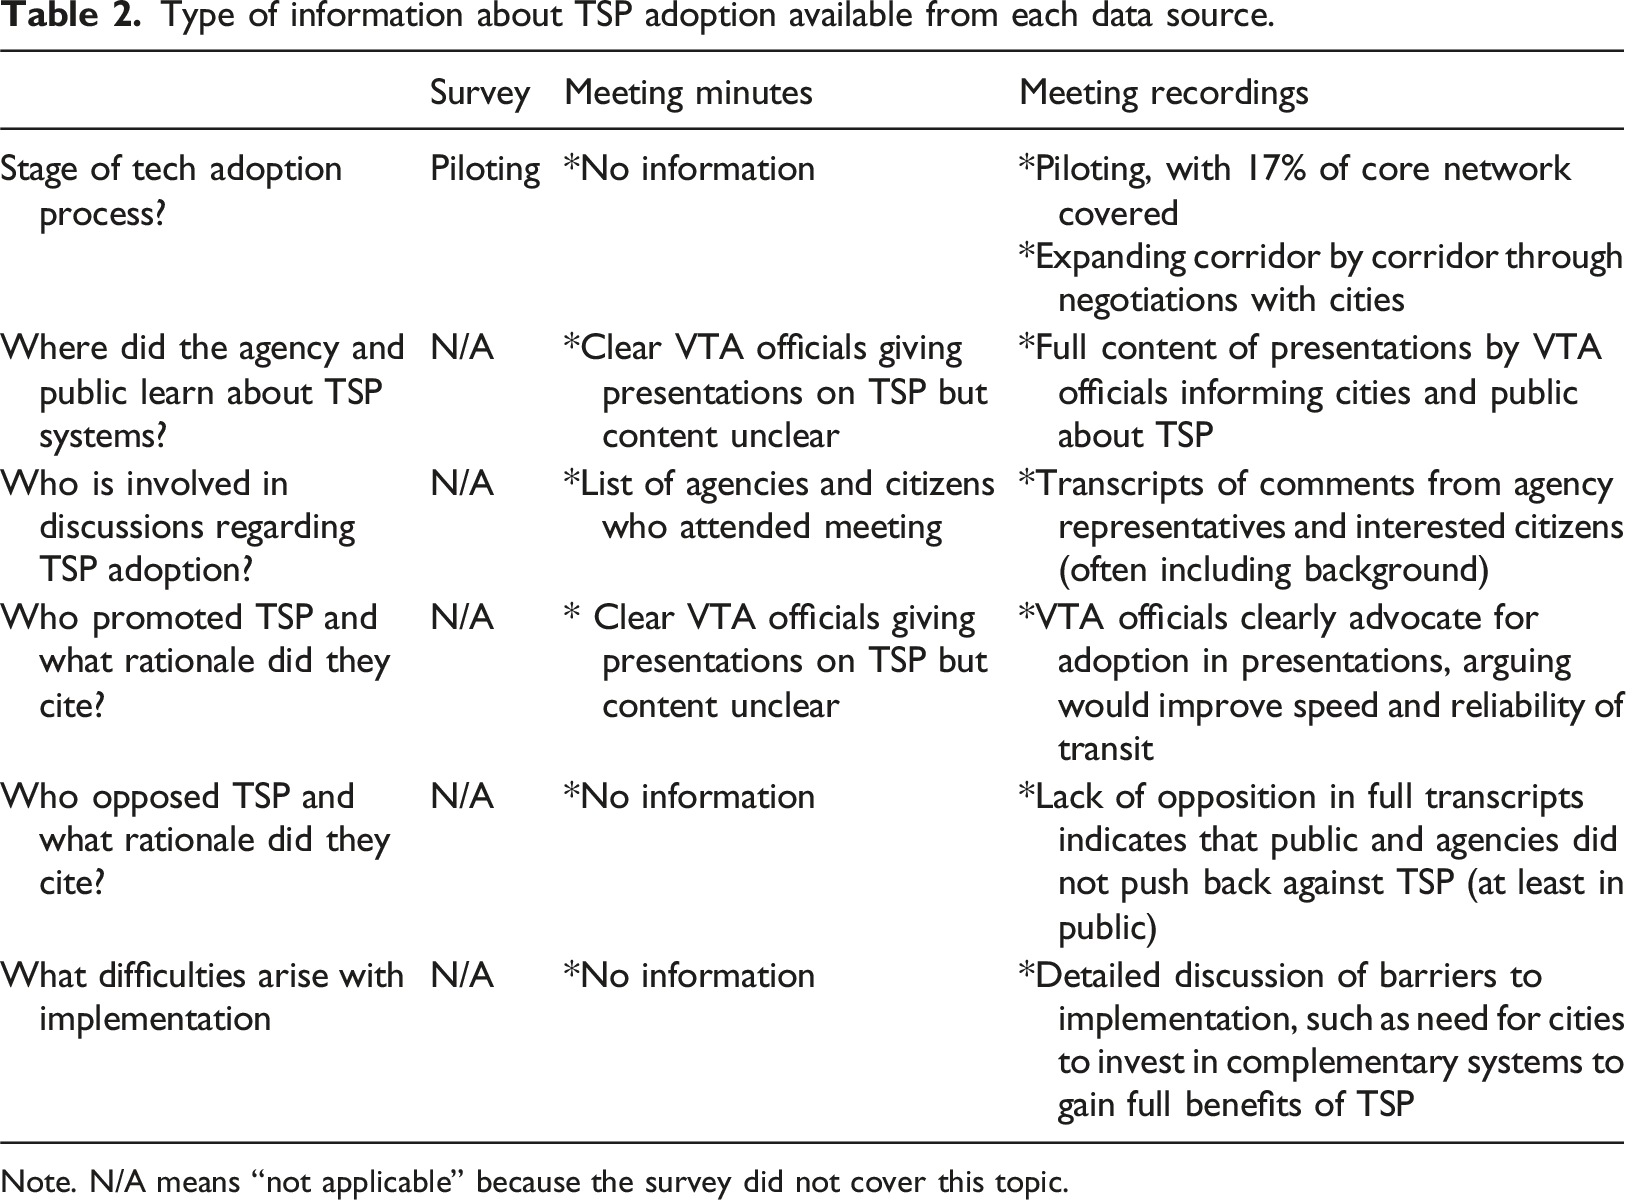
Note. N/A means “not applicable” because the survey did not cover this topic.
At what stage in the adoption process is the agency? Piloting? Full-scale adoption?
Overall, our comparison suggests that surveys can provide simple information about the stage of adoption that is easily comparable across agencies, but that meeting minutes and meeting recordings provide much more granular information which illuminates how differentiating between “pilots” and “full-scale adoption” can be very challenging in practice.
The authors’ 2022 survey with California transit agencies posed several questions regarding “smart city technology” adoption, including TSP systems. In developing the survey, they asked respondents to provide the same information about each of the 17 included technologies. Agencies were first asked about the stage of adoption from a range of options: not at all, considering, piloting, procuring, or using system wide. Santa Clara VTA identified themselves as piloting TSP in their service area and considering system-wide adoption in the future.
The agency’s survey response is corroborated by digitized minutes and recordings of discussions held during the TAC meeting on August 12, 2020. Notably, the dialogue contained in the meeting recording transcriptions is particularly illuminating, revealing details not captured in the associated meeting minutes. In the meeting recording [01:10:20–01:17:12], a Santa Clara VTA official explained that TSP covered 17% of their “frequent” network and expressed the agency’s goal of expanding coverage to 90%–100%. Moreover, the same meeting recording elucidates the Santa Clara VTA’s systematic approach to expansion, corridor by corridor, through negotiations and collaborative agreements with cities within their service area. For instance, the Santa Clara VTA representative mentioned the formation of a working group to foster inter-governmental and external communication to expand TSP infrastructure and elevate the priority given to light rail and rapid bus transit among municipalities in their service area.
Where did the agency or members of the public learn about TSP systems?
While the authors’ survey did not contain detailed questions regarding where agencies learn about specific technologies, the meeting minutes and recordings offer several insights. What we find in the minutes—and especially in the recordings—is evidence that Santa Clara VTA administrators worked to educate municipalities in their service areas and the public about TSP. We find no information regarding how the agency learned about TSP, perhaps because minutes and recordings are limited before 2017, or because these processes were not discussed in public meetings.
Minutes and recordings indicate that the transit authority updated board members on the status of TSP implementation across their system and gave presentations to city officials and members of the public about the technology’s potential. For instance, minutes and recordings of TAC and CMPP meetings show that Santa Clara VTA transportation planners Percell or Maeda typically provided brief presentations on the Fast Transit Program, which included TSP. The recordings reveal that both officials emphasized the advantages of rolling out a TSP system, including reducing bus delays and equitable access to transportation. They also discussed the current progress of improvements and types of support needed to implement the system. 10
In contrast, General Board meetings typically focused on broader topics such as capital projects, collaboration between member agencies, and the agency’s overall vision for the county’s transportation system, with more detailed information in the recordings. For example, during the January 5, 2017 and September 2, 2021 meetings, the board members approved contracts with ACT Traffic Solutions to enhance TSP services. In meetings on October 4, 2018 and September 1, 2022, discussions focused on collaboration between member agencies to prioritize transit. Additionally, during the latter meeting, the City of San Jose Division Manager gave a presentation about their experience with TSP implementation to board members representing local governments served by the transit agency. Regarding the broader vision, the Chief Information Officer presented the “Santa Clara VTA Innovation Vision” during the December 5, 2019 meeting. Furthermore, during the February 19, 2021 meeting, the Senior Transportation Planner provided an update on the “Next Generation High-Capacity Transit Study.” Both the “Santa Clara VTA Innovation Vision” and “Next Generation High-Capacity Transit Study” mentioned the TSP system.
Who is involved in discussions about adopting TSP systems?
The authors’ 2022 survey did not include questions about who participated in decision-making about TSP. This was in part due to space constraints, and in part due to a concern that the agency respondent would not have full information about participants in the decision-making process. However, the meeting minutes and videos both contained detailed information about individuals involved in decision-making in this public setting.
The Santa Clara VTA meeting minutes provide regular, systematic information about who attended each meeting where TSP systems were discussed. The minutes begin with attendance lists for formal committee or board members. They often contain the names of members of the public who participate in the meetings. For example, they show that TSP was typically discussed in meetings that included formal representatives from each of the municipalities within the Santa Clara VTA service area, with attendance rates typically around 80%, but sometimes dipping to 35 or rising as high as 100%.
While minutes provide systematic information about the composition of board and committee membership, recordings provide more information about the members of the public who attend. In the transcribed comments, members of the public provided additional information about themselves, including their occupation, their relationship with the policy area under discussion, and their relation to the agency. For instance, transcripts of the General Board meeting on June 4, 2020 [00:12:29] captured a moment where a citizen began her speech by identifying herself as a Silicon Valley Transit user, as well as a company founder and CEO. Another illustrative example is General Board meeting held on March 7, 2019 [00:26:50], where the presenter began his comments by introducing himself as an Employee Service Representative (ESR) at Santa Clara VTA’s customer service department, emphasizing his 18.5 years of tenure with the organization.
Both the meeting minutes and the recordings suggest that few members of the public participated in these meetings, even though zoom attendance was possible. On average, only eight members of the public contributed to each meeting. Public comments were more frequent in General Board meetings than in TAC and CMPP meetings. Those who did attend were familiar faces with strong interest in the policy area (especially in TAC and CMPP meetings). For example, Mr Blair Beekman and Mr Roland Lebrun participated in almost every TAC and CMPP meeting, and they were usually the only two members of the public in attendance.
In the case of Santa Clara VTA discussions of TSP, community members were almost uniformly supportive of adoption. For example, an engaged citizen made public comments in multiple meetings between 2020 and 2022, including at the CMPP meetings on August 20, 2020, and February 18, 2021, as well as during General Board meetings on December 3, 2020 and September 1, 2022. In these sessions, this citizen argued that TSP addressed concerns regarding services for elderly and disabled individuals and advocated for partnerships with cities to enhance transit accessibility and efficiency. Additionally, another engaged citizen advocated for the expansion of TSP services countywide at several General Board meetings, including those on June 4 and December 3, 2020, and September 3, 2022.
Our analysis of the Santa Clara VTA case suggests that meeting minutes offer rich systematic data on participation in public discussions, while meeting recordings provide more insights into the types of individuals that participate, as well as the positions they espouse.
Who promoted TSP? What rationale did they draw upon?
Surveys provide a way of obtaining succinct and comparable information about the rationale for technology adoption. The authors’ 2022 survey, for example, asked agency respondents the rationale for adopting particular technologies, including TSP. Respondents that selected “Procuring” and “Using Systemwide” for a given technology were prompted to rate the importance of different rationale for adoption, including the obsolescence of old technology, workforce expectations, regulatory compliance, state mandates, transparency and public relations, public pressure, operating cost reductions, user experience and safety, environmental concerns, and expanding access to underserved communities.
For TSP, the 10 agencies indicating they were piloting or had fully adopted TSP systems rated improving the user experience and operating cost reductions as most important, with 10 agencies indicating that each was moderately, very, or extremely important for TSP adoption. Environmental concerns ranked close behind, with nine agencies indicating its importance, followed by obsolescence of old technology, public pressure, and regulatory compliance, with eight agencies selecting each, respectively. The results are visualized in Figure 4. Count of agencies by adoption rationale.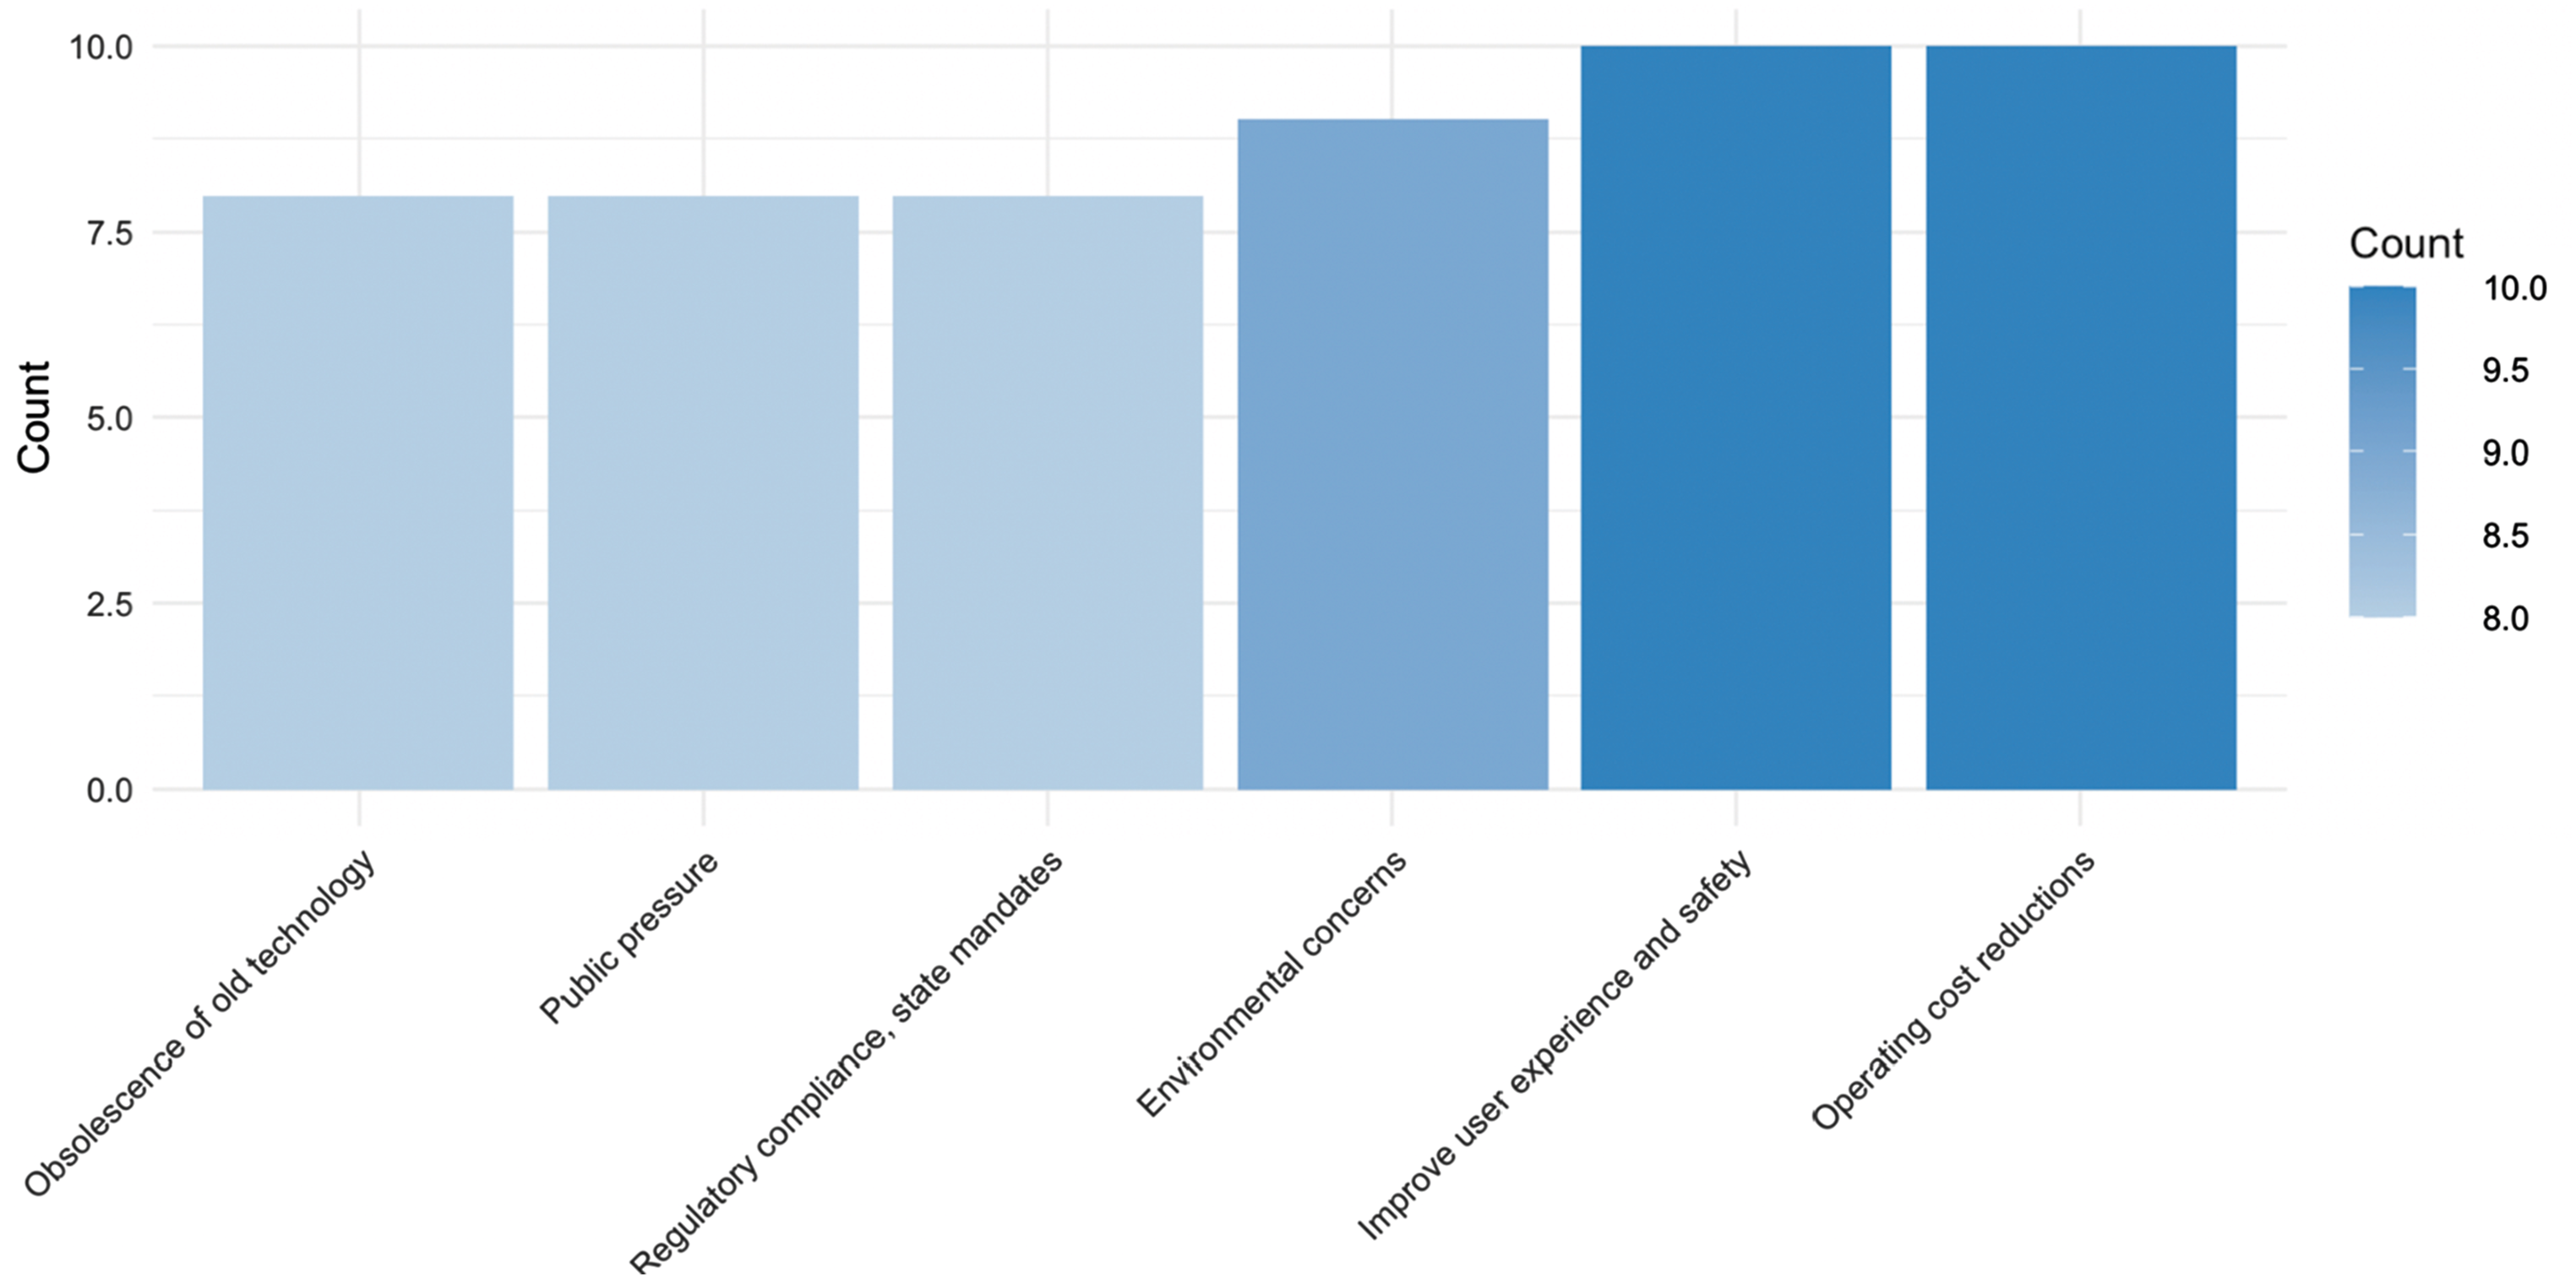
In comparison with the survey, the VTA meeting recordings provided less comparable information about why TSP was initially adopted and why the agency wanted to expand its usage. Across many meeting recordings, there is clear evidence that VTA technocrats promoted TSP with transportation planners from the municipalities in the agency’s service area. Santa Clara VTA transportation planners describe themselves as “advocates” for the technology, emphasizing key reasons it would contribute to the speed and reliability of Santa Clara VTA mass transit services, as well as to equity in transportation access to those living in each of the municipalities. 11
Meeting recordings also reveal the rationale for TSP adoption championed by members of the public. Citizen comments underscored the need for enhanced TSP in bus services and light rail systems to bolster transit efficiency and alleviate congestion. 12 For example, Eugene Maeda advocated for the widespread rollout of TSP across the county after facing delays on the Santa Clara VTA Light Rail, arguing that increased TSP adoption is essential for making public transport quicker and more reliable than car travel, especially during heavy traffic. Such comments are not captured fully in the meeting minutes.
Who opposed TSP? What rationale did they cite?
The authors’ 2022 survey did not include specific questions regarding individuals or groups blocking the adoption of TSP or other technologies, in large part because of concerns that responses might be censored due to the sensitivity of the question. The VTA meeting minutes and recordings suggest that public opposition to the introduction of TSP was minimal or nonexistent, at least in these fora. Board members, VTA officials, and members of the public alike who commented in meetings stressed the advantages of adoption. No citizens came to the meetings to complain about waiting longer at traffic lights due to TSP systems, or discuss experiences in other cities where TSP systems increased traffic congestion for private vehicles. No city representatives made public comments indicating they worried about introducing the technology because of cost or political backlash. This suggests that technology adoption decisions of this sort do not pose sufficient costs to motivate impacted individuals to attend public meetings. 13
What difficulties arise with implementation?
The authors’ 2022 survey revealed little information about implementation barriers, in large part because a survey covering 17 different technologies did not have space for specialized questions regarding implementation difficulties tailored to each technology. It would have been possible to pose relevant questions, but the authors of the survey would have needed a prior knowledge of the main barriers to formulate a list from which respondents could choose.
Our analysis of the meeting recordings suggests that these are a particularly rich source of information about implementation difficulties. They indicate that the rollout of TSP was slowed down not because of political opposition, but because of institutional friction. In the August 20, 2020 CMPP meeting transcripts [01:29:24], a Santa Clara VTA representative indicated that three conditions are necessary to roll out the technology: supportive policy, the technology itself, and operational support. If municipalities in their service area did not adopt policies supportive of TSP, the Santa Clara VTA would be investing significant funds in new technologies but not end up using it. What does this mean in concrete terms? During the May 20, 2021 CMPP meeting [01:05:32], Santa Clara VTA representatives emphasized that they could not implement the systems on their own because traffic signals often fall under the jurisdiction of municipalities. They must therefore convince municipalities of the benefits of converting specific corridors, and carefully coordinate the introduction of TSP with that of other technologies designed to improve travel times, like smart cards and bus stop architecture. In her remarks to the Santa Clara VTA board, Santa Clara VTA Transportation Planner underscored these points: “Every city decides how much priority goes to transit and how to balance the movements at an intersection, and how much delay to accept for vehicles, and then equipment is programmed to reflect that. So, if policies to improve TSP don’t exist, cities and the Santa Clara VTA end up investing in technology to support TSP, but not using that technology to its full extent (CMMP, May 20, 2021).” Such detailed discussions providing insights into barriers cannot be easily captured in the meeting minutes, which are often very abbreviated.
Discussion
Our analysis of the Santa Clara VTA’s consideration of TSP systems suggests that surveys, digitized board meeting minutes, and meeting recordings offer different, and potentially complementary insights into the technology adoption process (Table 2). Surveys offer the opportunity to collect data on adoption stage, rationale, and barriers that is reasonably comparable across cases. Respondents can draw on knowledge of internal agency processes as they respond to the survey questions. To formulate survey questionnaires, however, a significant amount of prior knowledge is required. And to develop categories that are comparable across cases, it is necessary to “flatten” the information collected, condensing detailed information into broader categories. In addition, respondents may not possess full or accurate information about decision-making processes within the agency.
Meeting minutes offer more granular information about the content of public decision-making processes about technology adoption. They typically contain precise information about attendance, document specific resolutions or legal decisions affecting technology adoption, and may include precise dollar amounts for grants and other funds that need agency-level approval. The level of detail included in meeting minutes varies between agencies, however. What is included or excluded from minutes depends on agency protocol, as well as the note-taking practices of the person drafting the minutes. For the Santa Clara VTA case, meeting recordings provide superior information about advocates of technology adoption. The recordings revealed the efforts of Santa Clara VTA employees to explain the utility of TSP systems to local governments in their service area, as well as to convince members of the public of the advantages of adoption. The recordings also allow one to distinguish between the rationale emphasized by agency employees and those mentioned by other local governments and the public. The meeting recordings also allow one to match comments with types of individuals. Recordings also provide the opportunity to observe public backlash against adoption (or in this case, the lack thereof) and understand barriers to implementation, as these barriers are discussed at length in meetings. As with the meeting minutes, however, one can only use them to observe decision-making processes in public settings. The information must also be extracted from transcriptions through either time-intensive manual coding or computational methods.
How can researchers leverage the respective strengths of these different information sources, while also acknowledging their limitations? Our analysis suggests close readings of meeting transcriptions (perhaps in conjunction with interviews) can be extremely helpful at the initial stages of a study. The widespread availability of these recordings makes engagement with this data straightforward and less susceptible to sampling bias than other methods. For example, reviewing transcripts allows for the development and enhancement of survey questions. In the authors’ 2022 survey, for example, respondents were asked to identify their agency’s stage in the adoption process; response options included “Not at all,” “Considering,” “Piloting,” “Procuring,” or “Using Systemwide.” However, our analysis of the VTA’s meeting transcripts revealed cases of TSP rollout that did not fit neatly in these categories. Planners making presentations at the meetings instead referred to the coverage rates of technologies (e.g., 17% of the system had been covered by a certain point in time). 14 Text searches of meeting transcriptions prior to survey design would have noted this problem. Close reading of meeting transcriptions can also improve the performance of supervised learning models, following guidance from leading methodologists who advocate inductive, preliminary coding at the beginning of projects involving text analysis (see Grimmer et al., 2022). Preliminary analysis can help identify alternative keywords or expressions for the same concept, which can in turn be used to train models. Returning to the same example, a close inspection of Santa Clara Valley VTA’s meeting transcripts shows that a variety of terms have been used to describe the “systemwide” rollout of TSP, including coverage “countywide” and “across the whole VTA service area.” 15
Conclusion and implications
To what extent can newly digitized local government meeting minutes and meeting recordings allow us to understand decision-making regarding technology adoption, as well as other aspects of the policy-making process? In this paper, we tackled this question by examining both bias in the availability of new digitized records and the types of information that they can provide. We compare meeting minutes and recordings with a survey, a traditional means of collecting information about technology adoption and other local government processes. We execute this comparison for transportation agencies in California, focusing on decision-making about the adoption of TSP systems.
We found that digitized meeting minutes and recordings were available for a much larger fraction of agencies than responses to a survey on technology adoption distributed by the state transportation agency. While the response rate to the survey was 22.5%, 76% of the agencies in our sample published meeting minutes regularly, and 56% published meeting recordings regularly. Moreover, our analysis indicates that—at least with respect to size and institutional type—the types of agencies posting meeting minutes and meeting recordings is more reflective of the full set of California agencies than those responding to surveys. This suggests that for researchers aiming to produce findings that generalize beyond their study sample, meeting minutes and recordings may, somewhat counterintuitively, provide better information.
Meanwhile, our analysis of the types of information about technology adoption included in each data source suggests that complementary insights can be obtained from the different sources. It is possible to learn about internal decision-making processes from surveys, while meeting minutes and recordings only provide information on public debate. By design, surveys yield information that is comparable across many cases, yet the information is flattened to allow such comparisons. Meeting minutes, on the other hand, contain clear documentation of attendance at public meetings, related government resolutions, funding programs, and the instances where a particular technology has been discussed in a public forum. The level of detail included in such minutes varies considerably across agencies, however, which can complicate comparisons and inferences, particularly for large-N comparative studies. Meeting recordings, in contrast, provide comprehensive information on the content of public meetings. Their completeness means one can extract more information on the rationale for adoption, and the efforts of agencies to bring other organizations and members of the public on-board with technology adoption. They include granular information on the nature of public participation—and for the VTA, that participation is dominated by a few public transit enthusiasts. They can also reveal whether there is public backlash against technologies, as well as implementation difficulties.
Overall, our analysis suggests that there are significant complementarities across the different data sources. Close readings of meeting minutes and especially transcriptions could provide crucial insights at the beginning of a project—and serve as a complement to other qualitative data sources like interviews. They represent easily accessible, widely available “on demand” repositories for qualitative research. In addition, minutes and transcripts of meeting recordings contain information that can improve the quality of traditional quantitative approaches like surveys. Engagement with minutes and meeting recordings can assist in the development of sensible response options. Finally, transcripts represent a new type of data that can be analyzed using “text-as-data” approaches. Initial analyses of transcripts can assist the development of “training” datasets and dictionaries. Later, large bodies of text can be analyzed using automated techniques. Overall, the widening availability of digitized minutes and transcripts offers exciting opportunities to better understand technology adoption, and local government decision-making processes more broadly.
Supplemental Material
Supplemental Material - Studying tech adoption with “text-as-data”: Opportunities, pitfalls, and complementarities in the case of transportation
Supplemental Material for Studying tech adoption with “text-as-data”: Opportunities, pitfalls, and complementarities in the case of transportation by Shih-Hung Chiu, Tianyu Han, Alison E Post, Ishana Ratan, and Kenichi Soga in Environment and Planning B: Urban Analytics and City Science.
Footnotes
Acknowledgments
We thank Firmographs LLC for providing us with access to their data management system, and David Cox for his advice and suggestions regarding this research. We also thank Joan Walker for feedback on an early draft.
Author contributions
Post and Soga developed the initial conceptualization for the paper. Chiu and Han performed the data analysis in the paper under the supervision of Post and Soga. Post, Chiu, and Han wrote the paper. Ratan performed supplemental analysis and co-administered the survey described in the paper with Post.
Declaration of conflicting interests
The author(s) declared no potential conflicts of interest with respect to the research, authorship, and/or publication of this article.
Funding
The author(s) received no financial support for the research, authorship, and/or publication of this article.
Data availability statement
The data and replication code used in this study is published on GitHub: https://github.com/eric-shchiu/Smart-city-technology-adoption.
Supplemental Material
Supplemental material for this article is available online.
Notes
Appendix
Association between agency size and response to 2022 survey (bivariate OLS regressions). Association between agency size and posting meeting minutes (bivariate OLS regressions). Association between agency size and posting meeting recordings (bivariate OLS regressions).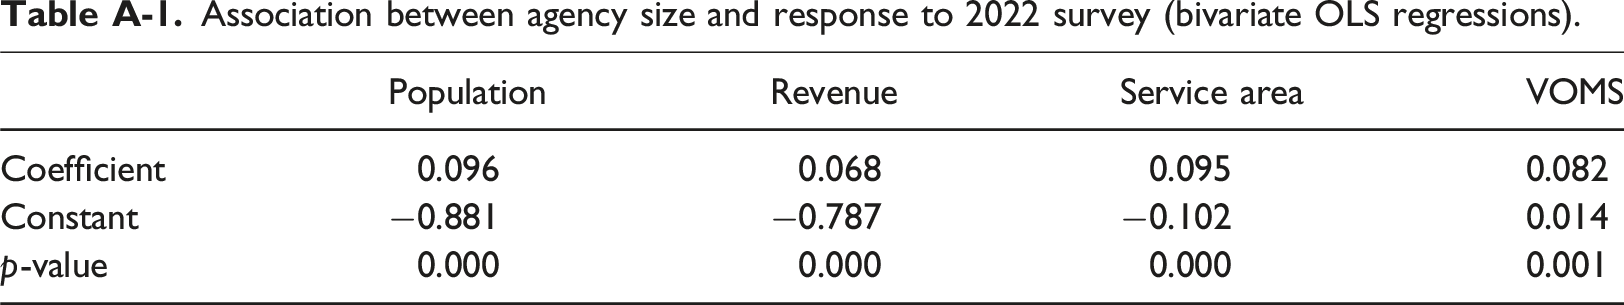
Population
Revenue
Service area
VOMS
Coefficient
0.096
0.068
0.095
0.082
Constant
−0.881
−0.787
−0.102
0.014
p-value
0.000
0.000
0.000
0.001
Population
Revenue
Service area
VOMS
Coefficient
0.006
0.014
0.006
0.001
Constant
0.881
0.739
0.934
0.952
p-value
0.584
0.112
0.533
0.902
Population
Revenue
Service area
VOMS
Coefficient
0.016
−0.005
−0.020
0.022
Constant
0.451
0.559
0.719
0.567
p-value
0.564
0.901
0.373
0.393
References
Supplementary Material
Please find the following supplemental material available below.
For Open Access articles published under a Creative Commons License, all supplemental material carries the same license as the article it is associated with.
For non-Open Access articles published, all supplemental material carries a non-exclusive license, and permission requests for re-use of supplemental material or any part of supplemental material shall be sent directly to the copyright owner as specified in the copyright notice associated with the article.