
Abstract
This paper describes a fully customizable open source method to create linked origin-destination data on commuting flows by mode at the Census tract scale by combining LODES and ACS data from the US Census Bureau. With additional work, the method could be scaled to the entire US (with a small number of exceptions) for every year from 2002 to 2019. For demonstration purposes, the paper applies this method to 2015 commuting flows in Cook County, Illinois. At an aggregate scale, the results of this application show that commuting by all modes is dominated by travel to large regional employment centres. However, the pattern is more localised for the walking mode, and focused along corridors of mode-specific infrastructure investment for the cycling and transit modes, as might be expected. The auto and work from home modes demonstrate the most distributed pattern of travel, revealing more instances of commuting to regional sub-centres than the other modes.
Introduction
Cities face a variety of urban transportation challenges in the 21st century. Managing traffic congestion, commute times and infrastructure investment and maintenance costs have traditionally been the primary focus for many transportation planning agencies and public officials in North America (Rodrigue, 2020). In recent years, growing concern over the myriad climate-related, environmental, health and social externalities from automobile-centred transportation systems has foregrounded the need for transportation planners to better understand (and plan for) non-auto modes (Woodcock et al. 2009; De Nazelle et al. 2011; Neves and Brand 2019; Lee et al. 2017; Lovasi et al. 2009; Vojnovic and Darden 2013; Frank et al., 2006; Frank et al. 2004; Wang et al. 2016; Yang et al. 2018; Lindstrom, 2008; De Hartog et al. 2010; Mueller et al. 2015). Overlaid on these issues are the even more recent shifts in commuting and migration patterns related to the pandemic, including apparent increases in remote working, migration from dense central cities to more sprawling, auto-oriented ones and attendant declines in public transit ridership (Polzin and Choi, 2021).
To make plans to address these challenges, practitioners and researchers require a high volume of spatially and temporally fine-grained data. The standard four-step and newer activity-based travel demand models (TDM) produce estimates of the volume of trips between urban zones by trip purpose and mode (National Academies of Sciences, Engineering, and Medicine, 2012; 2014; Metropolitan Washington Council of Governments, 2018). These methods often rely on expensive household travel surveys that must be deployed at long (e.g. 10-year) intervals, and thus can become quickly outdated (Toole et al., 2015; Cuauhtemoc et al., 2017). In addition, activity-based models (ABM) employ computationally demanding spatial microsimulation methods to create synthetic (disaggregate) populations from which zonal trips are estimated and could benefit from further empirical validation 1 and more lightweight, open source options (Rasouli and Timmermans, 2014; Stabler and Freedman, 2021). Recent approaches have also moved to incorporate ‘big’ data sources – such as GPS traces, smart card data from public transit systems and user-generated data from apps like Strava and CycleTracks – into the transportation demand modelling process (Pelletier et al., 2011; Toole et al., 2015; Cuauhtemoc et al., 2017; Tu et al., 2018; Zhu et al., 2019). While these data provide automated collection with greater speed, scope and variety of information about transportation patterns, significant issues remain in the application of these data sources (Milne and Watling, 2019). Big data from smartphones have a number of known issues which create challenges for researchers (Zandbergen 2009; Prelipcean and Yamamoto 2018), including detection accuracy (Chen et al., 2018; Harding et al., 2021), variation in service and phone quality (Jariyasunant et al., 2014; Harding et al., 2021), and battery drain (Jariyasunant et al., 2014). Smart cards and open source applications like CycleTracks often feature samples which over-represent younger, economically active and tech-savvy populations (Bagchi and White 2005; Milne and Watling 2019), as well as intensive app users (Chen et al., 2018).
Given these issues, it is apparent that despite the recent methodological advances in estimating travel demand, Cervero’s (2006) argument in favour of lightweight sketch planning models that focus specifically on representative and reliable measures of non-auto transportation at high spatial resolutions remains relevant. Thus, the purpose of this paper is to develop a reproducible, fully open source method for creating detailed data on commuting flows by mode for small geographic areas. We do this by combining ACS data on (origin-based) commuting by mode with LODES data on residential-employment connections to derive estimates of linked origin-destination (O-D) trips by mode. With some additional work, this method could be applied across the US at the Census tract (neighbourhood) scale for every year that LODES and the ACS/Decennial Census are both available (2002–2019, with a few exceptions), which would provide planners and researchers a vast resource for investigating transportation mode-related spatial and temporal dynamics. Here, we apply the method in Cook County, Illinois (the greater Chicago area) using 2015 data from LODES and 2013 to 2017 5-year estimates on means of transportation to work from the ACS. In this application, we estimate more than 1.7 million commuting trips over nearly 440,000 unique tract-to-tract links for the walking, transit, auto, work from home and cycling modes.
Importantly, we apply distance decay thresholds – derived empirically from National Household Transportation Survey (NHTS) data on travel distance by mode in the region – to the walking and cycling modes to redistribute (unrealistic) long distance trips to nearby tracts. Similarly, we use open source travel times (from the R package r5r) by public transit to estimate and redistribute viable transit trips. Even with these redistributions, the method preserves the total number of trips by the five modes of interest for the county from LODES, as well as the origin-based mode share percentage from the ACS for each individual tract.
The comprehensive, timely, and spatially granular estimates of travel flows by mode produced by this method can inform important future work in both transportation planning practice and research. Public planning agencies can use this technique to study aggregate travel patterns by mode without commissioning expensive travel surveys, and as an option to validate synthetically derived activity-based models. Researchers can use these data as inputs to discrete choice or spatial interaction models in order to better understand the contextual and built environment-related determinants of non-auto travel at a regional or national scale. The temporal dimension of the LODES and ACS datasets also allow for time series analysis of the determinants or changes in modal flows at the neighbourhood scale over time.
Modelling travel demand
The conventional travel demand modelling (TDM) process consists of four steps as follows: trip generation, trip distribution, mode choice and route assignment (National Academies of Sciences, Engineering, and Medicine, 2012; 2014; Metropolitan Washington Council of Governments, 2018). In the simplest version of this framework, the region is split into areal traffic analysis zones (TAZ), which are slightly larger than Census tracts. The number of trip ‘productions’ and ‘attractions’ for a given trip purpose in each TAZ are estimated based on the characteristics of households gathered from a large transportation survey, such as the NHTS, and Census data on the number of households and/or employees in each TAZ. These trip productions and attractions are then put into a spatial interaction model, along with the distance from each (origin) TAZ to every other (destination) TAZ, to produce estimates of the number of linked O-D trips (by purpose). These linked trips are classified by mode using multinomial or nested logit models, where mode choice is estimated as a function of level of service, traveller characteristics and area characteristics. Once the number of trips by mode between every origin and destination has been estimated, they are applied to the street (or transit) network using algorithms that take into account shortest paths and capacity constraints to determine the actual volume of travel on each component of the travel network (National Academies of Sciences, Engineering, and Medicine, 2012).
While these models have been widely used in transportation planning for more than half a century, the conventional approach has a number of serious issues. First, the data required to estimate trip distribution (i.e. trips between origins and destinations) and mode share is extensive and not completely available from public sources at fine-grained temporal intervals. Household travel surveys – including the federal NHTS – are expensive to deploy and generally only updated every 10 years (or more) (Toole et al., 2015; Cuauhtemoc et al., 2017). This means that traditional TDMs do not have the ability to monitor or react to fast-changing conditions or events. Similarly, TAZs are relatively large spatial units that mask fine-grained travel patterns, particularly for nonmotorized modes (Cervero, 2006). Of course, travel by nonmotorized modes – and sometimes even transit – is often not considered at all in conventional TDMs, which means that we have critically little knowledge about regional-level transportation patterns by walking and cycling (National Academies of Sciences, Engineering, and Medicine, 2012; Cervero, 2006).
More complex activity-based models (ABM) have been developed in recent years to address some of these issues (Bhat et al., 2002; National Academies of Sciences, Engineering, and Medicine, 2014; Rasouli and Timmermans, 2014; Stabler and Freedman, 2021). These models use spatial microsimulation methods to generate a dataset of synthetic individuals (Tanton, 2014). Travel is then modelled at the individual level, based on each synthetic person’s individual characteristics, household characteristics, time constraints and activities. This provides the ability to understand much finer-grained spatial and temporal characteristics of travel, including trip chains (National Academies of Sciences, Engineering, and Medicine, 2014). However, these models are computationally intensive and even more complex to implement than conventional TDMs, with few open source options (Stabler and Freedman, 2021) or ways to empirically validate the results, since the outputs occur fundamentally at the individual level (Rasouli and Timmermans, 2014). They also rely on the same expensive, intermittent travel surveys as conventional TDMs (Tajaddini et al., 2020).
Recently, the availability of new, digitally generated ‘big’ sources of data on mobility – including smartphone GPS traces, smart card ingress and egress data from transit agencies and user-created information from exercise apps such as Strava – have offered the potential to overcome the problem of costly individual-level data collection (Pelletier et al., 2011; Toole et al., 2015; Cuauhtemoc et al., 2017; Tu et al., 2018; Zhu et al., 2019; Tajaddini et al., 2020). The collection of individual-level empirical data on mobility – rather than producing a synthetic estimate – theoretically simplifies the ABM process and removes concerns over ‘ground-truth’ validation. However, smartphone-derived data have several issues which increase the difficulty of using them in TDM applications (Zanbergen 2009; Preplipcean and Yamamoto 2018). A number of barriers, for example, urban canyons, user behaviour and variation in service and phone quality (Jariyasunant et al., 2014; Harding et al., 2021), make it difficult for smartphone GPS to consistently detect user location with accuracy (Harding et al., 2021), which necessitates supplementary data processing to remove errors (Chen et al., 2018). GPS tracking, especially from specialized apps created by researchers, also leads to drain of battery life, which is a strong concern for users and limits tracking time (Jariyasunant et al., 2014). It is also not possible to ascertain which travel mode is being used simply from the trajectory of GPS traces alone.
Similar problems beset other sources of big transportation data like public transit smart cards. These are credit card-sized devices that store and process data for trip fare collection systems in public transit (Pelletier et al., 2011). Much research has employed smart card data to study public transit (Tu et al., 2018). These data can suffer from issues of representativeness and inaccuracy due to lack of random sampling and failure in technology (Bagchi and White 2005). Crucial context like trip purpose and demographics are often missing because such information is anonymized or not recorded at all (Cuauhtemoc et al., 2017; Milne and Watling 2019). These problems are characteristic of broader issues with big transportation data (Milne and Watling 2019). And, while data from workout trackers like CycleTracks and Strava provide concrete information on mode, as with many internet applications, their users are often younger, more affluent and generally more comfortable with technology than the general population (Milne and Watling 2019). These features may correlate with their displayed mode choice preferences, which makes it somewhat difficult to generalize patterns derived from these data to the wider population.
Given these issues with ‘big’ data on non-auto travel, and the limitations associated with estimating TDM and ABM in general, our method fills a number of gaps. We use open source ACS and LODES data, so the method can be easily implemented without a purpose-built travel survey. Since LODES contains data on the linked location of every individual employee-workplace at the Census block scale across the country (for every year), this approach also provides high levels of spatial and temporal granularity without the associated complexity of deriving synthetic populations (as in ABM) or relying on potentially unrepresentative samples (as in digital sources of data or smartphone GPS traces). We also directly estimate the modal split of each O-D link from ACS data, foregrounding the ability to study nonmotorized travel patterns within a regional context. The data produced by this method can also be easily combined with other (Census or locally derived) datasets to study the role of demographics, the built environment, or other neighbourhood characteristics on the volume of travel by mode. And, perhaps most importantly, the method is relatively lightweight to implement, which means it can be more easily used by citizens, transportation activists, policy-makers and land use planners. The lightweight nature of the application can also be useful for transportation planners in sketch planning contexts, for specific studies of nonmotorized travel, and also as a part of the empirical validation of ABM results.
Methods
Data
This method described in this paper is based on two primary open datasets prepared by the US Census Bureau: (1) the Longitudinal Employer-Household Dynamics (LEHD) Origin-Destination Statistics (known as LODES) and (2) the American Community Survey (ACS) 5-year estimates (Manson et al., 2020). LODES is collected primarily from the unemployment insurance reporting system and delineates residential and workplace locations from these (and other federal administrative) records. It is important to note that since the employment location is reported by employers, in some cases it may not be the exact location where a given employee physically works (Graham et al. 2014), for example, in the case of large institutional employers, which Murikami (2007) also identifies as a particular concern for using the early LEHD data for block-level transportation analysis. LODES also does not denote whether a given origin-destination link is actually taken as a trip. However, the method presented in this paper helps deal with that uncertainty by combining these employee–employer links with data on commuting by mode (including, implicitly, the percentage working from home), thus providing an estimate for actual trips taken across each O-D link.
Counts of the individual employee–employer links are aggregated to the Census block level for every year from 2002 to 2019 2 to create the basic data product (Graham et al. 2014). Within LODES there are three primary datasets as follows: (1) the Origin-Destination (OD) file, which contains job totals associated with a linked residence → workplace flow; (2) the Workplace Area Characteristics (WAC) file, which contains job totals summed by the workplace block and (3) the Residence Area Characteristics (RAC) file, which contains job totals summed by residence block. Each of these files contains more detailed breakdowns of the job counts by various demographic characteristics. Since this method is concerned primarily with creating linked origin-destination data on commuting by mode, the OD file is used, which (due to its specificity) contains only coarse demographic information, grouping jobs into large-scale age, earnings and industry categories. For this paper’s application, we used the total number of jobs for each linked origin-destination Census block (field ‘S000’) from the LODES 2015 ‘JT00’ (all jobs) OD file. We summed these block-level flows within their nesting Census tracts to match the scale of analysis of the ACS mode share data.
Unlike LODES, which relies fundamentally on administrative records, the ACS is a sample survey that is conducted at regular intervals. In order to produce a spatially representative estimate, responses for a given geographical unit are averaged over time; the smaller the unit, the longer the timespan needed to produce a reasonable estimate. At the Census tract scale, 5-year estimates (averages) are used to provide figures with the lowest possible margin of error, although error estimates can still be quite large (see the Margins of Error section in the Supplementary Material for more detail). The ACS collects a variety of information on demographics, housing conditions, and employment, but our interest here is solely on commuting information. The ACS questionnaire asks respondents to describe the means of transportation used to travel to work ‘in the last week 3 ’ (Graham et al. 2014). For this application, we used the percentage of workers 16 and over who use each of these five means of transportation to work – ‘car, truck, or van’, ‘public transportation (excluding taxicab)’, ‘bicycle’, ‘worked at home’ and ‘walked’ – by Census tract from the 2013 to 2017 ACS.
Since the survey is administered to people at their place of residence, the ACS counts of commuting by mode are tabulated at the place of residence only, with no information on the destination of these trips. Thus, the purpose of this paper is to combine this origin-based information on commuting by mode from the ACS with the total linked origin-destination flows from LODES to create estimates of commuting flows by mode over each individual O-D link.
Naive method - equal distribution
The most straightforward approach to applying origin-based rates of commuting by mode to the linked O-D flows from LODES – which we will call the ‘naive’ method here – is to multiply each mode’s ACS commuting share (

While this method produces estimates of flows by mode that preserves the correct share of commuting by mode leaving a tract, it unfortunately assumes that this share is equally distributed across all destinations (
Weighted method – distance and travel time redistribution
The primary intuition of the weighted method is to weight estimated flows (
Weighted method for walking and cycling
For walking and cycling trips, we first calculate the street network distance (in km)

The calculation of

This method necessarily produces fewer flows than are observed in the original LODES data because long flows are removed and medium-distance flows are discounted by

Now, we find the set of ‘nearby’ tracts
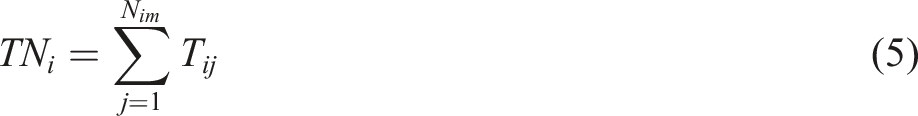
We also sum
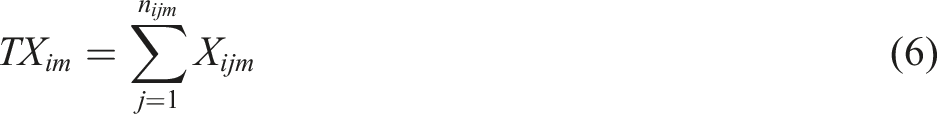
Now, we divide

This is added to the weighted number of flows found in equation (3) to produce the final redistributed weighted estimate of modal flows on each link (

This approach has a couple of key advantages. First, excess trips are not evenly redistributed to nearby tracts, which would be unrealistic. Instead, the redistributions follow the pattern of the full LODES commuting data. This means that if a given
Defining parameters for weighting walking and cycling flows
How do we obtain estimates for the
The slope term for these curves were used as the
Weighted method for transit times using r5r
For the transit mode, discount and redistribution of excess flows by distance alone is not appropriate, as transit travel occurs at particular nodes and along particular networks. In this case, we need to know which links represent ‘realistic’ potential transit flows in order to create the transit-relevant set of ‘nearby’ tracts (
How do we obtain estimates of realistic transit links? The R package r5r (version 0.6.0) is used to query transit travel times to and from each tract centroid in the study area. This package, which stands for ‘Rapid Realistic Routing with R5 in R’ (Pereira et al., 2021), takes as inputs the General Transit Feed Specification (GTFS) and OpenStreetMap (OSM) data for a particular region and uses that data to calculate transit travel times from a set of origins to destinations directly in R (similar to OpenTripPlanner, but operable entirely in R). The user specifies a range of parameters, including the maximum walking distance (i.e. to a transit station) threshold, the maximum total travel time threshold, the start date/time and a fuzzy travel time window
9
for departure times. In this case, the outputs are based on the trip whose waiting times are closest to average within the departure window. Importantly, the ‘breakdown’ parameter provides a detailed output for each link, including whether or not transit was actually used for a particular link (i.e. if the calculated transit travel + waiting + transfer times
Results
In order to gauge (1) how well the method is preserving the data inputs and (2) the extent to which the results generally match other available sources of modal commuting data, we employ several internal and external validation approaches, which can be accessed in the Validation section of the Supplementary Material. Beyond validation, we can also assess the characteristics of the estimated flows by mode in order to better understand travel patterns in Cook County. Figure 1 shows the distribution of estimated flows by distance band and mode. Given its small overall mode share percentage (4.27%), walking makes up a fairly considerable proportion of trips within 5 km: 28.87%. Cycling trips are most heavily concentrated in the 2–5 km band, making up 3.62% of all trips at that distance compared to a 1.07% overall mode share. Transit trips, which aren’t as heavily structured by distance, are most concentrated in the 1–20 km range. Transit demonstrates a 23.25% mode share for trips of these distances compared to an 19.40% mode share overall. Interestingly, across all distances – even within 1 km – auto travel outcompetes all other modes. Histogram showing distribution of weighted trips by mode and distance.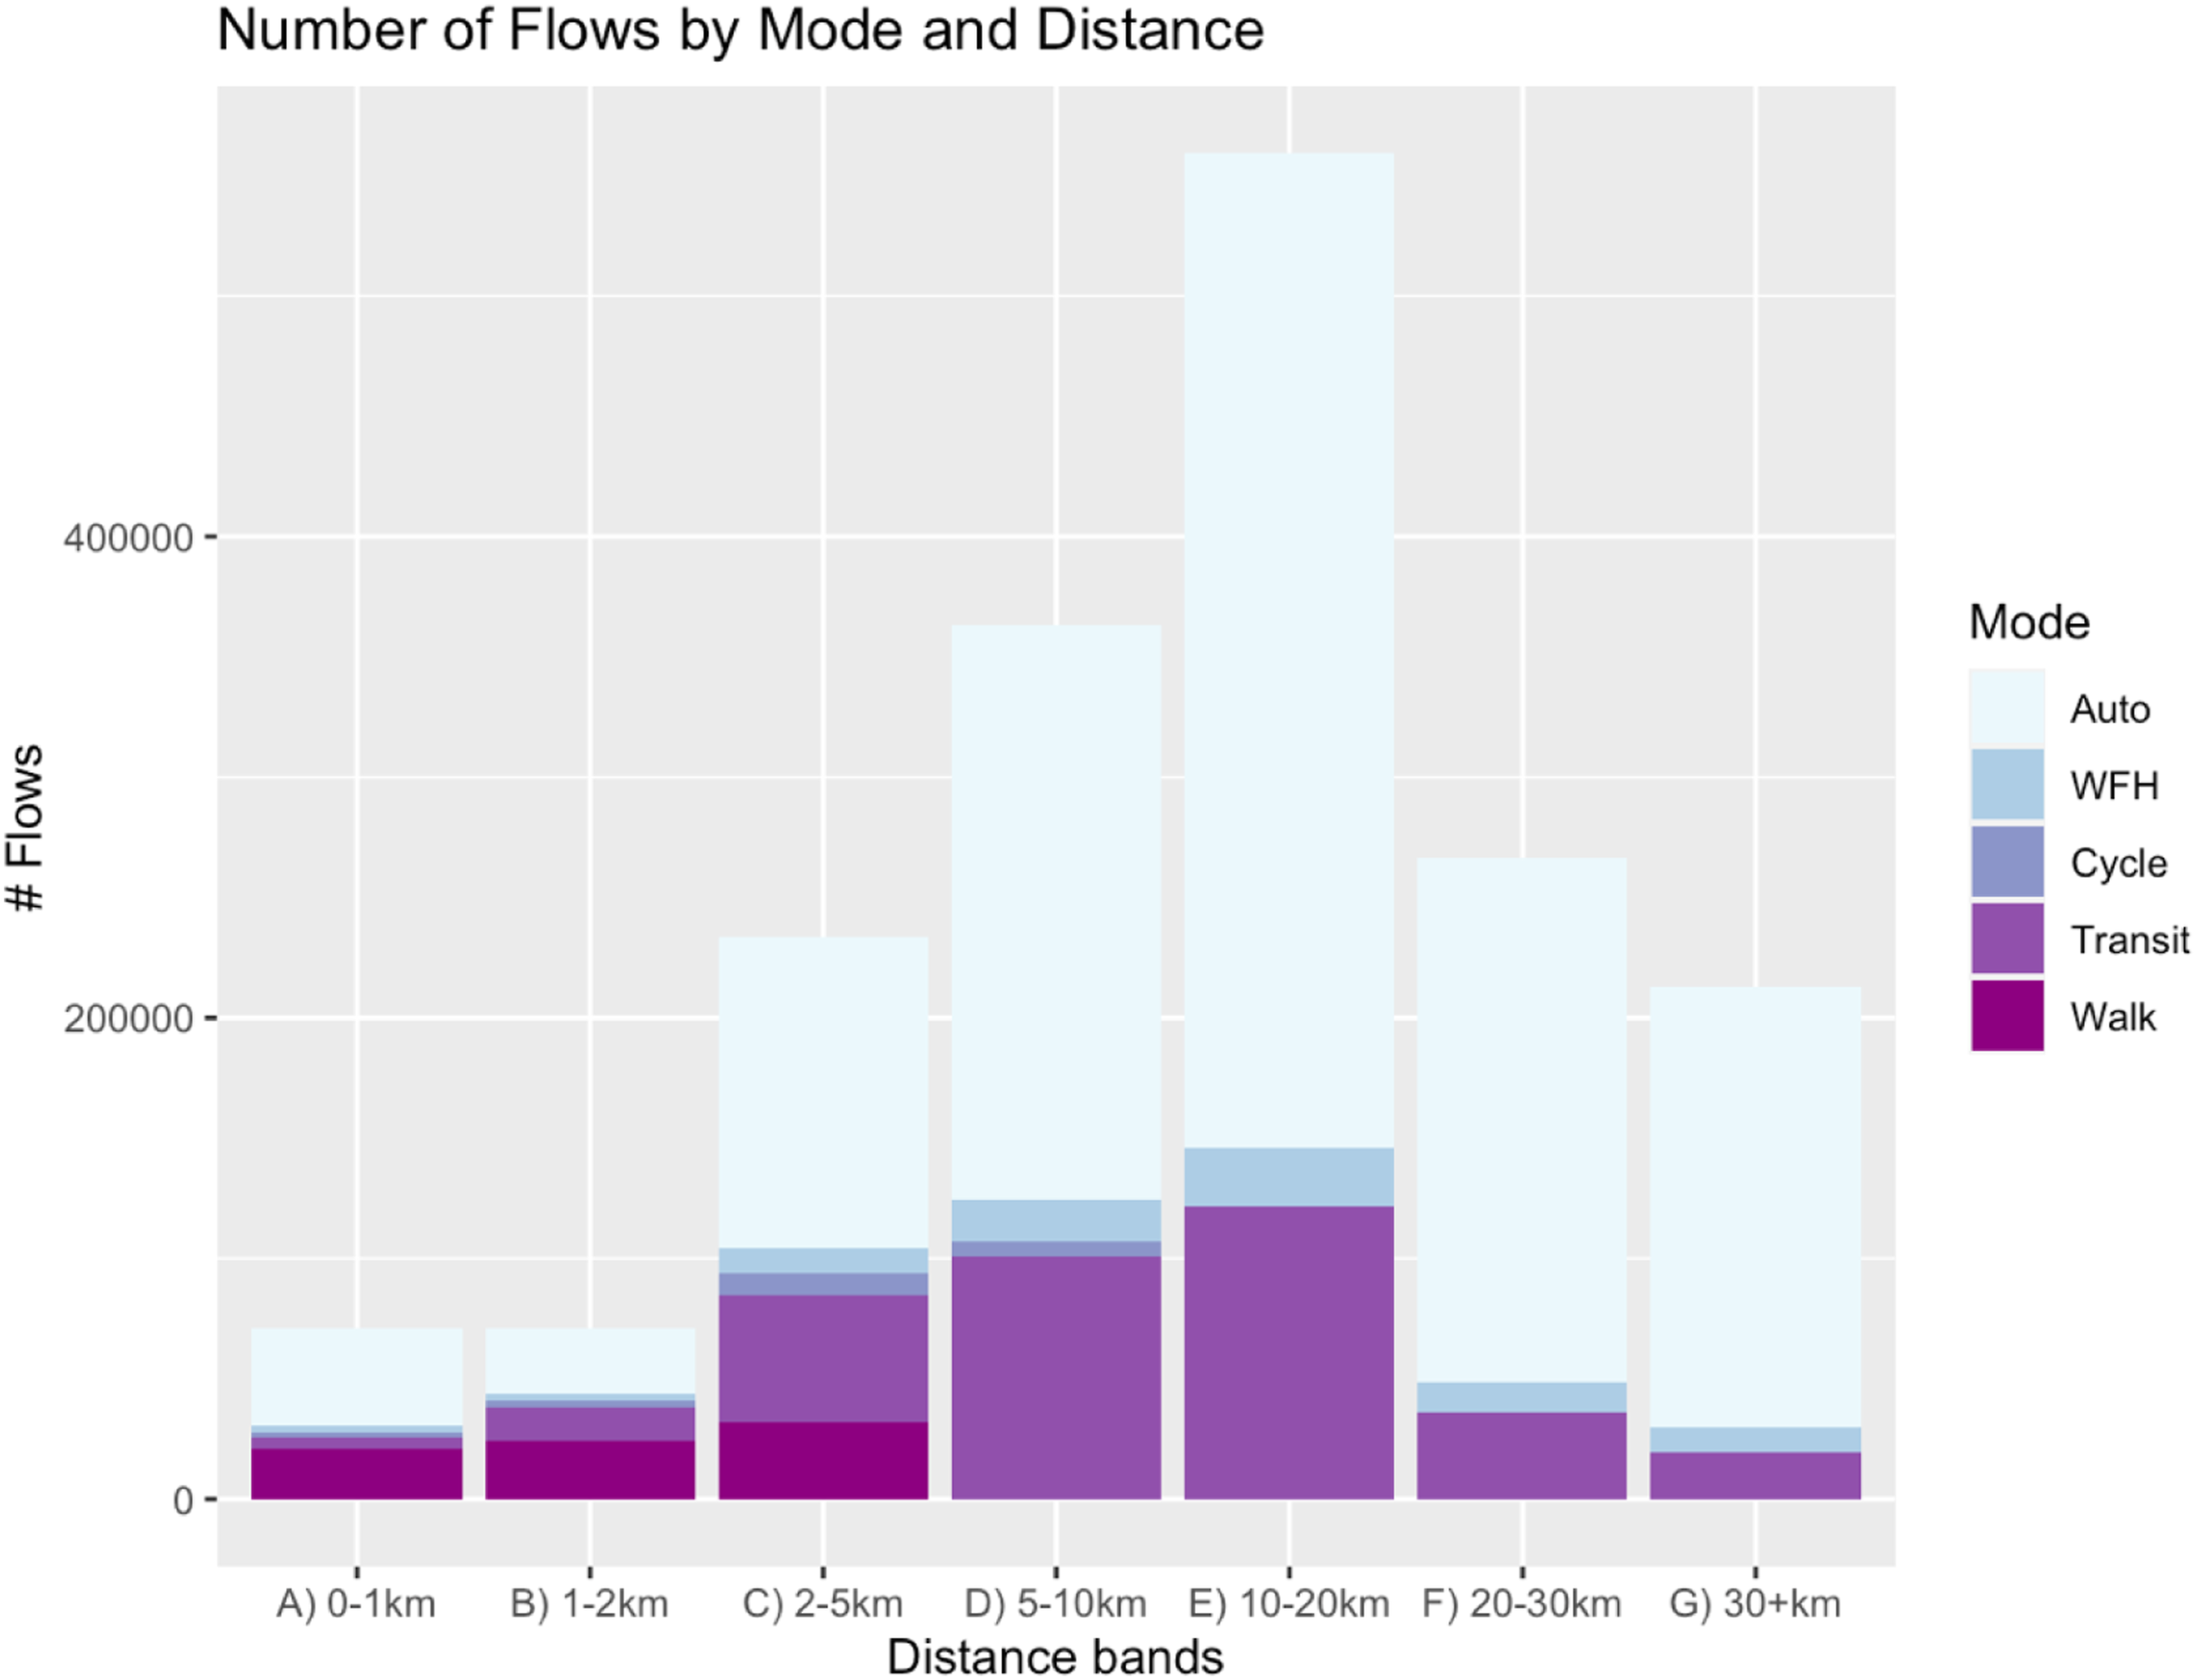
Beyond these descriptive characteristics, the most useful application of this method is to examine the spatial patterns of linked commuting flows by mode. Figure 2 shows maps of the weighted flows for links with the largest 1000 trips (to increase visual clarity of the key patterns) for each of the five modes of interest, created using the ‘FlowMapper' tool (flowmapper.org). Commuting by auto is the most spatially dispersed, which is not surprising given that it is the most common mode of travel (both in Cook County and in the United States overall) and that auto infrastructure provides for rapid travel over long distances and is widely distributed and heavily invested in. Activity concentrates on the Loop, with the largest flows coming from neighbourhoods/suburbs such as Mount Greenwood, Edison Park, Midway and the South Loop. At the same time, we can observe a more widespread distribution of employment (in-commuting) sub-centres in the northwest portion of the county, for example, Schaumburg. Five panel map showing flows for links with largest 1000 trips for auto (top left), work from home (top middle), transit (top right), cycling (bottom left) and walking (bottom right). Arrows denote direction of the flows.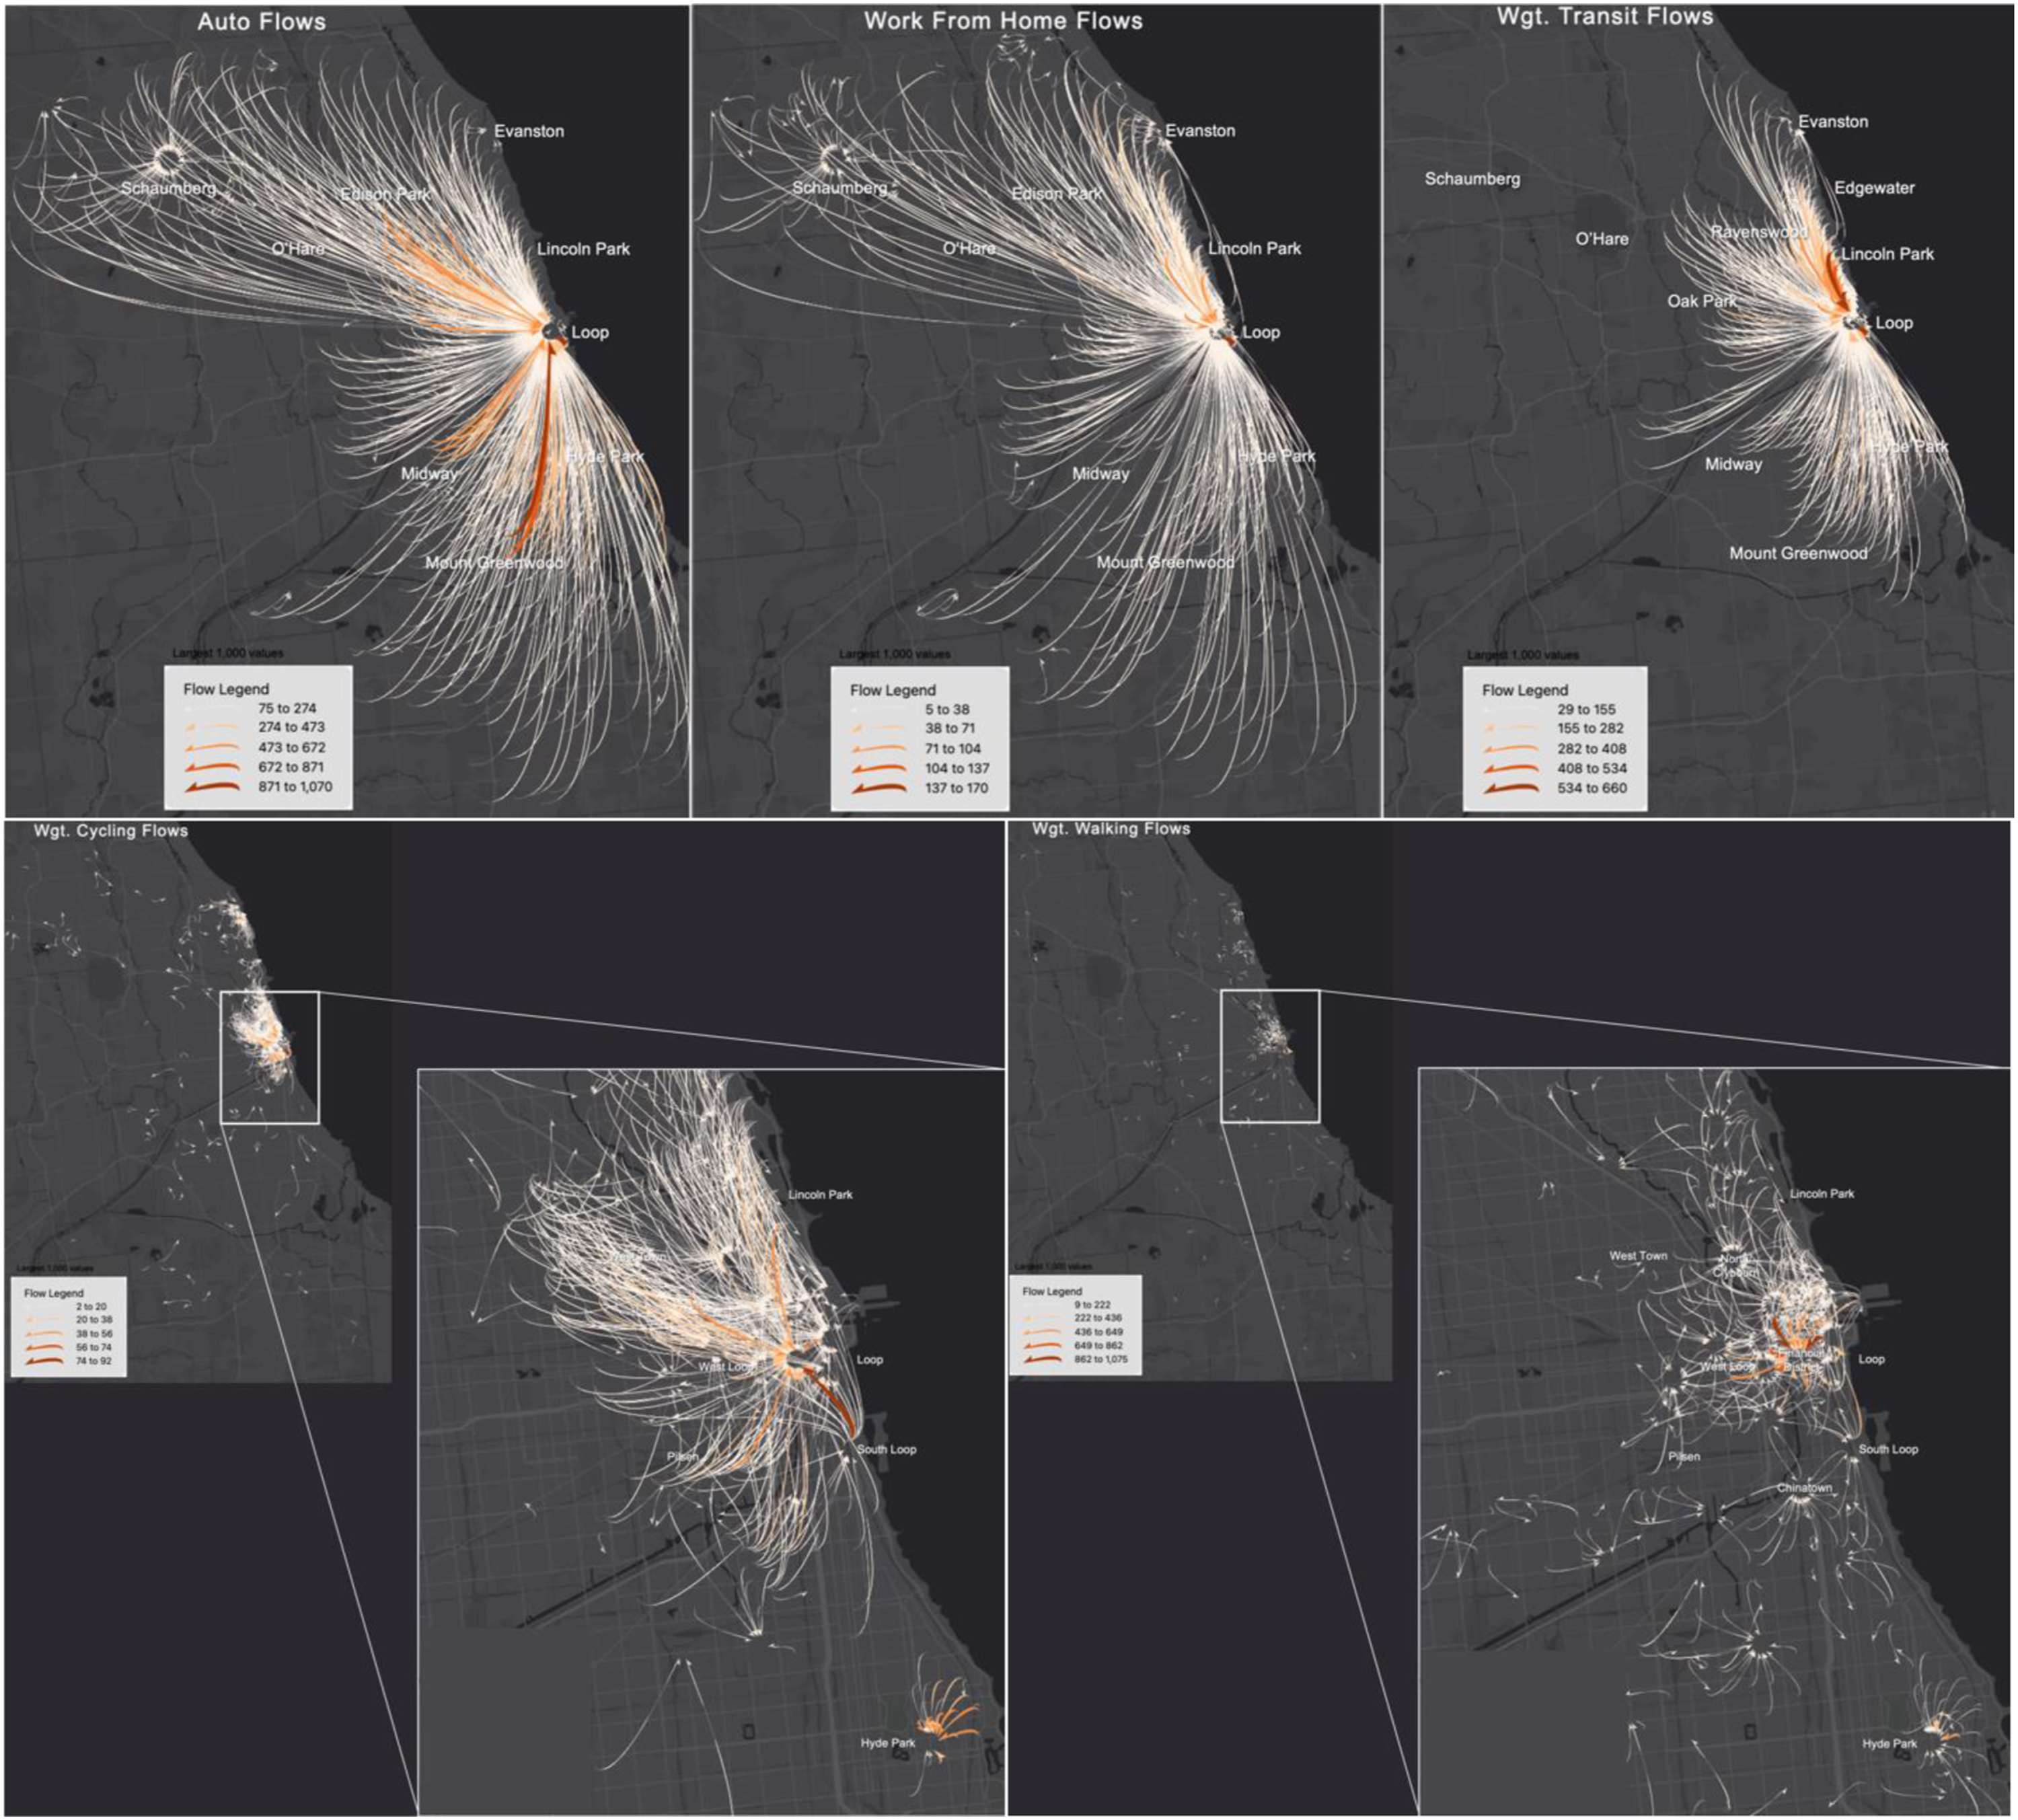
The pattern is generally similar for working from home, with a much heavier concentration of activity from near northside neighbourhoods like Lincoln Park to the Loop. Substantial ‘flows’ to Evanston (Northwestern University) are also visible. This makes sense given the relatively high concentration of professional, technical and creative occupations in these neighbourhoods. For transit, the overall pattern is relatively dispersed, but the Loop remains the dominant destination, with the largest flows coming from areas well-serviced by bus – including the South Loop and the near north, for example, Lincoln Park and Lakeview – as well as areas served by specific CTA ‘L’ lines such as Edgewater (Red Line), West Town, Oak Park (Blue Line) and Ravenswood (Brown Line). Evanston, on the CTA’s Purple Line, also shows up as a prominent commuting destination.
For cycling, the pattern displays some inhibition distance, which makes sense given the method’s parameters as well as the basic logic of the cycling mode, that is, walking is likely preferable for very short trips. We see the major university/employment centres, that is, the Loop (centre city), Hyde Park (University of Chicago) and Evanston (Northwestern University), show up strongly as cycling commuting destinations, dominated by commuting trips to the Loop. The largest of these flows come from gentrifying, young neighbourhoods such as Pilsen, Old Town, Lincoln Park, Lakeview, West Town and the South Loop, which matches our intuition about cyclists. These areas have also received some of the highest profile investments in cycling infrastructure in the city, including the Lakefront Trail, protected bicycle lanes on the Milwaukee Avenue bicycle corridor, and the 606/Bloomingdale Trail, a previously abandoned elevated train line that has been renovated into a new pedestrian and cycling trail.
Finally, for the walking mode we see the largest concentrations of activity in major employment centres that are also located in walkable neighbourhood contexts, for example, in Hyde Park and the Loop. Interestingly, smaller (more walkable) sub-centres in nearby neighbourhoods are also evident, including the West Loop, Chinatown, South Loop and the North/Clybourn retail corridor. The overwhelming regional pattern, however, consists of nearby residential neighbourhoods commuting to the Loop (in particular, the financial district) by walking.
Discussion and conclusions
In this paper, we have developed a fully customizable method for estimating the number of commuting flows by the walking, cycling, transit, work from home and auto modes to and from every individual Census tract in Cook County, IL by combining origin-based information on commuting by mode from the ACS with the linked origin-destination flows from LODES. This method – which is implementable through the supplementary code available (https://github.com/kcredit/LODES-ACS-commuting-flows) – provides a useful resource for transportation planners, active transportation advocates and researchers to study spatial and temporal variation in auto and non-auto travel patterns.
Indeed, the resulting spatial patterns of travel by mode reveal a number of interesting characteristics. As expected, we observe high volumes of trips by all modes to regional employment centres such as the Loop, Evanston and Schaumberg. The auto and work from home modes provide the most distributed patterns of commuting, with prominent sub-centres in more outlying areas of the county (like Schaumberg). Outside of these areas, additional mode-specific patterns also emerge. The unique impact of cycling infrastructure is apparent in the Milwaukee Avenue bicycle corridor, while the pattern of transit trips tends to follow the largest Chicago Transit Agency (CTA) ‘L’ lines, including the Red, Blue, Purple and Brown Lines. A high volume of transit commuting to the Loop is also concentrated in the well-connected near northside neighbourhoods, which are served by a large number of frequent bus lines.
At the same time, the approach taken in this paper can be extended in a variety of useful ways. Given sufficient computational power, this analysis could theoretically be scaled to the state- or national-level for most years between 2002 and 2019 in order to better understand intra- and inter-regional travel patterns. Of course, expanding beyond the application here would require some additional work. Our method for estimating transit flows relies on r5r travel time data, which is available only in regions with large-scale transit networks. The procedure used to fit distance decay curves for the walking and cycling modes currently comes from 2009 NHTS data specific to the large cities in the region of the country in which Chicago is located. If this method were expanded to additional regions, region-specific curves would need to be fit, or a more generalised estimate used based on state or national data. Calculating tract-to-tract street network distances at scale could also be quite computationally expensive using r5r, and would require the manual download of area-specific street network data from OSM, so simple great circle distance calculated directly from the latitude and longitude coordinates of tract centroids may be preferable in that case 10 .
Beyond characterizing aggregate patterns, this method could also be particularly useful for analysing specific spatially granular corridors and conditions of interest, for example, specific neighbourhood origin-destination relationships. Fine-grained temporal analyses, particularly in terms of changes in the work from home patterns, would also be insightful to examine in forthcoming iterations of the LODES data (2020–on) in order to better understand the changes in commuting due to the pandemic-era shift to remote work. Demographically, we could also look at finer-grained subsets of commuters based on existing breakdowns in the LODES O-D data based on age, income and broad industry classification. Further external validation for the walking and cycling outputs could be done by comparing to other large sources of data such as Strava – although these data differ in terms of purpose (i.e. commuting vs. recreation), additional validation would be interesting and useful to users of both products.
Finally, the data created by this paper’s method could be used as an important input to future research employing spatial interaction models to explicitly study the competing importance of various built environment and demographic ‘push’ and ‘pull’ factors on tract-level commuting. The role of built environment factors on commuting by mode, in particular, is one of the most-studied topics in urban and transportation planning, and could benefit from a more comprehensive analysis using this method’s outputs.
Supplemental Material
Supplemental Material - A method to derive small area estimates of linked commuting trips by mode from open source LODES and ACS data
Supplemental Material for A method to derive small area estimates of linked commuting trips by mode from open source LODES and ACS data by Kevin Credit and Zander Arnao in Environment and Planning B: Urban Analytics and City Science
Footnotes
Declaration of Conflicting Interests
The author(s) declared no potential conflicts of interest with respect to the research, authorship, and/or publication of this article.
Funding
The author(s) received no financial support for the research, authorship, and/or publication of this article.
Supplemental Material
Supplemental material for this article is available online.
Notes
References
Supplementary Material
Please find the following supplemental material available below.
For Open Access articles published under a Creative Commons License, all supplemental material carries the same license as the article it is associated with.
For non-Open Access articles published, all supplemental material carries a non-exclusive license, and permission requests for re-use of supplemental material or any part of supplemental material shall be sent directly to the copyright owner as specified in the copyright notice associated with the article.