
Abstract
Accessibility and mobility are key concerns of sustainable cities, especially in the Global South, due to the strong social inequalities. This paper contributes to the literature on mobility segregation by focusing on the potential movement of social groups in the city. We conceptualize potential movement as a network centrality, acting as an indicator of population movement when performing daily activities (working, studying, shopping, etc.). This paper’s objectives are (a) to identify the inequalities in potential movement of different social groups performing their daily activities; (b) to propose a network-based method to enhance our understanding of mobility inequalities; and (c) to address the context of medium-sized Latin American cities. We adopt a modified Betweenness Centrality model (Potential Movement) on a directed and weighted network. Our results show a similar pattern for both cities, with the CBD concentrating the potential movement for all groups; however, several inequalities were found. The high-income and white groups show higher levels of potential movement in the CBD and the low-income and non-white groups have a more distributed potential movement pattern, implying longer journeys to reach jobs and services. Income and race have shown to play a crucial role in those inequalities.
Introduction
Mobility and accessibility are key conditions for the development of sustainable and socially inclusive cities. Unequal access to infrastructure and services often results in poor health, inflicts environmental damage, and locks people in cycles of poverty for generations (UN-Habitat, 2022). Urban authorities make decisions that impact public transportation systems, the built environment, land uses, and the sustainability of services delivery. As such, planners should adopt multidimensional approaches to tackle the multiple spatial, social, and economic factors that lead to social exclusion, marginalization, and negative environmental impacts. Planning accessibility and mobility is an important mission of urban planning, especially in countries of the Global South, due to the strong socio-spatial inequalities (Pereira et al., 2019). Processes of urban socio-spatial segregation have led to an unequal appropriation by different population groups of the means to access urban facilities and to move around cities.
Previous research explores social exclusion from a transport perspective, emphasizing the importance of access to opportunities (Bittencourt et al., 2021; Boisjoly et al., 2020). Some studies focus on individual mobility experiences using detailed data (Moro et al., 2021; Netto et al., 2018; Osth et al., 2018). In network theory, few studies have approached socio-spatial segregation. It has been conceived as the lack of co-presence of different individuals in public spaces (Legeby, 2008; Vaughan, 2007). This paper aims to further this effort by providing methodological and substantive contributions. It introduces a new methodology to analyze socioeconomic, racial, and spatial inequalities, and it advances the discussions on mobility-related inequalities in Latin American cities.
This paper addresses the problem of socio-spatial inequalities in population mobility, focusing on the potential movement of social groups in the urban environment. In absence of actual movement data, we estimate “potential movement” as a network centrality measure acting as an indicator of population movements when performing daily activities (e.g., working, studying, and shopping). Betweenness Centrality (BC) is a network centrality measure that assesses the role of nodes as intermediaries in information exchanges (Freeman, 1977), and has been applied to analyze various networks, including street networks (Kirkley et al., 2018), consumer flows (Buzzacchi et al., 2021), and urban traffic prediction (Zhao et al., 2017).
This paper’s objectives are (a) to identify the inequalities in potential movement of different social groups performing their daily activities; (b) to propose a novel network-based method to enhance our understanding of mobility inequalities; and (c) to address the context of medium-sized Latin American cities.
The proposed method considers origins, destinations, and associated weights based on attractiveness and population size, using a modified BC model based on Krafta (2014). The innovation lies in the application of a network measure for comparing the performance of different social groups and different spatial systems (cities) using only available public and open data. We implement this approach in Santa Maria and Pelotas, two medium-sized cities in Southern Brazil, a less explored category regarding mobility and accessibility inequalities.
The subsequent sections review relevant literature on mobility inequalities, network models, and movement. We then detail our methodology, case studies, and present the results. The article concludes by summarizing findings, contributions, and suggesting directions for further research.
Related work
Inequalities in accessibility and mobility in Brazilian cities
Accessibility encompasses several components, such as land use, transportation, temporal, and individual, and describes the ability of social groups to reach opportunities (Geurs and Van Wee, 2004). Movement (or mobility), on the other hand, refers to people’s ability to move through space (David and David, 2020), and studies examine the actual travel patterns that people engage in daily. The concept of accessibility is different but complementary to that of urban mobility. Accessibility and mobility have gained significance in segregation studies (Bittencourt et al., 2021; van Kempen and Wissink, 2014). Segregation is no longer limited to residential areas, it extends beyond one’s home location (Legeby, 2008; Osth et al., 2018). Understanding segregation requires a more thorough understanding of behavior and mobility beyond residence, including individual motivation for visiting different places and encountering other groups of people (Moro et al., 2021).
According to Verlingheri and Schwanen (2020), a host of societal developments have thrown questions of transport and mobility justice into sharp relief in recent years. The impetus to build “fast” transport systems in urban areas, especially in the Global South, has been questioned, as they tend to benefit selected social groups and places (much) more than others.
In Brazil, Vasconcellos (2018) highlights a discriminatory mobility system. According to the author, public transport conditions are substandard in most cities, mobility policies favor car use through subsidies and incentives, and low-income citizens face daily unreliable bus systems, long commutes, and discomfort. This results in escalated mobility-related negative externalities in larger cities, including pollution and congestion.
In major Brazilian metropolitan regions, inequalities are linked not only to income but also to ethnicity, education, and employment. High-quality areas are inhabited by white people with higher income and educational level, while low-quality areas are occupied by non-white people with lower income and educational level (Ribeiro, 2016). Silveira et al. (2022) conducted a survey in three Brazilian capitals and found that race is a significant factor in gender mobility discussions. A comprehensive study of major Brazilian cities (Pereira et al., 2019) reveals unequal distribution of access to jobs, health, and education. Opportunities concentrate in central urban areas with robust transportation networks, while urban peripheries face limited access. Additionally, the research highlights that white and high-income individuals consistently enjoy better access to opportunities compared to black and low-income individuals.
The studies mentioned focus on large cities and metropolitan regions, not including medium-sized cities, hence the importance of also considering this typology of cities.
Movement and network models
Since the 1980s network theory has been introduced in urban analysis showing that road networks not only play a central role in the spatial organization of urban areas (Hillier and Hanson, 1984) but are important to the dynamic processes occurring in these areas (Porta et al., 2009). Network theory allows connecting structural properties of the street network to social attributes of the urban environment. Conceptualizing the urban system as a spatial network allows exploring not only the properties of locations (spaces), but also their relational properties, that is, the patterns of interaction, communication, and exchange between spaces (Batty, 2013).
Pedestrian and vehicular movement in cities depends on several factors, in which the street network configuration plays an important role (Marshall, 2005). Some studies even consider this configuration as the primary generator of pedestrian movement patterns, and the attractors (i.e., destinations, as retail and service uses) acting as multipliers in the basic pattern (Hillier et al., 1993).
In urban network analysis, traffic and pedestrian flow is typically measured with betweenness centrality (BC), which quantifies the frequency of an element occurring along the shortest paths between any two elements (Freeman, 1977). BC operates on two assumptions regarding information transmission within the network: (a) information flows through the network shortest paths, and (b) all pairs of elements exchange an equal amount of information (Kirkley et al., 2018). However, BC often yields unsatisfactory results due to neglecting network geometrical features (path length) and spatial interaction resulting from the location of activities (origins and destinations), important factors to estimate exchanges in urban network analysis (Wu et al., 2022).
With a focus on urban studies, Krafta (1994) adapted Freeman’s BC to incorporate land use and distance factors in its formulation. Krafta’s model considers two more relationships: (a) that centrality would be affected by the length of each shortest path, in which case a specific spatial unit’s centrality would be higher in shorter paths and lower in longer ones, and (b) centrality would be affected by the interaction between the attributes (weights) of the origin and destination that the referred spatial unit is in between. It is assumed that the weights of the spatial units can give more or less relevance to each origin/destination pair, and, by extension, more or less centrality to spatial units in between (Krafta, 1994). The model can describe probable paths of interaction within the urban spatial network, considering the shorter distances and the variable ability of different urban locations, defined as origins and destinations, in generating attractiveness and spatial interaction.
Other scholars have made similar efforts to improve BC by including distance-decay effect and human activity distribution to estimate traffic flow (Gao et al., 2013; Ye et al., 2016; Wu et al., 2022). Yet, these endeavors remain insufficient in capturing the full spectrum of potential interactions in spatial networks. There is still a gap for approaches that measure and compare network centrality based on multiple spatial interactions across various types of origins and destinations, considering land uses, socioeconomic, and demographic factors. This opens possibilities for exploring different combinations and complementarities among these factors, improving our understanding of the inequalities in the movement of distinct population groups.
Materials and methods
The proposed methodology is structured in five steps. First, the cities are modeled as street segment networks, combining their spatial network attributes (i.e., connectivity and relative distances) with social and functional attributes (i.e., population and services). Then, Potential Movement (PM) is calculated for the different social groups based on income and race, and for the entire population, here called General Potential Movement (GPM). The normalization of PM and GPM values is performed in a third step. The differences in PM between social groups are calculated in a fourth step. Finally, the last step consists of the visual and statistical analysis of the results.
Potential movement model
The Potential Movement (PM) model is a modified BC based on Krafta (2014) with the following assumptions: (a) pairs of locations act as origins and destinations for the social groups to access opportunities; (b) destinations (e.g., work, education, retail, and services locations) present a specific spatial pattern following their own locational choice criteria; (c) origins (i.e., residential locations) of different social groups (classified by income and race) present specific spatial patterns and trends according to sociodemographic profile, land prices, neighborhood characteristics, self-segregation, etc.; (d) a spatial network with specific configuration and hierarchical characteristics connects origins and destinations; (e) from the interaction of these three elements (i.e., origins, destinations, and network), uneven patterns of movement and flows emerge on the network for each social group, based on its relative position and the location of destinations; (f) it is possible to estimate the location and intensity of these selective interactions by measuring the network centrality for different social groups, taking into account the characteristics of the network, origins, and destinations.
For a street network represented by a graph G, where all i components describe origin locations and all j components describe destination locations, Potential Movement (PM) is formally expressed as

In the model, the PM indicator is calculated separately for each social group (i.e., high income, low income, white, and non-white origins). However, when the PM is calculated for the entire population (i.e., all social groups as origins), it results in the General Potential Movement (GPM) indicator, a reference value for the city.
Potential movement differences
To allow the comparison between the different population groups within the same urban system, the resulting PM values of each group (or set of origins) were normalized by the sum of the group’s weights. This removed the effect of the given population group size in the model.
To assess the inequalities between the PM of the different population groups, the Potential Movement Differences (PMD) indicators were calculated. The PMD is the difference between the specific group PM value (e.g., PM of high-income group) and the GPM value:

The PMD results contain positive and negative values. When the segments have positive values, the PM value of the social group is higher than the GPM. Street segments with negative values mean that the group’s PM is lower than the GPM. The PMD allowed for the evaluation of how the different population groups perform in their PM in relation to the city’s GPM, both spatially and in intensity.
The PMD results have considerably different numerical ranges among the different social groups, and the positive and negative values follow a power law distribution. Therefore, PMD results were grouped into four classes: high positive difference (HPD) for the 1% higher positive values; positive difference (PD) for the 10% higher positive values; negative difference (ND) for the 10% lowest negative values; and high negative difference (HND) for the 1% lowest negative values.
Data
To construct the spatial network, we obtained road network data from OpenStreetMap, 1 and applied simplifications to obtain the publicly available street network. This entailed the removal of service access roads, planned roads, and roads under construction. Furthermore, as the model in its current state does not differentiate alternative transportation modes, the network segments used exclusively by a single mode, that is, pedestrian streets and motorways, were excluded, for it could potentially bias the results by creating unintended network connections and distortions in the analysis. The resulting street networks were segmented by dividing streets into sections between two intersections.
To establish the destinations within the spatial network, we utilized the CNEFE (National Register of Addresses for Statistical Purposes) database from the Brazilian Institute of Geography and Statistics (IBGE), 2 which provides information on the geographic coordinates of various types of establishments. This dataset encompasses commercial, service-related, institutional, educational, and medical categories. The total number of establishments in each street segment was used as weight for destinations.
Data from the 2010 Population Census by IBGE 3 were the basis for the origins. We categorized household income into low, medium, and high groups, according to the definition by the Brazilian Secretary of Strategic Affairs (2012): low income (monthly per capita income less than ½ minimum wage), medium income (between ½ and 2 minimum wages), and high income (more than 2 minimum wages). Racial categories included white and non-white individuals (i.e., black, brown, indigenous, and Asian). Population and household counts in each street segment determined the weight for origins.
We used a set of geo-processing tools to transfer information regarding origins (from census tracts’ polygons) and destinations (points with x, y coordinates) to the street segments. The origin data extracted from census tracts was evenly divided among all segments within the respective census tract with the use of spatial join tools. The destination points were snapped to their nearest street segment and aggregated to calculate a total. After adding weights to the spatial network, we conducted our analysis using the Graph Analysis of Urban Systems (GAUS) script, as implemented in the QGIS environment (Dalcin and Krafta, 2021).
Case studies
To test and demonstrate the methodology, the research was carried out on two medium-sized cities in Southern Brazil, Santa Maria and Pelotas. The cities were selected based on the following pre-established criteria: (a) both cities present a predominantly monocentric spatial structure, with a concentration of employment and services in the Central Business District (CBD); (b) they are not in conurbation with other municipalities, reducing the edge effect in the network analysis (Gil, 2017); and (c) they are medium-sized Brazilian cities (around 300,000 inhabitants), allowing a minimum spatial complexity in the system.
The city of Pelotas has 328,275 inhabitants (Brazilian Institute of Geography and Statistics [IBGE], 2011) and is divided into seven administrative regions, while Santa Maria has 261,031 inhabitants (Brazilian Institute of Geography and Statistics [IBGE], 2011) and is divided into eight administrative regions. Figure 1 locates the two cities in Brazil and presents their administrative regions, including their CBDs. Location of the studied cities and their administrative divisions.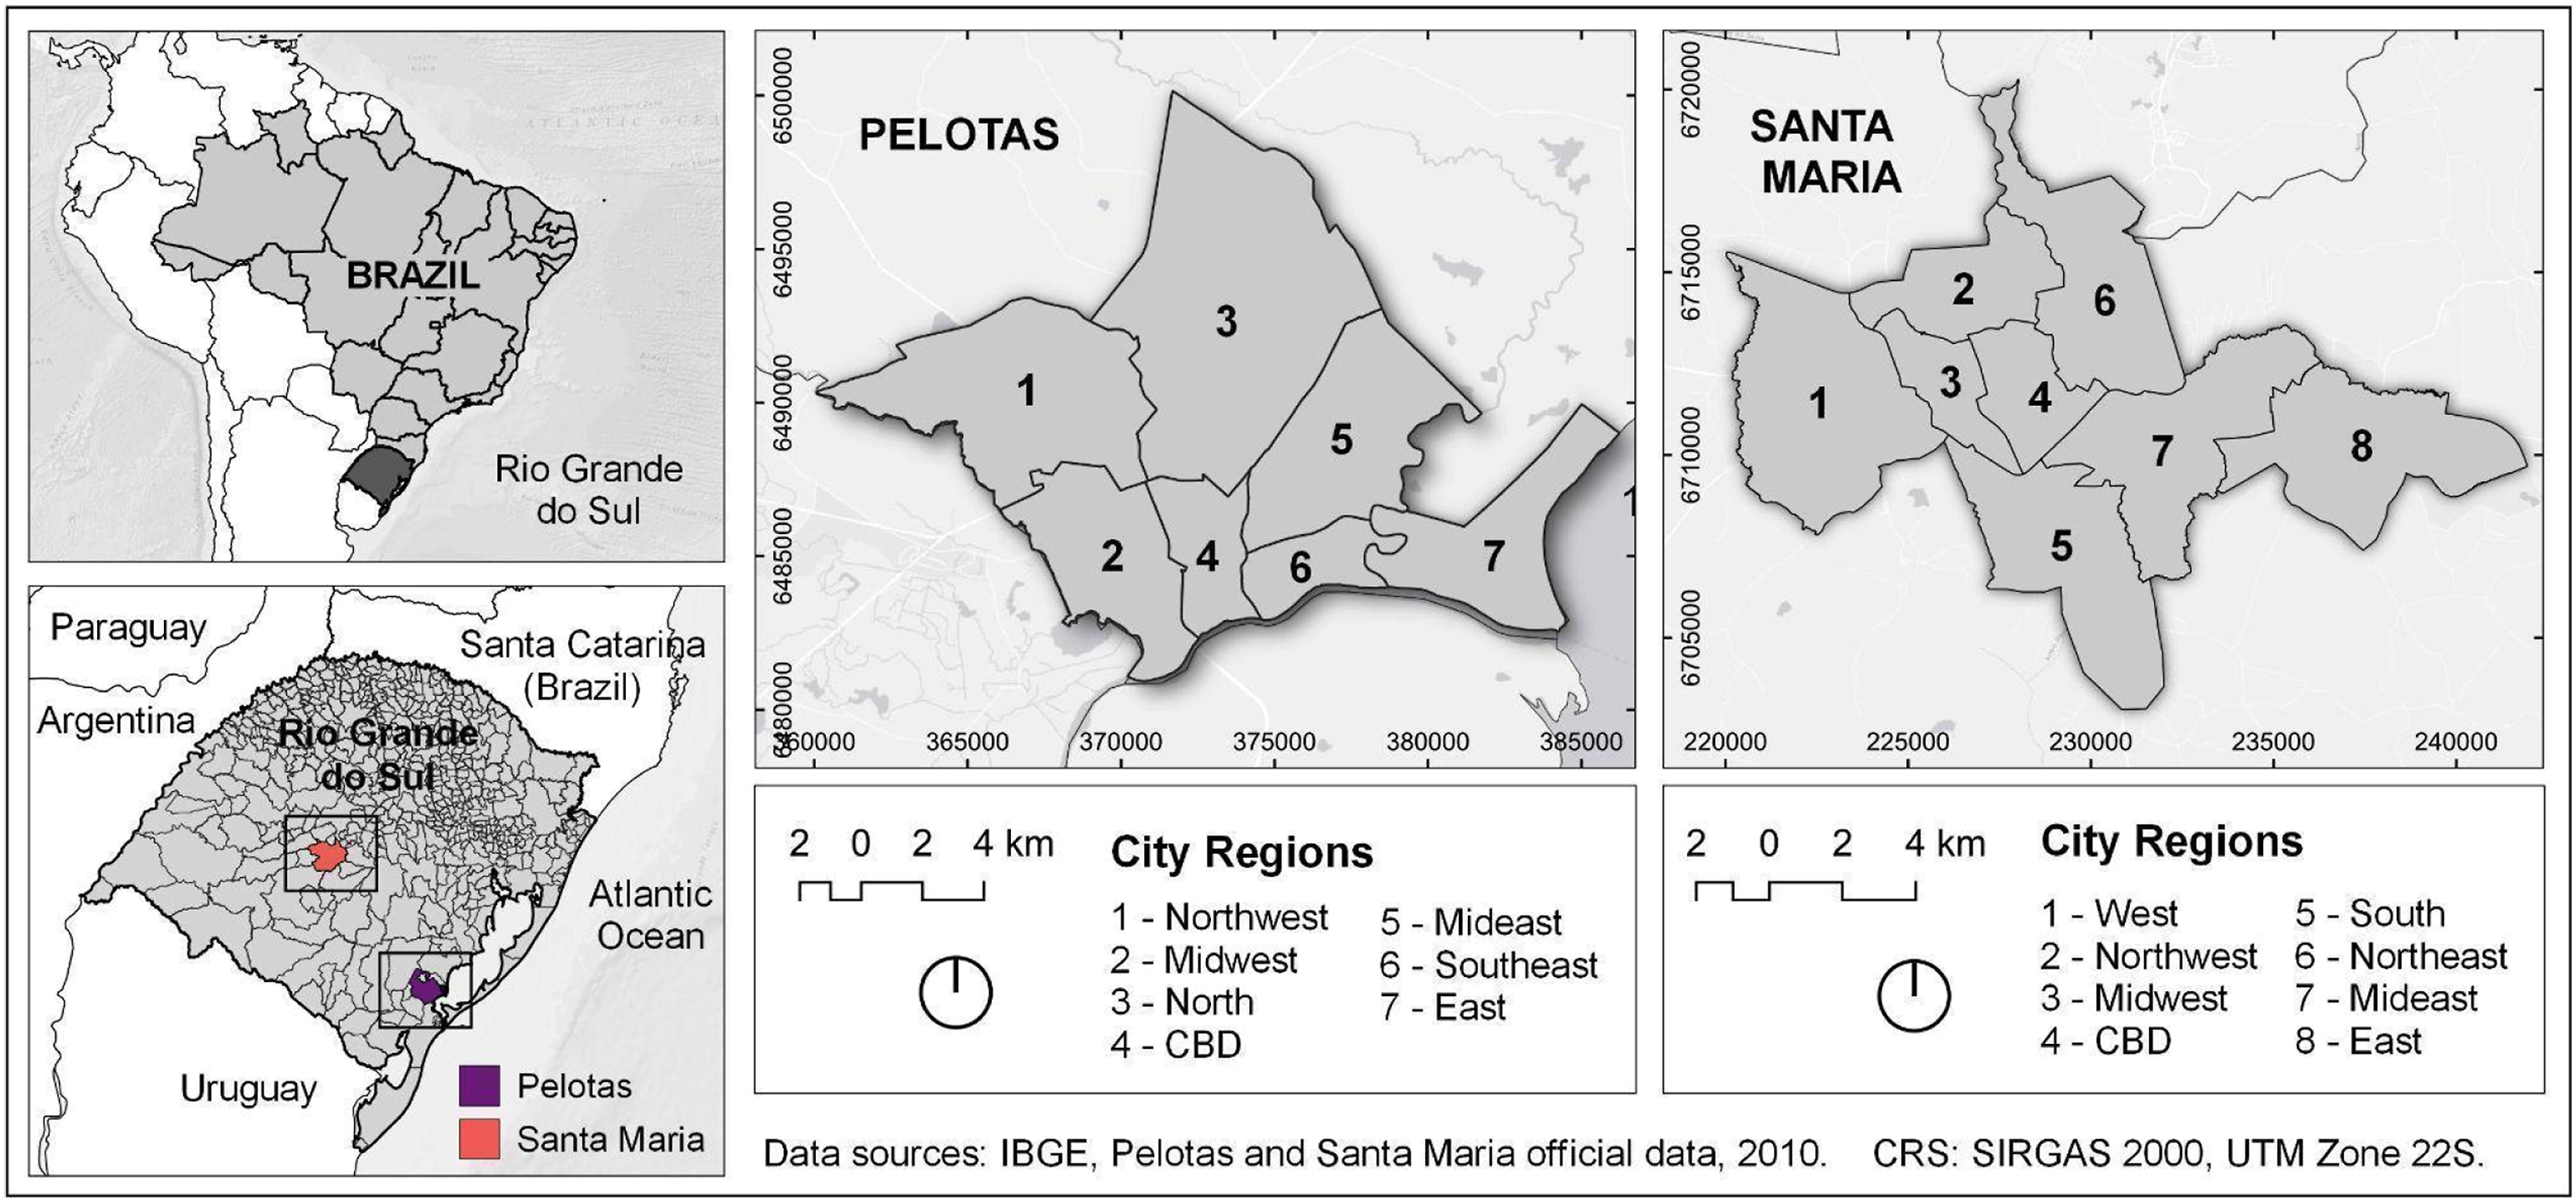
Results
In the following sections we present the results of inequalities in Potential Movement (PM) in the two cities of Pelotas and Santa Maria, starting with the analysis of their General PM (GPM), followed by a comparison of PM across regions of the cities, and the analysis of PM Difference (PMD) within the cities, for different racial and economic groups.
GPM in Pelotas and Santa Maria
Socioeconomic and street segment network characteristics in Pelotas and Santa Maria.
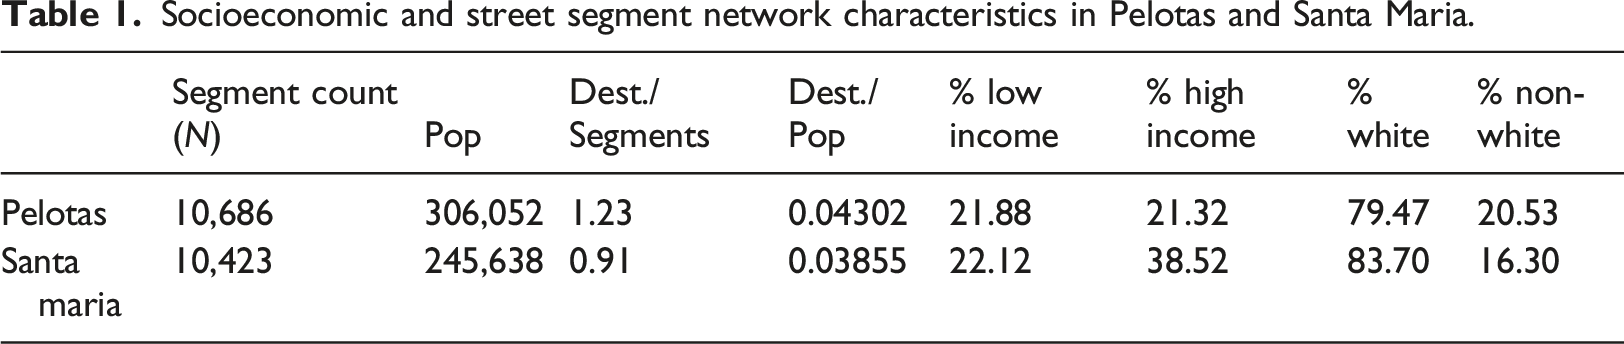
Despite Pelotas having a larger population, both cities exhibit comparable network sizes (N). Pelotas, however, shows higher ratios of destinations to network size and population size, indicating denser opportunity spaces.
The maps in Figure 2 highlight areas with high GPM values, such as the CBD and major streets connecting central regions to the periphery in both cities. The unique network configurations of Pelotas and Santa Maria impact the spatial distribution of GPM values. Pelotas (Figure 2(a)) features a historical planned grid layout in the CBD along the riverside, while the remaining regions have interruptions, primarily due to nature reserves and wetlands. Connections between the CBD and other administrative regions are limited, especially in the east. General Potential Movement (GPM) for (a) Pelotas and (b) Santa Maria and Kernel density of destination locations for (c) Pelotas and (d) Santa Maria.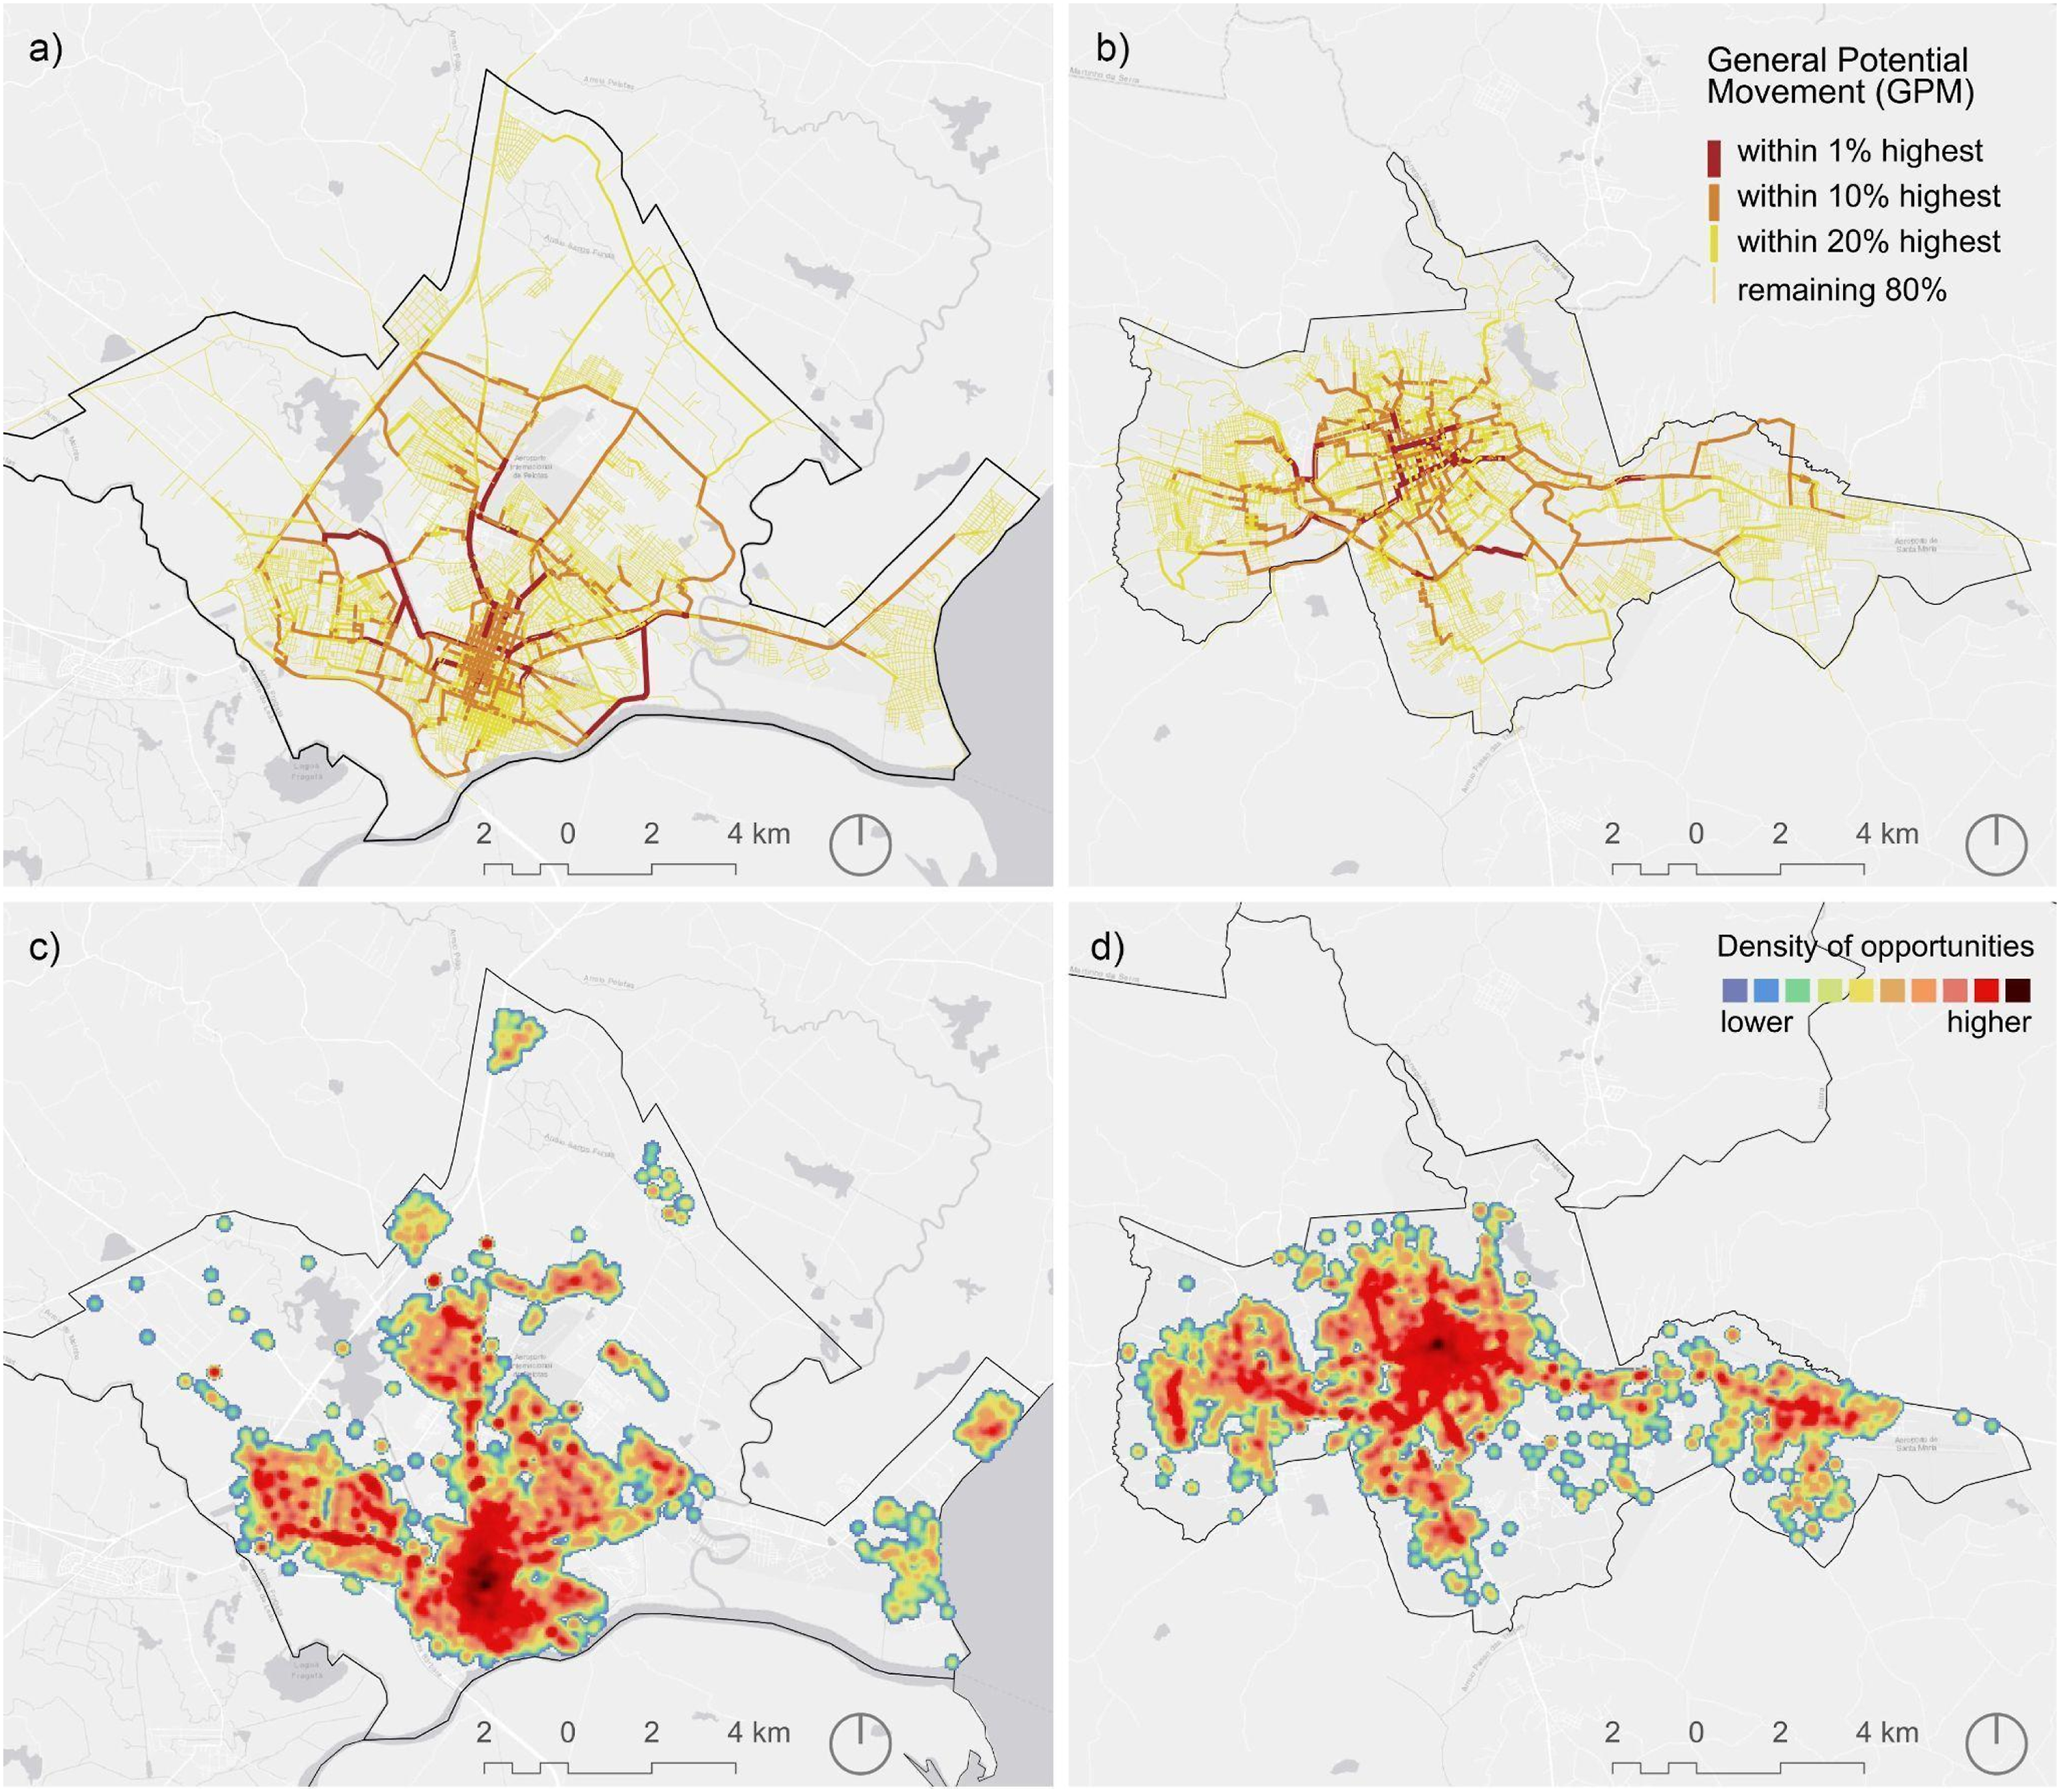
In Santa Maria (Figure 2(b)), the CBD also has a grid layout. The city develops along the east and west axis, following state highways due to environmental constraints to the north and south, such as hills and military areas, respectively.
The maps in Figure 2(c) and (d) reveal dense destination locations in the CBDs, underscoring their role as spatial hubs in both cities. Linear clusters along major roads and scattered patterns across urban areas are also visible. The density of destinations in these linear clusters ranks their street segments among the top 10% in GPM values for both cities.
Inequalities in the social group’s potential movement
Based on the results for the GPM, we compare the PM values of the different social groups across the cities. Depending on the location of their households and their distance from the opportunity spaces, the PM of the social groups varies for the different administrative regions (Figure 3). Potential Movement (PM) in (a) Pelotas and (b) Santa Maria by administrative region (sum of the normalized values).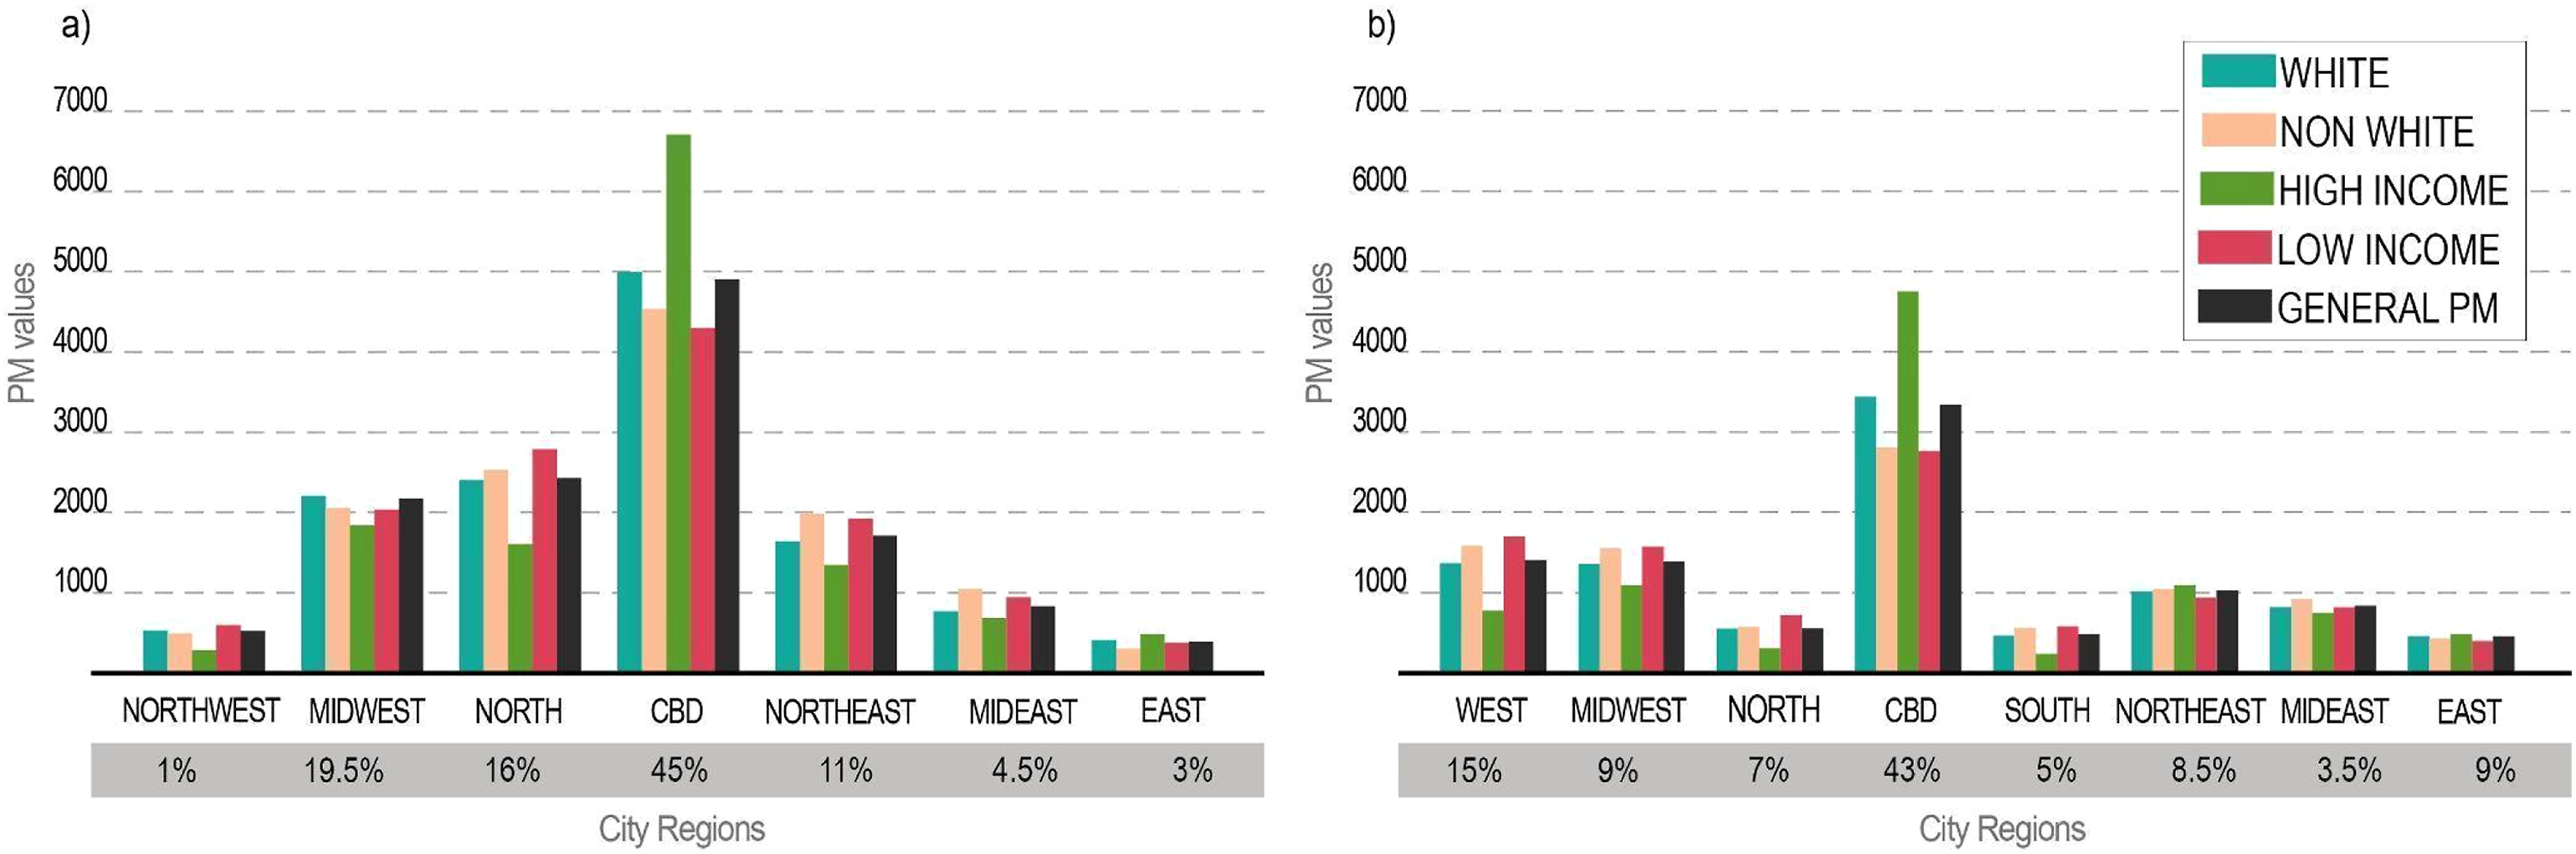
In both cities, the CBD plays a central role in potential movement (PM) for all social groups, which aligns with the high concentration of opportunity spaces in these areas. However, notable disparities emerge when comparing different social groups, particularly in terms of income.
In Pelotas (Figure 3(a)), the high-income group exhibits concentrated PM in the CBD, with limited impact in the city’s outlying regions. This hierarchical distribution indicates a proximity to opportunity spaces. In contrast, the low-income group, while showing stronger PM in the CBD, has an aggregated value 36% lower than the high-income group within the same area. Additionally, the low-income group has higher PM values in surrounding city areas, indicating a more uniform distribution of their movement. When considering race, Pelotas demonstrates higher aggregated PM for the white population in four of the seven city regions, but the difference between white and non-white groups is less pronounced.
In Santa Maria (Figure 3(b)), the PM for the low-income group in the CBD is 42% lower than the high-income one, while the PM for the non-white group is only 19% lower than the white group. This reveals that income-based disparities in PM are more significant than those based on race in Santa Maria. Like Pelotas, Santa Maria exhibits a hierarchical PM distribution for the high-income group, with lower values in other areas. This hierarchy is less pronounced for the low-income group, indicating a more evenly distributed movement. Differences in PM between racial groups are less significant. Apart from the CBD, white and non-white groups display similar aggregated PM values, with the white population group having a higher PM value in the CBD.
In both cities, the disparities in PM are linked to the spatial inequalities found in Latin American cities. High-income groups tend to reside and work in central areas with superior infrastructure, resulting in concentrated movement within these regions. Conversely, low-income groups live in underserved peripheral areas, necessitating longer commutes to access jobs and services in the CBD, which results in more dispersed movement in the network.
Potential movement differences
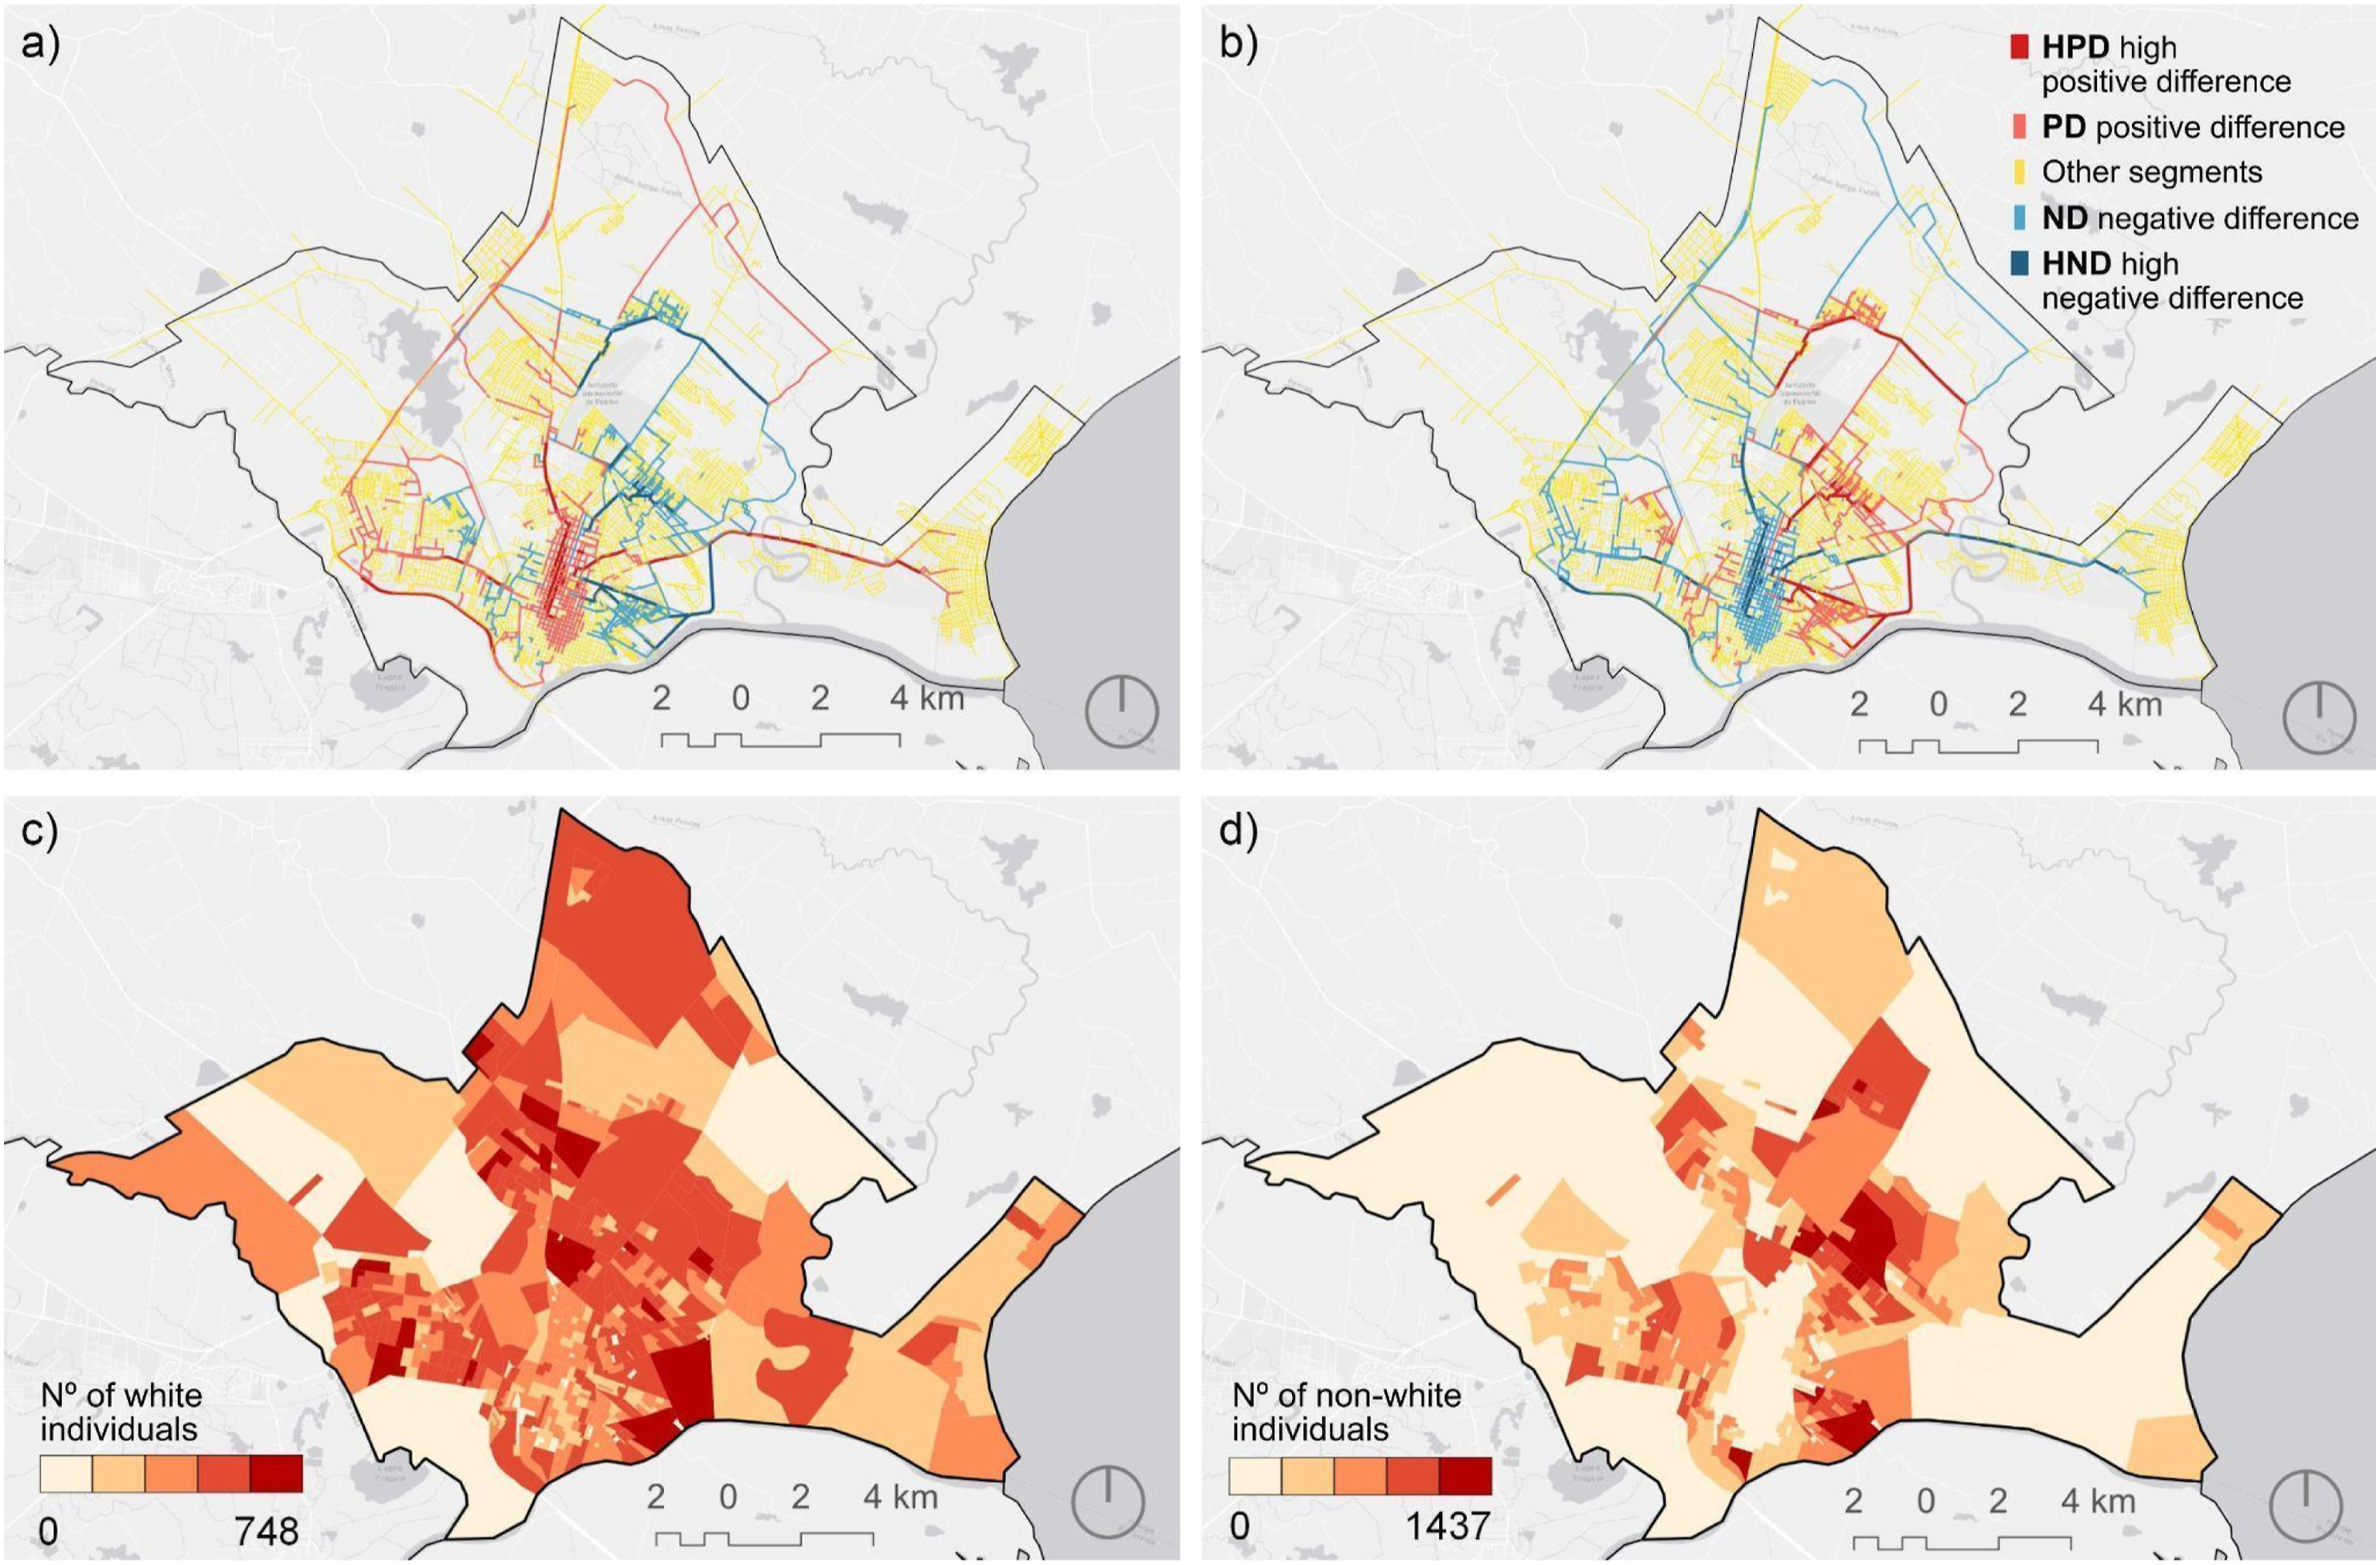
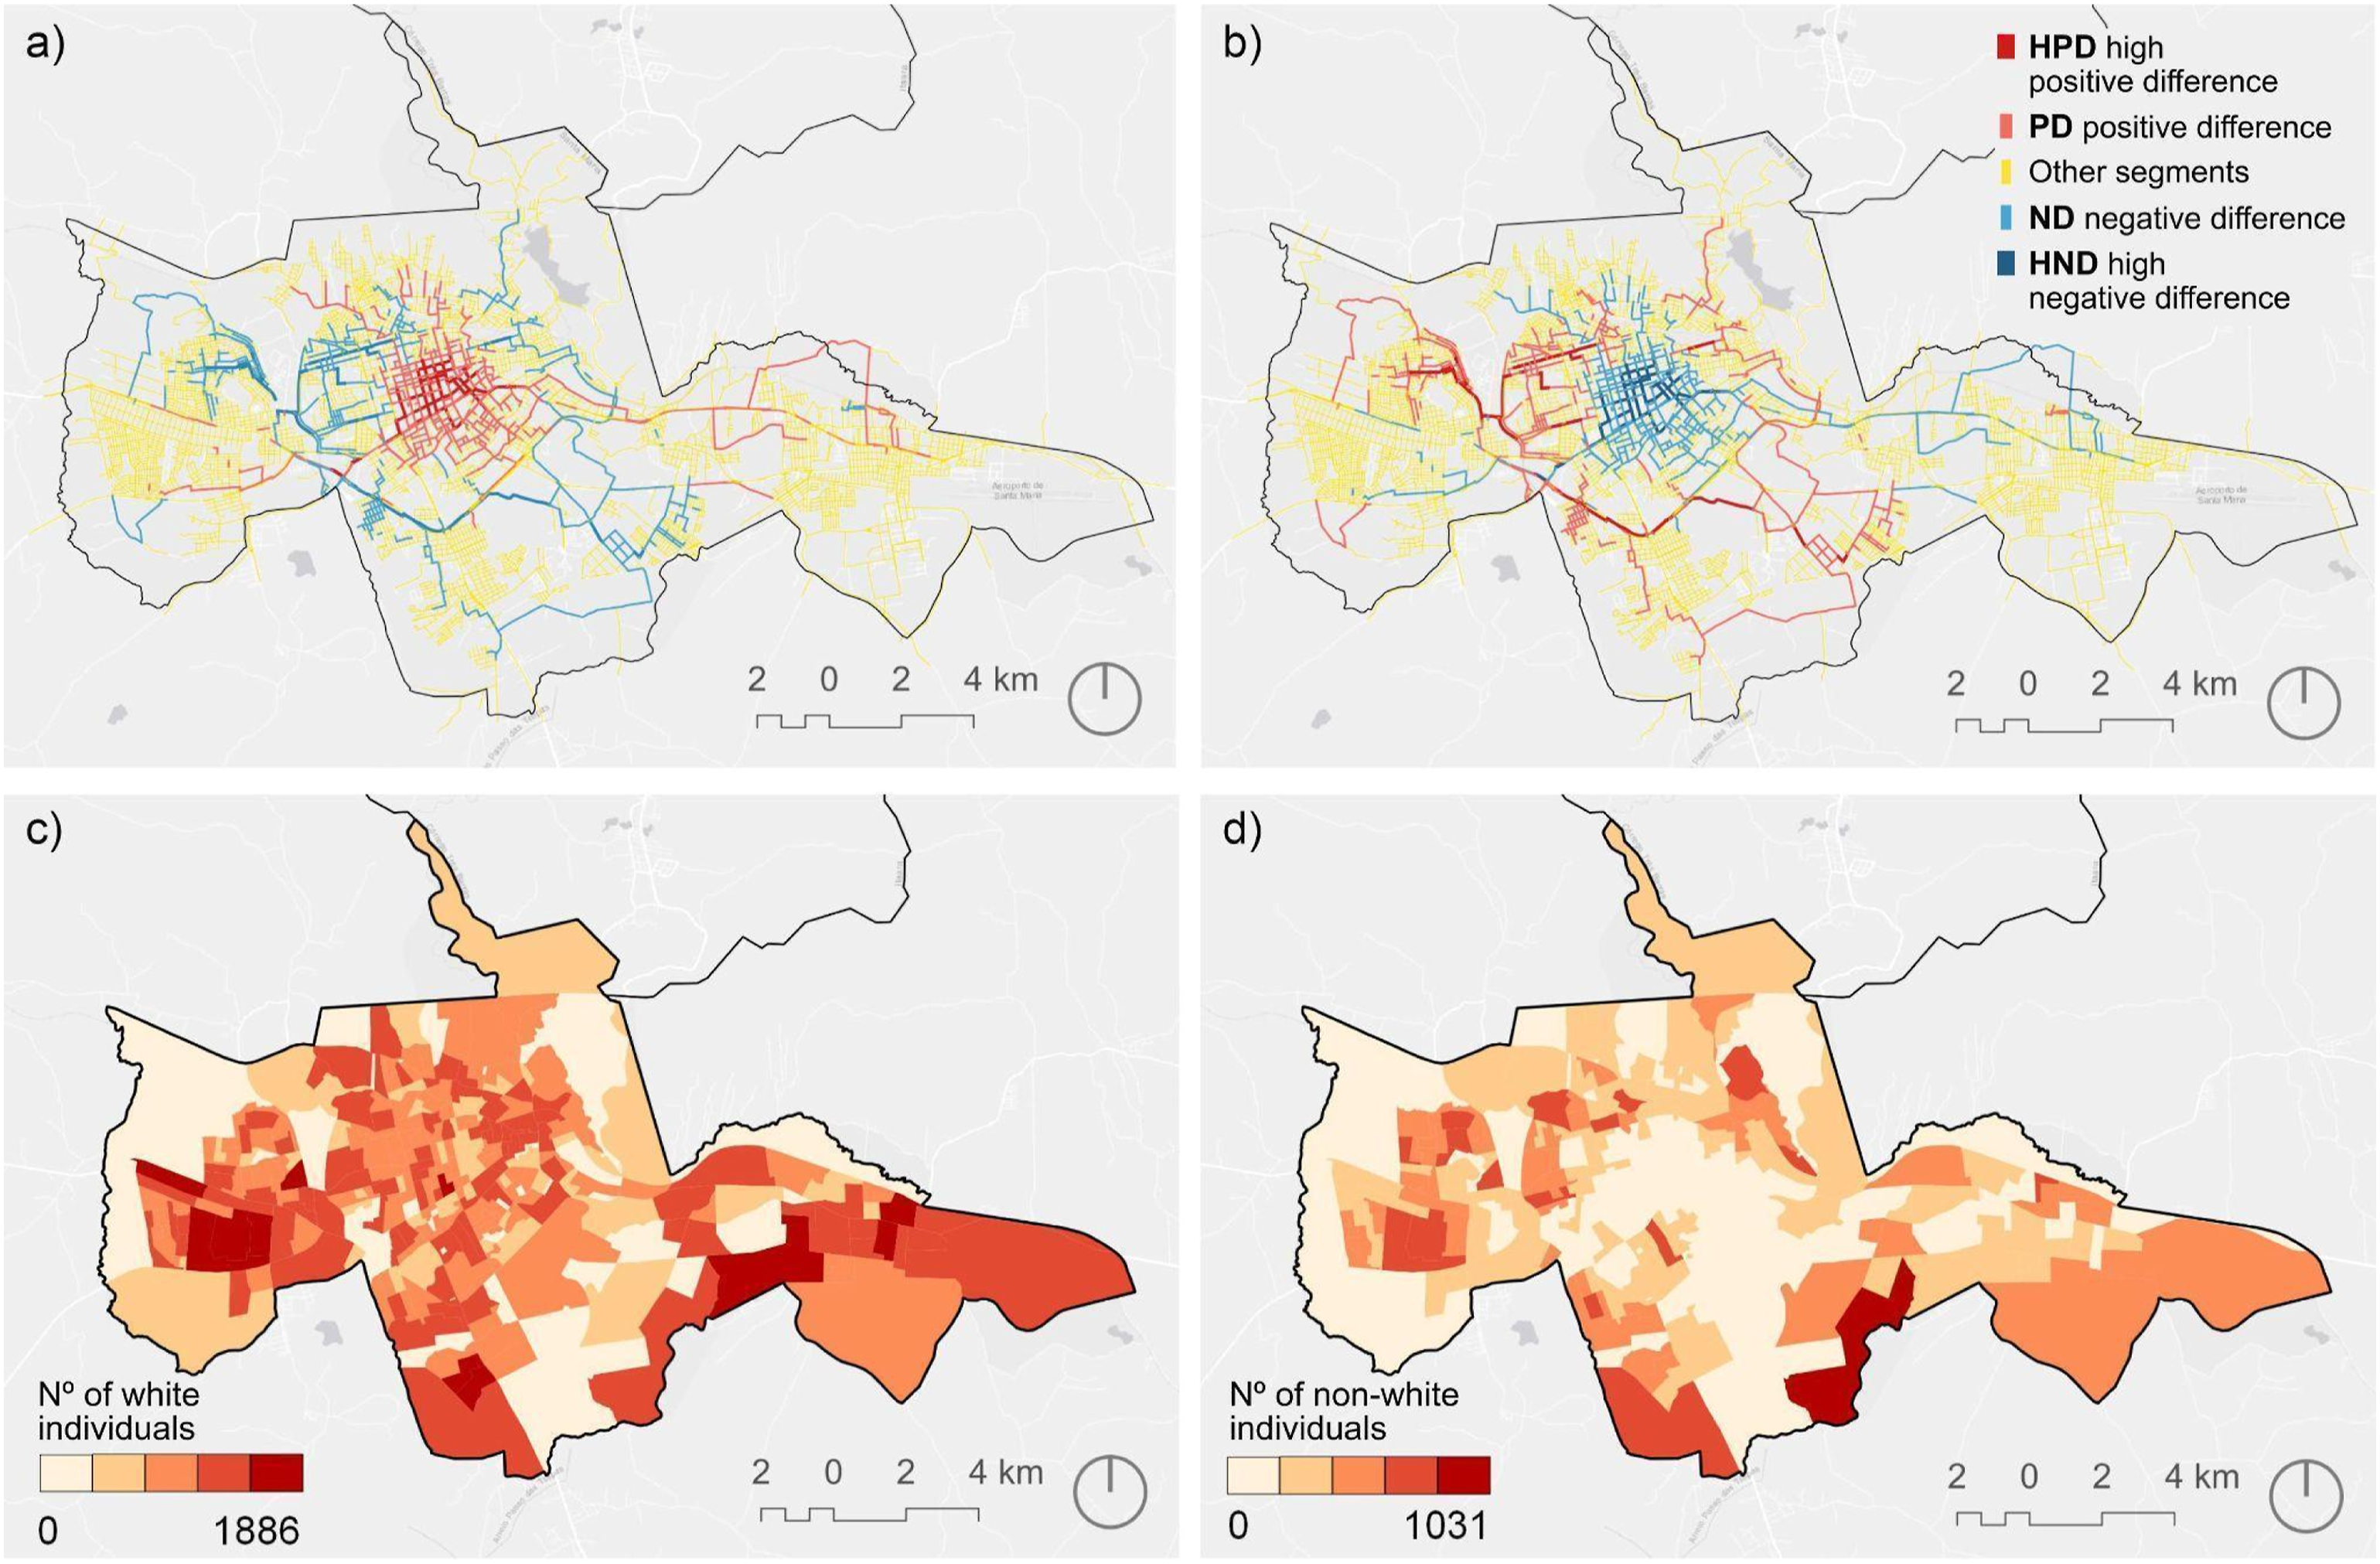
To understand how differences in potential movement are spatially distributed in the cities’ intra-urban spaces, the PMD results are presented, first for the income groups (Figures 4 and 5), then for the racial groups (Figures 6 and 7). Potential Movement Difference (PMD) values in Pelotas for (a) high and (b) low-income groups. Number of (c) high and (d) low-income households in census tracts. Potential Movement Difference (PMD) values in Santa Maria for (a) high and (b) low-income groups. Number of (c) high and (d) low-income households in census tracts. Potential Movement Difference (PMD) values in Pelotas for (a) white and (b) non-white population. Number of (c) white and (d) non-white individuals in census tracts. Potential Movement Difference (PMD) values in Santa Maria for (a) white and (b) non-white population. Number of (c) white and (d) non-white individuals in census tracts.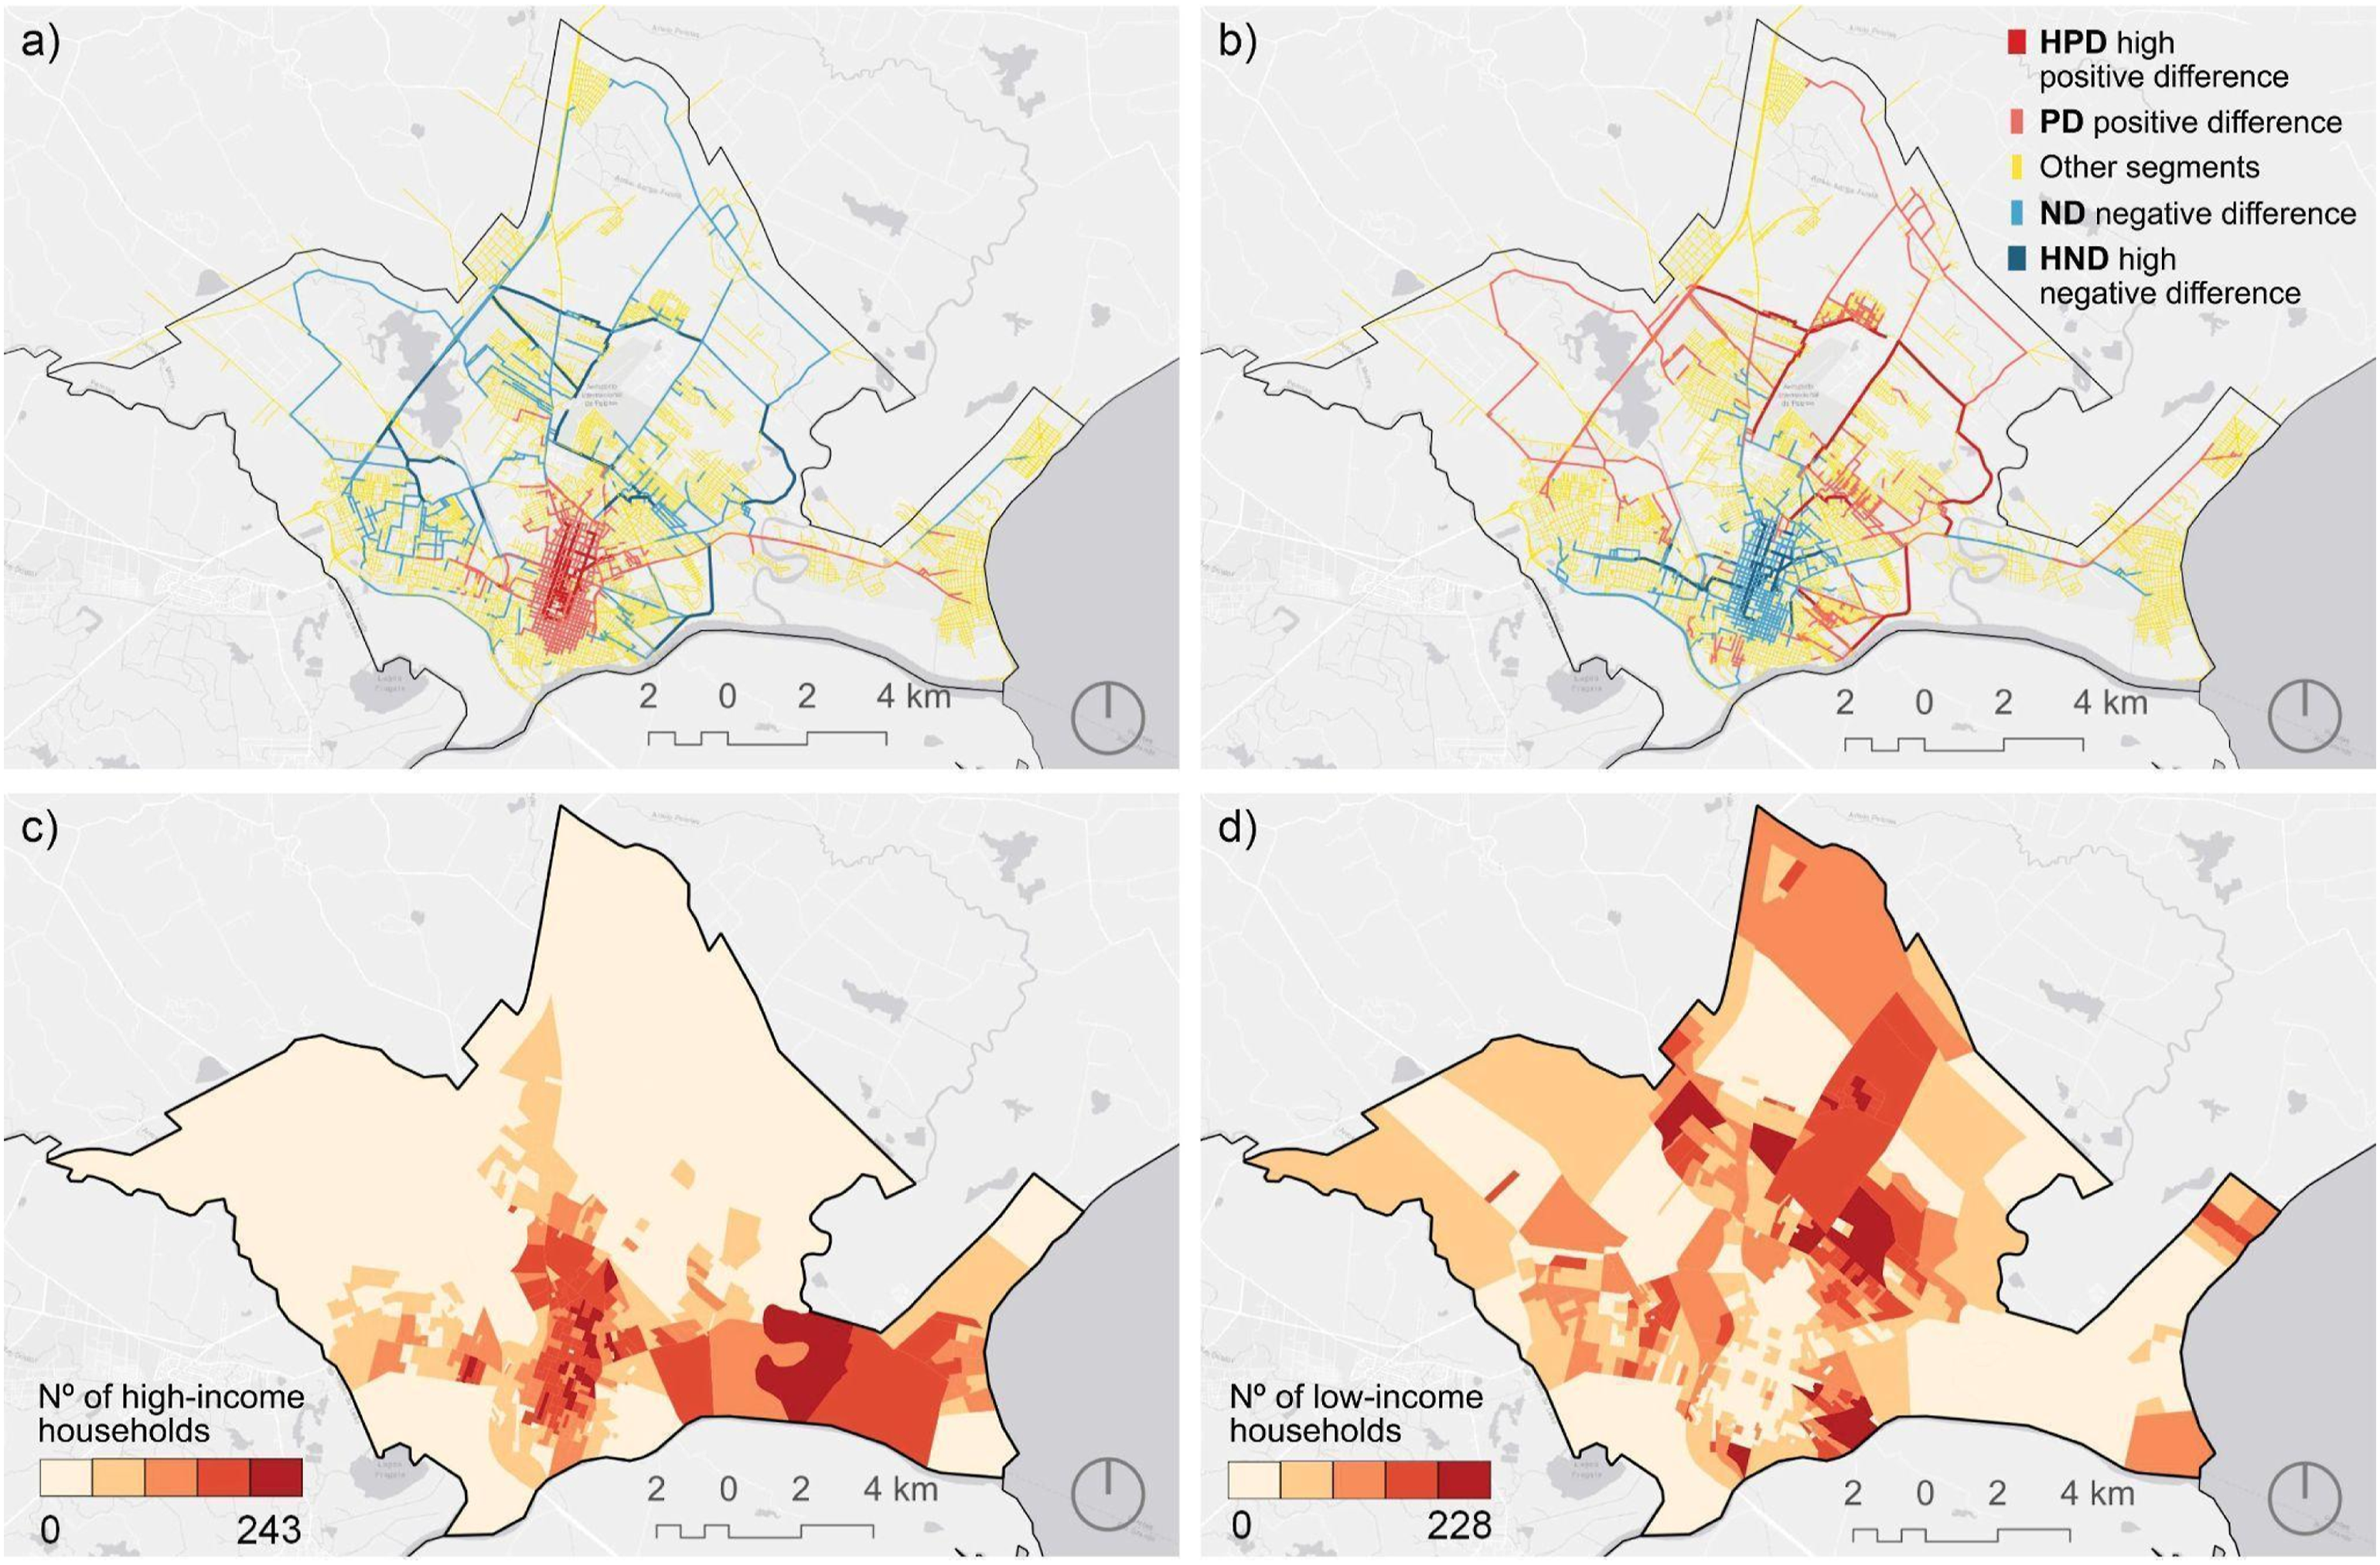
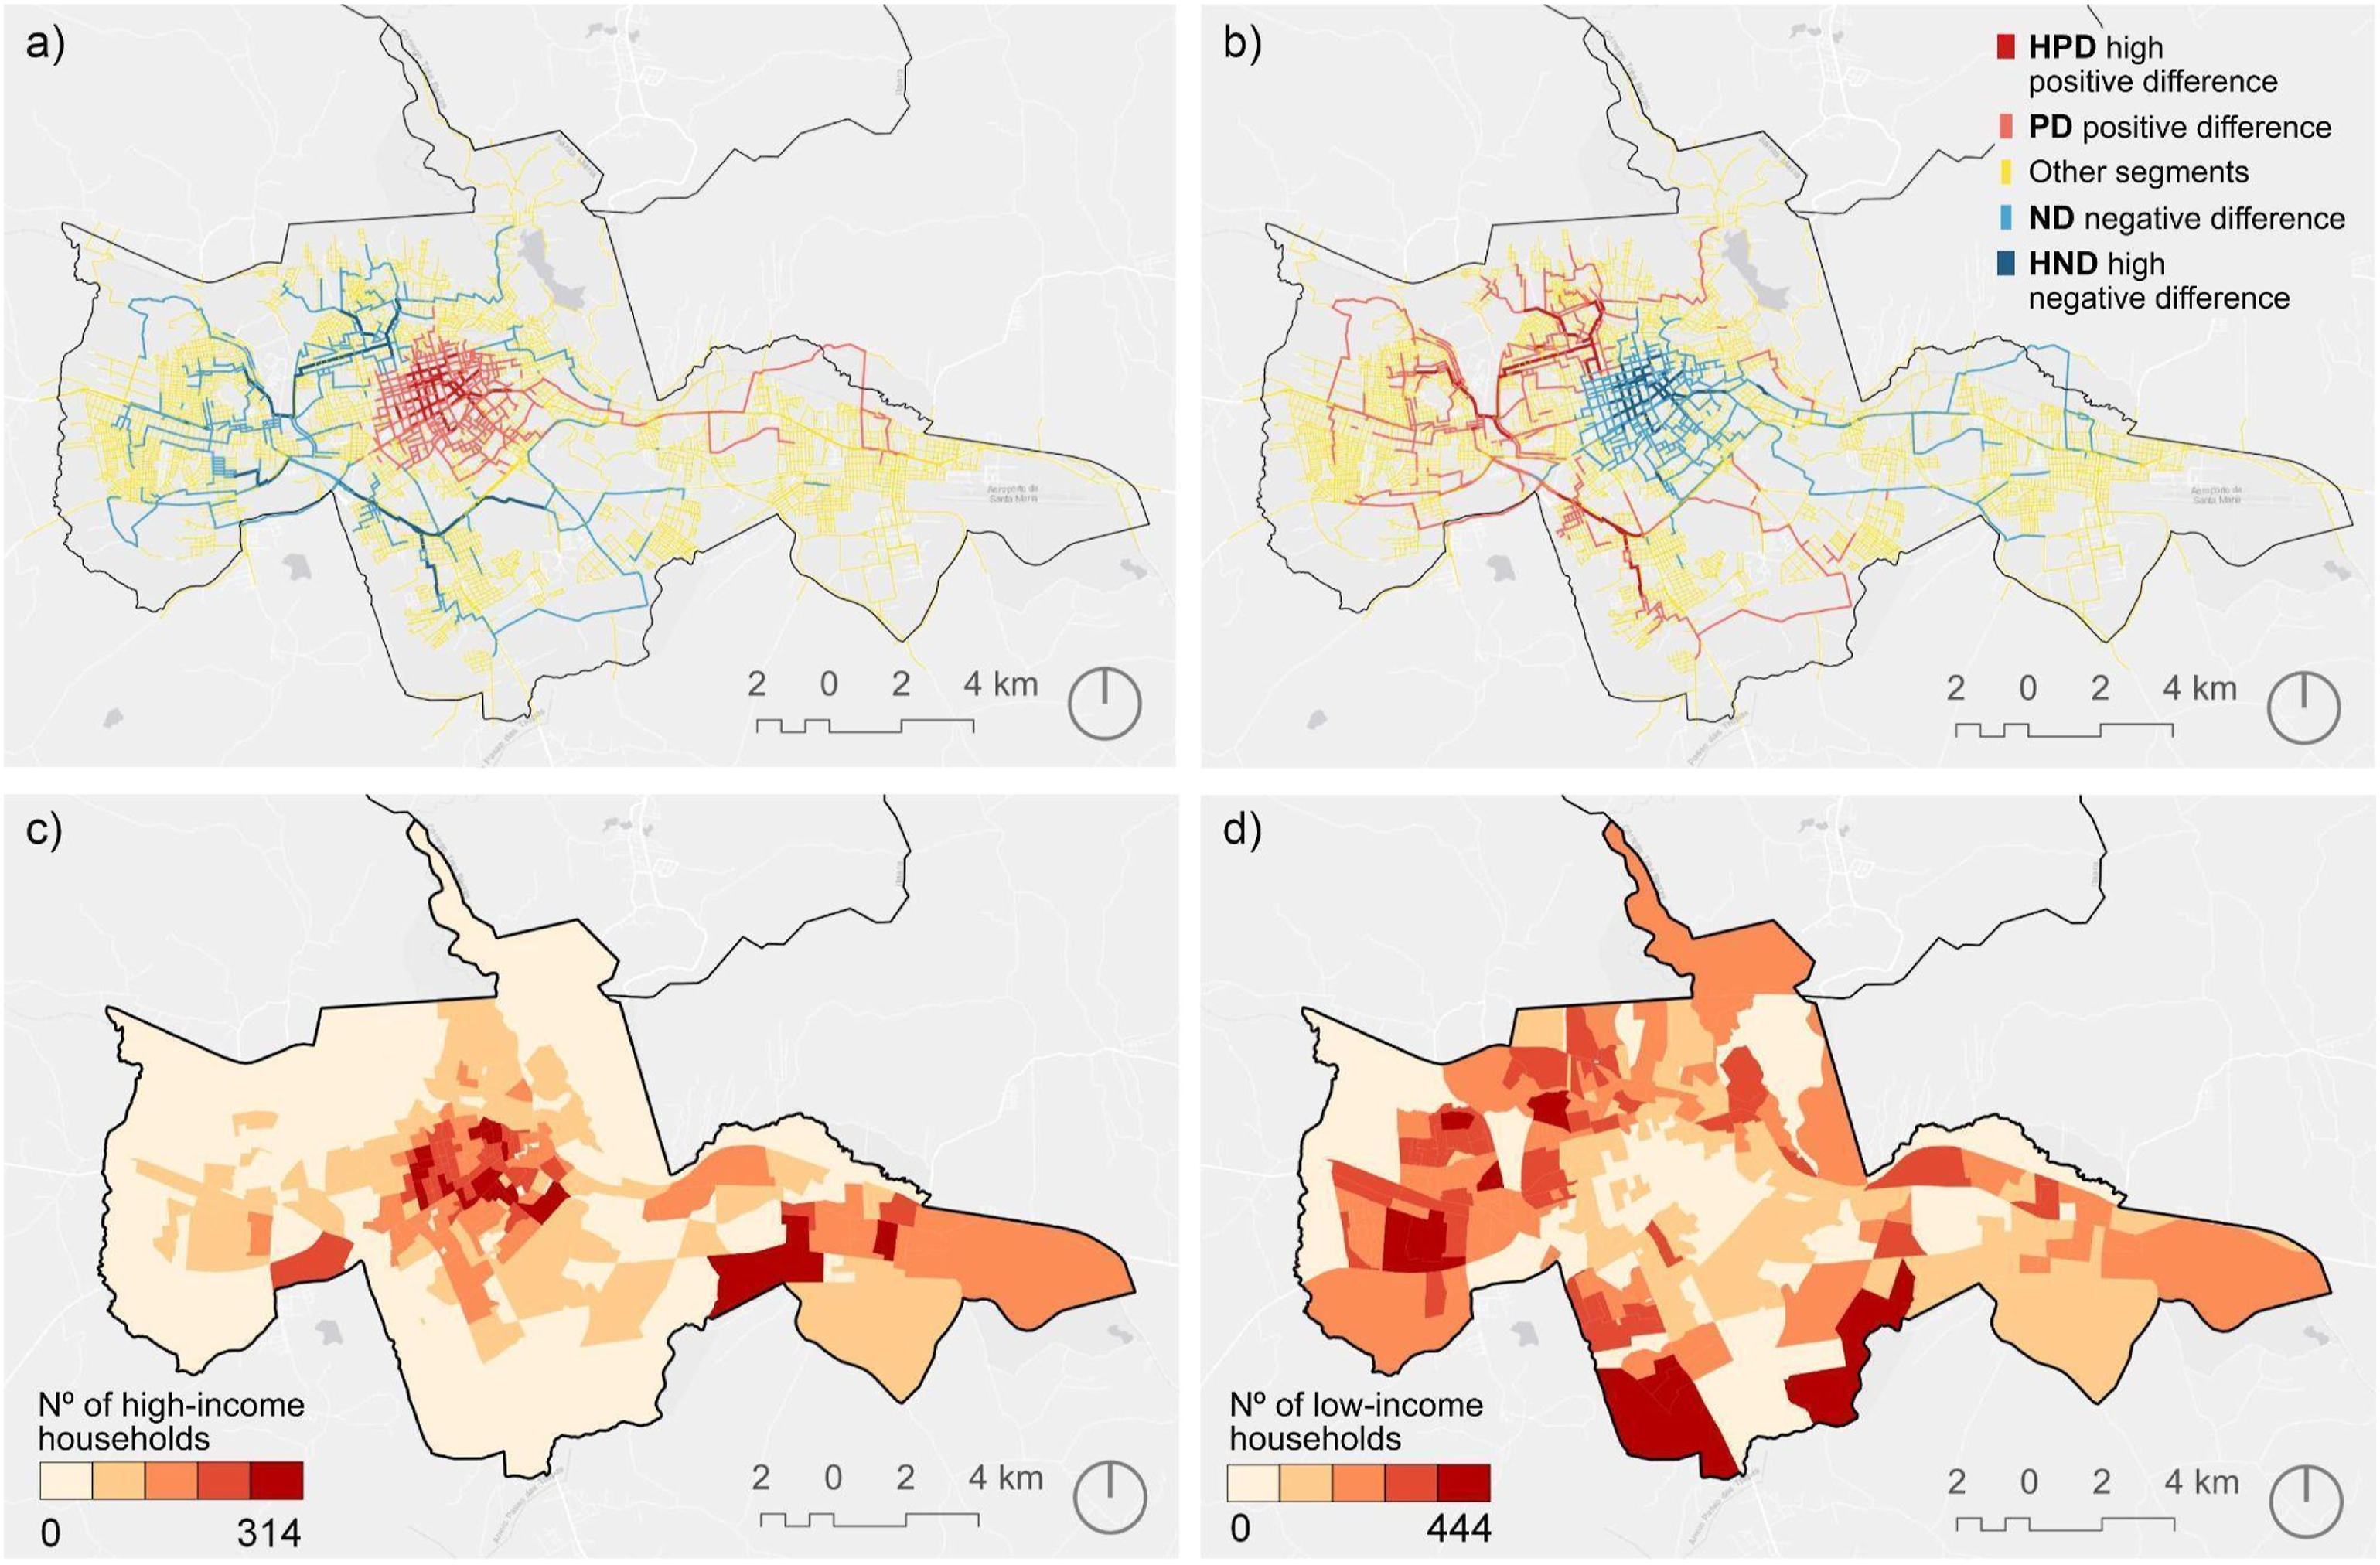
In both cities, the CBDs have a positive PMD for the high-income groups, indicating that their potential movement is higher than the reference value. The PMDs of the low-income groups show an inverse scenario, with the negative values in the CBD and its positive values more spatially distributed in the peripheral spaces. These results reinforce the previous findings. It is also possible to detect a process where the PMD of the high-income group has positive values outside the CBD, eastward in both cities. This may illustrate the known trend for high-income groups to eventually move away from CBDs towards new areas (Hoyt, 1939).
In Pelotas, the high positive difference (HPD) segments for the high-income group are primarily in central areas (Figure 4(a)). The HPD values for the low-income group, on the other hand, are mainly situated on main streets connecting various city regions and the CBD (Figure 4(b)).
In Santa Maria, the HPD segments of the high-income group also concentrate in the central area (Figure 5(a)). However, contrary to Pelotas, the HPD values for the low-income group, although located in peripheral areas, are closer to the CBD and concentrate on the main roads connecting it to the western regions (Figure 5(b)).
Similar patterns emerge for the PMD of racial groups, mirroring income trends. The CBDs in both cities have HPD for the white population, while the periphery exhibits more positive differences for the non-white population. HPD results for the white population are concentrated in central areas in both cities. However, in Pelotas, HPD results also appear on some main roads in the east and west sides (Figure 6(a)). For the non-white population, most HPD results occur outside the CBD, concentrated in the main roads in the southeast and northeast in Pelotas, while in Santa Maria, they are more dispersed, especially towards the western region (Figure 7(b)).
In summary, there is a clear center-periphery oriented distribution of high and negative PMD values, where the high-income and the white groups have their HPD in the most central areas and the low-income and the non-white groups have their high negative differences (HND) in these same areas, indicating a strong inequality in the results. These results mean that low-income and non-white groups tend to spend more time on longer journeys to work and to reach services.
To help better understand the results, we analyze the PMD results by population groups for all the city regions and for the CBD only, since it concentrates most of the opportunity spaces in both cities. Figure 8 shows the boxplots of the PMD results for Pelotas and Santa Maria. Box Plots comparing the Potential Movement Differences (PMD) between the CBD and all other administrative regions in Pelotas (a) and Santa Maria (b) for different racial and economic groups.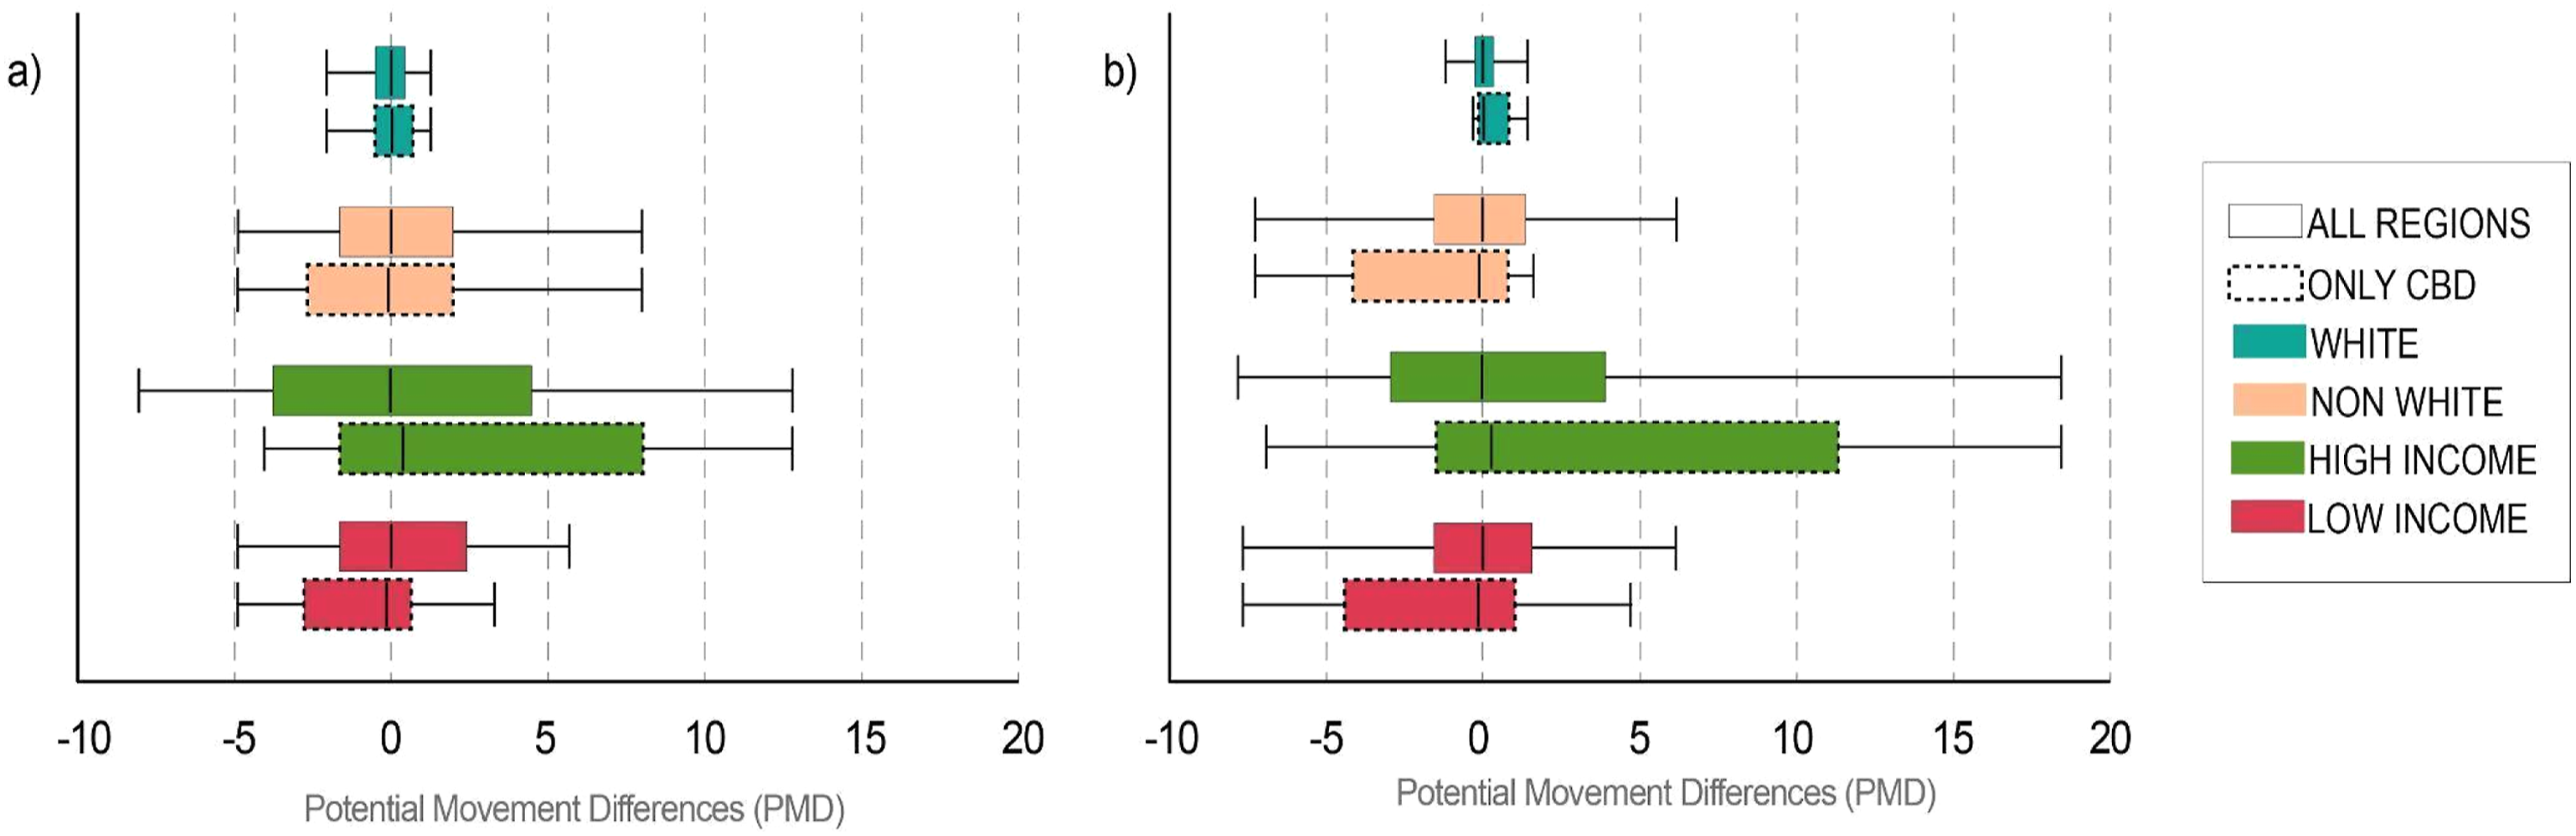
The boxplots indicate that the PMD values for the white group have a notably narrow range. This is because the white population constitutes the majority in both cities, resulting in their PMD values closely resembling reference values. When the maximum PMD value for all regions coincides with the maximum value in the CBD, it signifies that a group achieves its highest PMD result in this area, reflecting better potential movement due to the concentration of opportunity spaces. In Pelotas, only the low-income group does not exhibit their highest HPD in the CBD, while in Santa Maria, it is neither the low-income nor the non-white group.
The chart also shows how, in both cities, the high-income groups perform better in relation to the GPM, especially in the CBD. However, low-income groups have lower performance in the CBD, with Santa Maria showing fewer negative results than Pelotas. Santa Maria also displays lower PMD results for the non-white population in the CBD compared to Pelotas, indicating more pronounced PM inequality in the city for both income and racial groups, although income-related inequality is more prominent.
Discussion
Segregation in Latin American cities is predominantly driven by socioeconomic disparities, especially income inequality (Villaça, 2001). In Brazil, income disparities are intricately linked with race. Data reveals that among the poorest 10% of the Brazilian population, 78.5% are black or brown, while only 20.8% are white. In contrast, among the wealthiest 10%, the proportions reverse, with 72.9% being white and 24.8% black (Brazilian Institute of Geography and Statistics [IBGE], 2016). Our study reveals the alignment between spatial inequalities among racial and income groups by highlighting that high-income white individuals tend to use routes associated with greater opportunity spaces and well-served areas, whereas low-income and non-white populations face longer distances to access these urban facilities.
It is important to acknowledge that the observed center-periphery pattern in Pelotas and Santa Maria does not universally apply to larger Latin American cities, which often exhibit complex spatial structures and fragmentation (Borsdorf, 2003). The periphery is no longer exclusively inhabited by lower-income groups; it increasingly features a mix of gated communities, retail centers, advanced services, transportation infrastructure, social housing, and slums. This intricate spatial structure gives rise to different patterns of potential movement for various social groups, resulting in new forms of inequality. Our methodology provides valuable insights in such complex scenarios.
Measuring pedestrian and vehicular movement can be achieved through costly, time-consuming origin-destination surveys, primarily conducted in larger Brazilian cities. Access to real-time movement data from sources like cell phones or social media remains uneven in the Global South. Models like the one presented here bridge the gap between sample surveys and real-time data, enabling the estimation of potential movement using limited data. This is particularly crucial for Latin American cities which often face financial constraints and data limitations.
While the current model employs a straightforward method to assess inequalities in potential movement by calculating differences, it can be adapted to incorporate other measures for evaluating potential movement inequalities in street networks, like the Gini index, Global Moran index, Palma ratio, among others.
It is worth noting that our current model does not encompass the public transportation network, a critical aspect of mobility especially for lower-income groups. Future research should prioritize the inclusion of public transportation modes to address this limitation. Our analysis is based on a single network that integrates all transportation modes. However, we acknowledge that each mode exhibits a distinct network configuration. Examining these distinct networks separately may produce more accurate results.
Additionally, our analysis does not incorporate distance-decay functions, which play a role in estimating variations in population willingness to travel as distances increase. However, the absence of data on travel behavior necessary to calibrate these functions presents a significant challenge, especially given the limited availability of such data for medium-sized cities.
The confinement of our analysis within municipal boundaries also poses a limitation, as the residents of neighboring municipalities interact and access the opportunities and transportation networks from one another. Our selection of Pelotas and Santa Maria is deliberate due to their distinct lack of conurbation with neighboring municipalities, ensuring that the potential impact of interactions with nearby cities is minimized. Nonetheless, our proposed method is flexible enough to incorporate neighboring cities.
Furthermore, due to limitations of the database, our study overlooks the characteristics of establishments, including their size, capacity, or number of employees, when weighing destination segments, which could potentially impact the accuracy of the results obtained.
Conclusions
This paper contributes to the literature on socio-spatial inequalities in population mobility by analyzing potential movement to various destinations for different social groups using an enhanced betweenness centrality model. Our findings indicate a consistent pattern in the two cities analyzed, with the central business districts (CBDs) serving as key hubs for all groups. However, significant inequalities exist, primarily influenced by income. High-income and white groups exhibit better performance in CBDs, while low-income and non-white groups display a more dispersed potential movement, resulting in longer journeys to access employment and services.
This research offers theoretical and methodological advancements in urban network modeling by representing spatial interactions as ordered and valued. The proposed methodology has the potential to facilitate cross-regional and cross-context comparisons, bridging insights from various regions, such as Europe and North America.
Future research opportunities include disaggregating the population by additional factors, such as gender or age, and exploring combined categories (e.g., potential movement of non-white women) to provide a comprehensive perspective of urban mobility. Furthermore, destinations can be disaggregated to target specific analyses, such as the potential movement of young individuals traveling to schools and universities. Finally, the methodology can be used to explore “what-if” scenarios, assisting planners and researchers in quantifying the local and global impacts of proposed urban transformations. For instance, it can simulate the effects of building new housing estates or opening new roads on the potential movement patterns within a city.
Footnotes
Declaration of conflicting interests
The author(s) declared no potential conflicts of interest with respect to the research, authorship, and/or publication of this article.
Funding
The author(s) disclosed receipt of the following financial support for the research, authorship, and/or publication of this article: This work was supported by the Coordenação de Aperfeiçoamento de Pessoal de Nível Superior - Brasil (CAPES) [Finance Code 001].
Data availability statement
Data sharing not applicable to this article as no datasets were generated or analyzed during the current study.
Notes
![]() ).
).