
Abstract
Few studies have focused on the multisensory perception of audio–olfactory interaction with the purpose of improving the use of urban spaces. This study conducted multisensory environmental evaluations in three urban open spaces in China with the aim of verifying the existence of audio–olfactory interaction in the urban environments and providing different perspectives for the improvement of urban environmental quality. A sensewalk approach was adopted in the study, and the main research contents were: the odour’s effects on sound source and sound environment evaluations, and the sound’s effects on odour source and odour environment evaluations. The results indicated that food odour improved acoustic comfort and sound congruency and reduced subjective loudness. Pollution odour worsened the assessment of traffic and lowered subjective loudness. Sound decreased the subjective intensity of odour and exacerbated its evaluation. Additionally, food odour enhanced the sound environment assessment of pedestrian streets, while pollution odour worsened it. Sound had a weak impact on odour environment evaluations. The masking effect between sound and odour showed that the presence of the latter decreased subjective loudness while increased sound diminished the subjective intensity of odour. Furthermore, odour’s influence on sound evaluations was greater than the influence of sound on odour evaluations. These findings have implications for the planning and design of a livable and comfortable urban environment through the perspective of sensory interaction.
Introduction
Urban public open space (UPOS) affects the lifestyle and public health of residents, and thus improving its quality can help to make cities more livable (Zhou, 2005). With the rapid expansion of the construction of UPOS, sensory design has received increasing attention. In experiencing the outside world, vision, audition and olfaction have the opposite features of taste and touch. Vision, audition and olfaction often arise from unconscious behaviour, while taste and touch are more dependent on people’s subjective will. Compared to taste and touch, ‘vision, audition and olfaction are more important media for perceiving the environment’ (Ba and Kang, 2019a). However, few studies have focused on urban olfactory design. Odour has the characteristics that other sensory stimuli do not have, such as regionality and memorability; thus, the olfactory environment design has the potential to guide the public’s emotion and cognition, deepen memory, etc. (Henshaw, 2013), and should become a significant means to enrich the positive perception of the city (Xiao et al., 2018).
The use of multiple senses allows one to receive more comprehensive information and it better meets the needs of the human brain in terms of integrating and perceiving the external world through different sensory channels (Spence, 2004). Current studies focus on audio–visual interactions, where researchers have confirmed that vision and audition can affect each other (Maffei et al., 2013; Masullo et al., 2021; Xie et al., 2022). The interactive effect also exists in vision and olfaction (Belkayali, 2017; Song et al., 2019). However, the study of auditory-olfactory interactions remains limited. The visual environment of a space is usually relatively stable, while the sounds and smells of a space are more variable, and different auditory and olfactory factors will bring different experiences to users. Therefore, most of the related studies focused on the effects of different combinations of sound and odour on perception and behaviour. Jiang et al. (2016) studied the effect of odour on evaluations of road traffic through virtual reality (VR) technology. Ba and Kang (2019a) examined the effect of environmental sound–odour interactions on perception in a laboratory experiment. In another study, they found that the aroma of lilac can reduce the annoyance caused by traffic noise in urban streets (Ba and Kang, 2019b). The study also showed that different combinations of sound and odour in urban area affect people’s behaviour, including path, speed and duration time (Ba et al., 2020). In addition, multisensory stimulation is increasingly recognised and adopted as an effective unilateral spatial neglect rehabilitation method (Zigiotto et al., 2021). Compared with single stimulus, the combination of auditory and olfactory stimuli is more effective in capturing the visuospatial attention (Dozio et al., 2021), thus the design of auditory-olfactory interaction environment is a potential way to improve the inclusiveness of space. These studies demonstrate auditory-olfactory interactions, but the sensory experimental conditions were all single dominant sounds and smells. And whether sound and odour will affect each other’s evaluation under different combinations of multisensory factors in the actual environment is worthy of further exploration.
Sensewalk is a common method for perceiving an urban sensory environment, it has been described as a method by which we might ‘investigate and analyse how we understand, experience and utilise space’ (Adams and Askins, 2009). Southworth (1967) carried out one of the earliest recorded sensewalk studies and examined the urban sound environment, as well as the interactions between the senses (mainly vision and hearing). During sensewalk, a person’s perceptual state changes from passive to receptive, makes them zero in on the composition of sensory factors, and combines qualitative and quantitative characteristics (Low, 2015). Therefore this approach allows researchers to obtain relatively accurate evaluation results with smaller sample sizes and over shorter periods, especially for the professional questions, which can be difficult for the general public to understand (Pheasant et al., 2008).
The soundwalk, devised by Schafer (1977), is the most widespread form of sensewalk for identifying an urban sound environment and its components. Soundwalks involve recording sound in real time using measurement equipment while the participant walks along a path, and are always used to engage participants in the practice of perceiving the sound environment and describing a certain area through auditory evaluations (Behrendt, 2018). The studies of multisensory interaction using soundwalk method mainly focused on audio–visual interaction. Liu et al. (2014) investigated the effect of visual landscape factors on the soundscape evaluations of urban parks, the results showed that spatial patterns could be more influential on soundscape perception than landscape composition. Many researchers have adopted the soundwalk method and suggested its relevant or unique evaluation procedure for the process of soundwalk (Adams et al., 2008; Berglund and Nilsson, 2006).
Different from the study of sound, where it can be recorded and reproduced by instruments, odour is not easy to quantitatively measure and record. By using the sensors which usually include metal-oxide type, electrochemical type, conducting polymer type, etc., some main chemical components (the specific components depend on the type of odour) can be quantified objectively according to their mass concentrations (mg/m3); however, it is usually impossible to adequately assess odour using this method as it is not measuring the odour directly (Nicell, 2009). Moreover, for the complex odour environment of the city, ‘it is not always possible to identify a limited number of tracer compounds, nor to relate analytical concentrations to odour properties, thus given that single odorous compounds might be insufficient to account for effective odour perception’ (Capelli et al., 2013). For instance, in terms of the measurement of malodorous odours, it is usually possible to measure a limited number of certain chemical components of an odour such as NH3 and H2S, while odours with the same measurement results may smell different. Thus, compared with the measurement of odour chemical components, ‘the human sense of smell is currently the most sensitive tool available for assessing smellscapes, distinguishing between odours and accommodating contextual information’ (Henshaw, 2013). Human ‘sensors’ may be the trained assessors or just resident population (Drew et al., 2007; Sironi et al., 2010). And odour is clearly embedded within culture and belief systems and is closely related to memory, locality and context, which make it also difficult to establish a direct relationship between the concentration of a particular chemical and perception. Therefore, even if there is inevitable subjectivity, the evaluation of general population is more suitable for the perception-based urban odour environmental study than the measurement of chemical components, and smellwalk has become a useful method. Similar to soundwalks, smellwalks require a real-time assessment. Bouchard (2013) introduced a commentated smellwalk and mapped people’s memories of odours as they walked along a set route. McLean (2017) visualised the odours and their locations in the city as a ‘map’ through smellwalks. Allen (2021) conducted smellwalk in Aotearoa-New Zealand to investigate the experience of lockdown in a suburban town, and proved trivial olfactory details can reflect the changes of new embodied and material knowledge in the post-pandemic era.
Therefore, we adopted a sensewalk, combining a soundwalk and a smellwalk to explore the audio–olfactory evaluations in UPOS, so as to verify the existence of audio–olfactory interaction in urban environments, and provide different perspectives for the improvement of urban environmental quality, and offer a more comprehensive and multidimensional way for space quality evaluation. Specifically, sound (odour) environment of a place or space is the sound (odour) from all sources, which together with human perception constitute the soundscape (smellscape). Sound (odour) source refers to object in the environment that produces sound (odour) (Kang, 2006; Henshaw, 2013). The main sound sources in the soundscape can be classified into keynotes, sound signals and sound marks (Schafer, 1977). Correspondingly, the main odour sources in the smellscape can be classified into a macro level, a middle level and a micro level (Malnar, 2004). Thus in order to make the study more comprehensive, four research questions were addressed. When the sensory experimental condition were mixed dominant sensory stimuli in the actual environment: Does odour affect the subjective evaluation of the perceived sound source? Does sound affect the subjective evaluation of the perceived odour source? Does odour affect the subjective evaluation of the perceived sound environment? Does sound affect the subjective evaluation of the perceived odour environment?
Methodology
Case study sites and sensewalk route
The UPOS includes streets, parks, squares, green zones and outdoor residential sites (Zhou, 2005). When selecting research sites, one should consider whether they have rich sources of sounds and odours. Furthermore, the proportion of typical visual elements should be consistent in order to avoid the influence of visual factors (Liu et al., 2014); and there should be a large number of people for questionnaire distribution. Hence, the three types of UPOSs that met the above conditions were selected as test sites, which including pedestrian street, street and park in the Chinese city of Harbin; the sensewalk route runs through them continuously, as shown in Figure 1. Zhongyang Pedestrian Street is a commercial thoroughfare located in the historical district. It is approximately 20 m wide. Xiwudao Street is perpendicular and connected to Zhongyang Pedestrian Street; the road is approximately 10 m wide. Zhaolin Park covers an area of 8.4 ha and is rich in internal vegetation, mainly including Ulmus pumila liter. and Larix gmelinii (Rupr.) Rupr., etc. A total of 11 test sites along the route were set up. The sensewalk route and test sites.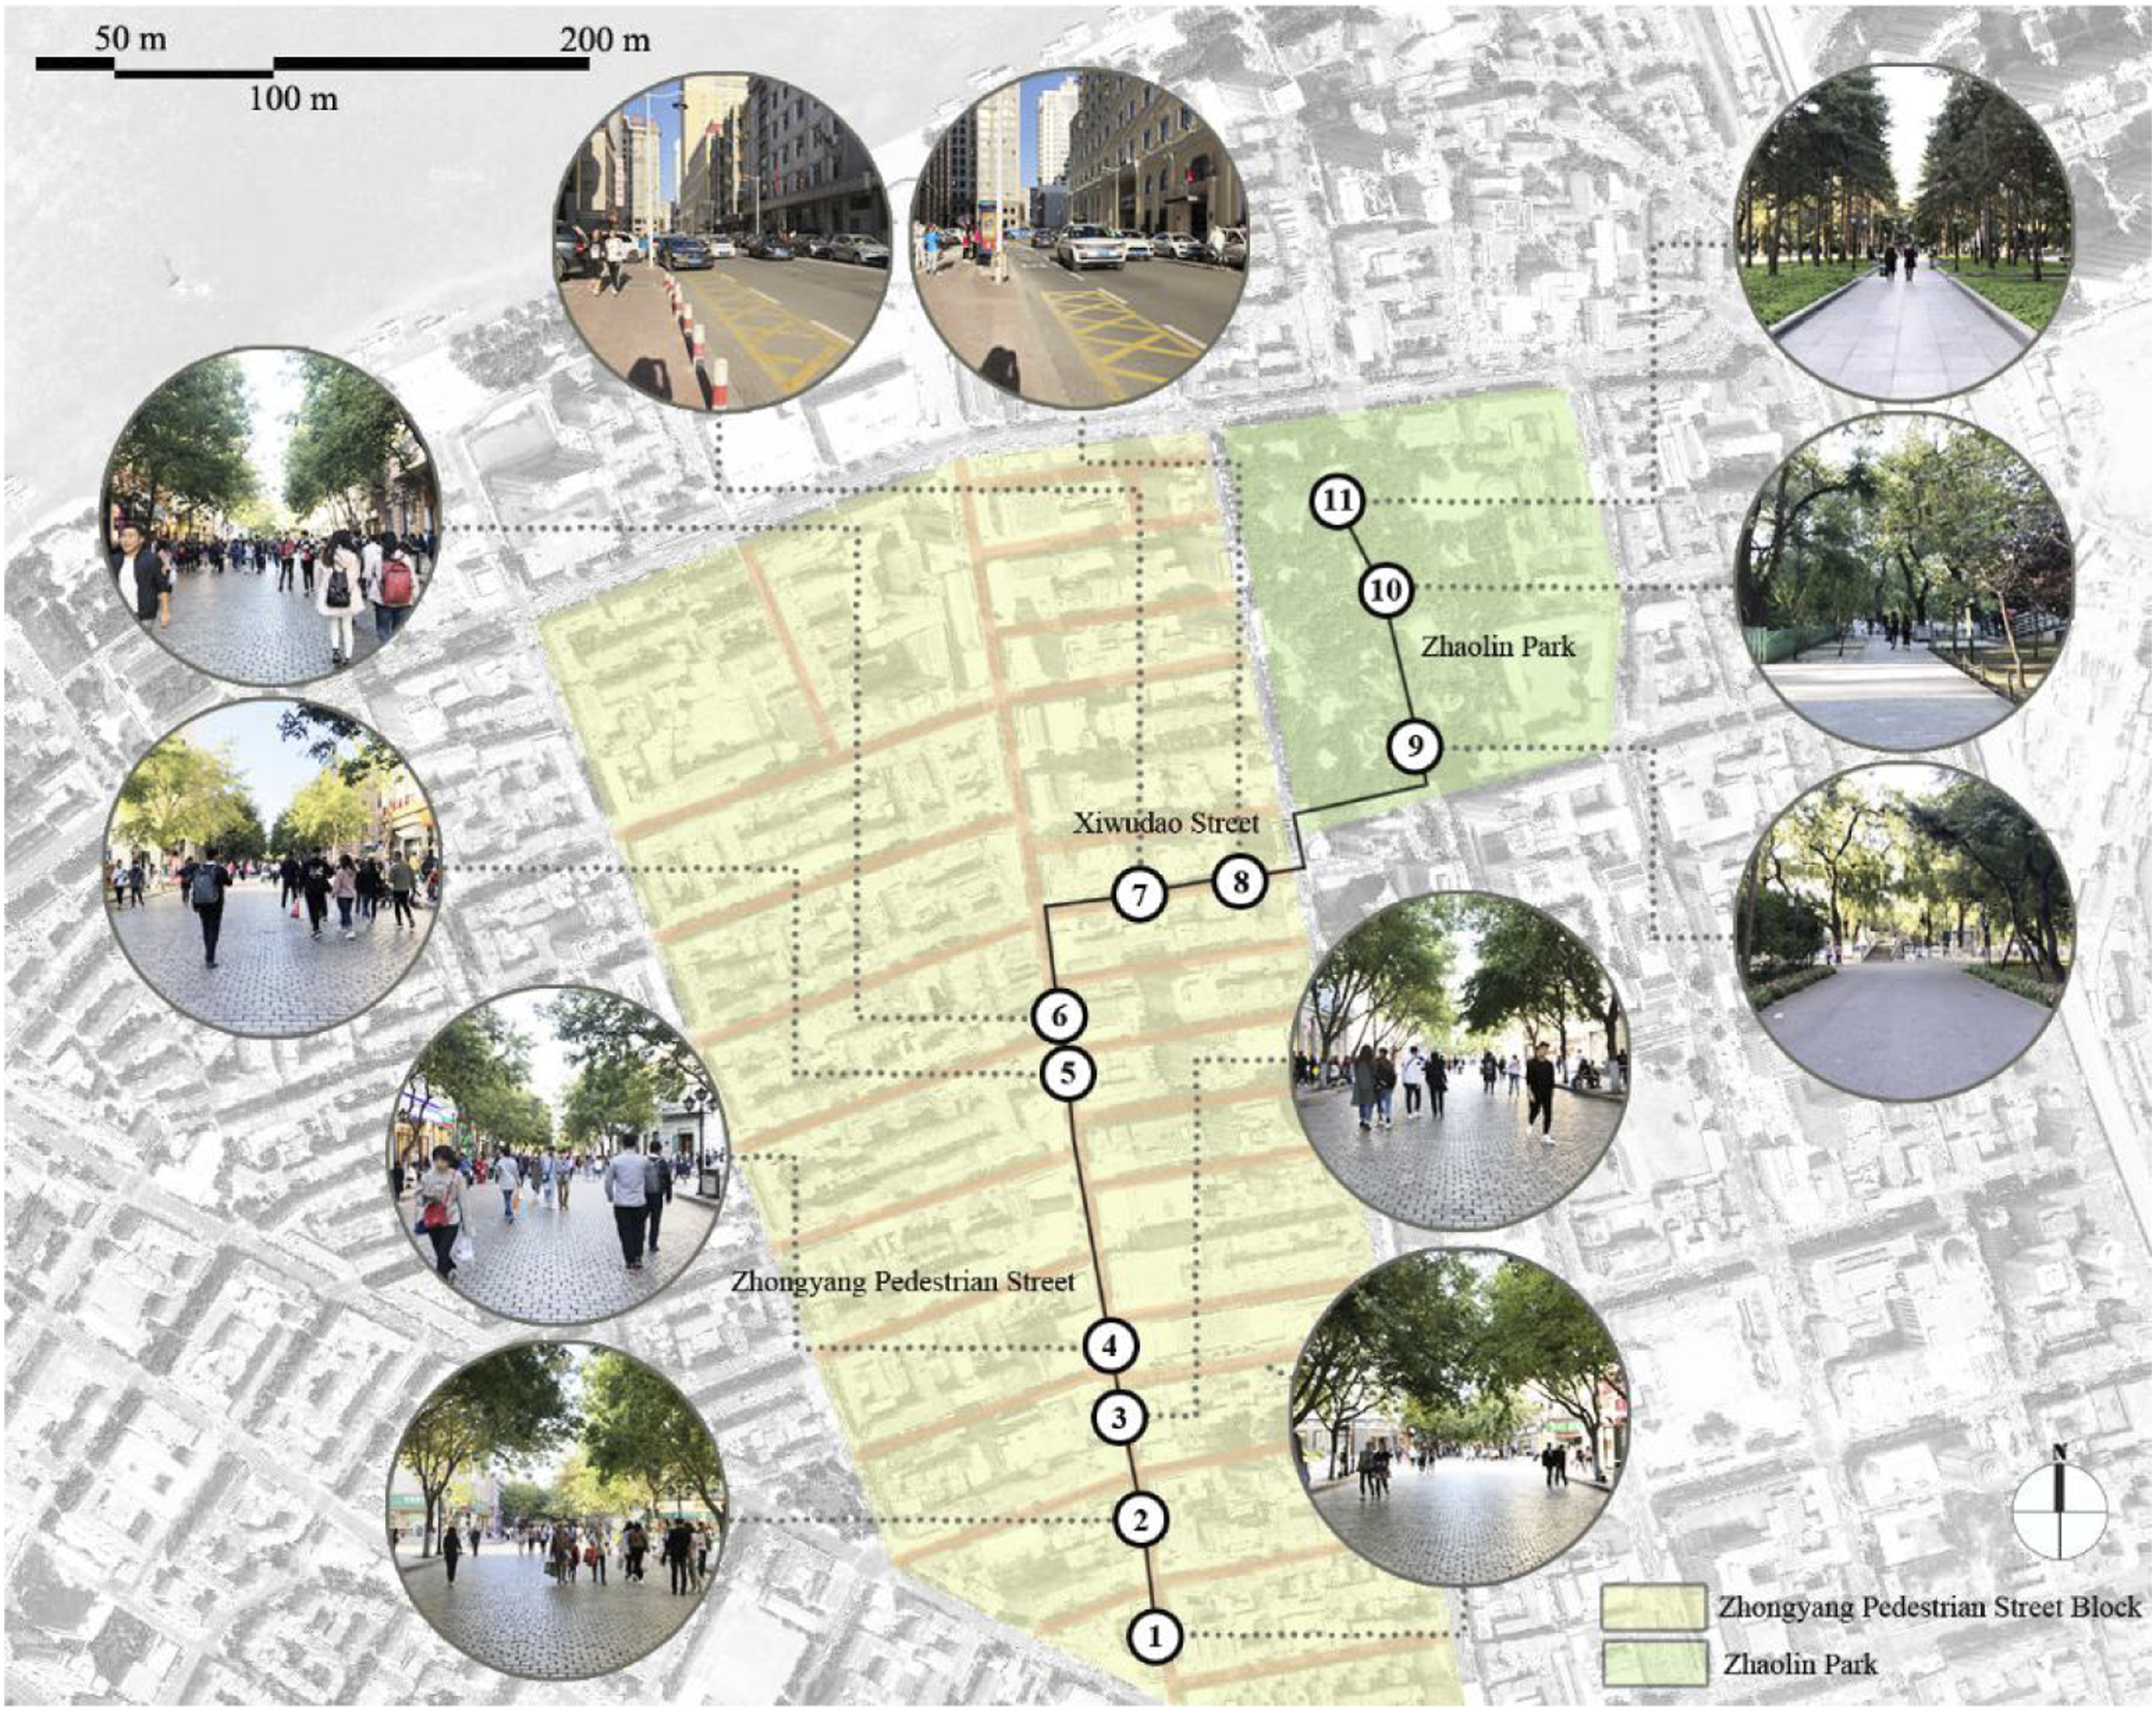
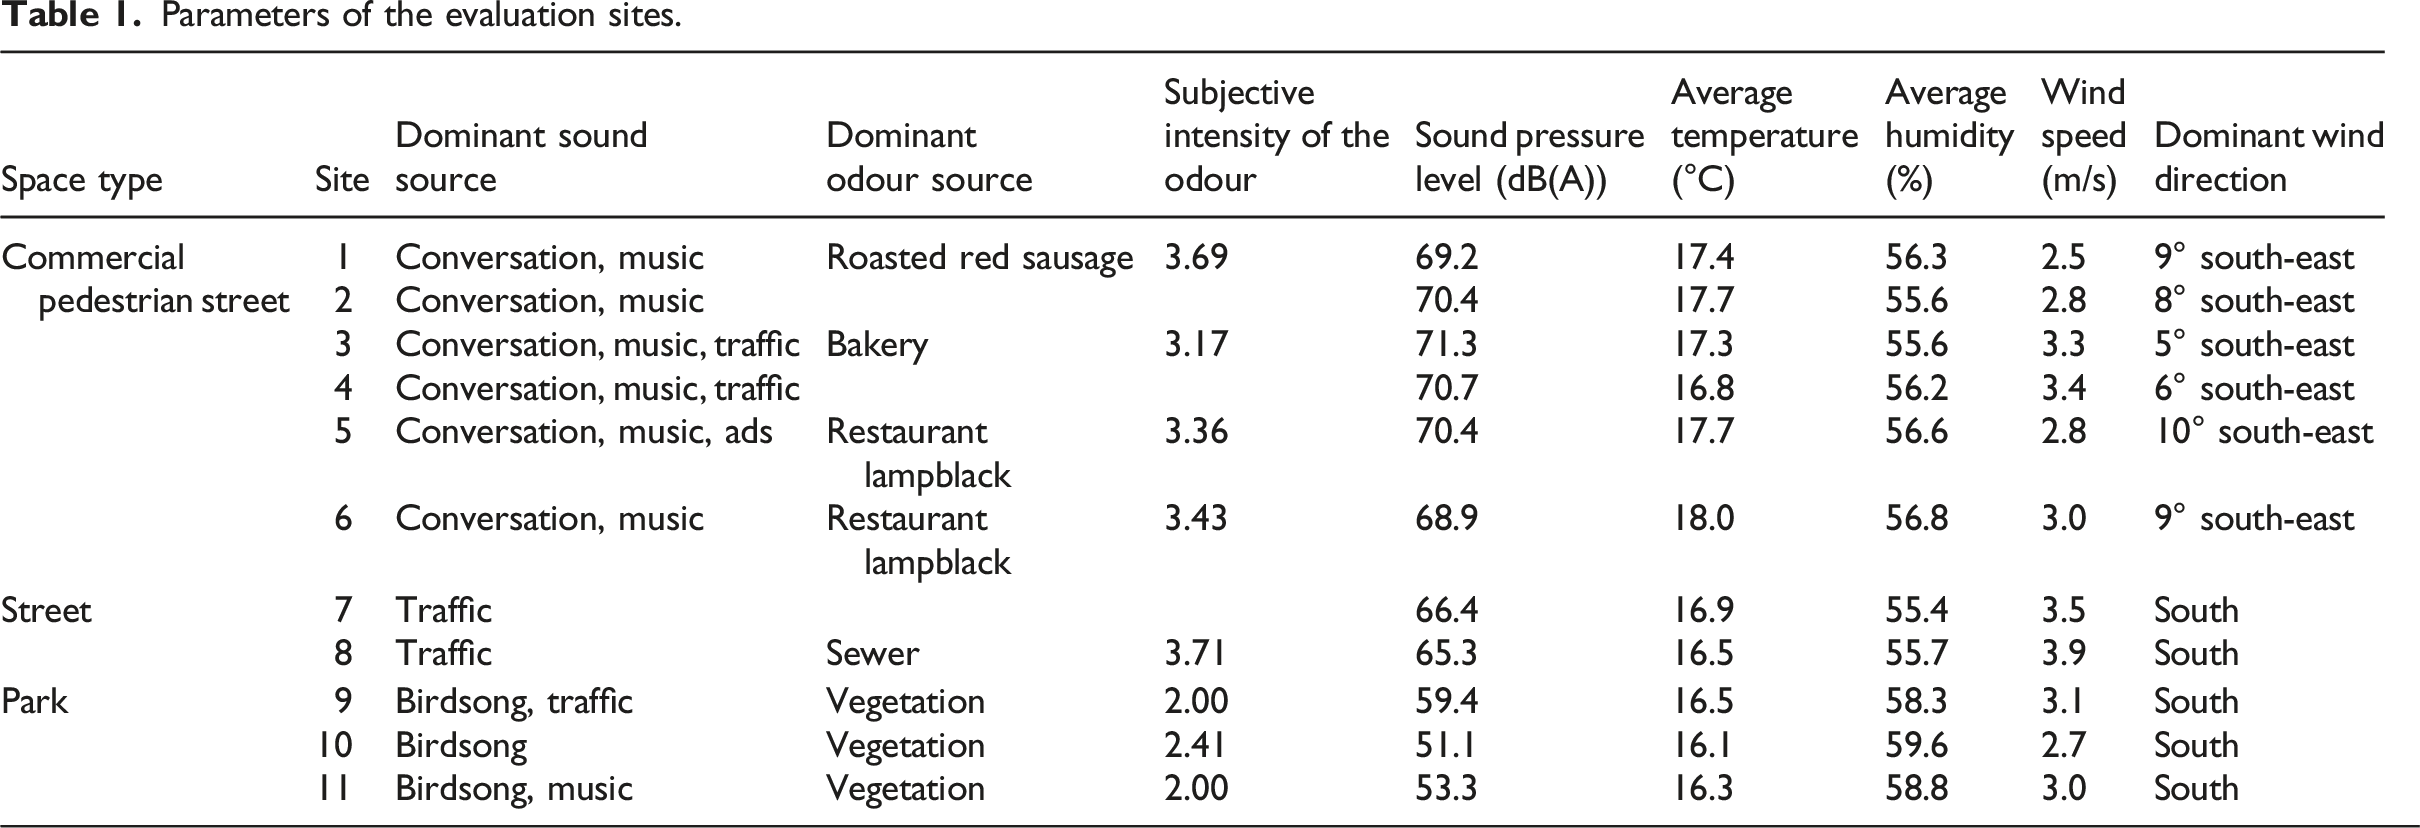
Parameters of the evaluation sites.
Questionnaire design
Table S1 includes two sections. In the first part, participants were asked to list the sounds they heard at a given location according to their impressions (up to five). Specifically, the first sound was marked as the most impressive. Its acoustic comfort, subjective loudness, and congruency between the sound and environment were then assessed. Next, the second most impressive sound was determined, and so on. Similarly, the participants also had to list the odours they smelled according to the impressions and judge the odour comfort, subjective intensity, and congruency between the odour and the environment. In the studies of soundscapes and smellscapes, these three indicators, which focus on different aspects, are the most basic and commonly used in sensory environmental assessments (Henshaw, 2013; Kang, 2006). According to the impression, the listed sound sources and odour sources were given a score ranging from ‘1–5’ as the score of the perceived degree from least impressive to most impressive. For the questionnaire, a 5-point Likert scale was used.
In the second part, participants described their perceptions of the sound and odour environments. Current research has formed a wealth of semantic evaluation descriptors. According to the soundscape (smellscape) attributes, these descriptors can be divided into four dimensions: satisfaction, strength (potency), fluctuation (activity) and social factors (Kang and Zhang, 2010; Axelsson et al., 2010; Zhang et al., 2018; Kang, 2017; Dalton et al., 2008; Royet et al., 1999; Bestgen et al., 2015). In the pre-experiment, 50 participants were asked to select suitable descriptors to describe the urban sound and odour environments from the given adjective pairs from previous studies according to the four dimensions (48 in each category), in order to evaluate the sensory environment comprehensively. The given adjective pairs are shown in Table S2, and the selected adjective pairs are shown in Table S1. The main reasons for the selection were as follows. The number of selected descriptors was more than half of the total number of participants, and the descriptors covered four types of soundscapes and smellscape attributes. The evaluation time of the 11 groups of descriptors was more appropriate for controlling the answer time for the whole questionnaire. For the questionnaire, a 5-point Likert scale was used.
Environmental measurements
As an important feature of air quality, the concentration measurement of an odour is very complex, and the smell of a city is incomplete and unclear (Rodaway, 2011). Based on the particularity of the olfactory environment discussed before, it is important to study the description of olfactory evaluation. Therefore, this study mainly considered the subjective evaluation of the odour concentration perceived by the general population. To avoid the effect of the macro-level background air quality on the experimental results, the air quality index at the city level on the day of the testing was 26 (below 50), which means that the air quality was good. The subjective intensity of the odours is shown in Table 1, and it was evaluated by the participants during the sensewalk when the odour existed, the ratings come from the statistical results of the questionnaire.
To avoid the effect of other physical factors on the results, the temperature, humidity, wind speed and wind direction were measured. The results are shown in Table 1. The average temperature was from 16°C to 18°C, the average relative humidity was from 55% to 60%, the wind speed was below 4 m/s, and the dominant wind directions of comparable sites were the same (Jeon et al., 2011; Liu et al., 2014); therefore, the environments of the comparison sites could be regard as relatively stable and representative. For test sites next to the road, the traffic flow and speed during the study were scrutinised. Video recordings of the roads were made, and the traffic flow and speed of the sites were calculated.
During the sensewalk, the sound pressure level (SPL) was gauged (Li et al., 2020). A hi-fi recorder (SQuadriga III with BHS II) was used for a five-minute, non-compressed, binaural recording at each site (24-bit, frequency rate: 51.2 kHz, frequency range: 20 Hz–20 kHz). With the CLB 1.2 adapter, the BHS II can be connected to an ICP front end supported by HEAD acoustics in order to make aurally accurate recordings. The ICP microphones feature TEDS functionality and can be calibrated with a microphone calibrator via a 1/4″ adapter. The recorder was placed 1.5 m above the geometric centre of each site. ArtemiS was used to analyse the SPLs every 10 s during the five-minute recording so that the SPLs at the comparable sites could be compared. The results of independent sample T-test showed that there were no significant differences in SPLs between Sites 1 and 2, Sites 3 and 4, Sites 7 and 8 (p > 0.05). Table 1 presents the average SPL of each site.
To control the visual factors, a GoPro Fusion 360-degree camera was used to take panoramic photos at each site (Li and Kang, 2019). The comparable sites were consistent in architectural style, pavement material, vegetation type, etc. Five visual landscape elements (vegetation, buildings, pavement, furniture and sky) were extracted from these panoramas. The proportions of these elements in each picture were calculated by superimposing 5 mm × 5 mm grids on the printed panoramic photographs so that the visual factors could be quantitatively processed (Liu et al., 2014). Less than 15% of the artificial geometric changes produced by digital photography are unrecognisable to humans (Watzek and Ellsworth, 1994). The proportions of landscape elements are shown in Table S3. The percentages of geometric differences of the same landscape factors at the comparable sites were less than 15%.
Participants
In previous sensewalk studies, there were usually 5–20 participants (Jeon et al., 2011; Liu et al., 2014). Considering individual differences and the fact that too many people themselves could have an impact on the results, 37 students were recruited through experimental information platform on campus (aged 18–35, 45.9% female, 43.2% local residents). They self-reported normal hearing and olfaction and did not wear perfume on the day of experiment. The results showed that the powers of sound and odour sources evaluations were above 0.75, and the powers of sound and odour environmental evaluations approached 1, which indicated the samples were sufficient.
Sensewalk procedure
The experiment was carried out on a workday afternoon at 2:30 p.m. on 22 August 2018 to avoid the influence of special sound or odour on the experimental conditions, and approved by the Degree Committee of the School of Architecture, Harbin Institute of Technology (this governing body has an ethical review board). All the participants confirmed that they had had lunch before the experiment to prevent the effect of hunger on the research results. All the participants walked along the specified route together under the guidance of two researchers. When answering the questionnaire at each site, participants were asked to walk around in the test site freely in order to fully perceive the sensory environment in the area. The time for participants to answer the questionnaires at each test site was about 5 min. There was no communication throughout the whole walk, which lasted approximately 60 min. Objective measurements of the physical environment were made while the participants answered the questionnaires.
Data analysis
IBM SPSS Statistics 21.0 was used to establish a database with all results. For the effect of odour on sound source evaluation, degree and probability of perception, attribute judgements of the sound source, and sound source evaluation were analysed. The independent sample t-test was used to test the differences in the average perceived degree of sound sources between comparable sites (Site 1 and 2, Site 3 and 4, Site 7 and 8), and the outcomes showed no significant differences (p > .05). Perceived probability of sound source was the ratio of the number of people who perceived the source at each site to the total number of people. For attribute judgements of the sound source, ‘keynote’ is the background audio that sets the thematic tone for the site and which other sounds modulate around; ‘sound signal’ describes foreground sounds that are usually more consciously attended to; and ‘soundmark’ is a sound that is uniquely and recognisably related to a particular location and/or culture. The existence of keynotes is high, but their perception is weak; therefore, their selection times are high, but their rating is low. The existence of sound signals is high, and their perception is strong; therefore, their selection times and ratings are both high. Soundmarks have high existence and perception in a certain space; hence, they have lower selection times and high ratings. In addition, unrelated sounds are sounds with low existence and perceived degree that have little influence on the overall soundscape. After calculating the total average perceived frequency and perceived degree of different spatial types of sound sources, comparing those of the single source with the average values. The perceived frequency or average perceived degree of single source was marked as ‘Low’ if it was lower than the total average value and “High” if it was higher than the total average value. Unrelated sounds were eliminated after the judgement of sound source attributes to reduce the statistical error, then the evaluations of the remaining sounds were analysed. The independent sample t-test was used to test the differences in the sound source evaluation between comparable sites, and the outcomes showed no significant differences (p > .05).
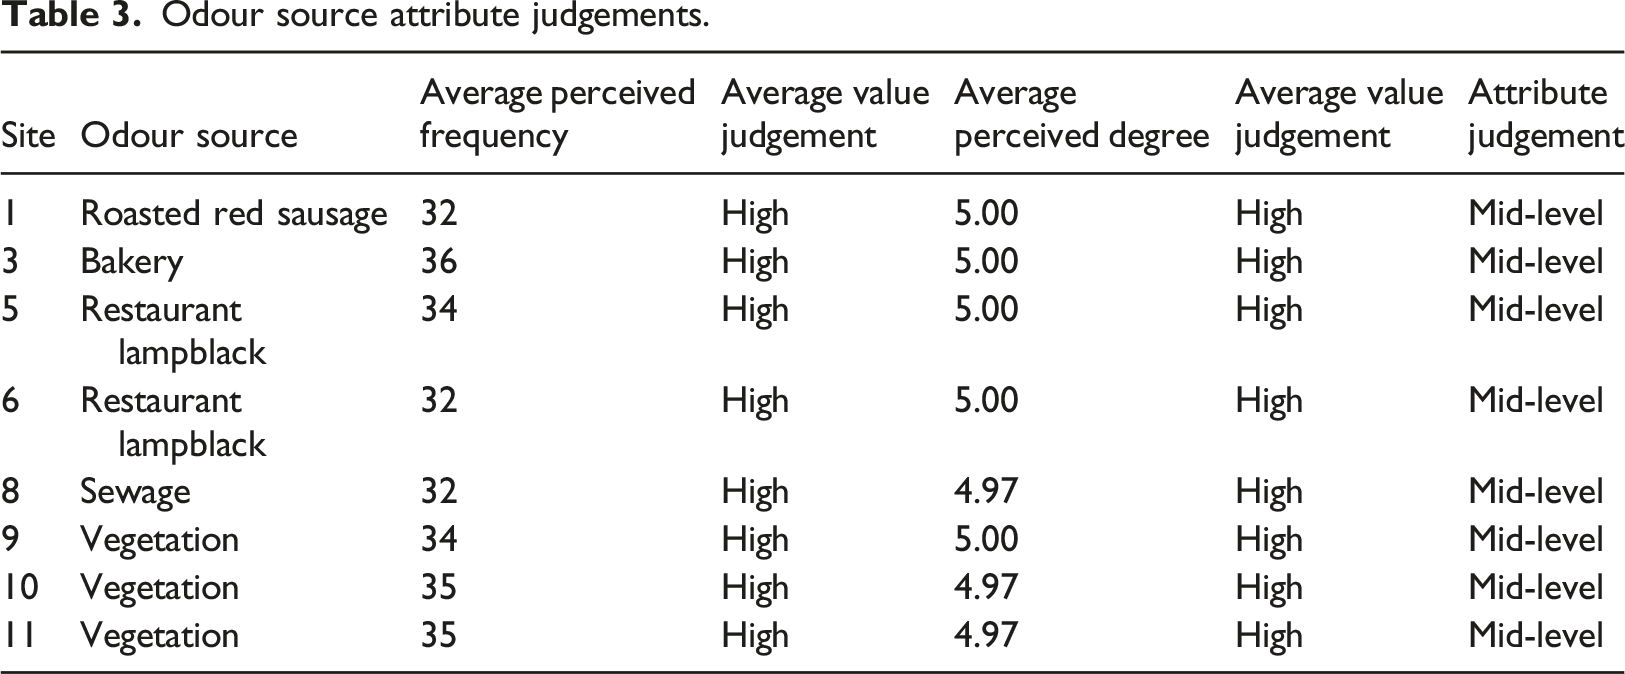
For the effect of sound on odour source evaluation, the contents of analyses correspond to previous paragraph. The outcomes of the independent sample t-test showed no significant differences (p > .05) in the average perceived degree of odour sources between comparable sites (Site 5 and 6, Site 9, 10, 11). Perceived probability of odour source was the ratio of people who perceived the source at each site to the total number of people. For attribute judgements of the odour source, a classification of odour sources analogous to the classification of sound sources in the soundscape is adopted here: macro level (corresponding keynotes), middle level (corresponding sound signal) and micro level (corresponding sound marks). The background odour provides a macro-level base note; the dominant smell of specific regions blending with background odour forms the mid-level notes and always affects people; and micro-level smell refers to local smells that change drastically and frequently. Unrelated odours are odours with low existence and perceived degree that have little influence on the overall smellscape. For odour source evaluation, independent sample t-test showed no statistically significant difference among all comparable sites (p > .05).
For the effect of odour on sound environment evaluations, the terms comfort, harshness, pleasantness, loudness, liking, familiarity, strength, excitement, eventfulness, chaos and congruency were used to refer to the 11 groups of sound environment descriptors. One-way analysis of variance (ANOVA) was used to test the differences of descriptors between the 11 sites, the outcomes showed significant differences in all descriptors among the sites except for familiarity (p = 1.000 > 0.05, F = 0.076, η2 = 0.076). The outcomes of the LSD pairwise comparison revealed significant differences between the comparable test sites (p < .05).
For the effect of sound on odour environment evaluations, the terms comfort, intensity, liking, freshness, familiarity, harshness, purity, naturalness, annoyance, cleanliness and congruency were used to refer to the 11 groups of odour environment descriptors. The outcomes of the ANOVA revealed significant differences in all descriptors except for familiarity (p = .646 > .05, F = 0.782, η2 = 0.729). The findings of the LSD pairwise comparison showed that for comfort, liking, freshness, purity, naturalness and congruency, there were no significant differences between sites 5 and 6, and there were no sizeable disparities between sites in the park (p > .05). For intensity and harshness, the results showed no significant difference between the sites in the park (p > .05).
In order to analyse the relation between sound and odour environment evaluations, a canonical correlation analysis was carried out between the descriptors, as it reflects their overall influence trend on each other.
Results
The effect of odour on sound source evaluation
Degree and probability of perception and attribute judgements of the sound source
The average perceived degree and probability of the sound source are shown in Figure S1. The highest perceived degrees were of music at sites 1 and 2, traffic and music at sites 3 and 4, and music at sites 5 and 6 (standard deviation is shown in Table S4). The perceived probabilities of them were also high. The difference between the perceived probability of traffic at sites 3 and 4 was the largest at 18.9%, suggesting that the smell of a bakery lowered the perceived probability of traffic sound. For the street, the average perceived degree and probability of traffic and conversation were almost unchanged.
Sound source attribute judgements.
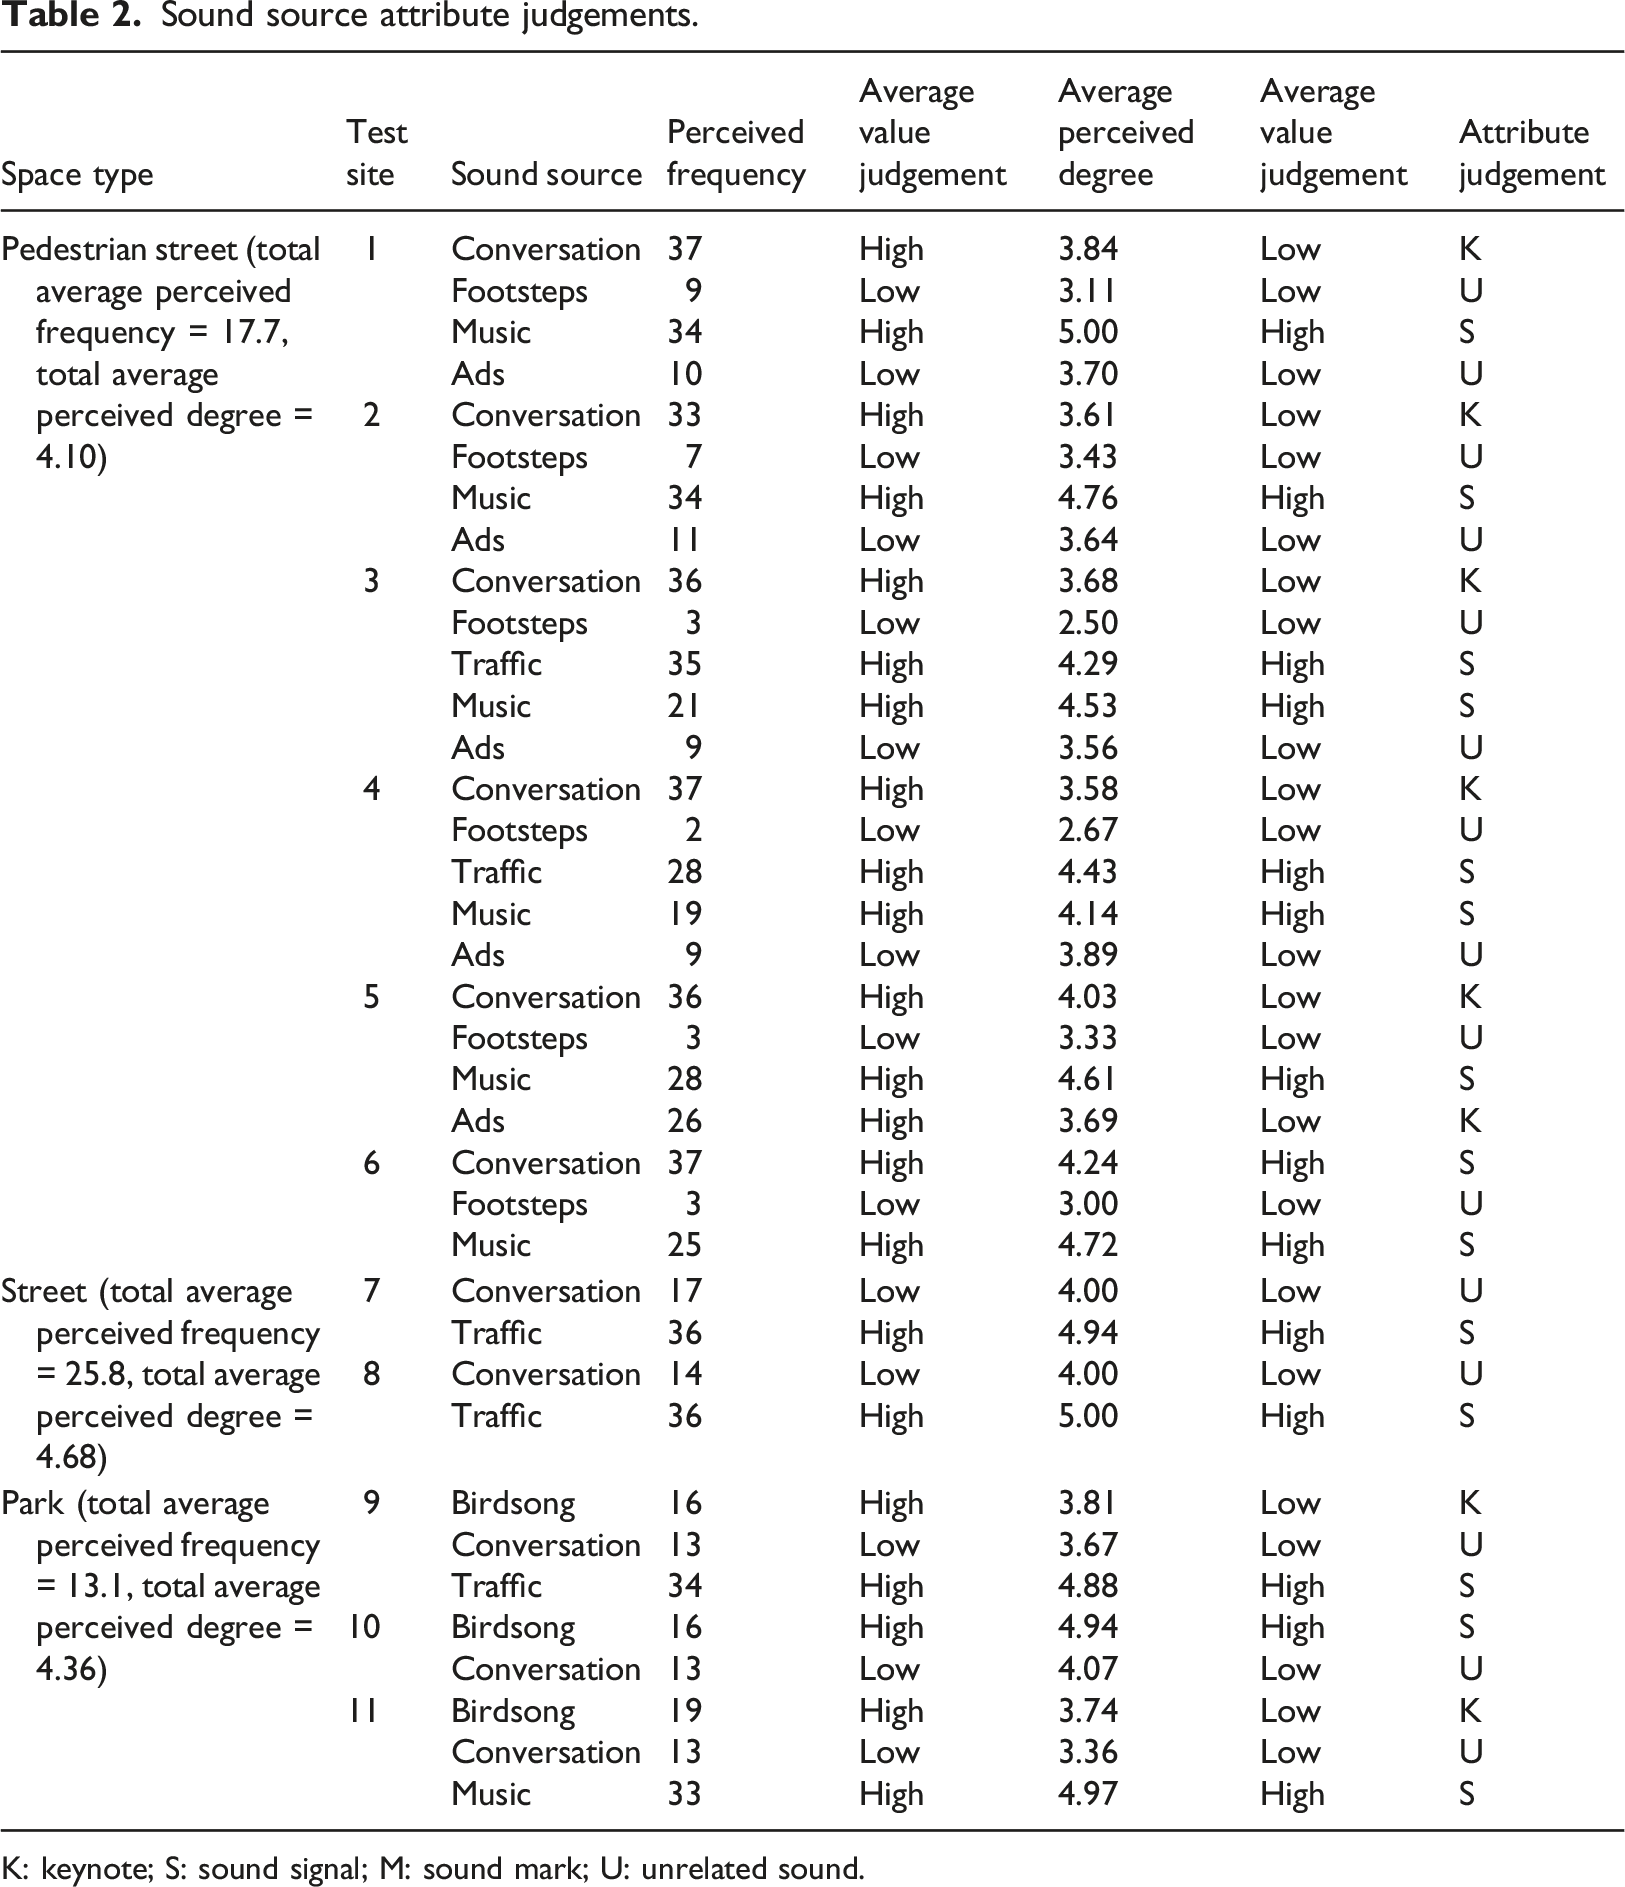
K: keynote; S: sound signal; M: sound mark; U: unrelated sound.
Sound source evaluation
The evaluations of the related sounds are shown in Figure 2. For conversation and traffic sounds in the pedestrian street, the acoustic comfort and sound congruency of the test sites with odour were higher than those of unscented test sites, but subjective loudness was the opposite. This indicates that in the presence of the food smell, the evaluations of conversation and traffic sounds were higher than without odour. In addition, the odours of roasted red sausage and bakery had relatively consistent impacts on traffic sound evaluations, which might be because they are traditional and common smells that local residents are very familiar with and like, so that could have a positive impact on negative sound source perception. For music, the acoustic comfort and sound congruency of the scented test sites were higher than those of unscented test sites. The sound of ads was one of the main sources of site 5; its subjective loudness was high, but acoustic comfort and sound congruency were low. For traffic sound in the street, the evaluation of site 7 was better than that of site 8, suggesting that the smell of pollution could worsen the sound evaluation. The odour environment of the park was the same. For birdsong, the evaluation of site 10 was the best. Subjective evaluation of main sound sources.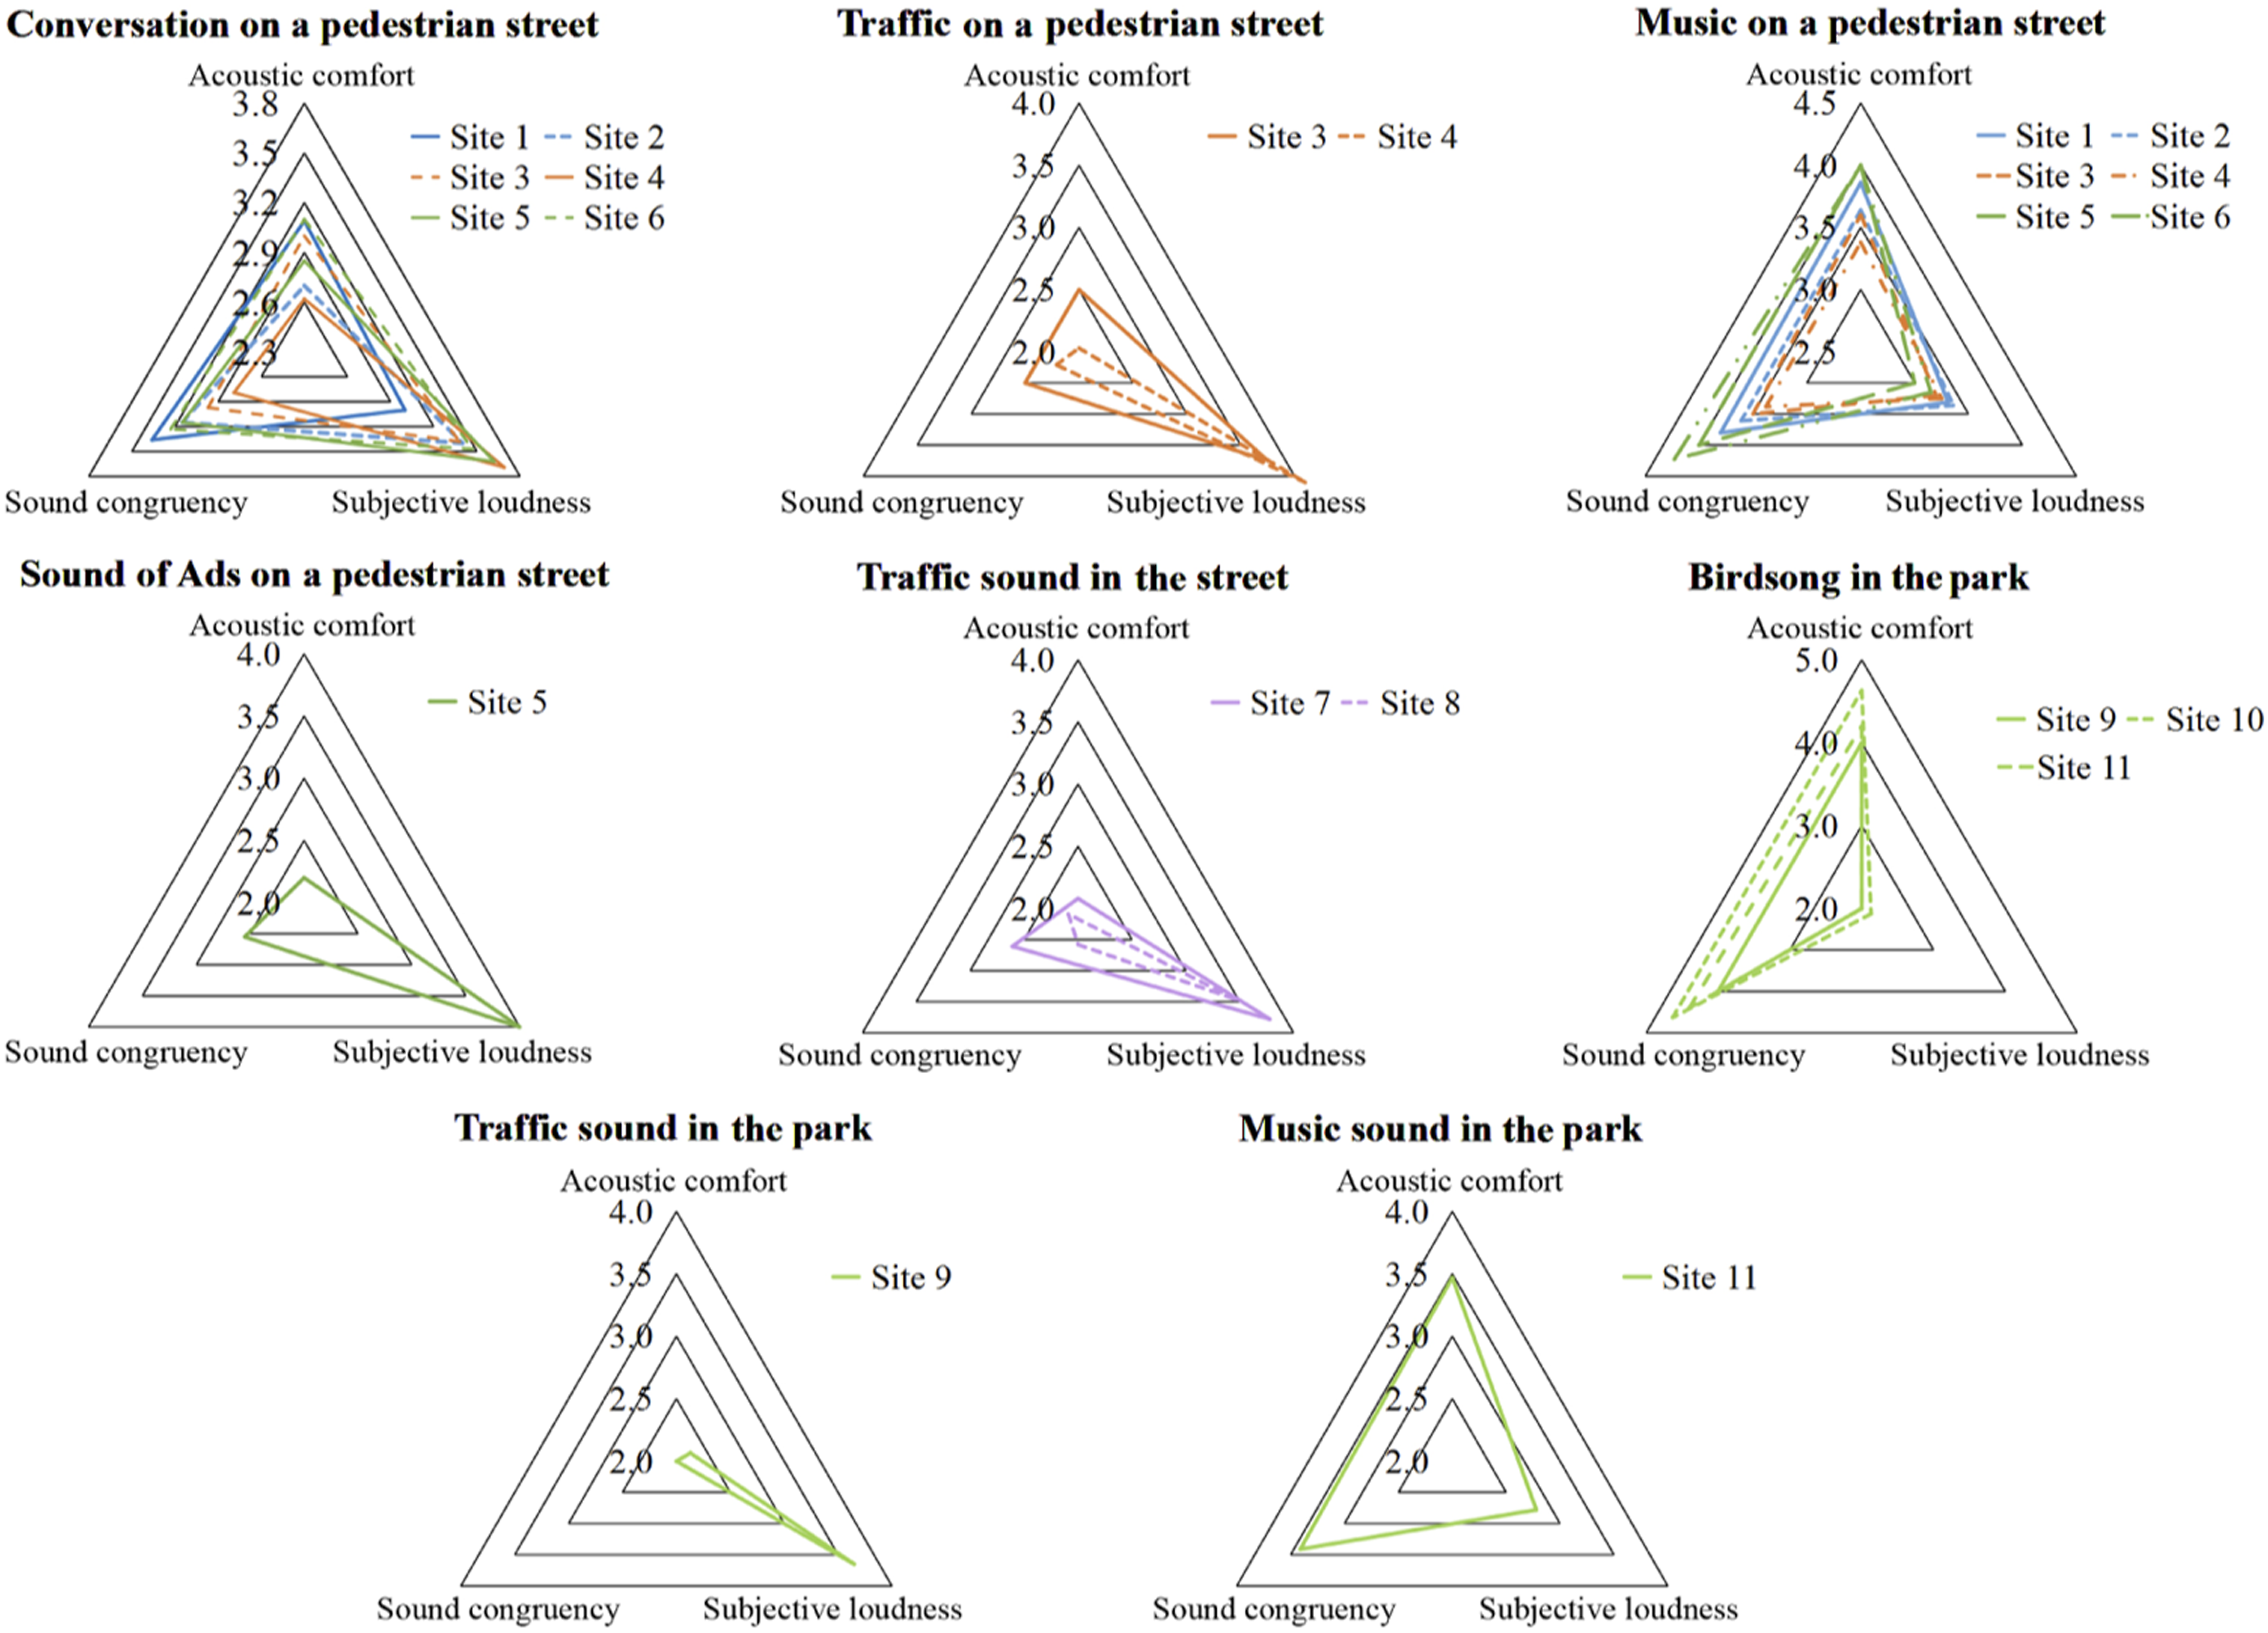
The effect of sound on odour source evaluation
Degree and probability of perception and attribute judgements of the odour source
Odour source attribute judgements.
Odour source evaluation
Figure 3 presents the evaluations of the odours. Roasted red sausage was the main odour source at site 1, its subjective intensity was high, and odour comfort and congruency were moderate. The aroma of a bakery was the main source at site 3, its subjective intensity was moderate, and odour comfort and congruency were high. Sewage was the main odour source at site 8, its subjective intensity was high, but odour comfort and congruency were low. For comparable sites with the same odour source but different sound sources, the odour of restaurant lampblack was the main odour source at sites 5 and 6, the odour comfort and congruency of site 6 were higher than those of site 5; indicating that the sound of ads may have had a weak effect on the smell of restaurant lampblack. The smell of vegetation was the main odour source in the park, and the evaluation of site 10 was the best. The dominant sound source of Site 10 was birdsong, while Sites 9 and 11 had not only birdsong but also traffic sound and music (children’s song that was not in harmony with the environment), which might have a negative impact on their vegetation smell evaluation. Subjective evaluation of main odour sources.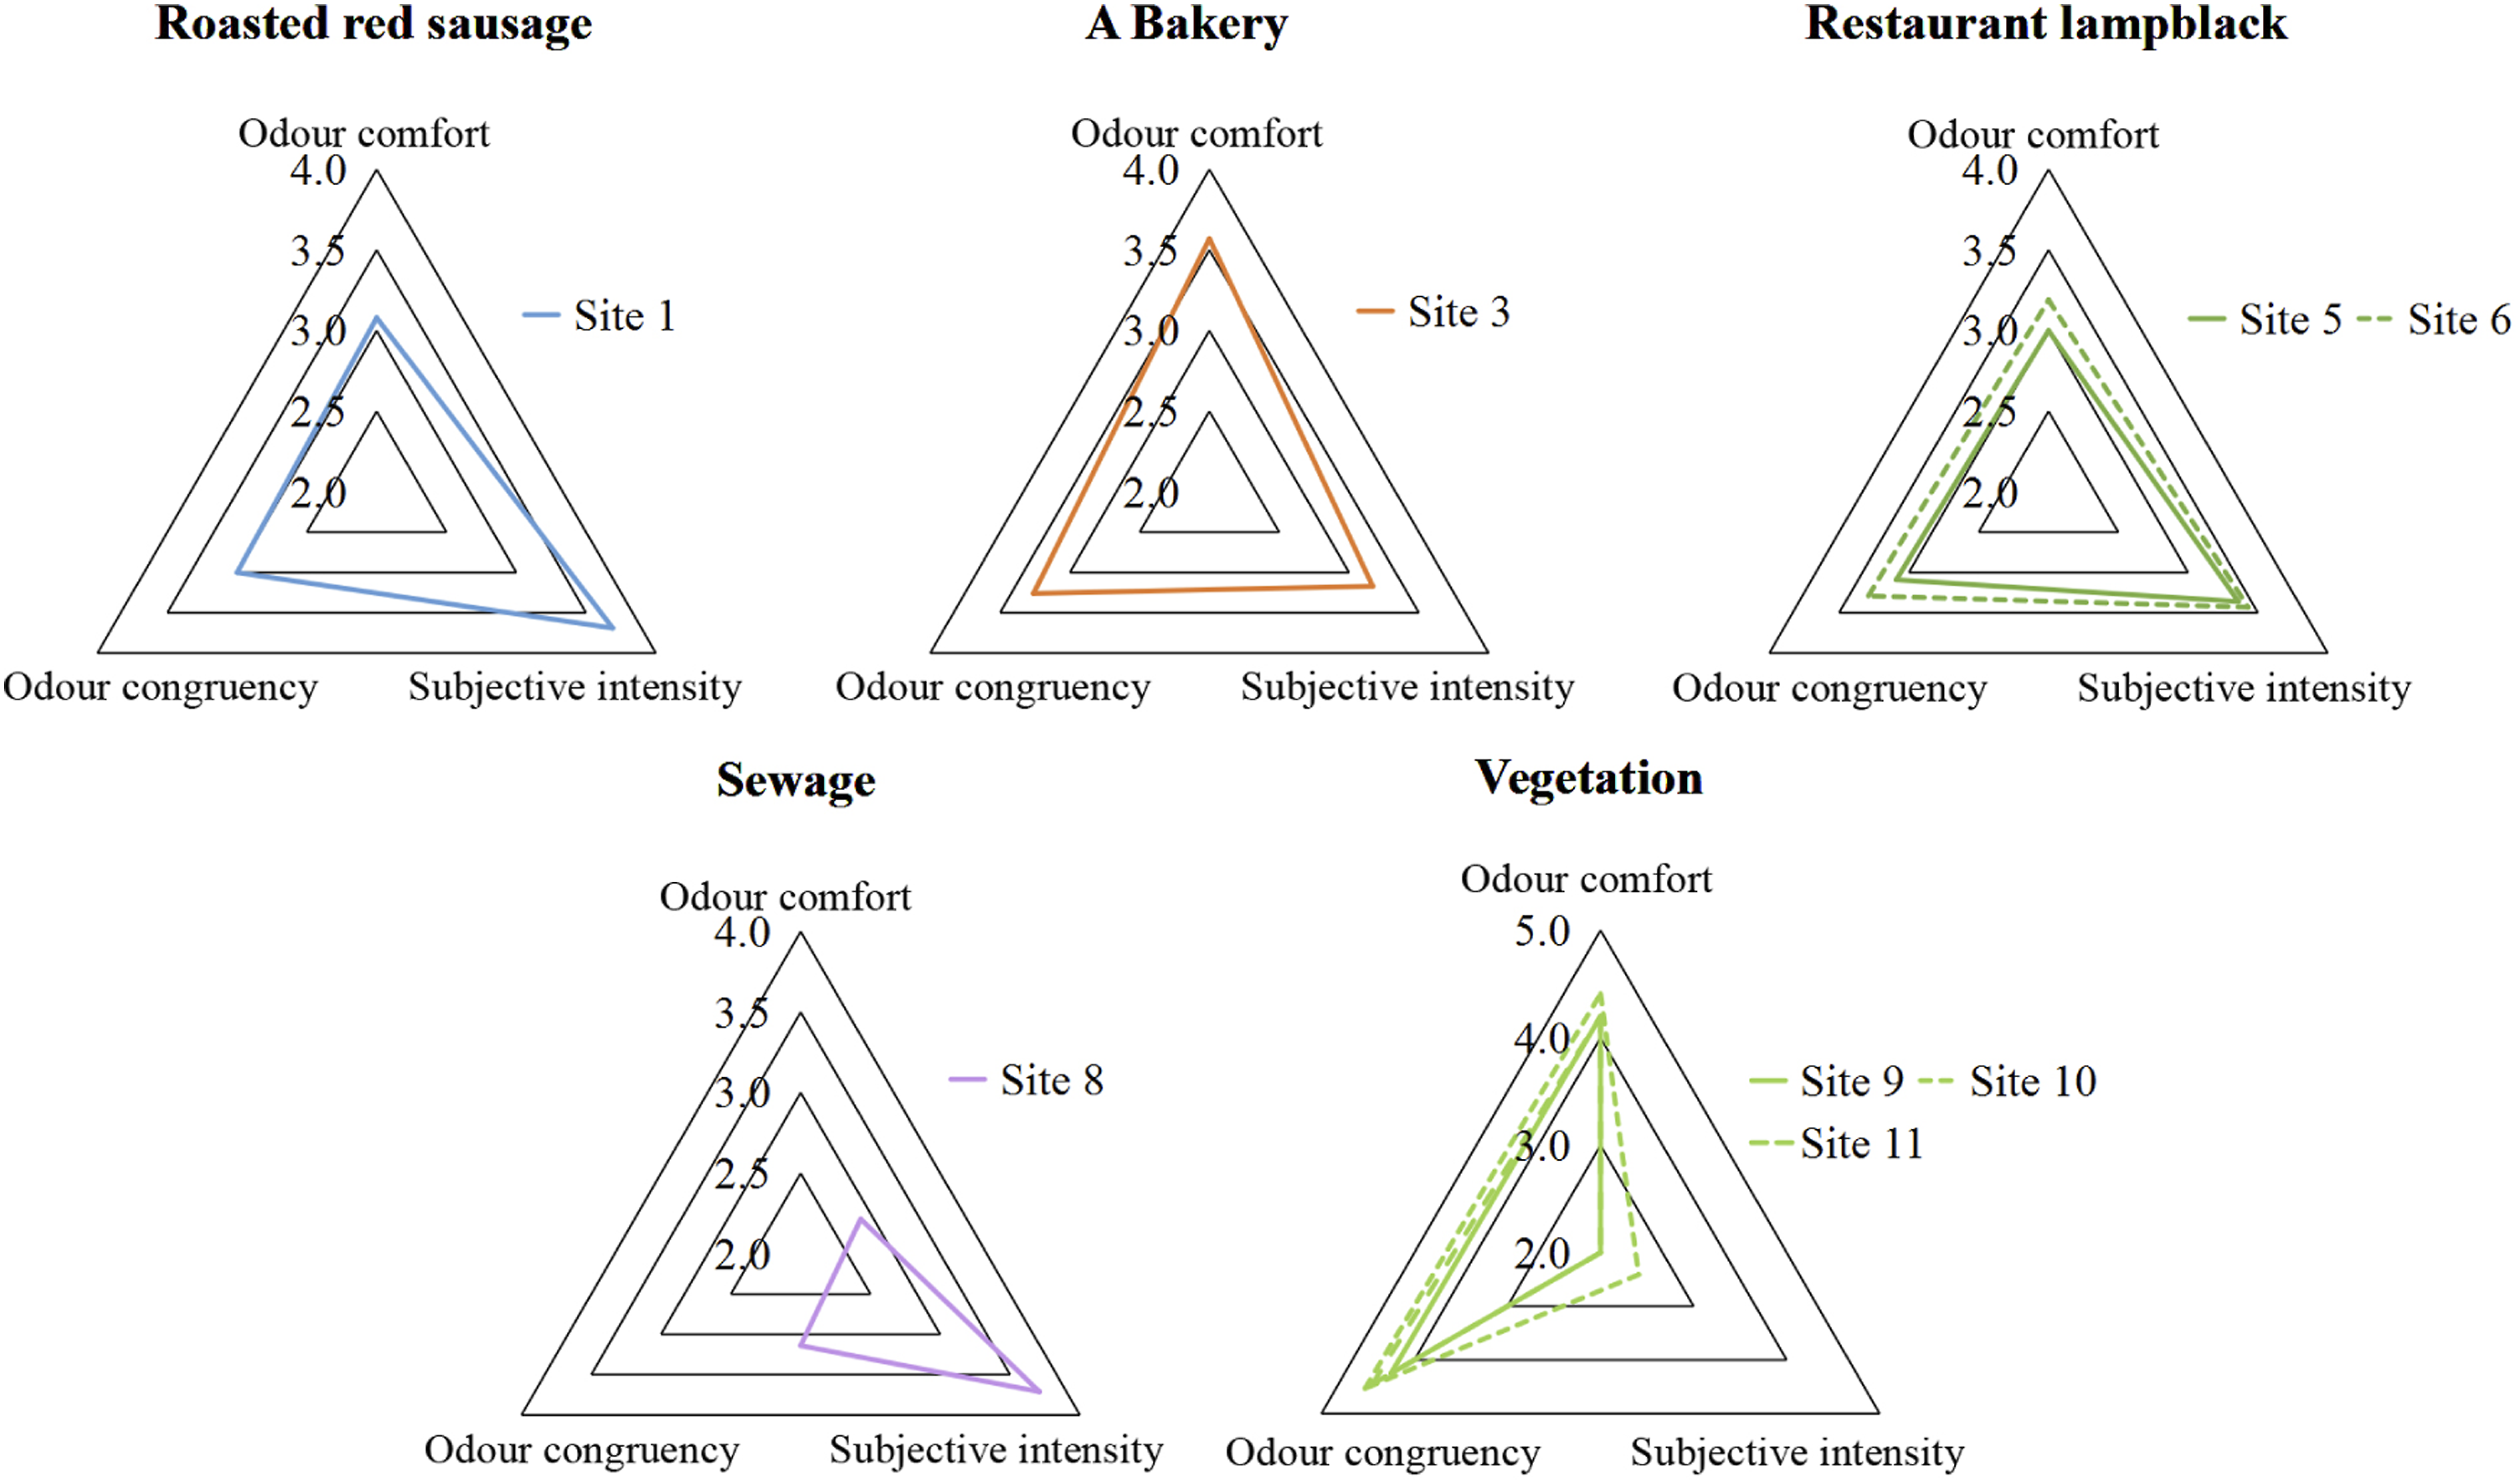
The effect of odour on sound environment evaluations
Table S5 displays the sensory environment evaluations of the 11 test sites. For the pedestrian street, food odour may have enhanced the sound environment evaluations of the pedestrian street, and the improvement in the odour of roasted red sausage was higher than that of a bakery. For the street, the odour of sewage might reduce the sound environment evaluations. Although different odours had different effects, the sound environment evaluation indicators of the four dimensions were all affected by odour, indicating that odour had an omnidirectional impact on sound environment evaluations, and the impact on people’s satisfaction was the strongest.
The effect of sound on odour environment evaluations
For the pedestrian street, the intensity and harshness of site 5 were approximately 0.3 lower than those of site 6. Site 5 had the sound of ads while site 6 did not. The sound environment on the pedestrian street was often mixed, and the sound of ads was not evident due to the masking effect of other sounds, and it could not draw more attention; therefore, it had little impact on the evaluation of the odour environment. For the park, there were no significant differences in the evaluation at all sites. A possible reason was that the SPL in the park was low, and the impact on the evaluation was not evident.
Discussions
Similarities and differences between sound and odour source evaluations
Regarding the similarity, there was little change in the perceived probability of both sound and odour, and sound and odour did not affect each other’s perceived degree or attribute judgements. The presence of odour reduced the subjective loudness of sound, and increased sound reduced the subjective intensity of odour, which verified a masking effect between sound and odour and was consistent with the results of the laboratory study (Ba and Kang, 2019a). In addition, sensory sources with better evaluations improved the assessment of other sensory sources while sensory sources with worse evaluations worsened assessments. Regarding the differences, the effect of odour on the sound source evaluation was greater than that of sound on the odour source evaluation. This might be because there were two conditions (i.e. with and without odour) in the experiment, but they hardly occur when the city is silent; hence, the sound variable is the change in a single sound source, which leads to a stronger contrast between the odour and sound variables.
Correlations between the sound and odour environment evaluations
In order to analyse the relation between the sound and odour environment evaluations, canonical correlation analysis was carried out between the descriptors. The findings revealed four significant canonical correlation pairs (p < .05), of which the correlation coefficients of the first two pairs were more than 0.5 (Figure S3). The first canonical correlation structure has a correlation coefficient of 0.696 between the sound and odour environment evaluations (Figure S3(a)). The relationships among the typical variables with correlation coefficients greater than 0.5 were coloured. The lower the comfort, pleasantness, liking and congruency of the sound and the higher its harshness, loudness and excitement, the lower the comfort, liking, congruency, freshness, naturalness and cleanliness of the odour and the higher its annoyance and harshness. For the second canonical correlation structure, the correlation coefficient between the sound and odour environment evaluations was 0.503 (Figure S3(b)). The lower the familiarity and strength of a sound, the lower the familiarity of the odour and the higher its naturalness.
Typical redundancy analysis showed that, in the first correlation pair, the degree of interpretation of the sound environment evaluation to odour environment evaluation was 17.9%, and the degree of interpretation of odour environment evaluation to sound environment evaluation was 19.8%, indicating that the impact of odour environment evaluation on sound environment evaluation was greater than the opposite situation.
The influence of context on the research results
Context might also affect the experimental results. In previous laboratory studies, the variable stimuli were only sound and odour, and fewer dimensions would lead to more imagination. For example, for a given birdsong and coffee odour in the laboratory, some participants said they would fantasise about a coffee shop in a mountain forest while others associated it with a coffee shop on the street. The specific on-site context will limit the scene, thus making the results more targeted. In addition, previous study has found that audio–visual information can also evoke specific smellscape imagination, and consequently the influence of imagination on multimodal perception should not be underestimated (Lindborg and Liew, 2021). The results of this study showed that the number of odour environment evaluation indicators affected by sound was less than the number of the sound environment evaluation indicators affected by odour and to a lesser extent, indicated that the influence of odour on sound perception was stronger than the influence of sound on odour perception. This is consistent with the previous study (Ba and Kang, 2019a). However, the impact of sound on the odour environment evaluation in the park was very small, with most evaluation indicators varying by less than 0.3. For instance, the greatest decreases in Naturalness, Cleanliness and Congruency were observed when there was traffic noise (0.3 for each), while when there was music, the change in most of the evaluation indicators was less than 0.2, which might be because the park is very comfortable and popular; other factors such as vision, could make people ignore some sound and odour changes in the environment.
Conclusions
This study employed a sensewalk in order to explore multisensory environmental evaluations of sound and odour in typical urban environments. The results showed that sound and odour can affect each other’s perception, the following are the specific conclusions:
For sensory source perception, food odour improved the acoustic comfort and congruency and lowered subjective loudness but had little effect on sound signals with strong perceptions. The smell of pollution worsened the evaluation of traffic and decreased subjective loudness. Sound diminished the subjective intensity of odour and exacerbated its evaluation.
For sensory environment perception, odour had a substantial influence on the sound environment evaluation. When there was food smell in the environment, the sound environment evaluation of the pedestrian street improved. Improvements in various food odours differed while the opposite was true when there was pollution odour. Odour might reduce the subjective loudness of the sound environment to a certain extent. Sound had a significant impact on the odour environment evaluation, but the effect was weak.
This study has implications for the design and policy of the living environment through the perspective of sensory interaction. For instance, in the design of urban spaces, the audio–olfactory interaction can be used to select the appropriate combination of sound and odour, and to reasonably arrange the layout of the location of sound sources and odour sources so as to bring more comfortable and various sensory experiences to the users of the cities. Moreover, the discomfort caused by the existing negative sensory sources such as noise or stench in the environment can be weakened through the masking effect between sound and odour.
In terms of limitations and implications for future research, this study explored the multisensory environmental evaluations of young people in urban public open spaces, whether there are similar patterns for different populations (age, gender, profession, culture, religion, etc.), and the comparison of results under different conditions merit further study. In addition, future research could further explore the effects of auditory-olfactory interaction environment on physiology and cognition, and explore the regularity of perception from the perspective of cognitive science.
Supplemental Material
Supplemental Material - The multisensory environmental evaluations of sound and odour in urban public open spaces
Supplemental Material for The multisensory environmental evaluations of sound and odour in urban public open spaces by Meihui Ba and Zhongzhe Li in Environment and Planning B: Urban Analytics and City Science
Footnotes
Declaration of conflicting interests
The author(s) declared no potential conflicts of interest with respect to the research, authorship, and/or publication of this article.
Funding
The author(s) disclosed receipt of the following financial support for the research, authorship, and/or publication of this article: This paper is supported by Zhejiang Provincial Philosophy and Social Sciences Planning Project (23NDJC135YB), and the European Research Council (ERC) Advanced Grant (grant number 740696).
Supplemental Material
Supplemental material for this article is available online.
References
Supplementary Material
Please find the following supplemental material available below.
For Open Access articles published under a Creative Commons License, all supplemental material carries the same license as the article it is associated with.
For non-Open Access articles published, all supplemental material carries a non-exclusive license, and permission requests for re-use of supplemental material or any part of supplemental material shall be sent directly to the copyright owner as specified in the copyright notice associated with the article.