
Abstract
The Pearl River Delta metropolitan region is one of the most densely urbanized megapolises worldwide with high exposure to weather-related disasters such as storms, storm surges and river floods. Shenzhen megacity has been the fastest growing city in the Pearl River Delta region with a significant increase of resident population from 0.32 million in 1980 to 13.03 million in 2018. Being a flood-prone city, Shenzhen’s rapid urbanization has further exacerbated potential flood losses and forthcoming risk. Thus, evaluating the changes in its exposure from present to future is essential for flood risk assessment, mitigation and management purposes. The main objective of this study is to present a methodology to assess the spatio-temporal dynamics of flood exposure from present to future using high-resolution and open-source data with a particular focus on the built-up area. To achieve this, the SLEUTH model, a cellular automata-based urban growth model, was employed for predicting the built-up area in Shenzhen in 2030. An almost threefold increase was observed in total built-up area from 421 km2 in 1995 to 1166 km2 in 2030, with the 2016 built-up area being 858 km2. Built-up areas, both present (2016) and projected (2030), were then used as the land cover input for flood hazard assessment based on a fuzzy comprehensive evaluation model, which classified the flood hazard into five levels. The analysis indicates that the built-up area subjected to the two highest flood hazard levels will increase by almost 88% (212 km2) from present to future. The approach presented here can be leveraged by policymakers to identify critical areas that should be prioritized for flood mitigation and protection actions to minimize potential losses.
Introduction
Background information on the study area
Weather-related disasters such as storms, storm surges and floods accounted for 90% of all disasters between 1995 and 2015 (Wahlstrom and Guha-Sapir, 2015). Currently, China has the highest exposure to floods in terms of population and built-up area (Pesaresi et al., 2017). In addition to being susceptible to weather-related events, rapid urban and economic growth have been the main drivers of the flood risk in China, as exacerbated by climate change. This rapid urban growth has resulted from market reforms and the launch of decentralization policies during the 1970s, leading to unprecedented economic growth (Seto et al., 2002) with consequent population migration to urban areas. In particular, the Pearl River Delta (PRD) metropolitan region, situated in the vicinity of Pearl River (Zhujiang), has been one of the fastest developing regions in China. It has shown a dramatic urban and economic growth to become one of the most densely urbanized megalopolises worldwide with >50 million inhabitants as well as a major economic centre in China. It has nine core cities, namely Dongguan, Foshan, Guangzhou, Huizhou, Jiangmen, Shenzhen, Zhaoqing, Zhongshan and Zhuhai (Figure 1(a)). Shenzhen megacity (megacity customarily defined as having a population >10 million), located in the southern PRD (Figure 1(b)), has been a pioneer of China’s opening-up policy (Ng, 2005). Accordingly, Shenzhen’s resident population has increased significantly from 0.32 million to 13.03 million (40.7 times) between 1980 and 2018 (Shenzhen Statistics Bureau, 2019; WWF, 2007).
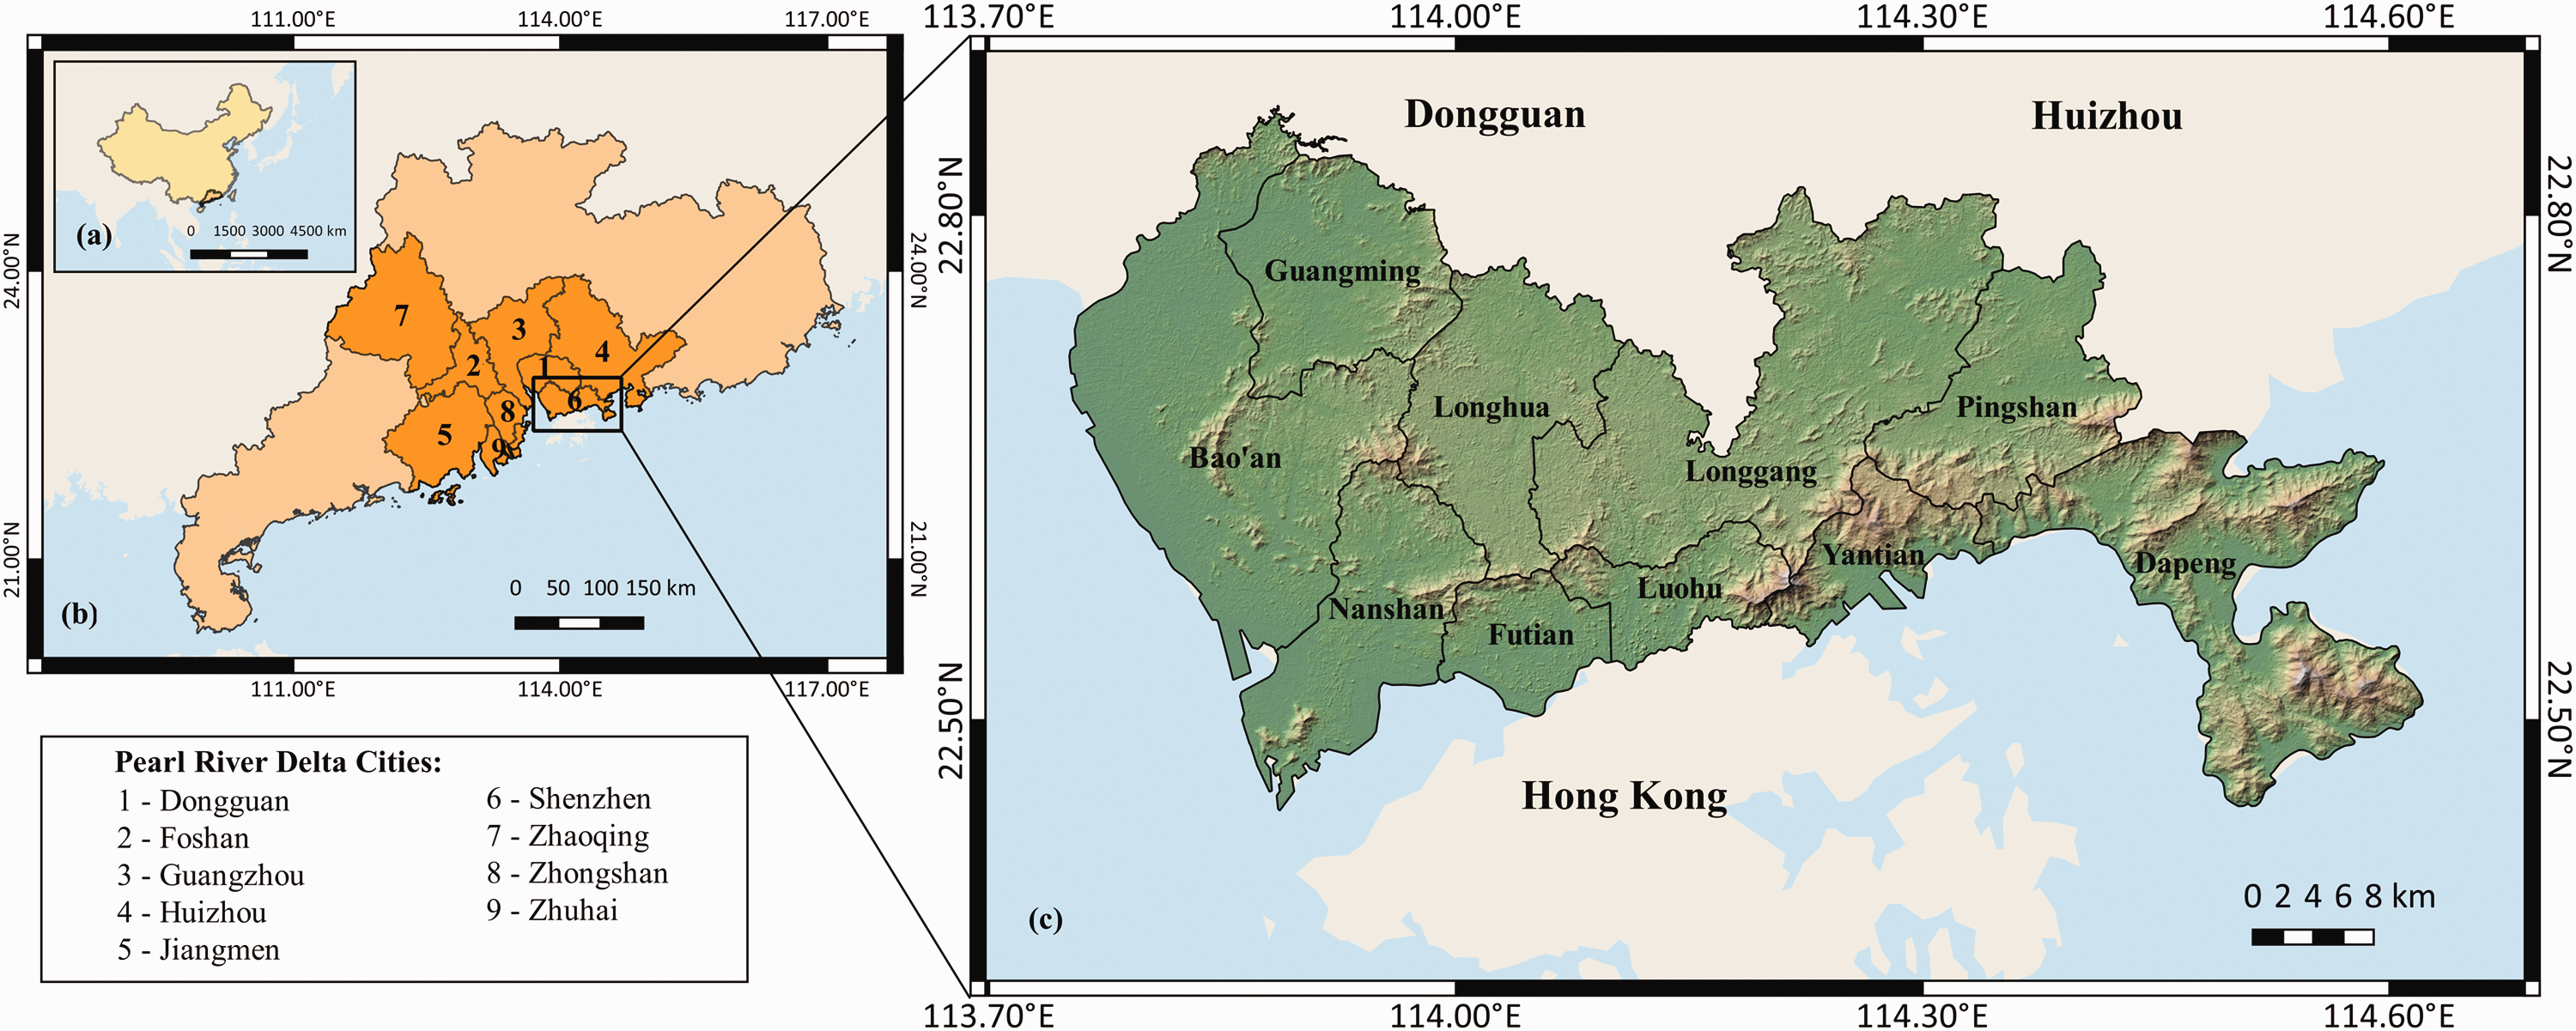
Study area: (a) China, (b) Pearl River Delta metropolitan region and (c) Shenzhen megacity.
The PRD region was also reported as the top-ranked metropolitan area for China in terms of the population potentially affected by storms, storm surges, and river floods (Sundermann et al., 2013). Characterized by its hilly coastal topography, high urbanization, and recurrent typhoon strikes, Shenzhen is particularly vulnerable to pluvial flooding from intense rainfall events and coastal flooding due to storm surges (Zhou et al., 2017). Amongst the 136 major coastal cities studied in Hallegatte et al. (2013), Shenzhen was ranked the ninth in terms of its average annual flood loss estimate (169 million USD) in 2005, and it was predicted to rank the fifth (2929 million USD in scenarios arising from socio-economic change alone) by 2050. It was also among the top 20 in terms of the number of people exposed to a 100-year coastal flood event (Nicholls et al., 2007).
Subjected to the subtropical monsoon climate, Shenzhen has an annual average rainfall of 2007.4 mm between 2015 and 2020 (Meteorological Bureau of Shenzhen Municipality, 2020). In the city, heavy rains are usually concentrated between April and September, overlapping with frequent typhoon events from June to September. Precipitation is distributed unevenly in temporal and spatial extents with rainfall patterns generally characterized by short duration and high intensity. This often results in a large peak discharge rate and overflow in drainage systems and rivers (Zhang et al., 2015). From 1980 to 2014, 40 rainstorm-induced events were reported in Shenzhen with a total death toll of 120 and 5.2 million people affected (Zhou et al., 2017). Recent surveys of surface water flooding hotspots in the city reveal that Bao’an, Longgang, Guangming, Longhua, Pingshan and Dapeng Districts are most prone to surface water flooding (Meteorological Bureau of Shenzhen Municipality, 2020; Zhang et al., 2015). Various causes have been identified for these hotspots, including backflow in drainage pipelines caused by storm surge, aging of pipes and insufficient drainage capacity, insufficient cut-off drains, depression in topography that impedes runoff and inadequate maintenance (Zhang et al., 2015). The distribution of flooding locations in 2019 (Meteorological Bureau of Shenzhen Municipality, 2020) also shows that Guangming District in northwest Shenzhen, and Futian and Luohu Districts located in the centre and southern part of Shenzhen are the most vulnerable. In particular, the recent extreme heavy precipitation event on 11 April 2019 affected the Futian and Luohu Districts most severely, with 11 deaths and a direct economic loss of more than 22.5 million Renminbi (RMB).
Shenzhen city has planned to tackle the flooding issue by implementing the Sponge City concept throughout its urban planning, construction and maintenance aspects. By upgrading the existing drainage system and introducing green infrastructure, Shenzhen aims to improve its urban stormwater collection efficiency and storage capacity, which would enhance its resilience to flooding. The project was launched in 2016 and consists of three phases, namely 2016 to 2020, 2020 to 2030 and 2030 afterwards. The results presented here can inform on critical areas that should be prioritized in flood hazard zoning and urban planning, as well as for flood mitigation and protection actions to minimize potential flood losses.
Assessment of spatio-temporal dynamics in flood exposure
Recent developments in technology have brought about profound advancements in disaster risk management. There have been transitions from static quantitative risk assessments to dynamic ones to reflect the pace of change in urbanization, and thus exposure (Mestav Sarica et al., 2020a; Wenzel et al., 2014). In addition to representing exposure variation in terms of built-up areas, change in impervious surfaces due to urbanization also alters the natural capacity for rainwater infiltration and runoff during rainfall events. Hence, evaluation of impact from changes in built-up area for flood risk assessment must span both hazard and exposure.
The nonlinear and complex nature of urban growth dynamics necessitates modelling Land Use and Land Cover (LULC) to make future predictions. Changes in LULC at the local, regional and global levels has been the subject of recent research efforts (Bagan and Yamagata, 2014; Dadras et al., 2014; Fritz et al., 2011; Huang et al., 2019; Zhou et al., 2019). The effects of LULC changes on areas such as sustainability, ecosystem services, biodiversity, conservation, environmental protection, air quality and food security have been scrutinized by previous studies (Andrade-Núñez and Aide, 2018; Fan et al., 2019; Guneralp et al., 2017; John et al., 2009; Kraemer et al., 2015; Vadrevu et al., 2017). However, there has been a limited number of studies for its application in flood risk assessment and mitigation purposes. Zhou et al. (2013) used urban growth modelling (UGM) to estimate the changes in flood volume in the Yangtze River Delta region. Sekovski et al. (2015) investigated the flood vulnerability of the Emilia-Romagna region coastline to marine flooding by coupling urban growth scenarios with scenario-based marine flooding extents. Muis et al. (2015) developed a probabilistic approach to assess country-level future flood risk in terms of expected annual damage in Indonesia. Moe et al. (2017) analysed the effects of future land use change on flood inundation volume in Jakarta. (Han et al., 2020) studied the impacts of built-up land growth models on flood vulnerability in the Yangtze River Economic Belt. Although these studies have focused on different components of flood risk, evaluation of the dynamics of exposure has not yet been tackled. In this study, the main objective is to present a methodology that can be used to assess the spatio-temporal dynamics of flood exposure from present to future using high-resolution and open-source data with a particular focus on the built-up area. Shenzhen megacity was selected as a case study due to its rapid urban growth and high exposure to floods. We believe that by taking spatial change into account along with the temporal change, a more accurate projection for future exposure can be achieved (Mestav Sarica et al., 2020b) as compared to purely statistical approaches that consider only temporal change.
Methodology
Urban growth modelling
Various methods such as cellular automata (CA), artificial neural networks and agent-based modelling have been used in recent years for UGM. Among these models, CA has been widely adopted owing to its close integration with Geographic Information Systems (GIS) (Batty, 1998; Batty et al., 1999). In this study, the CA-based SLEUTH model (Clarke et al., 1997; Silva and Clarke, 2002) was employed for UGM. The SLEUTH model has a robust historical calibration routine (Sekovski et al., 2015), and the combination of SLEUTH with GIS and remote sensing has been regarded as an effective approach for the prediction of future urban extent (KantaKumar et al., 2011).
The name of the SLEUTH model (available at www.ncgia.ucsb.edu/projects/gig/) is an acronym for its required inputs, namely, slope, land use, excluded urban areas, transportation and hillshades. At least four temporal snapshots of the urban area are required; therefore, built-up area maps of Shenzhen in 1995, 2001, 2008 and 2016 were processed from selected Landsat Thematic Mapper (TM) images with a spatial resolution of 30 m (available at https://earthexplorer.usgs.gov/). The semi-automatic classification plugin from QGIS (Congedo, 2016) was used to perform classification of built-up area in these years, which were particularly selected considering the availability of Landsat images with less than 20% cloud coverage. To evaluate the accuracy of the built-up area classification, 100 urban and 100 non-urban classified grids were randomly sampled for each selected year, which were then compared with the reference (ground truth) maps. The overall accuracy values, defined as the ratio of correctly classified grids to all sampled grids, were 0.85 (1995), 0.85 (2001), 0.87 (2008) and 0.86 (2016), which are consistent with the suggested limit of 0.85 (Foody, 2008). Detailed land use inputs were not used since only urban grids were employed to represent built-up areas. Water bodies were mapped to represent excluded areas, i.e. not allowed to become urbanized. Two transportation input maps were obtained for the years 2004 and 2016 by digitizing the road network from the Landsat images and utilizing OpenStreetMap (available at www.openstreetmap.org), respectively. ASTER GDEM data were processed to obtain slope (in percentage) and hillshade inputs. The grids having slope values higher than 21% are not allowed to become urbanized. All SLEUTH inputs were then resampled to 90 m spatial resolution, the same resolution as the outputs and later flood hazard maps. The built-up area expansion from 1995 to 2016 is illustrated in Figure 2, with other inputs of the SLEUTH model provided in the Supplemental Materials.
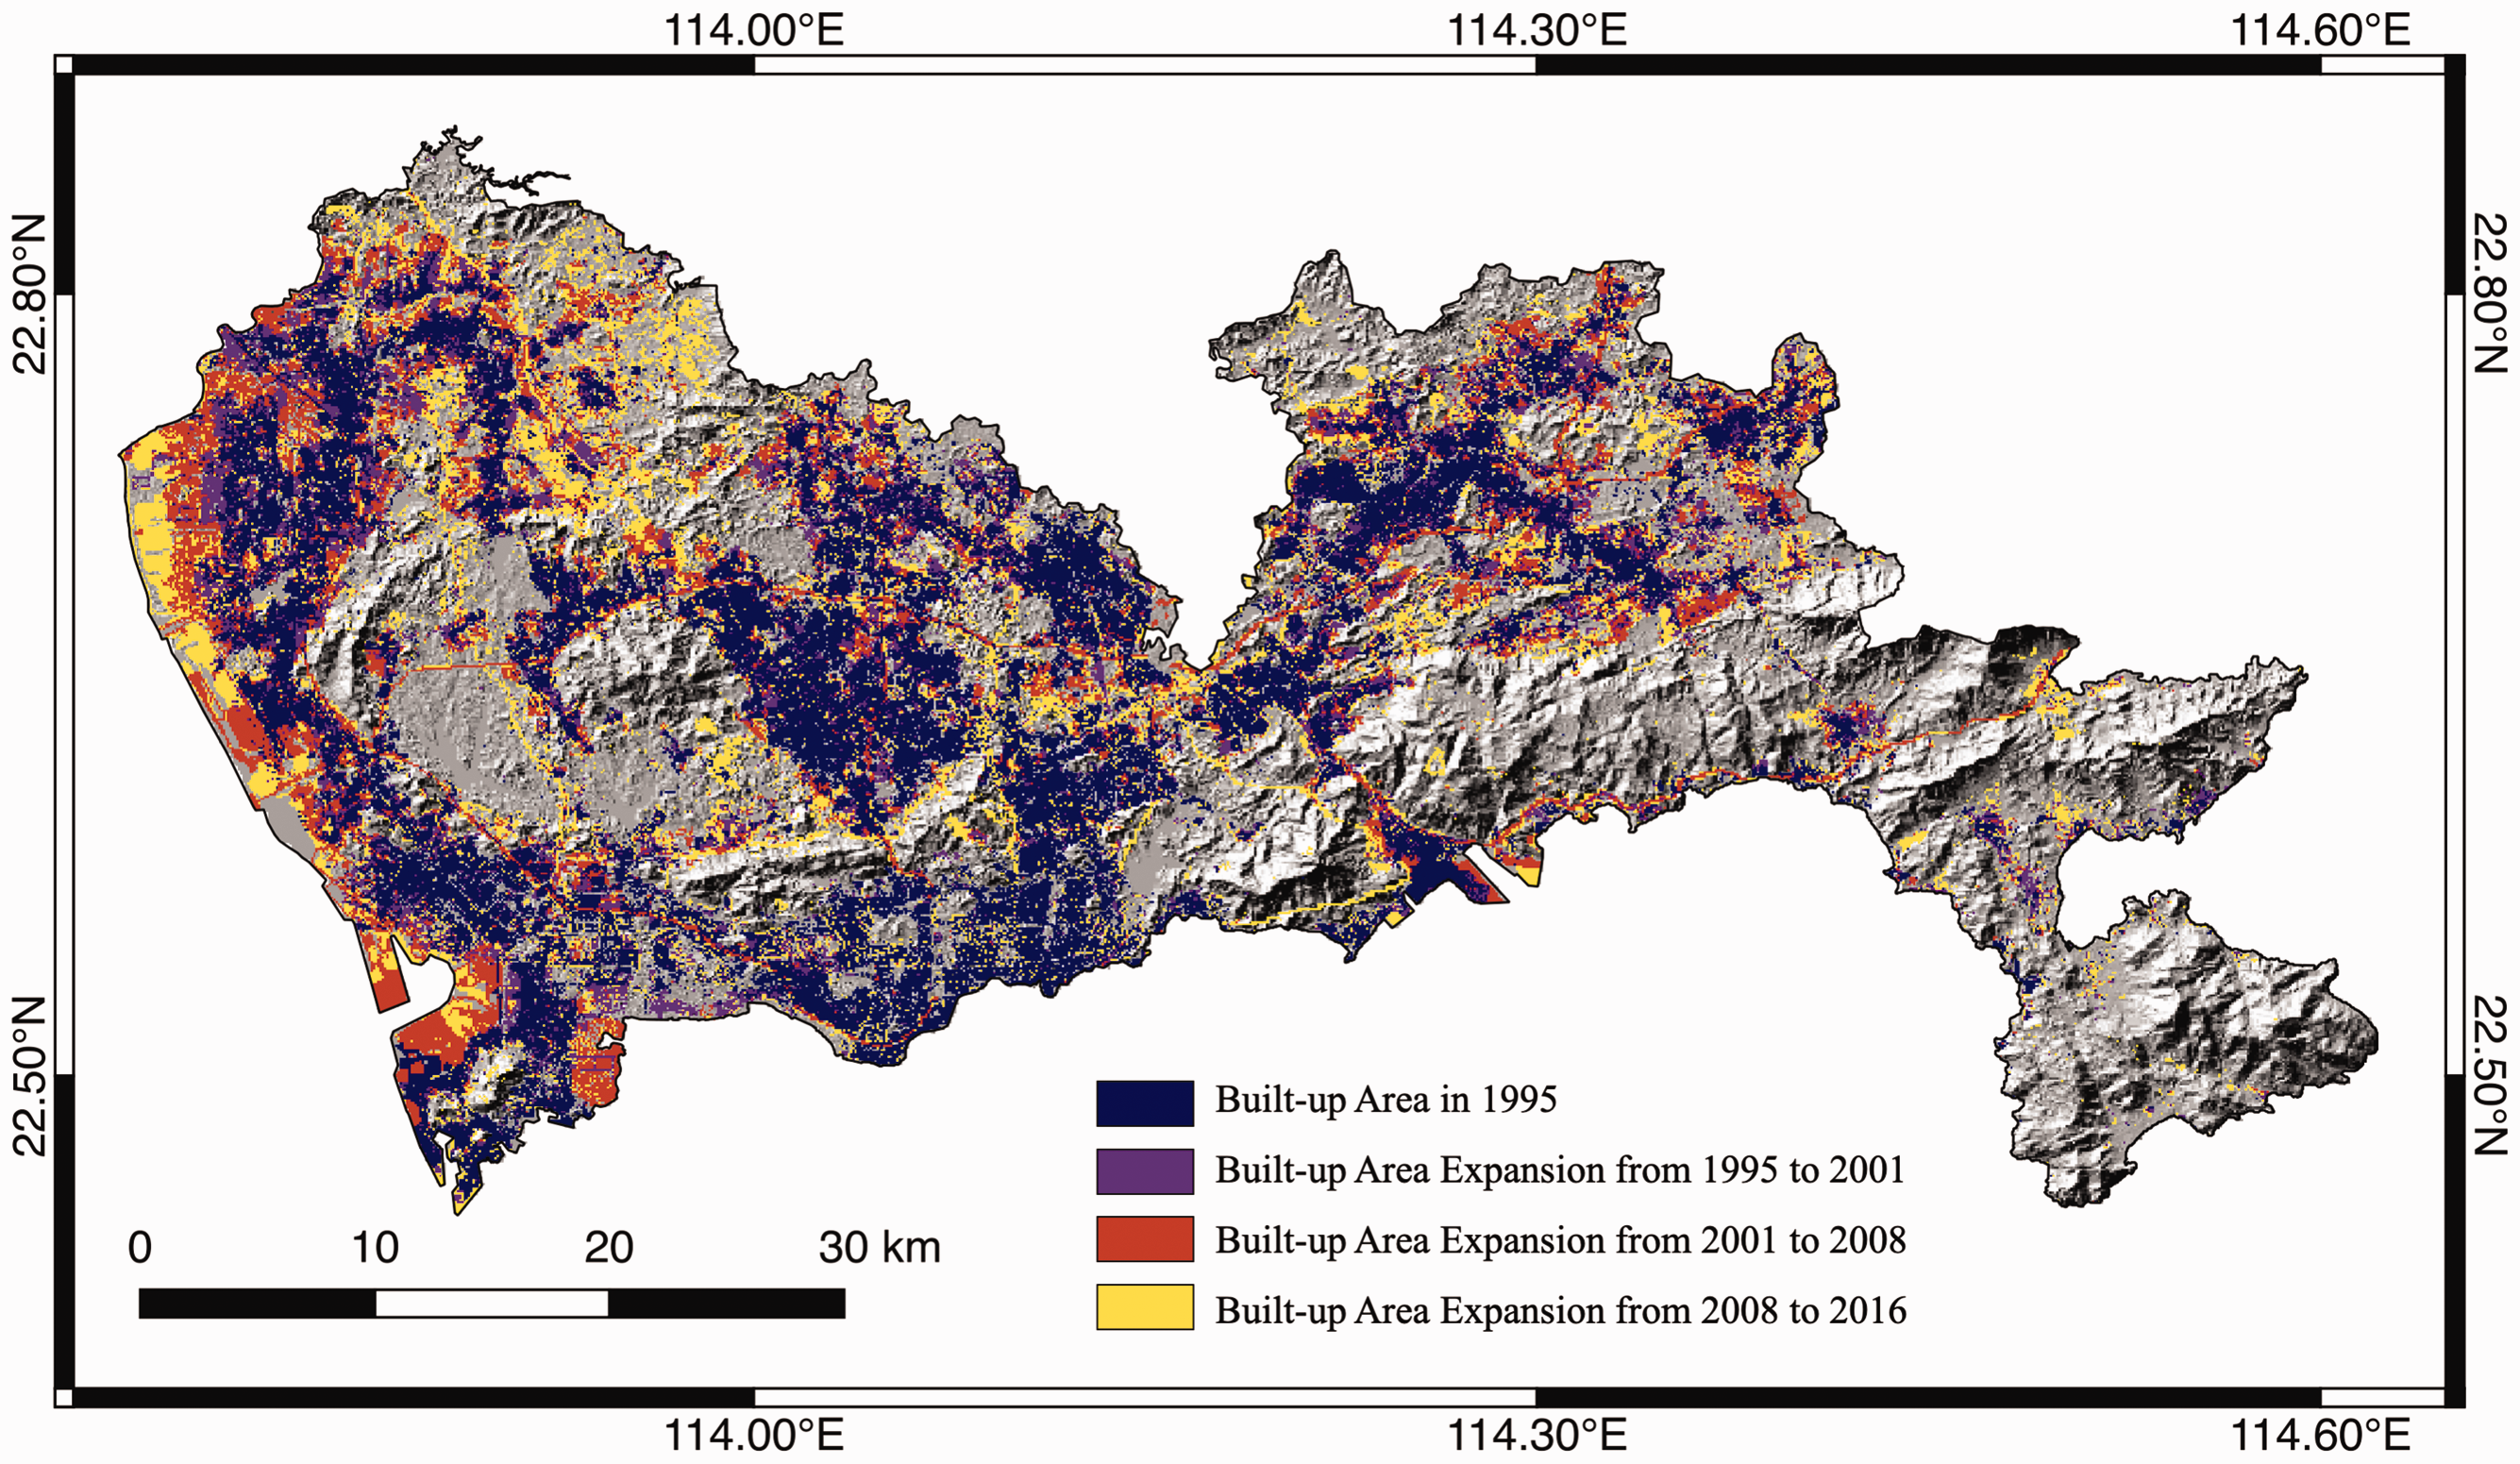
Change in built-up area of Shenzhen from past to present (90 m grids).
The SLEUTH model has five growth parameters (i.e. dispersion, breed, spread, slope and road gravity) and four growth rules (i.e. spontaneous growth, new spreading centre growth, edge growth and road-influenced growth). The growth parameters are calibrated through coarse, fine and final calibration steps using Monte Carlo iterations to select the set of best-fit growth coefficients. These coefficients are then used in the prediction phase for the simulation of future urban growth. A shape index called the Lee-Sallee index is used in this study to find the best-fit coefficients by narrowing down the coefficient space. Although there is no clear consensus on which metric best measures the goodness of fit ( Dietzel and Clarke, 2007 ), the Lee-Sallee index has been considered as a reliable index of shape or a measure of pattern assessment for any real phenomenon (Saxena and Jat, 2020). It is also one of the most widely used indices in SLEUTH applications owing to its ease of interpretation (Ayazli, 2019; Chakraborty et al., 2015; Feng et al., 2012). It is defined as the ratio of the intersection to the union of the ground truth (A) and the simulated (B) built-up area maps as (Lee and Sallee, 1970)

According to (Liu et al., 2019) , Lee-Sallee index values between 0.3 and 0.7 are acceptable, with values closer to 1 suggesting a better match. Jantz et al. (2004) stated that values approaching 0.6 can be considered very good. The Lee-Sallee index in this study was calculated as 0.62 for the last control year (2016) after final calibration. The best fit growth coefficients obtained (dispersion = 1, spread = 39, breed = 2, slope = 1 and road gravity = 94) indicate that the most prevalent growth type in Shenzhen over the selected time period (1995 to 2016) has been the road-influenced growth. The predicted built-up area map using these coefficients is given in Figure 3. The map shows the probability of becoming urbanized for each grid in 2030, in addition to showing the built-up area in the seed year (2016). Hereafter, grids with urbanization probability values higher than 50% by 2030 are set as urbanized in the subsequent analysis.
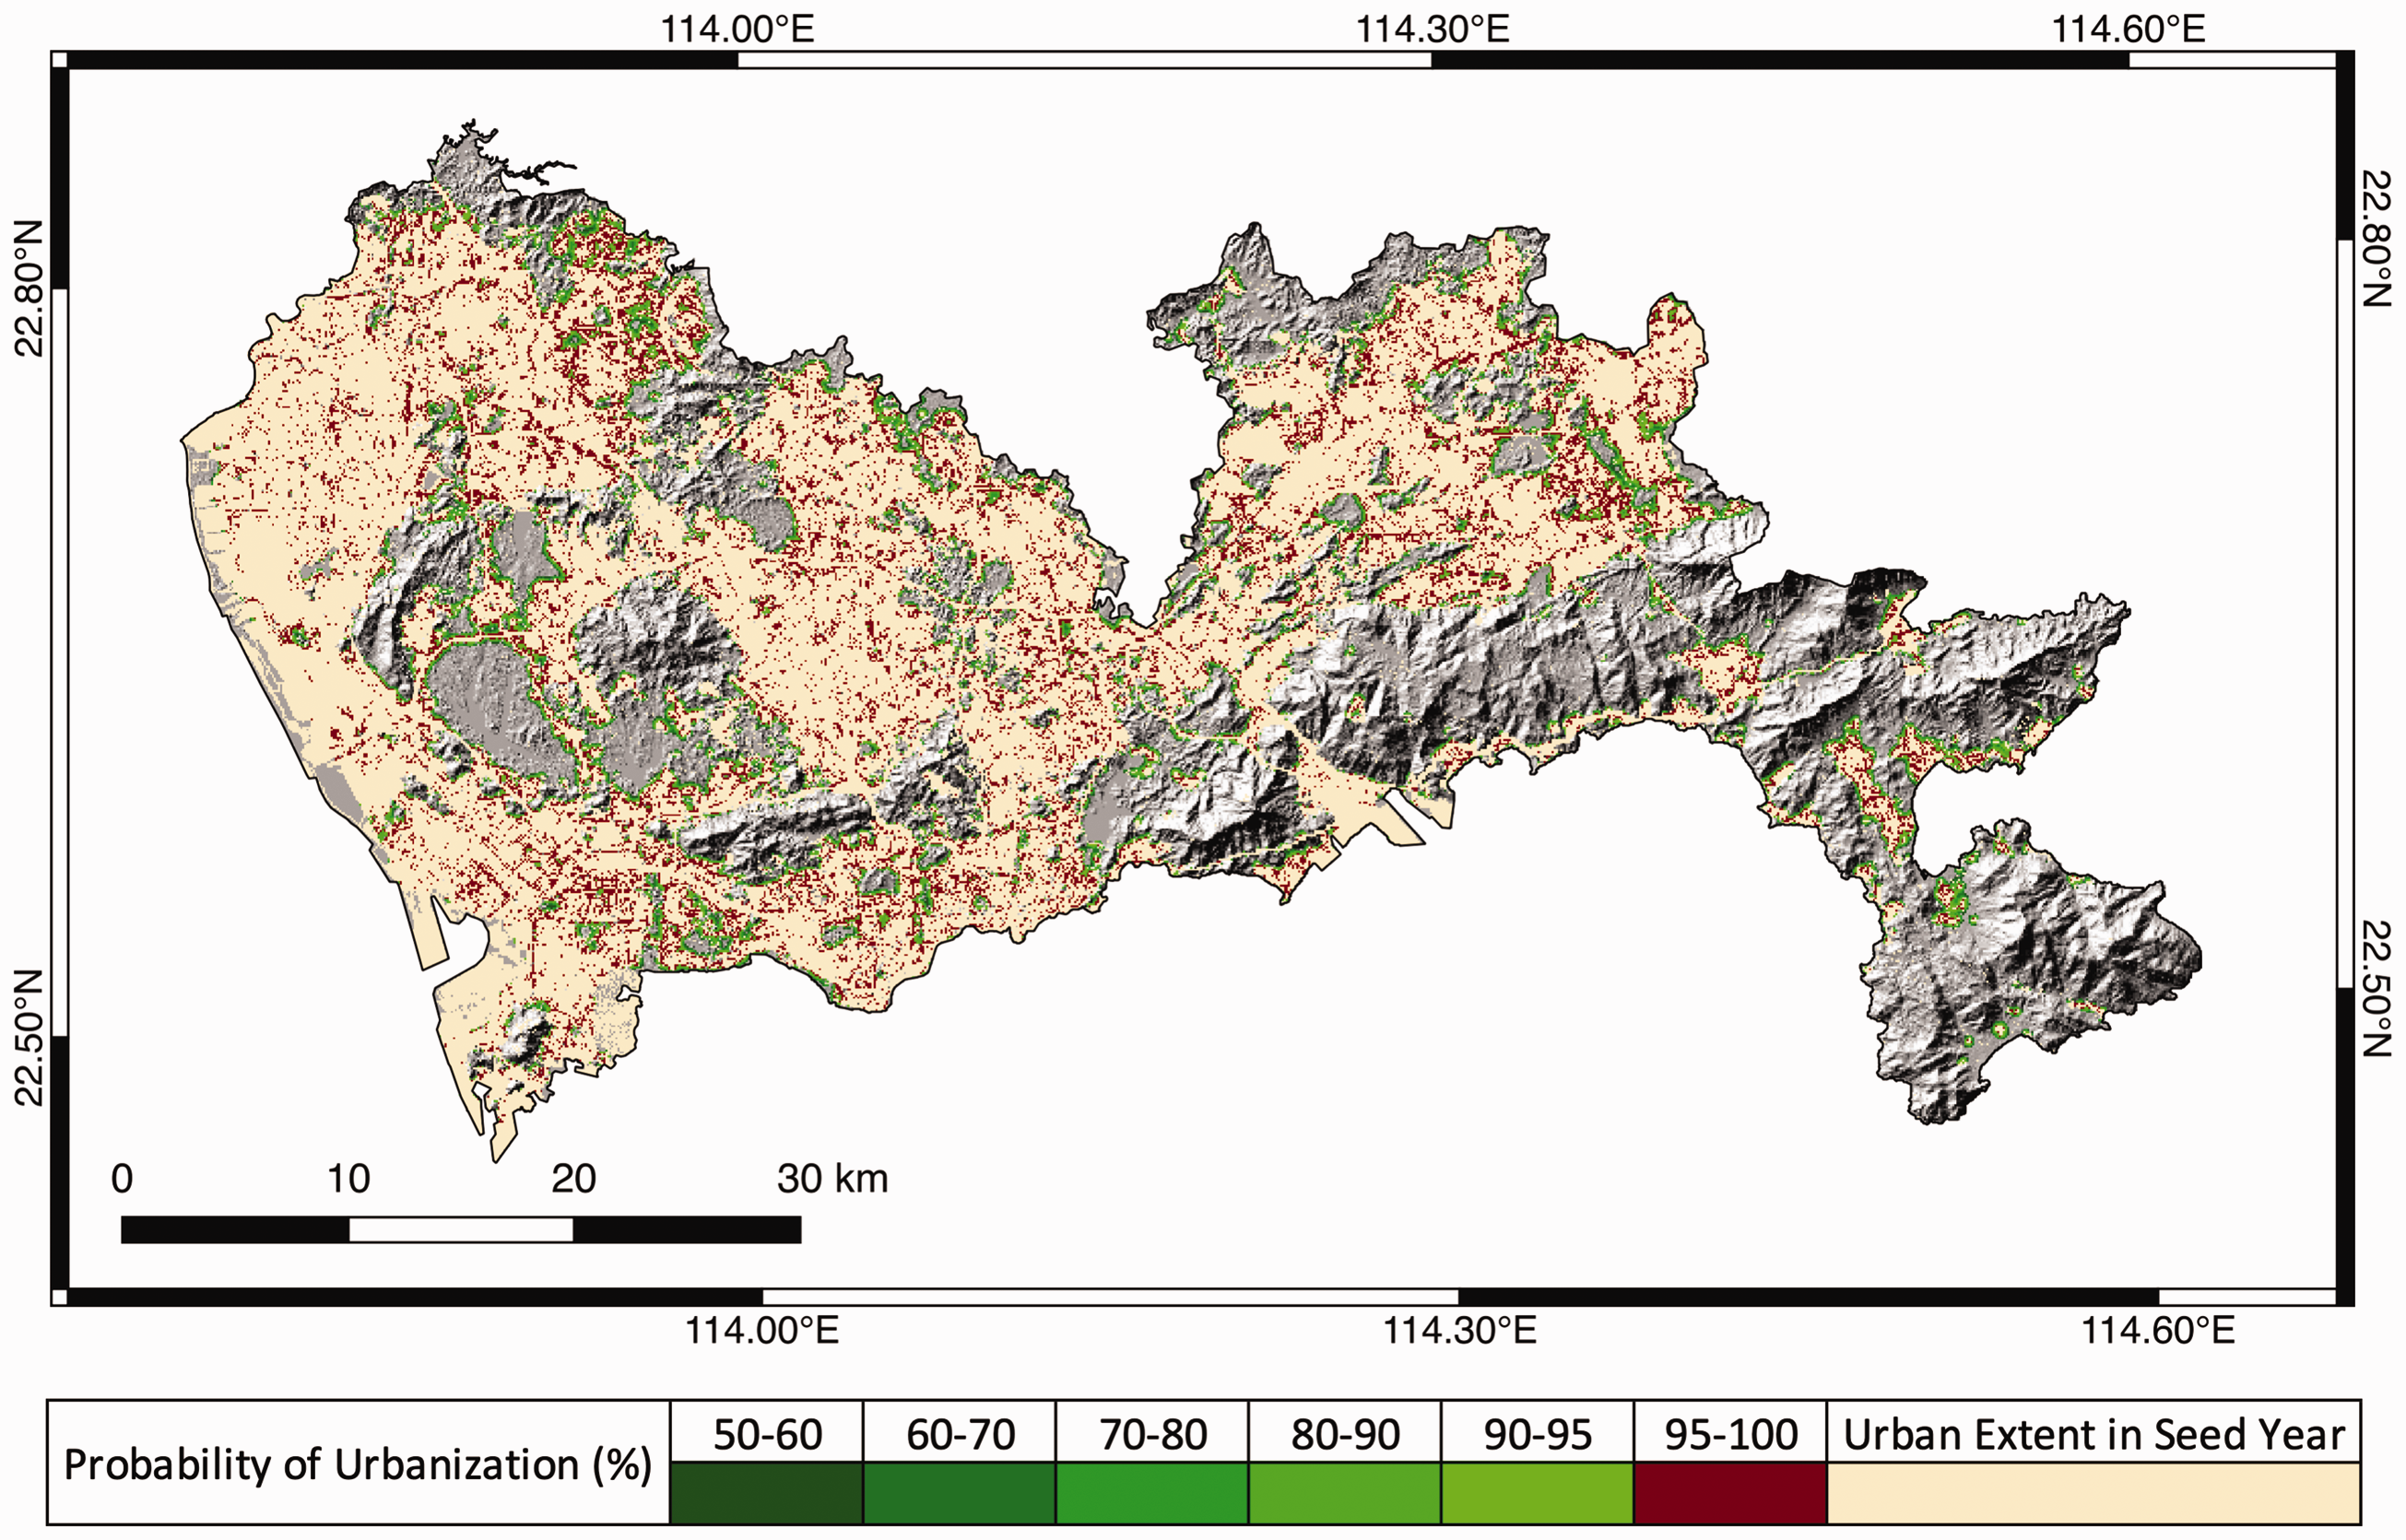
The output of the SLEUTH model which shows probability of urbanization in 2030 (90 m grids).
Flood hazard assessment
Surface water flooding caused by intense precipitation was considered in assessing the present (2016) and future (2030) flood hazard in Shenzhen using a GIS-based fuzzy comprehensive evaluation method as detailed in Lai et al. (2015) and Jian et al. (2021). The index-based fuzzy comprehensive evaluation method uses membership functions to differentiate the relative rankings according to index values (Zadeh, 1965, 1978) and their relative importance. The relative importance of the indices is determined using an entropy-based (Shannon, 1948) objective weight and a subjective weight via the Analytic Hierarchy Process (Saaty, 1980). The two weight sets are further combined using game theory following Lai et al. (2015). This study generally follows the hazard assessment procedures carried out for the wider PRD region in Jian et al. (2021) with slight modifications. We use six indices that directly reflect the characteristics of the rainfall-runoff-inundation process for flood hazard assessment, addressing the local meteorological characteristics and catchment characteristics. The indices consist of the maximum 1-day precipitation, slope, elevation, distance to waterbody, soil type and runoff coefficient based on the LULC and local drainage pipeline density. A detailed description of the indices and membership levels are provided in the Supplemental Materials. The five hazard levels (i.e. low, relatively low, moderate, relatively high and high) in the generated flood hazard maps with 90 m resolution represent the relative ranking in terms of the likelihood of flooding occurrences in each grid. For evaluating the future flood hazard, the predicted built-up area in 2030 with the corresponding changes in LULC was used as input to modify the runoff coefficient in the respective grids. The impact of climate change was not considered in this study as we focus on the sole impact of land use change on flood hazard levels.
As a check on the adequacy of the hazard evaluation, present hazard levels generally agree well with clusters of surface flooding hotspots in Shenzhen (Figure 4(a)) reported by the Urban Planning, Land and Resources Commission of Shenzhen Municipality (2016). An overlay of the reported surface flooding hotspots and the present flood hazard maps shows that 40% of the hotspots are located in relatively high and high flood hazard regions, while 50% of them are located in moderate flood hazard regions. The changes in flood hazard levels from present to future are illustrated in Figure 4(a) and (b).
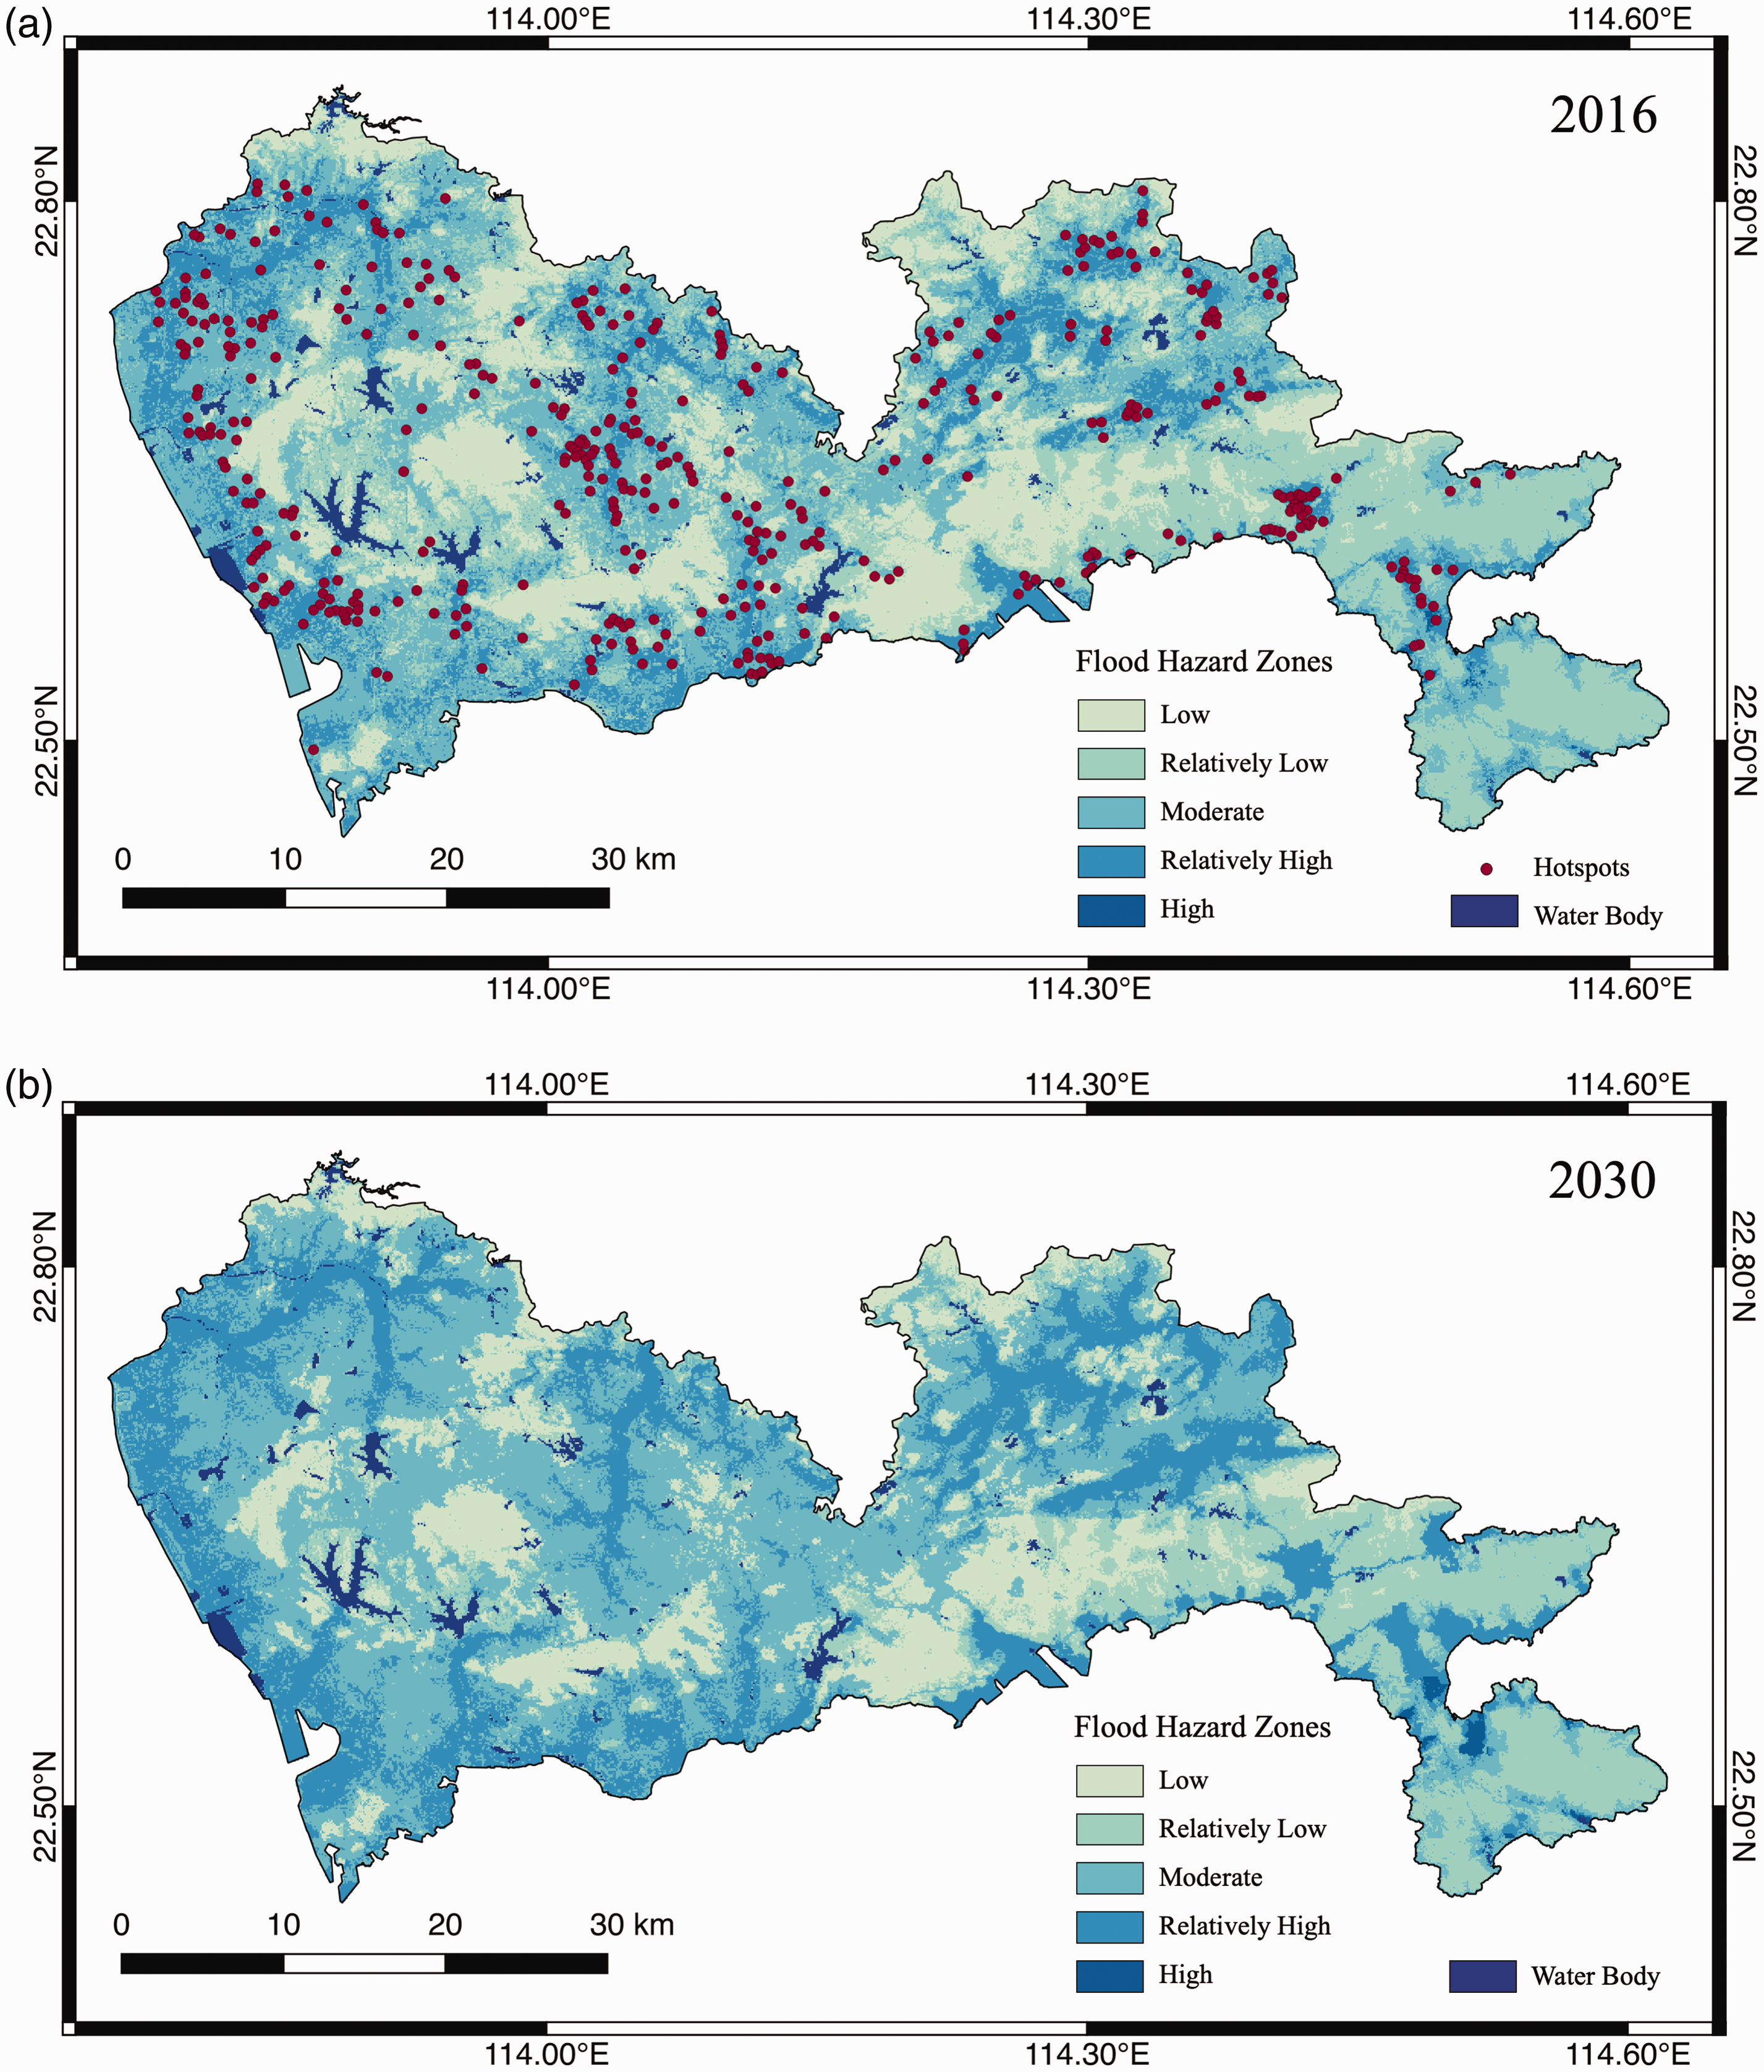
Shenzhen flood hazard maps: (a) present (2016) flood hazard map along with surface water flooding hotspots, and (b) future (2030) flood hazard map.
Results and discussion
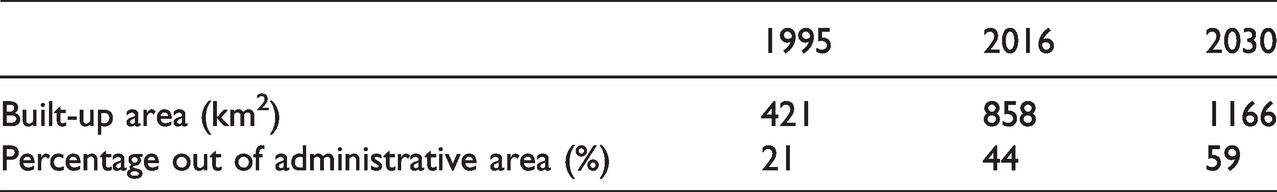
The total administrative area of Shenzhen city is around 1985 km2. Based on the mapping of built-up areas using Landsat images (Table 1), Shenzhen’s total built-up area has increased from 421 km2 to 858 km2 between 1995 and 2016. The SLEUTH prediction on urban growth indicates that the built-up area will reach 1166 km2 (59% of the administrative area) by 2030. Therefore, an almost threefold built-up increase is predicted over 1995 to 2030, while an increase of 36% (308 km2) is predicted over 2016 (taken as present since 2016 is the seed layer for SLEUTH predictions) to 2030 (taken as future). The annual growth rate calculated over 1995 (past) to 2016 (present) is 3.45%, which decreases to 2.22% over 2016 (present) to 2030 (future). Thus, Shenzhen’s urban growth is predicted to slow down in future years, reflecting the typical S-curve growth rate of urban expansion. This is an expected result since the area that is available to become urbanized has been decreasing.
Dynamics in built-up area of Shenzhen from past (1995) to present (2016) and to future (2030).
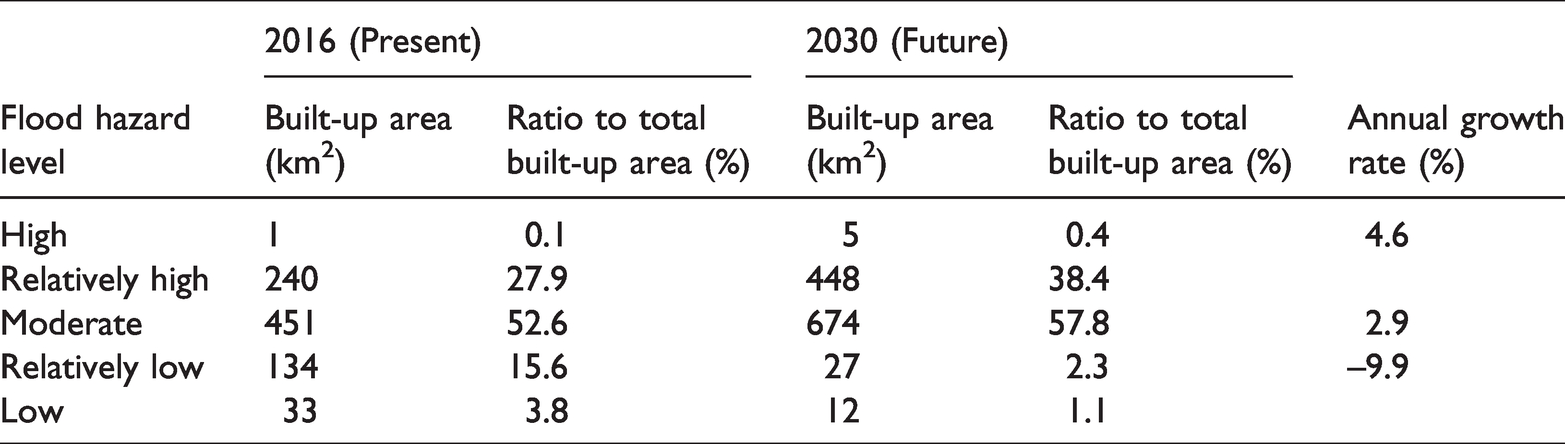
The built-up area maps were overlaid with the flood hazard maps to assess the changes in built-up area exposed to five flood hazard levels in Shenzhen from the present to the future (Figure 5(a) and (b)). A comparison between Figure 5(a) and (b) reveals that the urban expansion and densification are mostly in the regions with moderate, high and relatively high hazard levels. The changes in absolute numbers and the ratio to the total built-up area are listed along with the annual growth rates in Table 2. It was observed that the largest built-up area falls within the moderate flood hazard level for both present and future, with 451 km2 (52.6% of total built-up area) in 2016 and 674 km2 (57.8% of total built-up area) in 2030. Therefore, an increase of 223 km2 (almost 50%) and an annual growth rate of 2.9% were predicted for the built-up area exposed to a moderate flood hazard level over the 14-year time period. This is followed by the built-up area corresponding to high and relatively high flood hazard levels, where a total increase of 212 km2 from 241 km2 (240 km2 at relatively high level and 1 km2 at high level) to 453 km2 (448 km2 at relatively high level and 5 km2 at high level) was predicted. This translates to an annual growth rate of 4.6%. The ratio of the built-up area subjected to high and relatively high levels to the total built-up area was predicted to increase from 28% to 38.8% by 2030. Conversely, the built-up area exposed to low and relatively low flood hazard levels shows a decrease from 167 km2 in 1995 (134 km2 at relatively low level and 33 km2 at low level) to 39 km2 (27 km2 at relatively low level and 12 km2 at low level) in 2016. Thus, a decrease of 128 km2 (76.6%) was predicted from present to future for the built-up area at relatively low and low hazard levels, translating to an annual growth rate of –9.9%.
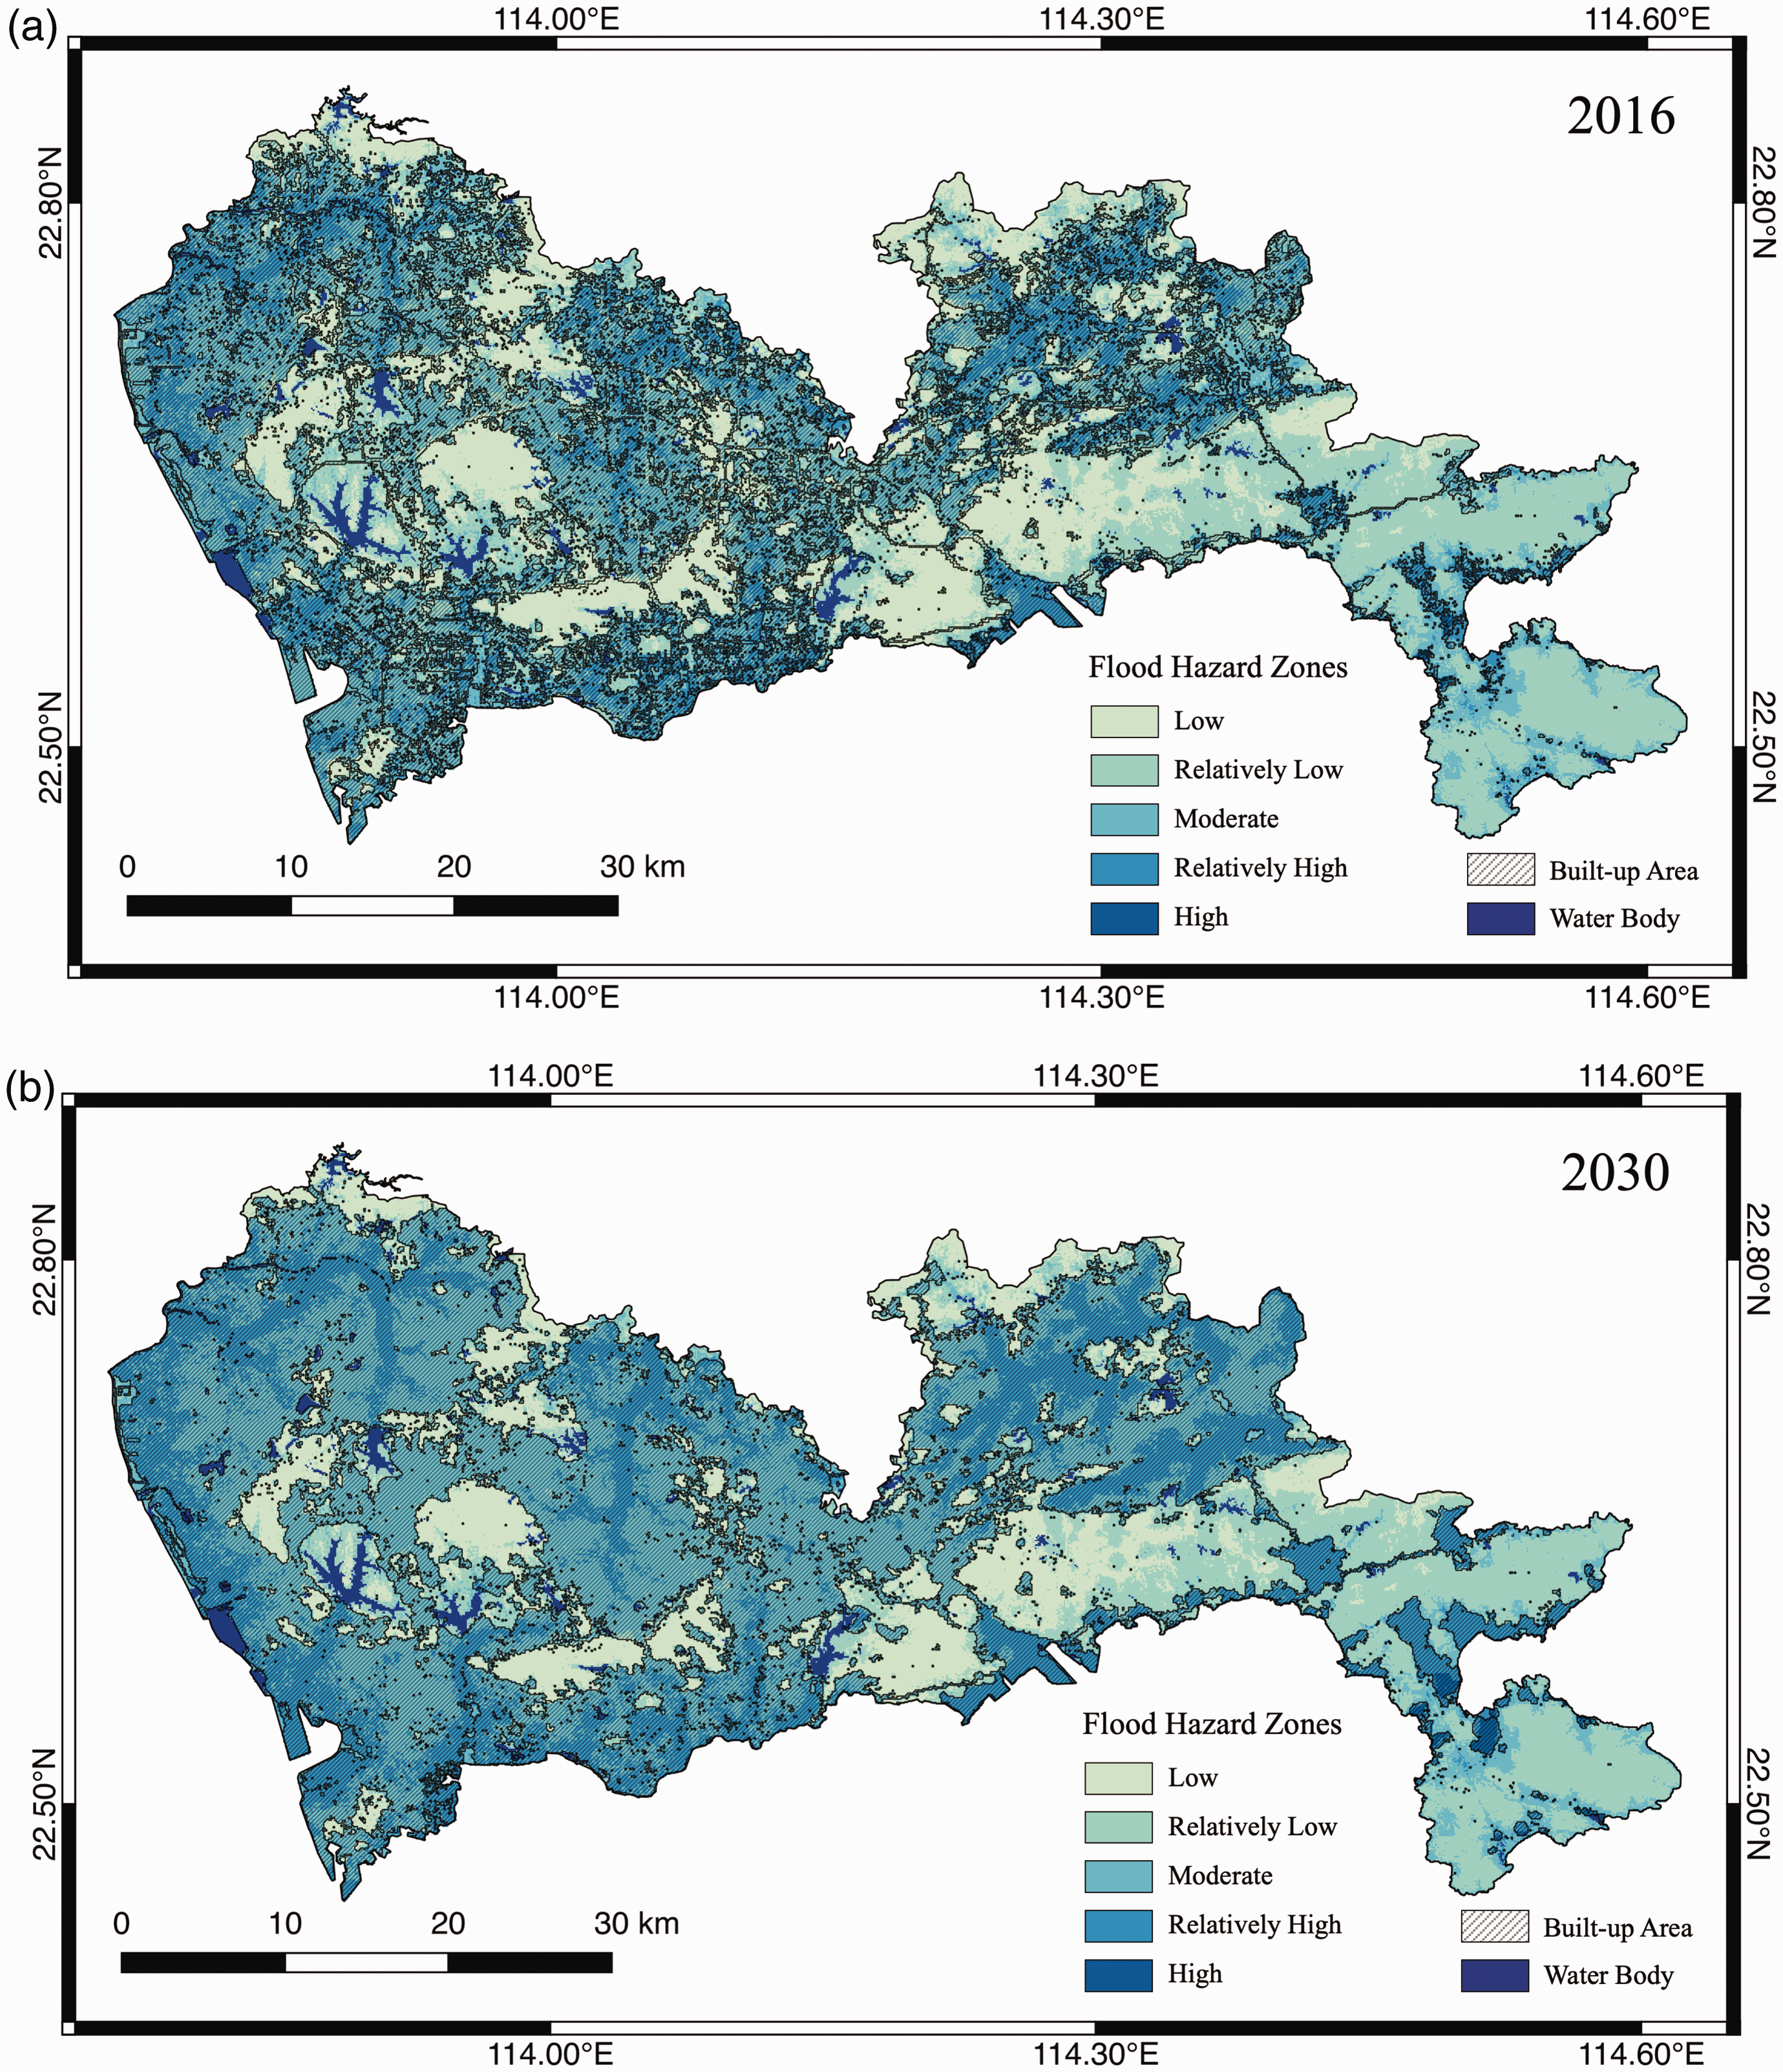
Built-up area overlaid with flood hazard maps: (a) present (2016) and (b) future (2030).
Dynamics in built-up area exposed to different flood hazard levels and ratio to total built-up area along with the annual growth rates.
Limitations and future directions
Several points corresponding to different steps in our study should be addressed for future research. The first is the simplification of the transportation network inputs where the same importance level was assigned to all roads. Detailed information relating to roads could be obtained for the current maps; however, the classification of historical transportation networks is challenging due to the restricted data access. Secondly, different scenarios could be evaluated regarding alternative growth strategies in future projection of built-up area and flood hazard maps. Here, we only used the business-as-usual scenario for urban growth prediction, which may be considered as the worst-case scenario. Future studies could extend the excluded areas to including other areas (e.g. national parks) by assigning different exclusion values in the excluded area input. The master plan could also be leveraged to define various scenarios employing different management strategies. Furthermore, the impacts of climate change and urbanization on rainfall characteristics ( Liu and Niyogi, 2019 ) can be studied in addition to the LULC impacts for mapping the future flood hazard levels. Finally, a sensitivity analysis of the SLEUTH model to the growth coefficients could be carried out for a better understanding of Shenzhen’s urban growth. For example, (Şalap-Ayça et al., 2018) indicated that dispersion and spread parameters show stronger influence on SLEUTH’s output for the coastal community of Santa Barbara, California, while the urban growth of metropolitan Shenzhen studied here is found to be predominantly road-influenced.
Concluding remarks
Spatio-temporal changes in areas potentially exposed to floods in Shenzhen have been assessed in this study under the present (2016) and future (2030) urbanization conditions represented via built-up areas. The SLEUTH model was employed along with historical data to predict the future (2030) built-up area, and the areas exposed to flood hazard were further assessed. An almost threefold increase in total built-up area was predicted over 1995 to 2030, with the future (2016–2030) annual growth rate slowing down relative to the historical period (1995–2016). The built-up area subjected to high and relatively high flood hazard levels was predicted to increase by 212 km2, from 241 km2 to 453 km2 (almost 88%), from the present (2016) to the future (2030). Furthermore, for the built-up area exposed to moderate flood hazard level, an increase of 223 km2 (almost 50%) was predicted over the 14-year time period. The sharp increase in built-up area subjected to high, relatively high, and moderate flood hazard levels indicates the importance of making exposure-informed decisions to move towards a more flood-resilient city. Such information is crucial for decision-makers in resource optimization when developing risk management schemes and enforcing preventive actions via engineering (traditional) and non-engineering (nature-based) measures. The approach in exposure evaluation presented here can be leveraged to determine critical areas that should be prioritized in hazard zoning, urban planning and land use regulations as well as for flood mitigation and protection actions to minimize potential losses. This can be an essential factor in identifying redevelopment areas and supporting innovative urban stormwater management (e.g. Sponge City concepts) in cities like Shenzhen.
Supplemental material
sj-pdf-1-epb-10.1177_2399808321991540 - Supplemental material for Spatio-temporal dynamics of flood exposure in Shenzhen from present to future
Supplemental material, sj-pdf-1-epb-10.1177_2399808321991540 for Spatio-temporal dynamics of flood exposure in Shenzhen from present to future by Gizem Mestav Sarica, Tinger Zhu, Wei Jian Edmond Yat-Man Lo and Tso-Chien in EPB: Urban Analytics and City Science
Footnotes
Declaration of conflicting interest
The author(s) declared no potential conflicts of interest with respect to the research, authorship, and/or publication of this article.
Funding
The author(s) disclosed receipt of the following financial support for the research, authorship, and/or publication of this article: The authors would like to acknowledge the partial financial support for this research work provided by the Monetary Authority of Singapore (MAS) and the Sino-Singapore International Joint Research Institute (SSIJRI).
Supplemental Material
Supplemental material for this article is available online.
References
Supplementary Material
Please find the following supplemental material available below.
For Open Access articles published under a Creative Commons License, all supplemental material carries the same license as the article it is associated with.
For non-Open Access articles published, all supplemental material carries a non-exclusive license, and permission requests for re-use of supplemental material or any part of supplemental material shall be sent directly to the copyright owner as specified in the copyright notice associated with the article.