
Abstract
The role of urban planning in sound environments has recently received increased research attention. This study aims to examine the relationship between the rate of noise complaints and urban development patterns concerning planning and landscape at city/region level. Open-source government data sets are used for statistical analysis across all district and unitary local authorities in England. The indicators for urban development patterns are categorised into six groups: population, industrial structure, built-up area, transport network, commuting, and natural landscape factors. Our research found that noise complaints tend to be higher in service-dominated cities/regions with high population densities; large and uneven cities/regions also tend to have more noise complaints, as do clustered cities/regions. However, dispersed, fragmented, and/or cities/regions having ragged boundaries are likely to have less noise complaints. These findings were confirmed by analysis of transport networks and commuting factors. Finally, cities/regions with more natural landscapes and greater separation of residences from workplaces also have fewer noise complaints.
Keywords
Introduction
With the rapid increase in urbanisation, exposure to noise is increasingly recognised as a common and serious problem worldwide. Many studies have shown that noise is a primary contributor to certain risk factors related to physical and mental health, such as loss of hearing, sleep disorder, and stress (Dzhambov and Dimitrova, 2016). A series of policies and actions have been implemented to reduce the impact of noise. In the European Union (EU), various noise action plans following on the EU Environmental Noise Directive have been introduced, among which legislation regarding complaints is an important part. Noise complaints have been reported to be the single most common type of environment-related complaint; in addition, partly as a result of urbanisation, the role of urban planning in the sound environment of cities is receiving increased research attention across a number of disciplines (Kang, 2006).
A number of studies have examined the link between urban planning and environmental noise issues in terms of noise level and sound perception (Alberti, 1999; Zhou et al., 2016). From a noise level perspective, a comparative study by Wang and Kang (2011) demonstrated that there are significant differences in the spatial noise level distribution between high- and low-density cities. Margaritis and Kang (2017) focussed on the relationships between green-space-related morphology and noise pollution, and found that at the urban and kernel scale, cities with higher green-space coverage were found to have lower day-evening-night noise levels. Through analysis of a noise map, Margaritis and Kang (2016) found that linear cities have a higher probability of being noisier, and that dispersed patterns are related to lower noise levels. Moreover, areas with the most densely and heavily built urban structure types are likely to have a higher noise level (Sakieh et al., 2017). Salomons and Berghauser Pont (2012) examined the correlations of façade noise level and traffic volume with urban densities. They found that the average sound level in urban areas decreases with increasing building density, but it increases with rising road network density and vehicle kilometres per square kilometre per 24 hours. Hao and Kang (2014) analysed the relationships between urban morphology and the spatial noise level attenuation of flyover aircraft, finding it to be mainly correlated with the building frontal area index. Salomons and Berghauser Pont (2012) found that in closed building blocks, the noise level in quiet façades is lower than in open building blocks. In addition, façade shapes and materials can influence the noise level as well. For instance, the general shape of buildings can be important for pedestrians. Flat façades inclined upwardly are most efficient for noise reduction; flat vertical façades and concave shapes are also beneficial (Echevarria Sanchez et al., 2015). Badino et al. (2019) found that the sound level over the façade can be reduced by up to 6.5 dB by absorbing balconies and loggias and by 10 dB with entirely absorbing sound façades. Furthermore, sustainable vegetated façades can reduce noise levels by 2 dB at pedestrian level in the street canyon (Jang et al., 2015).
Noise/sound perception has been another aspect of research on sound environments. Hao et al. (2015) investigated the integrated impacts of urban morphology on birdsong loudness, indicating that the masking effects of birdsong could be considered a soundscape design technique. From a case study in Seoul, Korea, Hong and Jeon (2017) suggested that in high-density areas, there is more low-frequency content of sound and lower sharpness values compared with low-density areas. Liu et al. (2014) examined the impact of landscape spatial patterns on soundscape perception. Their results showed that major sound indicators are associated with a number of planning indices, such as road density. Thus far, a range of urban planning parameters have been identified that have impacts on noise level and sound perception, mostly based on a small scale and/or a relatively limited sample size.
Reporting noise complaints as a part of noise policy depends on individual attitudes and perceptions as well as objective noise levels (Kang, 2006). Gillen and Levesque (1994) examined relationships between airport complaints and socio-economic factors, suggesting that noise complaints are positively related to population. From their data set, it can also be seen that the day complaints are greater than the night ones. Meanwhile, Liu et al. (2019) analysed the spatial patterns of neighbour complaints based on GIS techniques, including noise-related complaints. Zheng et al. (2014) developed a model to recover the noise situation throughout NYC where they used noise complaint data. Hong et al. (2019) found, using longitudinal administrative data from 2011 to 2016, that an increase in construction activity of one-unit in a cell based on heat maps was associated with an approximately 6% higher incidence rate of noise complaints. However, the research on how urban planning affects noise complaints is currently inadequate.
According to the above considerations, for urban planners and policy makers, the relationship between urban development patterns and noise complaint matters is still lacking, especially at a large scale. Therefore, this research aims to examine relationships between urban development patterns and noise complaints at the city/region level. For this purpose, we categorised the indicators of urban development patterns relating to planning and landscape into six groups: population, industrial structures, built-up areas, transport networks, commuting, and natural landscapes.
Method
Geographic samples
In England, there are 152 counties and unitary authorities, as well as 326 district and unitary authorities. To obtain a large sample size for this study, district and unitary administrative levels were selected. Another reason for this choice is because this study analyses the relationships between urban development patterns and noise complaints, and district and unitary administrations have local authorities for urban governance.
In this study, the city/region, as a strategic and political level of administration and policy making, involving urban, semi-urban, and rural areas, is used to refer to the district and unitary authority level. In this study, ‘city’ refers to the central city while ‘region’ refers to the city fringe or city-region (Bennett, 1985; Leibovitz, 2003). Another reason for using ‘city/region’ rather than ‘city’ is to distinguish the ‘city status’, which means a city being a place with a cathedral in England (Beckett, 2017). In total, 325 samples were examined from across England (all districts and unitary administrations were selected excluding the Isles of Scilly, for which noise complaint data were absent).
Noise complaints dataset
In England, noise complaints are reported under environment legislation, providing a database for government decision making. Making a noise complaint is a behaviour related to noise level and perception. A general assumption is that not everyone who experiences noise issues complains; however, noise complaints can give useful indications regarding those areas in which people are bothered by noise (Hong et al., 2019; Public Health England, 2018).
Two variables for noise complaints are included in the data set: the raw number of noise complaints and the rate of noise complaints per local authority per thousand people (Public Health England, 2018). For this study, the noise complaint rate was selected for correlation analysis allowing comparison across the scale of cities/regions. Data regarding noise complaint rates were available for the years 2010–2015. As this research seeks to study general rules rather than current issues, the noise complaint rate data for 2011 were selected for analysis, since the most recent urban development pattern data set is available in 2011. The spatial distribution of noise complaint rates for 2011 is presented in Figure S1 in the Supplemental Materials.
Urban development pattern indicators
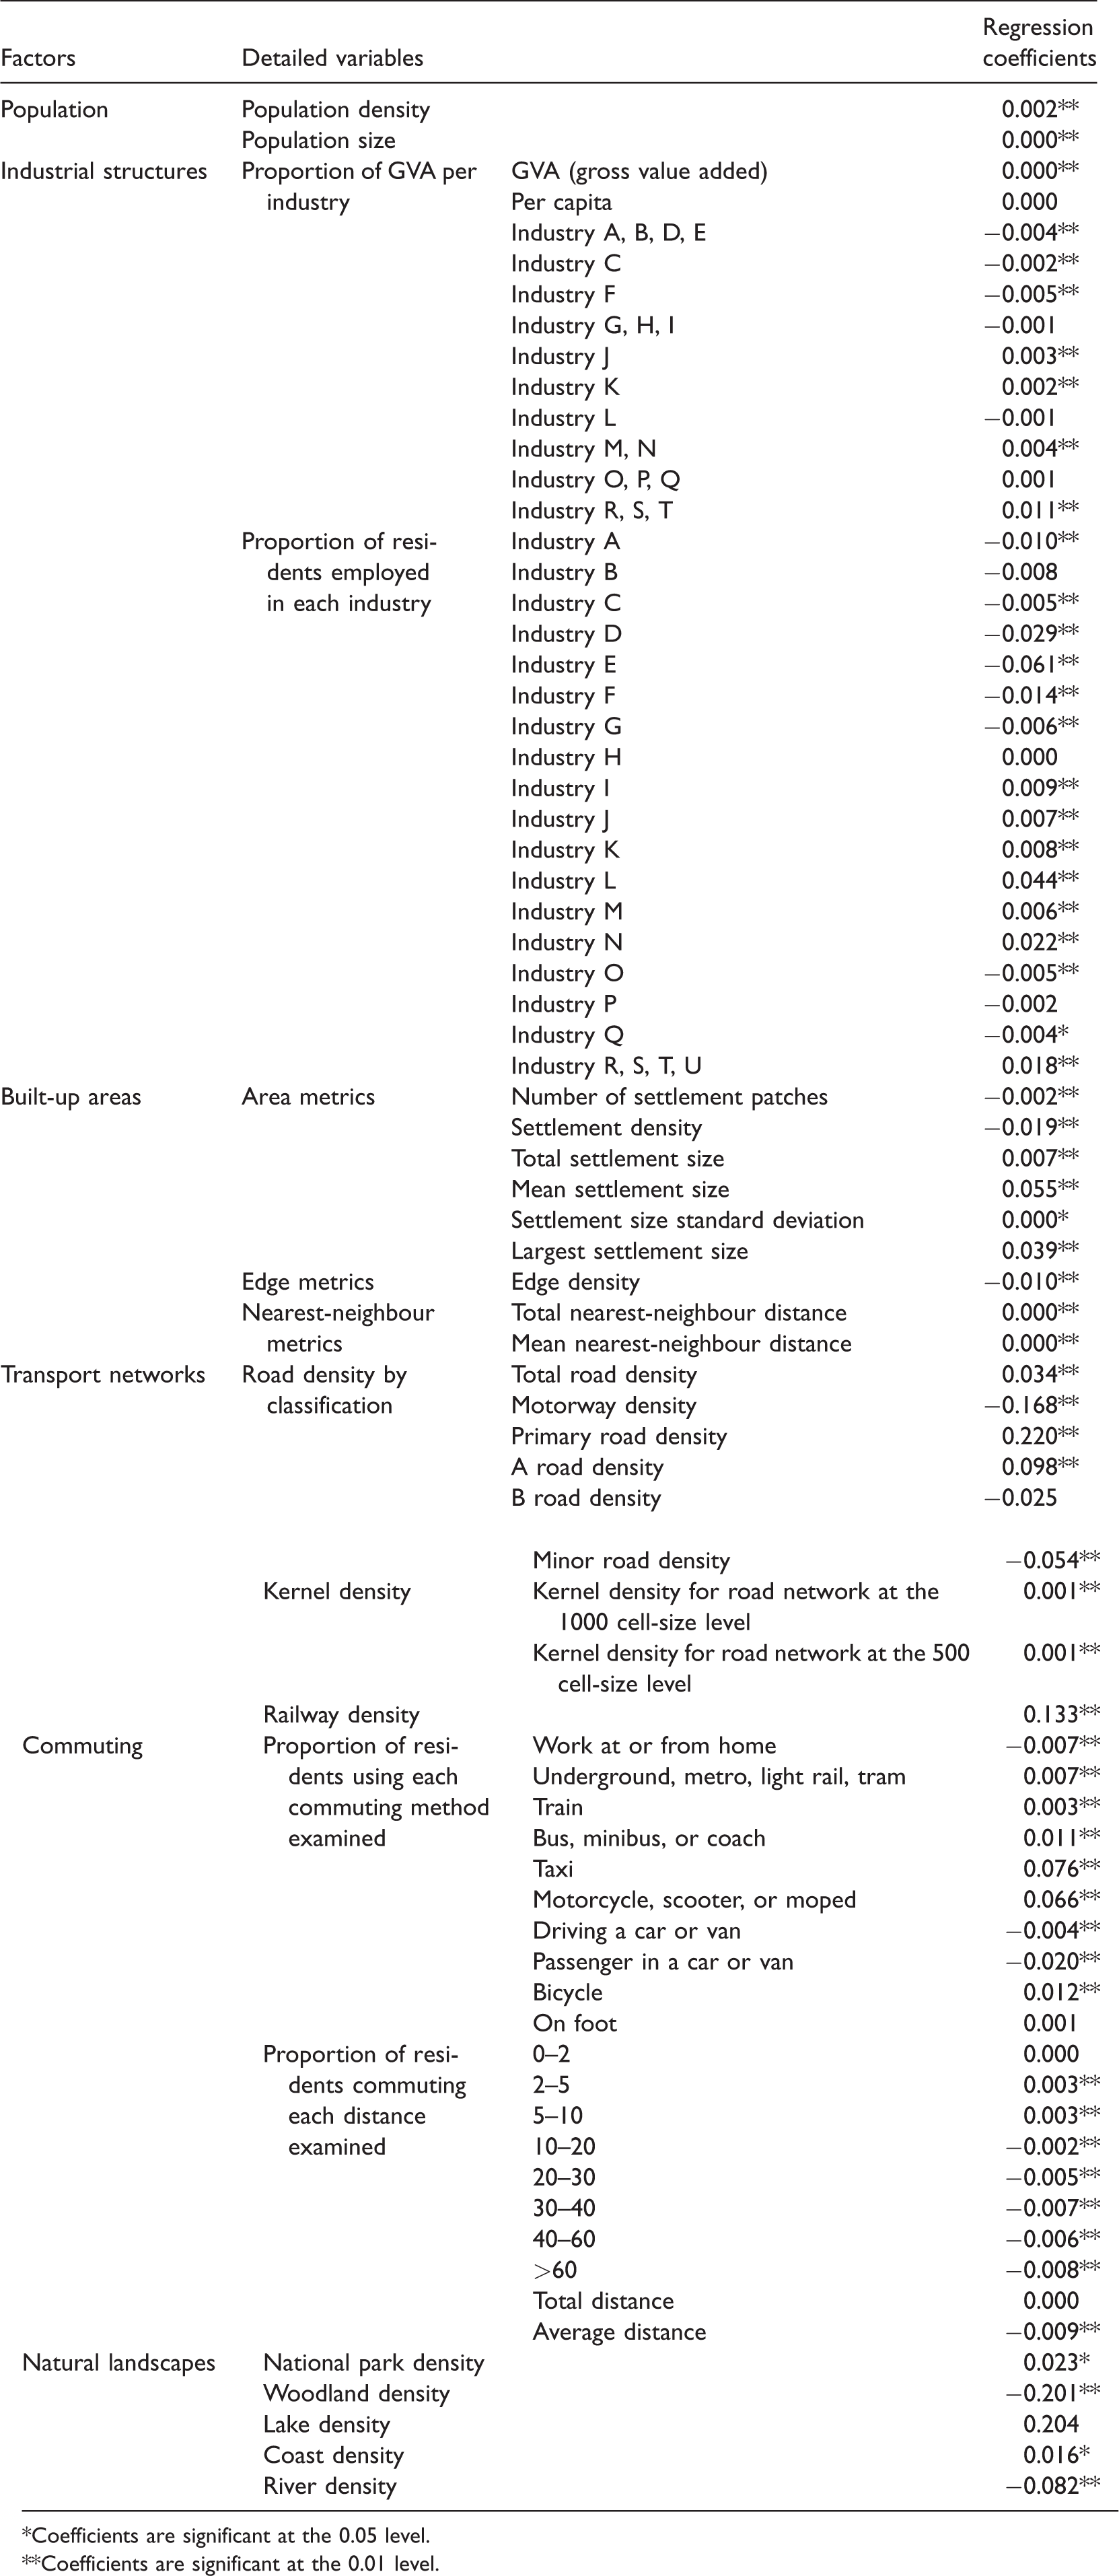
There are many urban development pattern indicators related to the sound environment (Badino et al., 2019; Zhou et al., 2016). Through literature reviews, we selected 75 indicators and categorised them into six groups: population, industrial structures, built-up areas, transport networks, commuting, and natural landscapes. Details of the indicators are provided in Table 1 and described below:
Indicators of urban development patterns and their regression coefficients on noise complaints, based on the ridge regression model.
*Coefficients are significant at the 0.05 level.
**Coefficients are significant at the 0.01 level.
Population is a basic characteristic of cities/regions and, hence, a common and essential factor in urban studies research. Population factors include population size and density.
Industrial structures describe the relative size of each industrial sector, which reflects the nature of the local urban economy. Changes in industrial structure result from increases in urbanisation and expansion of urban areas. With urban development, cities/regions gradually change from agriculture-dominated to service-dominated societies (Moir, 1976; Schnore, 1961).
Built-up areas are where the majority of the population reside. Thus, the characteristics of this area can have considerable effects on human well-being and are essential components of urban patterns. The indicators of built-up areas describe different dimensions of urban patterns, such as evenness, clustering, and fragmentation (Alberti, 1999; Sudhira et al., 2004).
Transport networks are an indicator of local connectivity, which is an important measure of the evenness of urban patterns. Moreover, the noise generated by vehicular traffic is one of the most annoying sources of noise, which could have a strong relationship with noise complaints (Calixto et al., 2003).
Commuting comprises indicators concerning residents’ methods of travelling to work and the distance they travel to work. Commuting patterns (i.e. the length, mode choice, etc.) gradually change as an area matures (Sultana and Weber, 2013; Zhao et al., 2010). The percentage of residents using public transport and commuting distance are crucial indicators for a compact city, as well as the integration of urban land use (OECD, 2012).
Natural landscapes are examined because they have been proven to impact noise perception and diffusion (Hao et al., 2015; Margaritis and Kang, 2017).
In this study, there are two main open databases used: the UK Census (produced by the UK Office for National Statistics) and Strategi (produced by the UK Ordnance Survey). The data set for population, industrial structures, and commuting was sourced from the UK Office for National Statistics (2019). Data for all indicators in these three sections (excluding gross value added (GVA)) were extracted from the 2011 Census, which is the only survey that provides a detailed picture of the entire population (Office for National Statistics, 2018). The built-up area, transport network, and natural landscape data sets were sourced from Strategi, which is produced from data that are used to create the UK Ordnance Survey’s 1:250,000 scale topographic mapping with a resolution of 1 metre (Ordnance Survey, 2015). This data set comprises digital vector data and contains settlements, water, woods, land use, and positioned geographic names, among other urban elements. These data are sufficiently precise for calculating urban development pattern indicators. All data sets, including the noise complaints, UK Census and Strategi, are from 2011 for the correlation analysis. Overall, 75 variables describing urban development patterns were obtained (Table 1). Moreover, the descriptive statistics for key urban development pattern indicators are presented in Table S2, and the key dimensions of urban development are visualised in Figure S2 in the Supplemental Materials.
To illustrate the industrial structures, statistics for the proportion of GVA and residents employed per industry sector were used. The industry sectors are shown in Table S1 in the Supplemental Materials and follow the Standard Industrial Classification of Economic Activities 2007.
The majority of built-up area indicators and their equations were sourced from FRAGSTATS, which is a spatial-pattern-analysis program developed to quantify landscape structure. FRAGSTATS is applied widely in urban and landscape studies and includes comprehensive indicators (McGarigal and Marks, 1995). Built-up areas comprise the area, edge, and nearest-neighbour metrics. The indicators of area metrics describe the size and distribution of settlements, accounting for city size, fragmentation, clustering and evenness. Settlement density is calculated by dividing the number of settlements by the area of cities/regions. Finally, the nearest-neighbour metrics illustrate the distance between two individual built-up areas (i.e. settlements) and, thus, describe the sprawl and dispersal of built-up areas.
Regarding transport network factors, roads and railways are considered. Among various urban noise sources, traffic noise generally attracts the most attention because of two characteristics: it is usually loud and very widespread (Van Renterghem and Botteldooren, 2010). The total density of roads, that of each road subcategory, and that of railways, can be calculated by dividing the total length of roads and railways (in kilometres) by the area of the city/region in question (in square kilometres). To determine the spatial distribution of road networks, kernel density, which calculates magnitude-per-unit cell from road features using a kernel function, was applied.
Natural landscape factors have been proven to have relationships with sound environments, applying an absorption or scattering effect on noise propagation and influencing individual perception of noise (Hao et al., 2015; Margaritis and Kang, 2017). Using the Strategi data set, the natural elements of national parks, woodlands, lakes, coasts, and rivers were selected as water and green factors. The density of each natural element was calculated by dividing the area/length of the natural element by the area of the city/region.
It is worth noting that some urban development pattern factors show significant correlations. The significant correlations exist, such as the population density and population amount. However, as this study focuses on the impact of urban development patterns on noise complaints, rather than the interrelationship between the factors, no further correlation analysis was made. Nevertheless, the ridge regression model was applied to deal with the multicollinearity problem.
Data analysis
The Strategi map was processed in ArcGIS 10.4 to calculate the values of the indicators and the urban development patterns. A correlation analysis was subsequently conducted in SPSS on the noise complaint data and urban development pattern indicators, in order to understand relationships between each indicator and the noise complaint rate (IBM Corp, 2015). The choice of correlation analysis is based on the type and distribution characteristics of the variables. In this study, all the variables are continuous. Pearson correlation is widely used for examining the relationship between two continuous variables. However, the statistical results of variable distribution do not all conform to a normal distribution according to the Shapiro–Wilk test. The Spearman’s rho, as a nonparametric test, does not assume normal distributions. Therefore, the Spearman’s rho was applied to measure the correlations between the noise complaint rates and each urban development pattern indicator separately (Hauke and Kossowski, 2011). In terms of sample size, the size of 325 samples meets sample size requirements for Spearman correlation (Bonett & Wright, 2000). Furthermore, a correlation analysis was also conducted with 80% of the samples to validate the robustness of the correlation. The correlation coefficients, listed in the Supplemental Materials (Table S3), did not show a significant difference. Thus, the Spearman correlation results in this study were robust.
As for the multiple regression analysis, considering sample size, unknown causality, the requirement of interpretability, and the multicollinearity problem among the variables, a ridge regression model was applied to model the relationships between the noise complaint rates and urban development pattern indicators. Ridge regression is an improved regression model and specialises in data that suffer from the multicollinearity problem by adding a degree of bias (Hoerl and Kennard, 1970; Marquaridt, 1970). In addition, compared to other modelling methods, this model is analytical with the explanatory contribution of each variable. Hence, it is helpful for government organisations prioritising resources to deal with noise pollution in terms of urban development pattern aspects. Cross-validation was used to validate the ridge regression model errors during the training process. This step is to divide all samples into a training set (80%) and a test set (20%) randomly. The training set is used to generate the model, while the test data are used to predict the errors of the model. Finally, a value is obtained to indicate model error. The process can be conducted using the R language. The results are primarily presented in Table 1 and further analysed in the ‘Ridge regression model for the noise complaint rate prediction’ section.
Results and discussion
Population
The results show that the rate of noise complaints is strongly related to population density, with a correlation coefficient of 0.489 (p < 0.01). Furthermore, it is also related to population amount, albeit with a lower value at 0.287 (p < 0.01). Thus, the noise complaint rate increases as the population grows. These results correspond to the findings of Xie and Kang (2010), who revealed that noise levels have positive relationships with population density and total population change in London at the borough level. However, our results are somewhat contrary to those of Méndez and Otero (2018), who reported in an investigation conducted in Santiago, Chile, a negligible impact of population density on noise complaints. It is possible that their research was focused on the neighbourhood level.
Industrial structures
Industrial structures are an essential index for economic development that affects the change and composition of land use. It shows that the rate of noise complaints is positively related to total GVA, with a coefficient of 0.301, while it is negatively related to GVA per capita (Table 2). The GVA proportions of industries ABDE, C, and F and L have negative relationships with noise complaints. Namely, as the proportional GVA of industries ABDE, C, and F increases, the noise complaint rate in the city/region tends to decrease. For another, the industries J, K, OPQ, and RST have statistically significant positive relationships. No significant correlations were found in other industries. Table 2 shows that the negative relationships are clustered in the primary and secondary industries, such as mining and manufacturing; in contrast, the industries that are positively related to noise complaints are largely tertiary industries, such as financial, recreation, and insurance activities. A possible reason for this is that primary and secondary industries are clustered in specific spaces, such as industrial zones and suburbs, due to lower land cost and noise regulations (Sonobe and Otsuka, 2006). This means that these industries tend, to some extent, to be located relatively far from highly populated places. However, tertiary industries are located close to residences and, consequently, may impact residents. In other words, cities/regions with a higher proportion of tertiary industries tend to have higher noise complaint rates.
Correlation coefficients between the proportion of GVA per industry and the noise complaint rate.
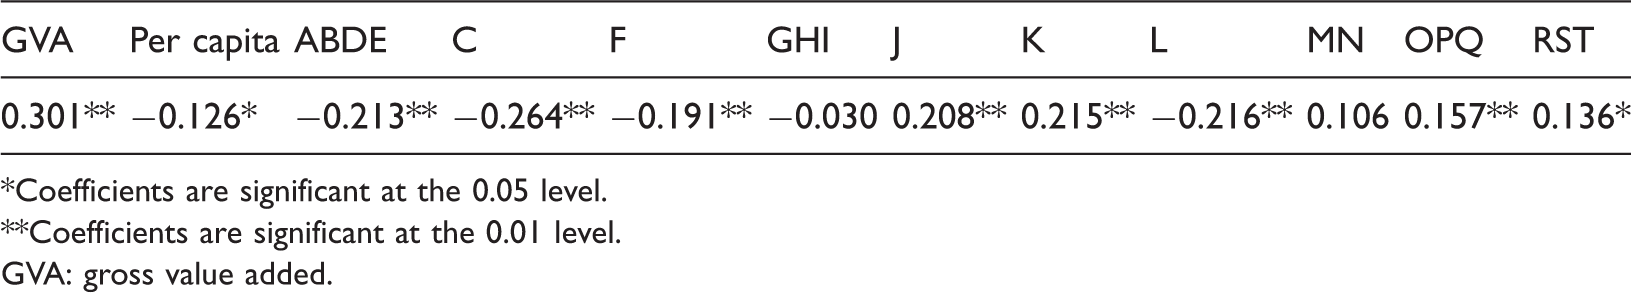
*Coefficients are significant at the 0.05 level.**Coefficients are significant at the 0.01 level.GVA: gross value added.
Table 3 shows the relationships between noise complaints and the share of residents who work in each industry. Here, the noise complaint rate is related to 15 industry categories (18 industries examined). The table shows negative relationships between noise complaints and the proportion of residents in that occupation for industries A, B, C, D, E, and F. Industry O also have negative relationships with the rate of complaints. Conversely, the proportion of residents employed in industries H, I, J, K, and N has positive relationships with noise complaints. These results reveal that cities/regions with higher rates of residents employed in primary and secondary industries are more likely to have less noise complaints. In contrast, resident occupations are clustered in tertiary industries, leading to an increased likelihood of noise complaints.
Correlation coefficients between the proportion of residents employed in specific industries and the noise complaint rate.
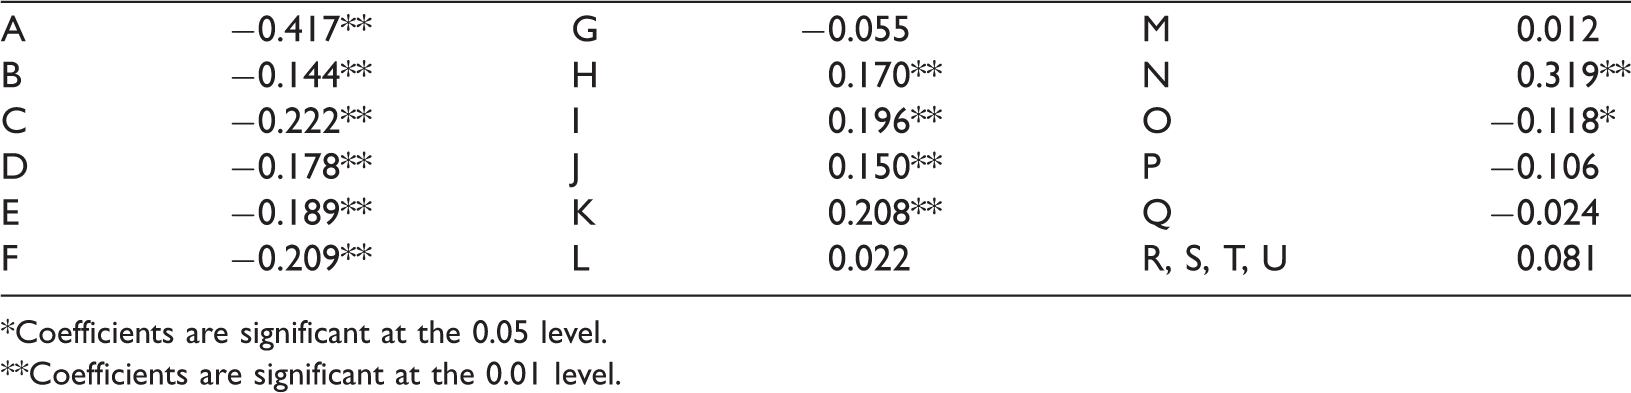
*Coefficients are significant at the 0.05 level.**Coefficients are significant at the 0.01 level.
Overall, our analysis of GVA and occupation per industry indicates that as the percentage of GVA and employment in the service industry increases, the noise complaint rate also increases. From the perspective of economic development history, with urbanisation, this structural change might cause environmental issues. In addition, residents are more likely to report noise nuisances as they become increasingly aware of the negative impact that noise has on health (Kang, 2006). Meanwhile, economic centres, which are generally dominated by tertiary services across the country, might also generate more noise complaints and sound environment issues as a result of their proximity to residences.
Built-up areas
The results in Table 4 show that the number of settlement patches and settlement density has a negative relationship with the noise complaint rate. These results suggest that if settlement patterns in cities/regions are fragmented, the rate of noise complaints tends to be reduced. All other indicators that describe the size of the settlements are positively related to the noise complaint rate. The total and mean settlement size are positively related, with coefficients of 0.378 and 0.443. These results suggest that when the share of built-up area or the average area of the settlement is greater, residents are more likely to report noise complaints. Standard deviations of settlement size and the largest settlement size were also examined, and this showed that there were positive relationships between those variables and noise complaints. The coefficient for the settlement size standard deviation, which represents the difference in settlement areas, was 0.319, while the coefficient for the largest settlement size was slightly higher, at 0.400. The settlement size standard deviation indicates the evenness of cities/regions; the results suggest that a more uneven city/region is likely to receive more noise complaints. The largest settlement size indicates the clustering of the city/region, which concerns the degree to which development has been grouped to minimise the amount of land used for residential or non-residential aspects. The main settlement area might be the city centre or where the local authority is located. The results also show that a more clustered city/region tends to have more noise complaints. This may because clustered cities/regions can have high densities of buildings, larger traffic volumes, and lower degrees of natural landscapes. All these factors can increase resident annoyance regarding noise and, hence, increase complaints (Hao et al., 2015).
Correlation coefficients between settlement indicators and the noise complaint rate.
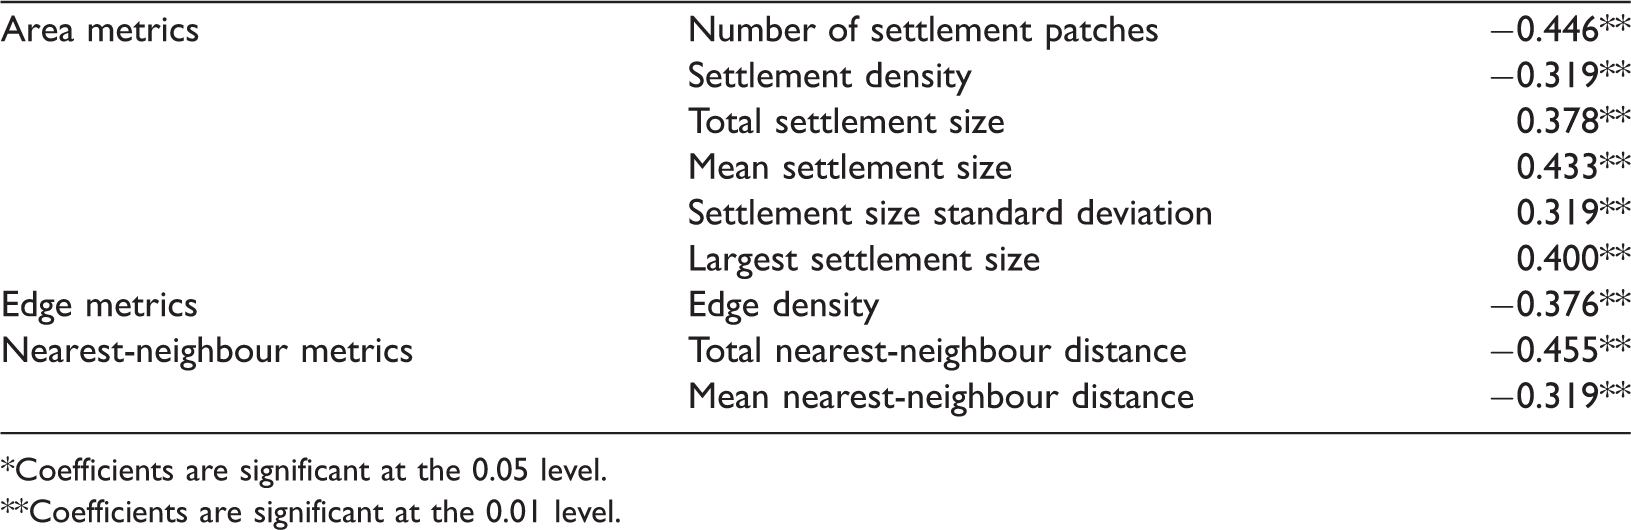
*Coefficients are significant at the 0.05 level.**Coefficients are significant at the 0.01 level.
Indeed, edge density has a negative relationship with the rate of noise complaints. This indicates that where the edge length per unit area is smaller, the rate of noise complaints increases. This result may be explained by the fact that a higher edge-density value means that the settlement shape is ragged, suggesting that the area touching the natural landscape could be enlarged along the edge. Previous studies have provided evidence that visibility of natural elements such as forests contributes to relieving noise annoyance, thereby reducing the noise complaint rate (Van Renterghem et al., 2015).
Regarding the distance between settlements in a city, there are two indicators: total nearest distance and average nearest distance. Higher values in either or both indicate that the distance between settlements is longer. Both the total distance and average distance are negatively related with the noise complaint rate. Nearest-neighbour metrics can indicate, to some extent, the dispersion of cities/regions; therefore, these results suggest that a more dispersed city has a lower noise complaint rate.
Overall, noise complaints have positive relationships with built-up area size metrics, such as the total settlement size, the settlement size standard deviation, and the largest settlement size. They also have negative relationships with the number of settlement patches and settlement density. In addition, they are also negatively related to edge and distance metrics, such as edge density, total nearest-neighbour distance, and mean nearest-neighbour distance. These results suggest that if a city is large, clustered, and/or uneven, a ragged boundary, fragmented distribution, and high distance between settlements are likely to reduce noise complaints.
In other words, it is possible to infer that sound environments in cities/regions with fragmented patterns are better than those in an integrated city; a decentralised city might have less noise pollution than a centralised city; a dispersed city might have a better sound environment than a clustered city; and cities that have grown discontinuously might have a better sound environment than those that have grown contiguously.
Transport networks
Most road and railway network indicators are related to the rate of noise complaints (Table 5). The rate of noise complaints is related to total road density. Motorway density is not related to the rate of noise complaints; motorways are normally not close to residential settlements and consequently have less influence on residents’ activities. Primary road density and A road density have positive relationships with the rate of noise complaints, as they are close to residential areas and thus have negative impacts on the living experience. B and minor road density is not related to the rate of noise complaints although these roads also interact with residential areas, they are relatively narrow and have light traffic, and their speeds also tend to be low.
Correlation coefficients between transport network indicators and the noise complaint rate.
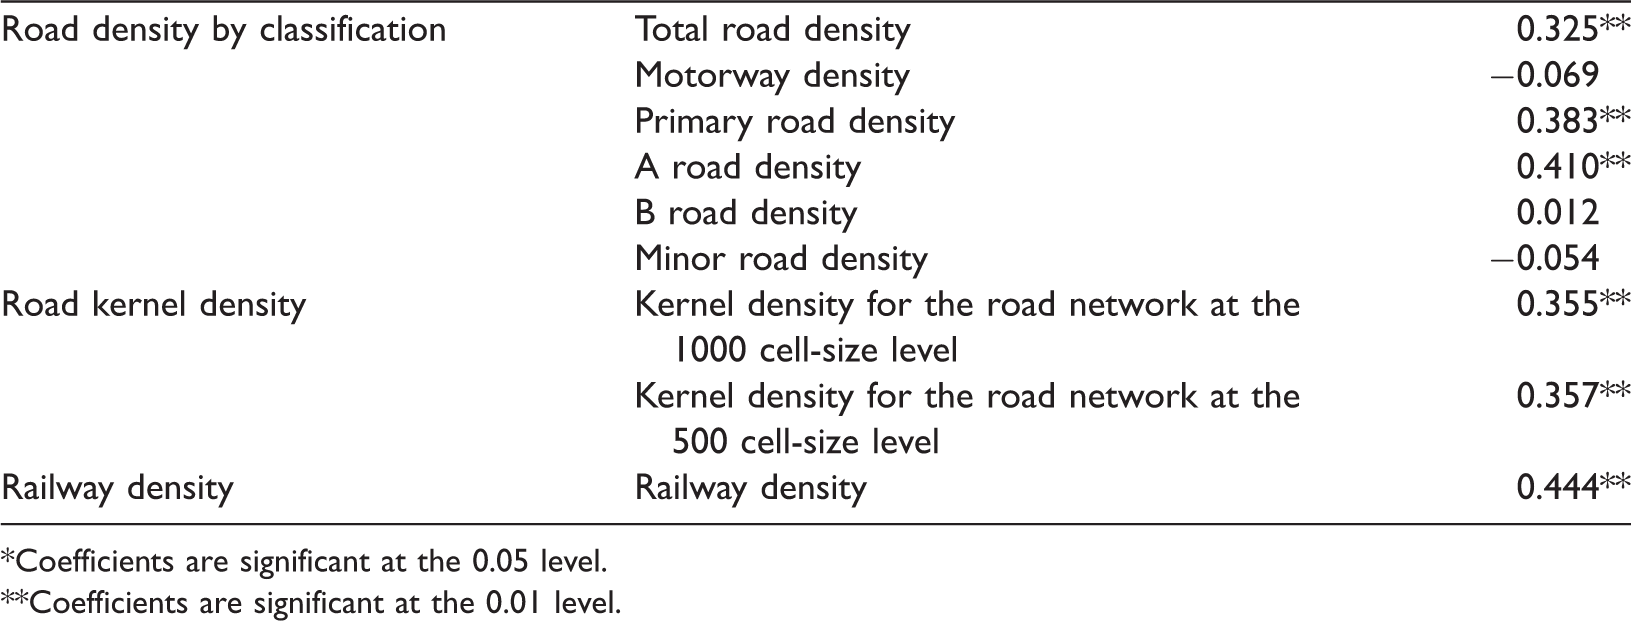
*Coefficients are significant at the 0.05 level.**Coefficients are significant at the 0.01 level.
With regard to kernel density, which is an indicator of the overall spatial distribution of the road network, the relationships between the rate of noise complaints and the road network kernel density at both the 1000 and 500 cell-size level are positive. This suggests that a city/region with a dispersed and even network has fewer noise complaints; uneven networks, in contrast, tend to lead residents to report noise nuisances. Therefore, these results provide further support for the previous analysis indicating that an uneven city/region is likely to have more noise complaints.
Railway density is correlated with the rate of noise complaints, with a value of 0.444. Thus, as the density of railway infrastructure increases, the noise complaint rate also increases. From a historical perspective, the development of a railway might prompt immigration to the core area, and hence, cause unevenness in development (Kotavaara et al., 2011). The result also supports that uneven cities/regions are likely to have more serious noise pollution issues.
Among the factors analysed in this research, the transport network was found to have the strongest relationship with noise complaints. These results, to some extent, verify the findings of other studies, which reported that traffic noise is one of the main urban noise sources and has a serious impact on human well-being (Asdrubali and Costantini, 2005). From these results, it is obvious that not all road classes, but only roads that pass through residential areas, are positively related to the noise complaint rate. From another perspective, a linear pattern is an urban growth form that is developed along transport routes such as roads and railways (Clawson, 1962; Sultana and Weber, 2013). The results indicate that cities/regions developing along the transport routes can have more serious sound environment problems, to some extent.
Commuting
The relationships between proportions of residents with different commuting methods and noise complaints are shown in Table 6. The percentages of residents who travel to work by underground, train, bus, taxi, or motorcycle/scooter/moped have positive relationships with noise complaints. In contrast, the percentages of residents who drive a car or van are negatively related to noise complaints, and the coefficient is higher than those of other modes: the value is −0.425. The percentage of residents riding a bicycle to work is positively related to noise complaints. No statistically significant correlation was observed between noise complaints and residents who walk to work. From these results, it appears that cities/regions with higher percentages of residents taking energy-efficient transport modes to work tend to have more noise complaints.
Correlation coefficients for the percentages of different commuting methods and the noise complaint rate.
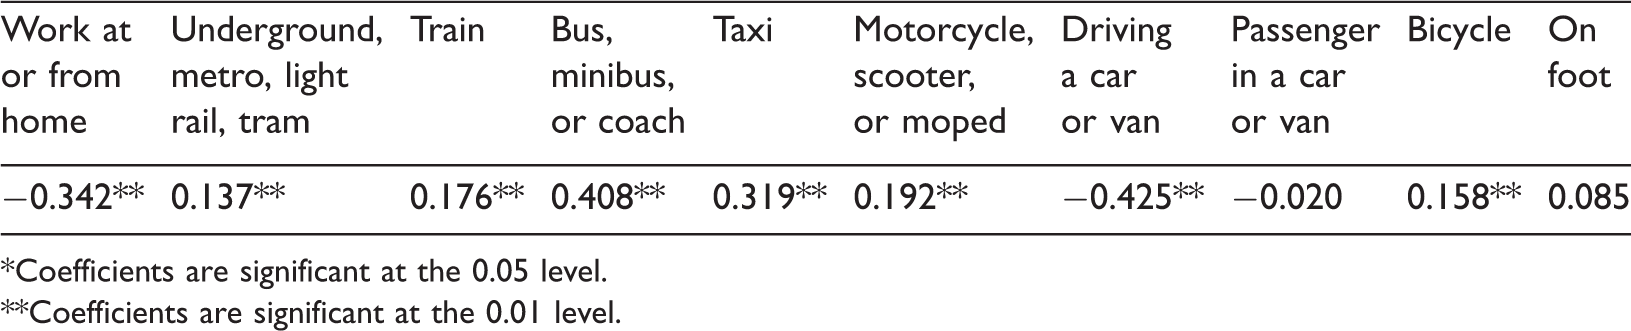
*Coefficients are significant at the 0.05 level.**Coefficients are significant at the 0.01 level.
The relationship between noise complaints and commuting distance is shown in Table 7. The proportion of residents who travel less than 2 kilometres is not related to noise complaints. Residents might walk such a short distance to work and, thus, this finding corresponds to Table 7, which shows no relationship between the percentage of residents who travel to work on foot and noise complaints. The proportion of residents who travel 2–5 kilometres to work has positive relationships with noise complaints. These distances are suitable for cycling; therefore, this also corresponds to the results shown in Table 6. The proportion of residents who travel from 10 to over 60 kilometres is generally negatively related to noise complaints, with coefficients of approximately 0.2–0.3.
Correlation coefficients between distance travelled to work and noise complaints (kilometres).
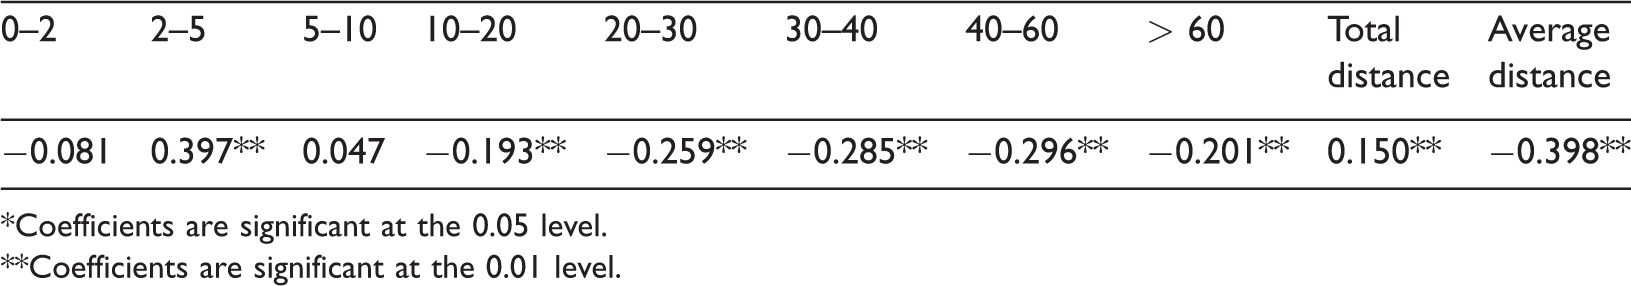
*Coefficients are significant at the 0.05 level.**Coefficients are significant at the 0.01 level.
Overall, noise complaints have a negative relationship with the average commuting distance. Areas in which workplaces and residences are mixed tend to have more noise complaints and to be relatively noisy, while areas with separated workplaces and residences show fewer noise complaints. It could be caused by the land use of workplaces (i.e. commercial or industrial), where the intensity of activities and noise levels are both high during the daytime. Therefore, residents tend to complain (Gillen and Levesque, 1994; Nadaraja et al., 2010). In addition, cities/regions with short average commuting distance and a higher percentage of residents using public transport might be clustered and integrated, meaning that a compact city/region is likely to have more noise complaints.
Natural landscapes
Researchers have found that natural landscape features, such as vegetation and water bodies, can have significant impacts on sound environments. It can be seen from Table 8 that natural elements are generally related to noise complaints. National park density has a negative relationship with noise complaints. The coefficient is −0.238 (p < 0.01). Thus, cities/regions with national parks are likely to have less noise complaints, and as national park density increases, the noise complaint rate reduces. Woodland density also has a negative relationship with noise complaints. This result seems to be consistent with other research, which found that forests may strongly decrease night time noise levels. Noise annoyance, therefore, could be reducing (Van Renterghem et al., 2015).
Correlation coefficients between natural element indicators and noise complaints.
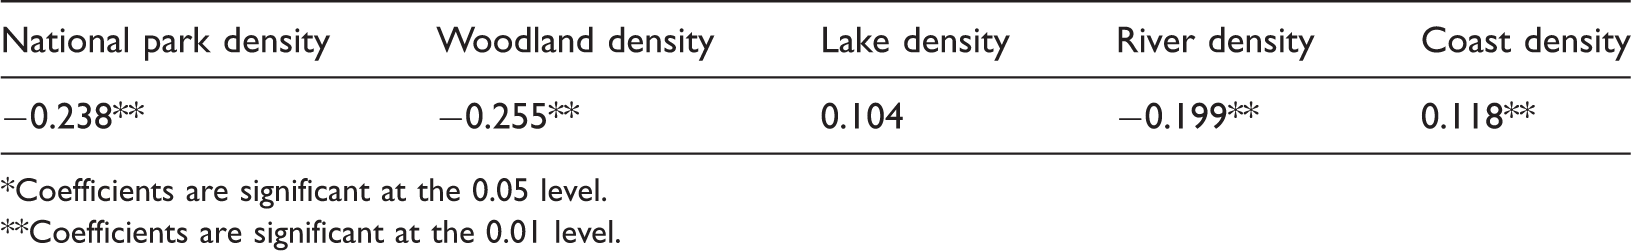
*Coefficients are significant at the 0.05 level.**Coefficients are significant at the 0.01 level.
No statistically significant correlation was observed between lake density and noise complaints; this might be because lake areas are relatively small and, thus, have little effect on residents. It could be also partly explained from an accessibility perspective. The average nearest distance from residential areas to the lake is 4473.51 metres. Accessibility to the lake is low for residents. Hence, the effect of lakes is limited.
River density is negatively related to the noise complaint rate, with a coefficient of −0.199. For coastlines, a positive relationship is shown, with a coefficient of 0.118. Cities developing along coastlines are another linear pattern, apart from developing along roads as previously mentioned. The finding, to some extent, indicates that cities/regions developing along coastlines also have more serious noise pollution, which is in accordance with recent studies implying that cities developing along the coastline have lower noise levels (Margaritis and Kang, 2016).
Overall, natural elements are negatively related to noise complaints, with the sole exception being coasts, but the coefficients are small. Consistent with the literature, this study confirms that natural scenery has a positive impact on the perception of sound environments (Liu et al., 2014). There are several possible explanations for this finding. Noise can be absorbed by vegetation, and waterscapes can also reduce noise annoyance. In addition, the impacts of sound and visual interaction on perception have been confirmed in previous research (Van Renterghem et al., 2015). Therefore, it is to be expected that natural landscapes can mitigate noise complaint rate issues. The result also suggests that a dispersed city with prevalent natural elements could have a better sound environment. This finding is consistent with previous studies that have suggested that an increase in green patches can possibly be correlated with a decrease in noise levels and that green space provides more positively experienced sound (Gunnarsson et al., 2017; Van Herzele and Wiedemann, 2003).
Ridge regression model for the noise complaint rate prediction
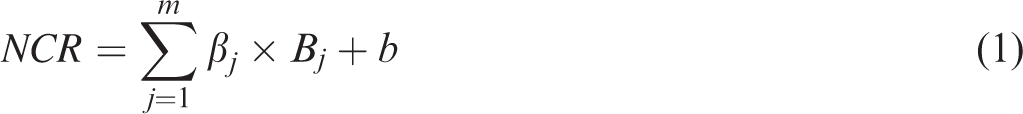
After determining the relationships between the noise complaint rate and 75 individual urban development pattern factors, a multivariate model was developed to predict the noise complaint rate. The regression equation is shown as follows
In terms of the model application, for instance, Nottingham is located in the centre of England with 41.00 persons per hectare and a population size of 303,899. The noise complaint rate of Nottingham is 8.10 per thousand persons (a case from the test set), with the prediction value of 7.38. However, the application of this model to other countries needs further discussion. From an urban development pattern and culture background perspective, generally speaking, cities in Europe could apply this model as they are similar to those in England, although previous research has shown that the tolerance level to noise also varies in different counties (Yang and Kang, 2005). In contrast, the model has limitations for cities that are significantly different from those in England, such as typical high-density areas like Manhattan. Indeed, the relationships between the sound environment and urban morphology vary with different densities. High-density areas have more low frequency content of sound and lower sharpness values compared with low-density areas (Hong and Jeon, 2017), whereas in low-density areas, birdsong has a masking effect on noise (Hao et al., 2015).
This model will not only provide an effective way for the noise complaint rate to be predicted at the cities/regions scale, but it can also help government organisations prioritise resources for dealing with noise pollution from an urban development perspective.
Conclusions
This study examined the relationships between noise complaints and urban development patterns through a large-scale analysis of England. The findings are as follows:
Cities/regions with high population densities tend to have a higher noise complaint rate. In addition, it is strongly related to population density and weakly related to total population. High-density cities/regions have higher probability of a poorer sound environment. Regarding industrial structures, service-dominated cities have more noise complaints than cities dominated by primary and secondary industries. Larger and more uneven cities/regions tend to have more noise complaints, as do clustered cities/regions. However, cities/regions with dispersed and fragmented patterns and ragged boundaries are likely to have lower noise complaint rates. Regarding transport networks, overall, cities/regions with higher road and railway densities are likely to receive more noise complaints. However, not all road classes, but only primary and A-class roads have a positive relationship with noise complaints. In addition, uneven road networks lead residents to report noise nuisances. Linear urban patterns along a road might have serious noise pollution problems. Also related to transport networks, commuting factors show that cities/regions in which residences are separated from workplaces are prone to have fewer noise complaints, and vice versa. Furthermore, from a commuting pattern perspective, a compact city is likely to have a higher noise complaint rate. Cities/regions with more natural elements, including greenery and bodies of water, tend to have lower noise complaint rates.
This study provides a basic analysis for the understanding of relationships between noise complaints and urban development patterns, and it illustrates the impact of the latter on the former. These findings could be used to predict the rate of noise complaints, clarify the cities/regions that might have more serious noise complaint issues, and identify the factors that should receive more attention when addressing these issues (e.g. when utilising and protecting the natural landscape). This research indicates that urban planning parameters can be applied to achieve better sound environments, and can, to some extent, inform urban planners from the perspective of acoustic impacts, potentially leading to more effective noise management strategies and planning progress.
This study primarily focussed on noise complaints, which is a behaviour as opposed to a noise perception. A considerable literature exists with regards to the latter, so the links between noise complaints and perception can be researched further. Although relationships between urban development patterns and noise complaint rates have previously been examined, the causality of these relationships remains undiscussed. This study only considered noise complaints at a macro-scale and did not involve temporal information; to develop a full picture, additional studies are needed. For instance, if spatial-temporal information for each individual complaint could be obtained, a detailed spatial-temporal distribution of noise complaints could be examined. Another limitation is that this study focused on noise complaints in England and generated a prediction model based on data sets from England. It would be interesting to explore situations in other countries with different urban morphological features, population density, and cultural backgrounds.
Supplemental Material
sj-pdf-1-epb-10.1177_2399808320930247 - Supplemental material for Relationship between urban development patterns and noise complaints in England
Supplemental material, sj-pdf-1-epb-10.1177_2399808320930247 for Relationship between urban development patterns and noise complaints in England by Huan Tong and Jian Kang in Environment and Planning B: Urban Analytics and City Science
Footnotes
Declaration of conflicting interests
The author(s) declared no potential conflicts of interest with respect to the research, authorship, and/or publication of this article.
Funding
The author(s) received no financial support for the research, authorship, and/or publication of this article.
Supplemental material
Supplemental material for this article is available online.
References
Supplementary Material
Please find the following supplemental material available below.
For Open Access articles published under a Creative Commons License, all supplemental material carries the same license as the article it is associated with.
For non-Open Access articles published, all supplemental material carries a non-exclusive license, and permission requests for re-use of supplemental material or any part of supplemental material shall be sent directly to the copyright owner as specified in the copyright notice associated with the article.