
Abstract
Retail centres are important tools for understanding the distribution and evolution of the retail sector at varying geographical scales. This paper presents a framework through which formal definitions and typologies of retail centres, such as those in the UK, can be extended to the US. Using Chicago as a case study and data from SafeGraph, we present a retail centre delineation method that combines Hierarchical-DBSCAN with ‘H3’, and demonstrate the usefulness of a non-hierarchical approach to retail classification. In addition, we show that the dynamicity and comprehensibility of retail centres make them an effective tool through which to better understand the impacts of COVID-19 on retail centre ‘health’, demonstrating significant scope for a comprehensive delineation of the scale, extent and characteristics of American retail centre agglomerations, providing a tool through which to monitor the evolution of American retail.
Introduction
The contemporary physical retail environments of cities and urban areas have complex form and function, evolving in response to a multiplex of pressures. In the UK, the effects of rising online sales and the 2008 recession continue to be felt on high streets, where retail presence continues to decline (Dolega and Lord, 2020). Similarly, the American retail sector is amid an ‘apocalypse’ (Boerschinger et al., 2017; Isidore, 2017) with notable decreasing ‘brick-and-mortar’ sales and high vacancy rates (Boerschinger et al., 2017), and more recently, the global impact of the COVID-19 pandemic have been particularly visible, exacerbating many of these problems (Nicola et al., 2020).
Understanding better the dynamics of retail evolution – occurring partially in response to these pressures – is vital for academics and various stakeholders, requiring attention at a range of spatio-temporal scales and intensities (Thurstain-Goodwin and Unwin, 2000). In particular, having ways to monitor the ‘health’ of retail agglomerations has become acutely important, given their role in economies and communities (Berman and Evans, 2013; Coca-Stefaniak, 2013). However, in order to monitor the health of retail centres, it is first vital to understand their form and function. In particular, emphasising the development of automated approaches to estimate their spatial extent, monitor evolutionary trajectories and derive catchment characteristics (Joseph and Kuby, 2016), providing stakeholders with a platform upon which to make better evidence-led decisions.
As such, the contributions of this paper are threefold. We build on existing frameworks to provide a theoretical rationale and empirically grounded framework for the (i) definition and (ii) characterisation of retail centres, using innovative methods and new forms of data, before demonstrating its application to the Chicago Metropolitan Statistical Area (MSA) and (iii) using it to highlight the visible impacts of COVID-19, for the first time, on the ‘health’ of different retail centres. Chicago is an interesting setting to implement this framework, given the existing wealth of research on urban retail structures (Berry, 1963; Casparis, 1969; Joseph and Kuby, 2016; McMillen, 2003), and significant gap in the use of contemporary methods and data to improve such understandings.
The ‘place’ of retailing
The tendency for retail units to agglomerate has received substantial theoretical attention, often being linked to the economic decisions of individual businesses (Sohn et al., 2003), which concentrate spatially to derive benefit from ‘agglomeration economies’ (McCann and Folta, 2008). Thus, given the economic advantages of spatial clustering, it is perhaps no surprise that centrality and agglomeration are considered key concepts in the geographies of retail space (Brown, 1992). A number of theories and models have been posited to conceptualise these geographical tendencies. Christaller’s ‘central place theory’(CPT) is widely regarded as a key model, proposing that ‘central places’ exist to serve the need for goods in surrounding areas (Parr, 2017). At a relatively simple level, CPT provides a conceptual model to better understand the spatial arrangement of retail (centres). However, CPT has been criticised for unrealistic assumptions about consumer behaviour (Parr, 2017), and it fails to apply in polycentric cities or irregular commercial forms (Brown, 1992; Dolega et al., 2019). Other conceptualisations include the theories of Von Thunen and Haig, but both have faced similar criticism (Brown, 1992; O’Kelly and Bryan, 1996). Although there is scope in applying these principles, they are limited in failing to address the complexity of structural and functional interdependencies between centres (Dolega et al., 2019).
The spatial extent of retail agglomerations
Historically, there have been numerous attempts to differentiate retail agglomerations based on form (e.g. Proudfoot, 1937). The first form-function, delineation (Berry, 1963), identified types of retail clusters in Chicago, quickly becoming the universally accepted model of retail organisation. Furthermore, Murphy and Vance provided a delineation utilising a ‘central business index’ (1954), and Brown (1992) proposed the first ‘non-hierarchical’ form-function delineation. More recently, the coupling of new data and analytical frameworks have revived interest in delineation (Dolega et al., 2016). Early ‘data-intensive’ work (e.g. Thurstain-Goodwin and Unwin, 2000) utilised continuous density transformations to delineate UK town centres, and in other examples, surface density functions coupled with volume contours and geometric operations have been used (de Smith et al., 2018; Singleton et al., 2011). Furthermore, Ordnance Survey and Geolytix have constructed similar retail centre definitions, but were limited in exclusion of some retail functions and lack of open accessibility, respectively.
In recent examples, there has been preference for more explicit definitions using spatial cluster analysis of store locations (Han et al., 2019; Lloyd and Cheshire, 2017; Yoshimura et al., 2020). For example, Pavlis et al. (2018) utilised an unsupervised machine-learning algorithm (DBSCAN) in automated delineation of UK retail centres, developing a modified version of the algorithm to solve a common issue with the application of DBSCAN to real-world distributions; heterogeneities in local point density (Campello et al., 2013). However, to facilitate issues with the dataset, their approach required specification of additional parameters and was reasonably computationally inefficient, limiting its implementation in future studies.
The Hierarchical-DBSCAN algorithm has developed saliency, offering a solution to many of DBSCAN’s limitations. With only one mandatory input parameter (minPts), HDBSCAN makes parameter selection more intuitive and robust, whilst accounting for heterogeneous point densities, through production of a DBSCAN cluster tree (Campello et al., 2013). Furthermore, the algorithm can utilise precomputed distance matrices for improved performance (Campello et al., 2013), enabling incorporation of network distances. Despite this, its potential for retail centre delineation has not yet been realised.
The typologies of retail agglomerations
Classifications of retail agglomerations have traditionally argued that retail is hierarchically organised (Brown, 1992; Dolega et al., 2019), and can be classified based on assumptions about demand and supply, drawn from CPT. These ‘vertical’ classifications have been criticised for using simple datasets and non-uniform methods, failing to accurately represent the spatiality of retail provision (Dolega et al., 2019; Guy, 1998). Recently, there has been a call for classifications that better comprehend changes to retail provision (Grewal et al., 2017), which are now both possible and more necessary (Dolega et al., 2019), including the use of a socioeconomic classification matrix (Coca-Stefaniak, 2013) and footfall patterns (Mumford et al., 2017).
In a recent example, using the boundaries delineated in Pavlis et al. (2018), Dolega et al. (2019) used a data-driven approach to construct a ‘non-hierarchical’ typology. Variables were gathered to capture four domains they believed key to capturing the multidimensionality of retail centres, and using an unsupervised machine learning algorithm called partitioning around medoids (PAM), they developed a two-tier classification, with PAM used over k-means to reduce the impacts of outliers (Struyf et al., 1996). This approach arguably provided the most nuanced and comprehensive way of representing relationships between centres, rather than assuming that hierarchical relationships prevail. However, in the US, systematic nationwide and rigorous ‘data-intensive’ studies on the scale, extent and characteristics of retail agglomerations are yet to be realised.
Study context and data
The Chicago Metropolitan Statistical Area (MSA) has a retail sector that provides a rich consumption experience for residents and visitors (Glaeser et al., 2001). However, as across the US, the sector remains challenged by increasing retail vacancies (Joseph and Kuby, 2016), an over-saturation of ‘brick-and-mortar’ retail, and increased uptake of E-commerce, resulting in shifting shopping habits and store typologies across Chicago (Joseph and Kuby, 2016). Thus, there is justification for a contemporary definition of retail centres, which can shed insight into current and future retail provision.
However, a challenge in defining the spatial extent of retail centres is a lack of comprehensive, up-to-date and open-access retail location data. In this study, we use data from SafeGraph as the best available source, in particular their register of ‘core places’ where consumers spend money or time in the US (SafeGraph Inc., 2020a), and corresponding mobility data or ‘weekly patterns’ (SafeGraph Inc., 2020b), collected from the GPS data of 45 million anonymised mobile phone users (Gao et al., 2020). SafeGraph ‘core places’ were re-classified to identify the ‘retail places’, and the ‘non-retail’ places were removed from the dataset, leaving 106,058 retail locations for the Chicago MSA. For background information on the datasets and processing of these, see section A of the supplementary material.
Delineating urban retail centres
HDBSCAN was adopted to derive retail centres for the Chicago MSA (Figure 1), using the retail places extracted in the previous section. As above, minPts is the only mandatory parameter in HDBSCAN, controlling the minimum number of points in a cluster. The value was set to 10 to maintain a consistent definition with Pavlis et al. (2018). Network rather than Euclidean distances were used in HDBSCAN – the lengths of the shortest path (by road) between points – to better account for the role of urban morphology in retail distributions (see section B of supplementary material). HDBSCAN was iterated for subsets of points delimited by each county to enable practical run times for generation of the network distance matrices (dist). However, in the case of ‘Cook County’, the largest in the MSA, HDBSCAN was iterated for three subsets naturally delimited by the Chicago River. These iterations had little effect on centre distributions, but were deemed inevitable as computationally this limitation could not be avoided. As a result, HDBSCAN generated cluster IDs for every point within a significant cluster, labelling other points as ‘noise’.
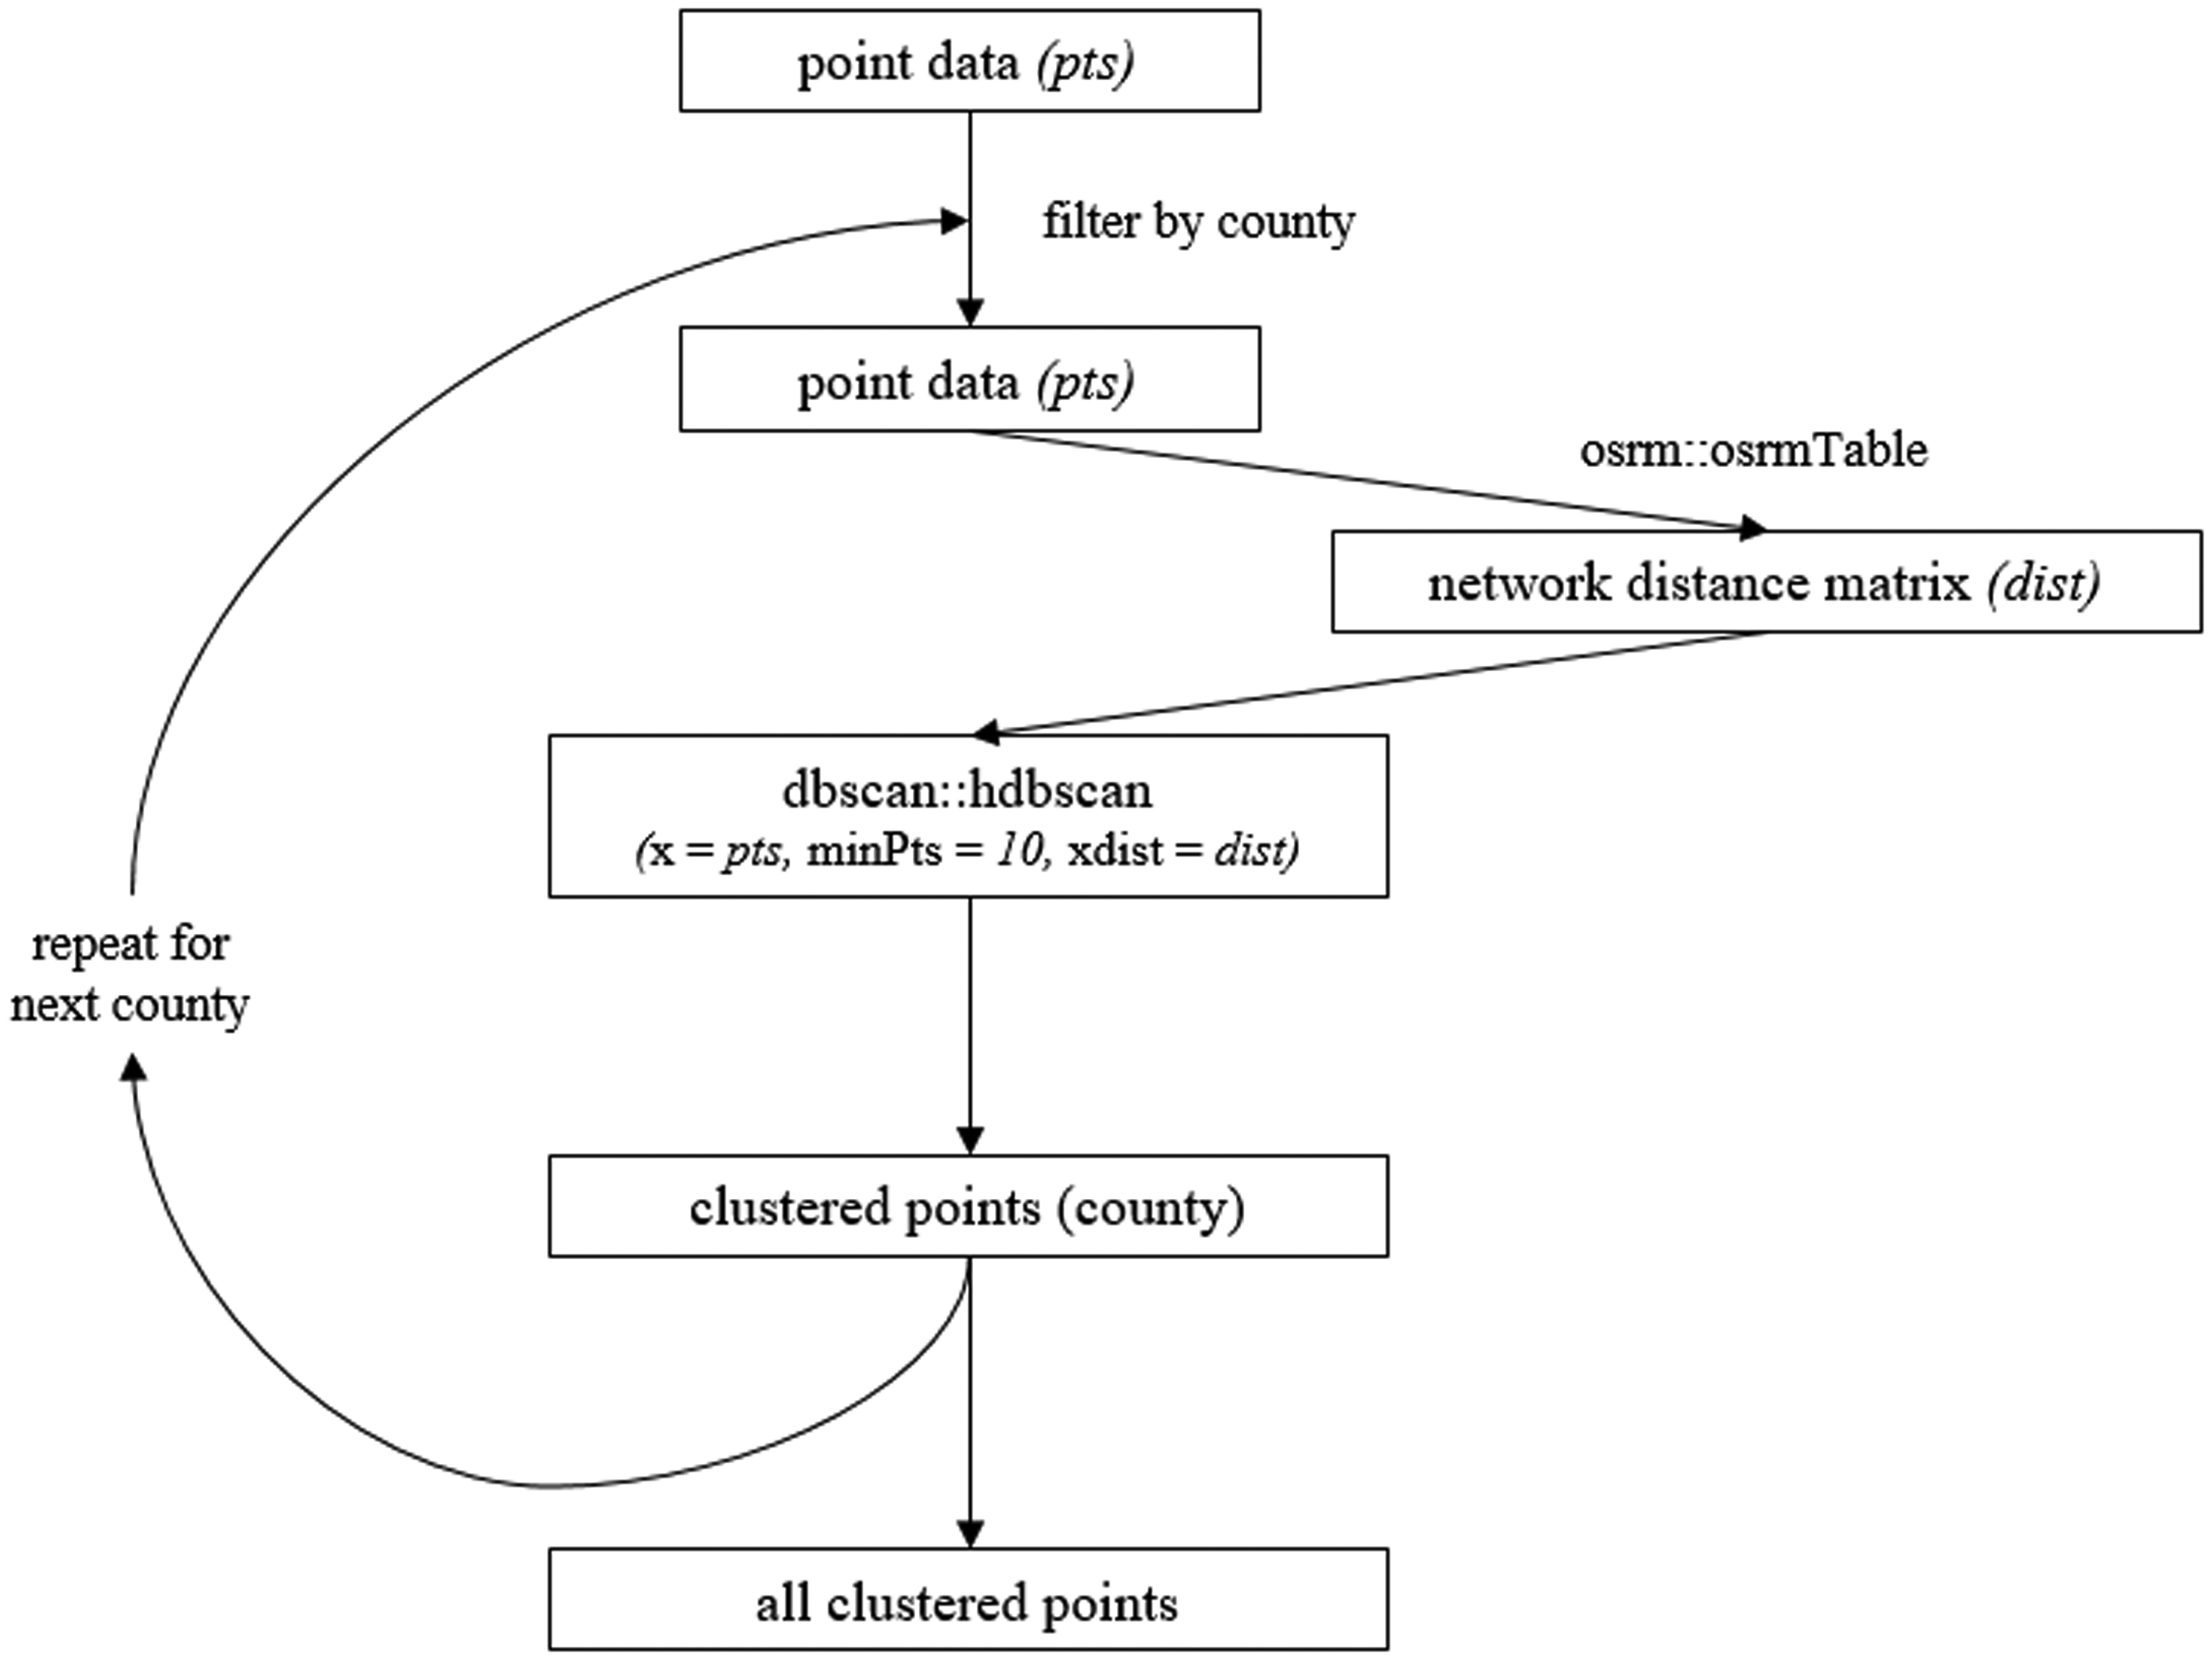
Iterative application of network-based HDBSCAN for delineation of retail centres.
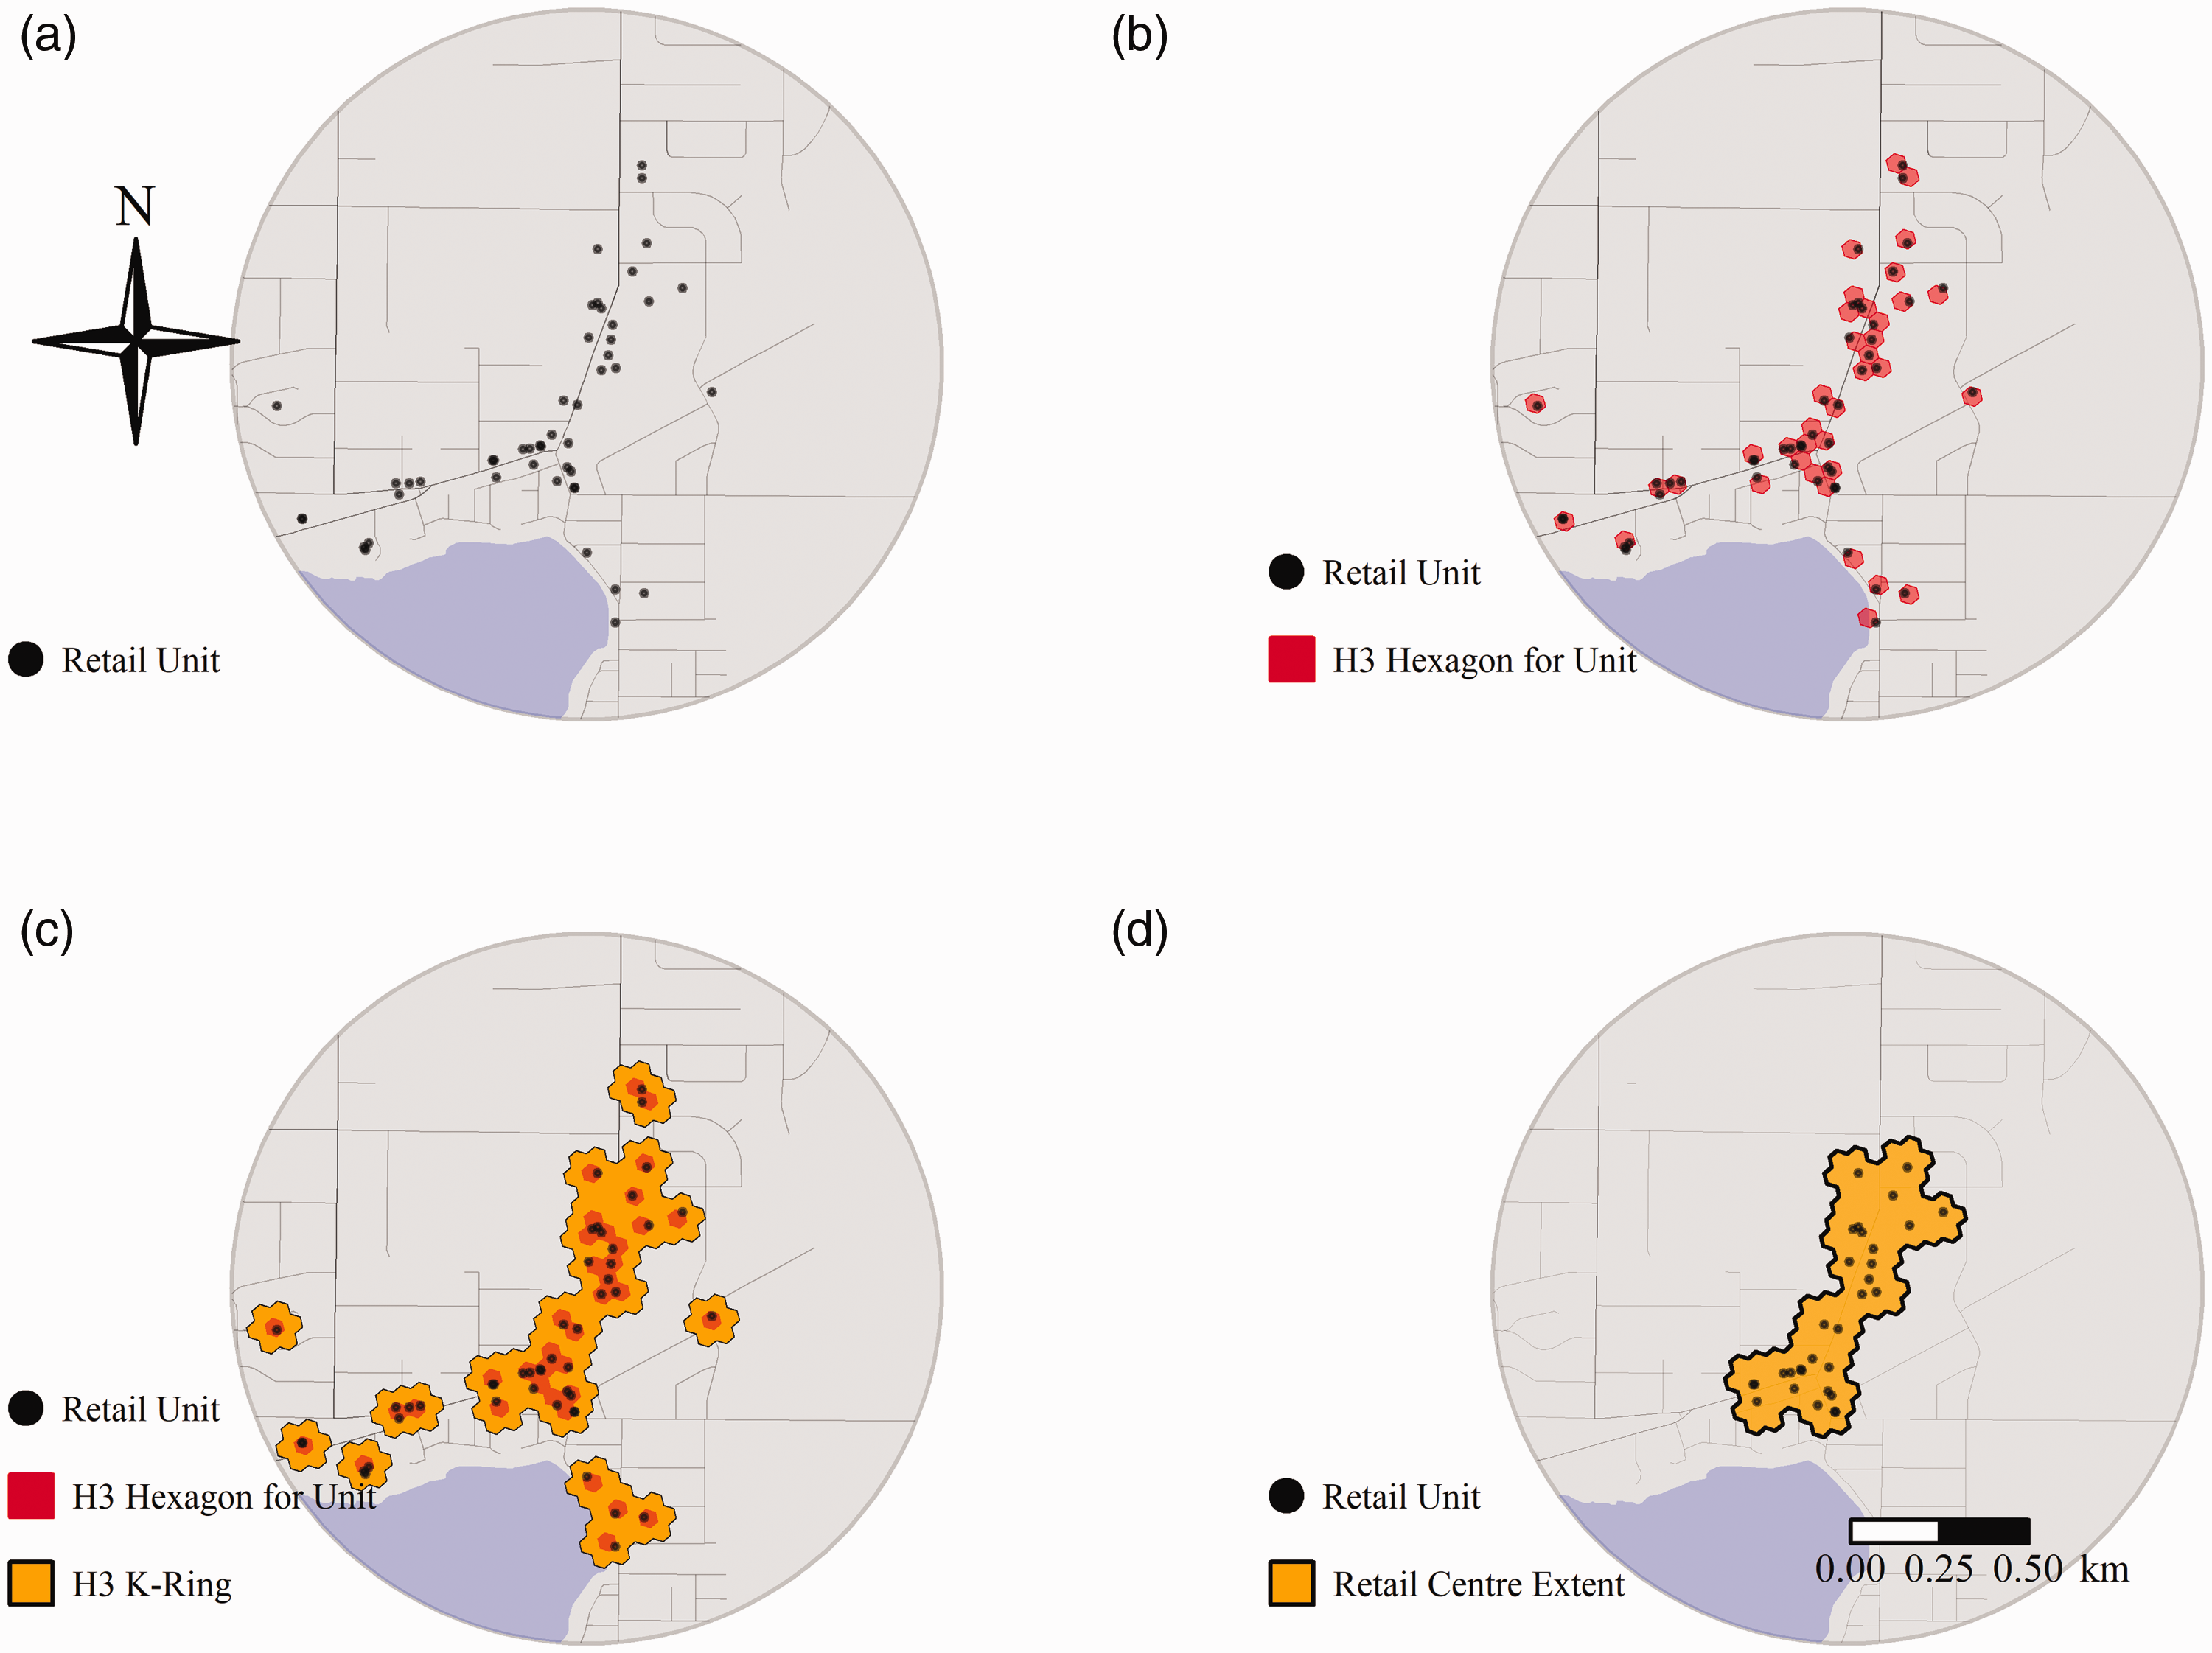
Cluster refinement using H3.
The output of HDBSCAN are points with cluster labels, thus not complete demarcations of areas, and required refining to remove points outside the main cluster ‘core’ (Figure 2). We developed an approach to derive and refine boundaries utilising the ‘H3’ hexagonal spatial indexing system (Uber, 2018), seen below in Figure 2. Using the ‘h3jsr’ R package (O’Brien, 2020), each clustered point (2a) was aggregated to a hexagon at resolution 11 (2b), each having an area of approximately 10 metres. A buffer consisting of the six neighbouring hexagons (k-ring) was extracted (2c). Using the minPts threshold defined in HDBSCAN, only those contiguous and non-isolated zones containing 10 or more retail places were extracted as the final retail centres (2d). The assigned cluster IDs were comprised of a county and numeric identifier, with clusters in Cook containing additional identifiers – W, S, N – to reflect the intra-county iterations.
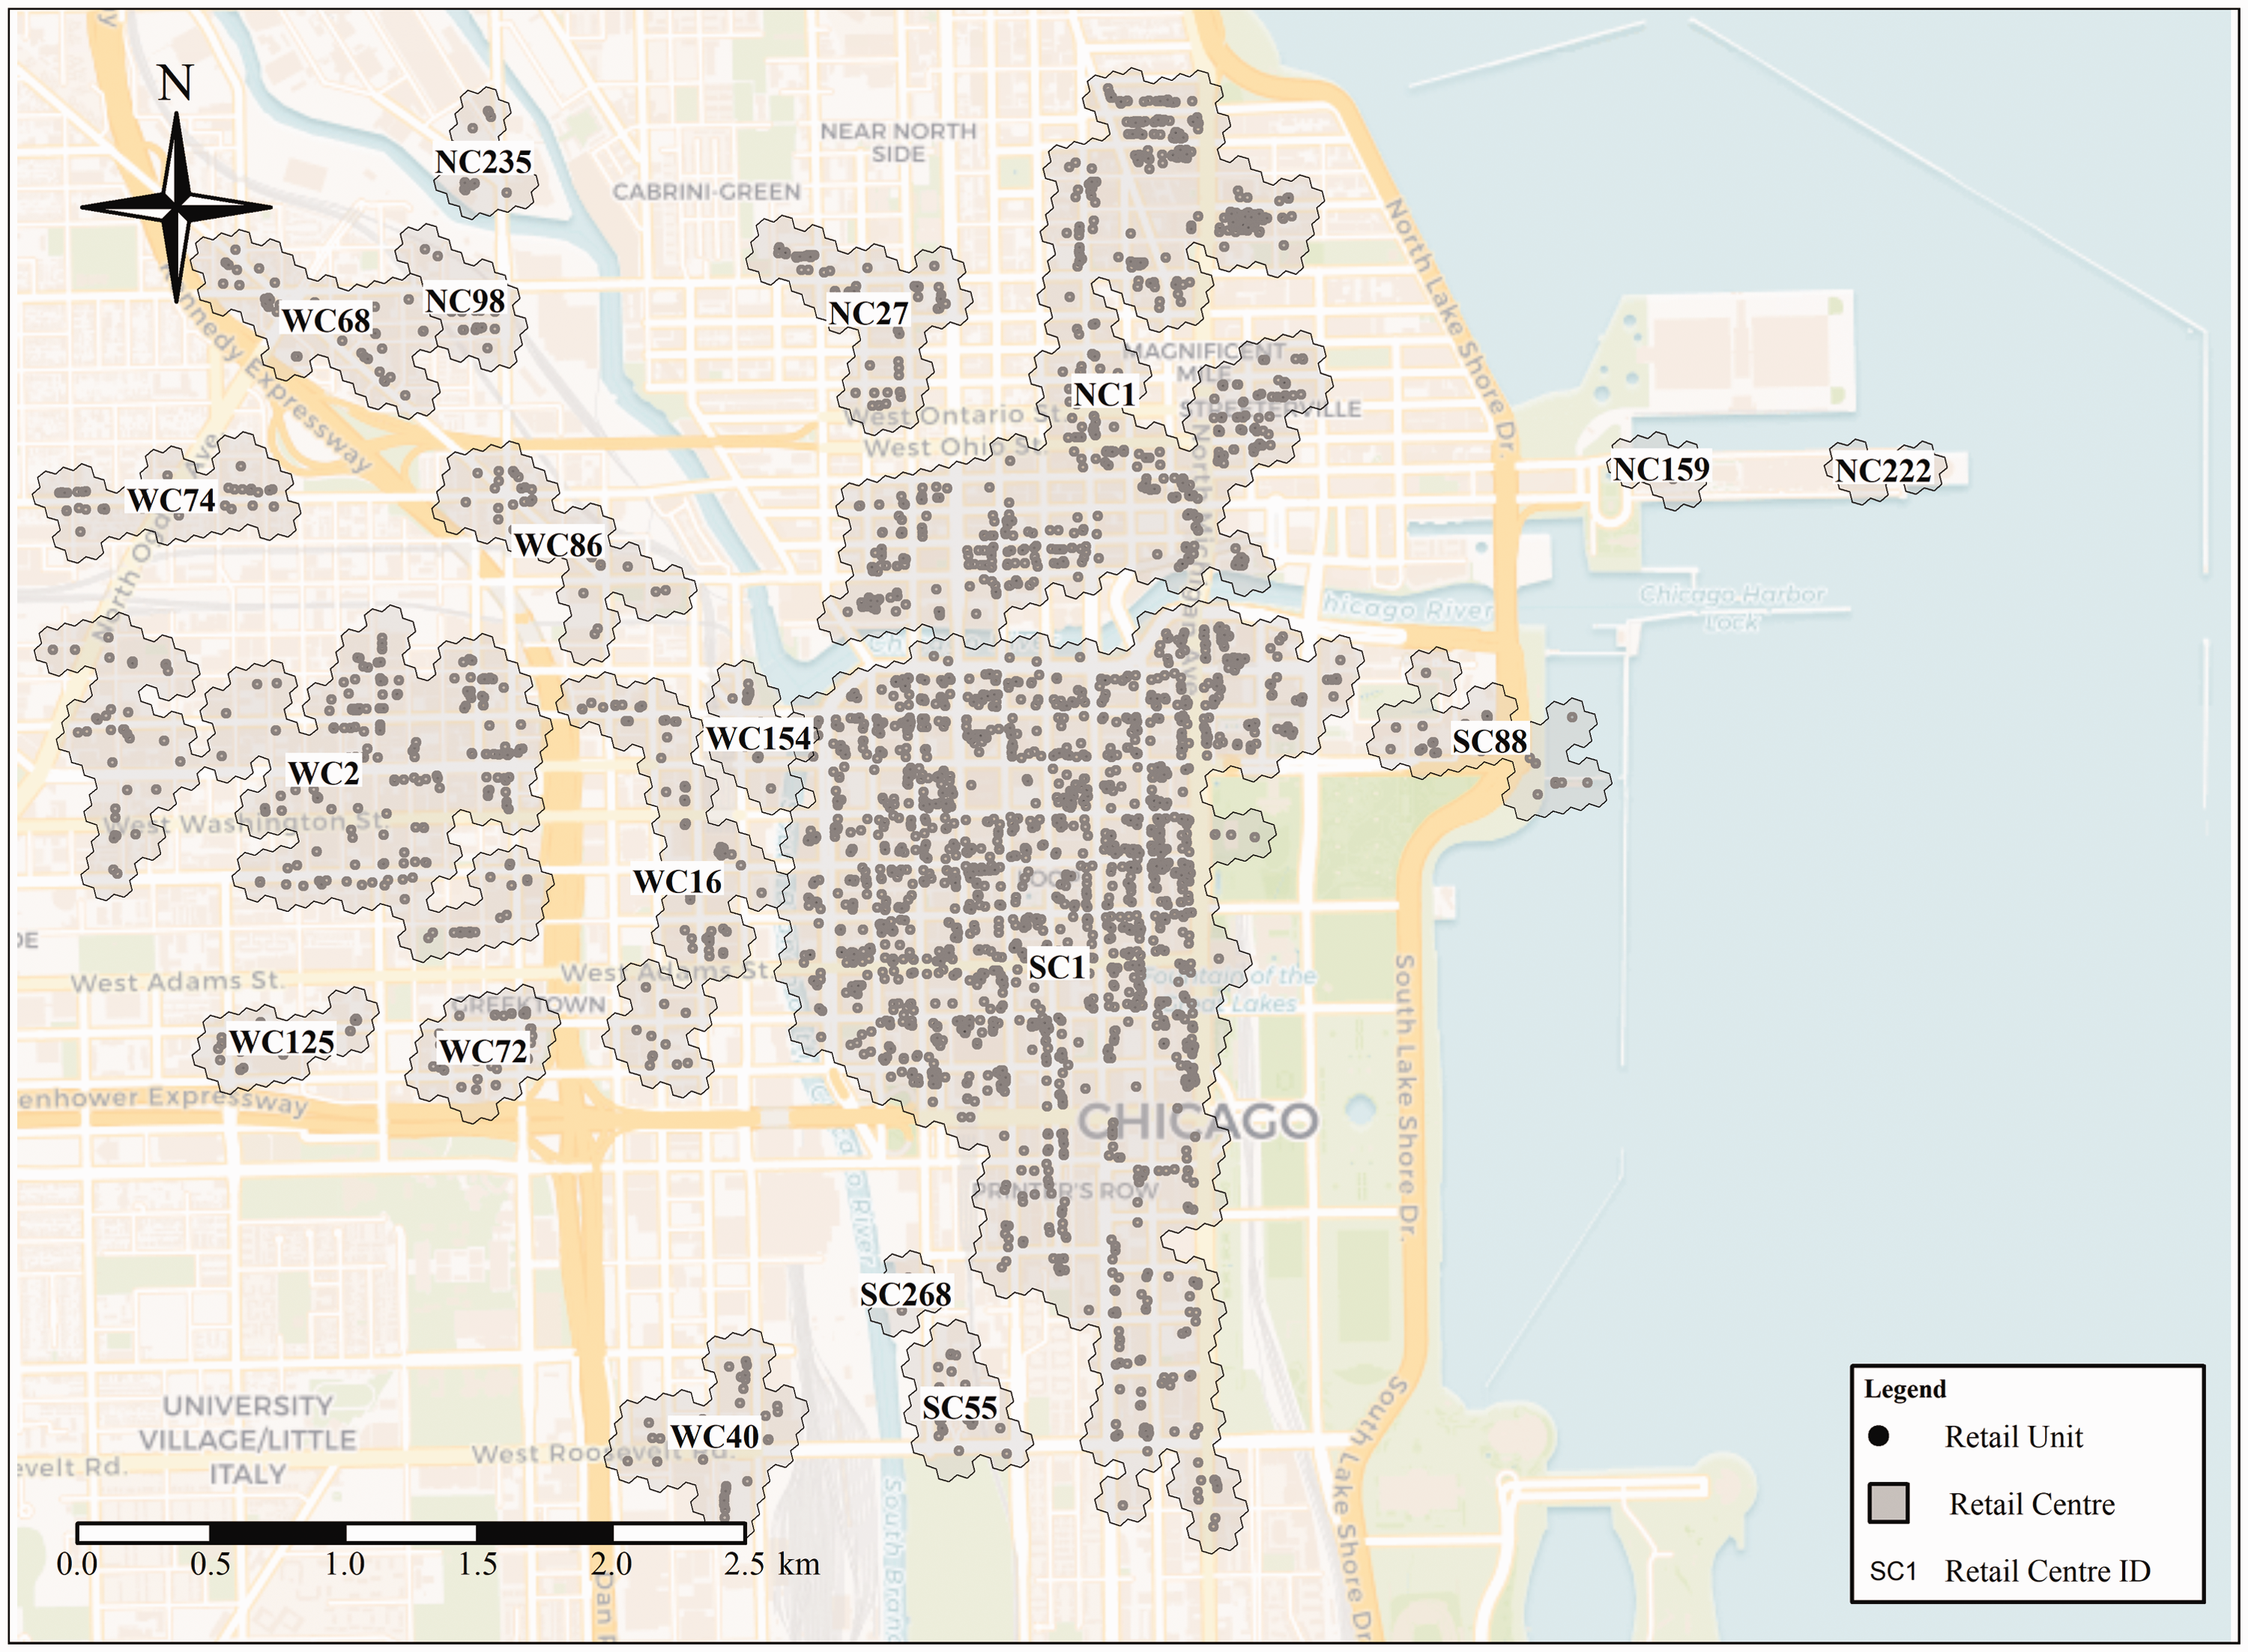
Delineated retail centres for Chicago CBD.
The spatial extent of retail centres
This approach extracted 1,599 retail centres, with the smallest composed of 10 units (minPts) and the largest; ‘The Loop’ (SC 1) containing 2,013 units. The majority were located in the CBD and nearby suburbs; the areas of greatest economic activity (Pan et al., 2017; Sohn et al., 2003). Unsurprisingly, given its polycentricity, many agglomerations also existed within the core of cities in the wider MSA like Elgin and Joliet (McMillen, 2003), and along major transport arteries (McMillen, 2003; Pan et al., 2017; Sohn et al., 2003). To assess the effectiveness of the delineation, two case study areas were chosen based on relevant literature and to highlight the efficacy of the algorithm in different urban settings – Chicago CBD and Schaumburg Village.
In Chicago CBD (Figure 3), one large cluster was identified (SC1), unique in terms of size and morphology, representing the ‘historic retail core’ of Chicago; The Loop (Credit, 2020). NC1 encompassed the ‘Magnificent Mile’ (Figure 3), another significant retail destination (The Magnificent Mile Association, 2015), and WC2 corresponded to Fulton Market. Schaumburg Village also had a large concentration of retail centres (Figure 4), unsurprising given its reputation as a ‘golden retail corridor’ (Fleming, 2008). Major shopping developments were delineated, such as Woodfield Mall (WC3) and Woodfield Green (WC27), as well as some smaller centres. This was arguably only possible through integration of network distances, the most effective way to understand Chicago’s urban structure (Pan et al., 2018). However, the use of building geometries over points would arguably generate more accurate centre boundaries, by fully accounting for the wider footprint of retail locations (e.g. shopping malls).
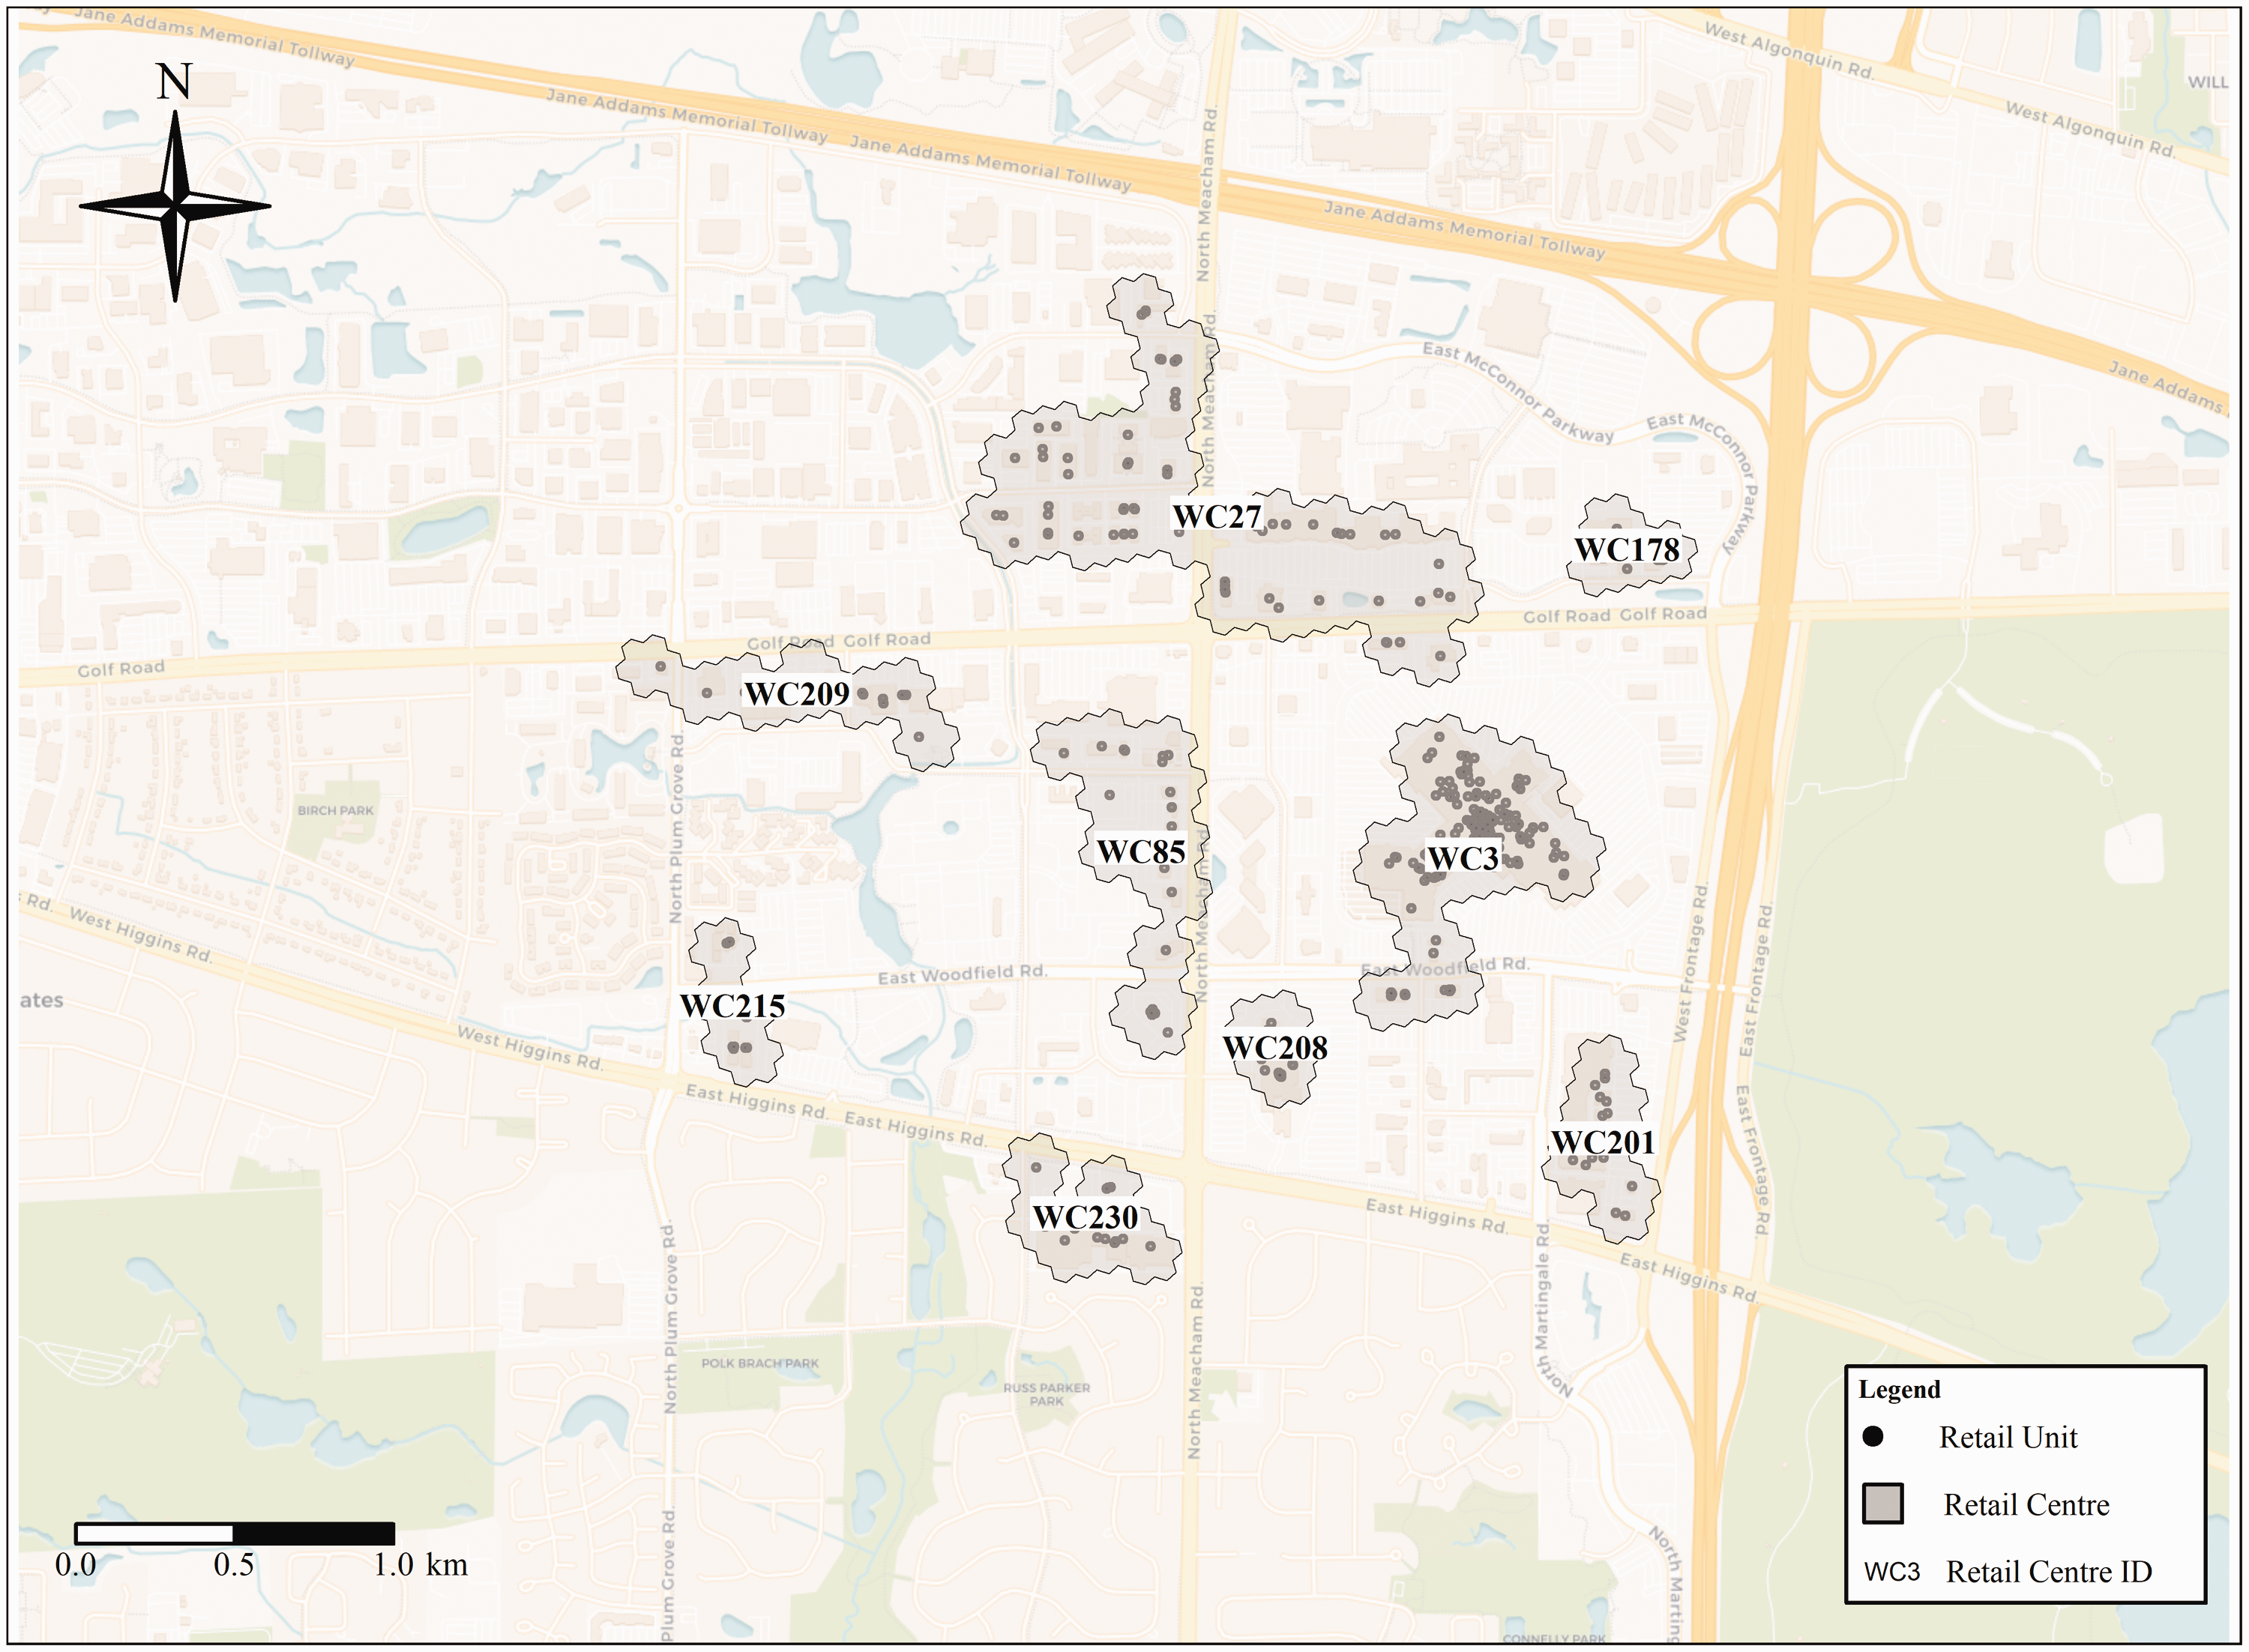
Delineated retail centres for Schaumburg Village.
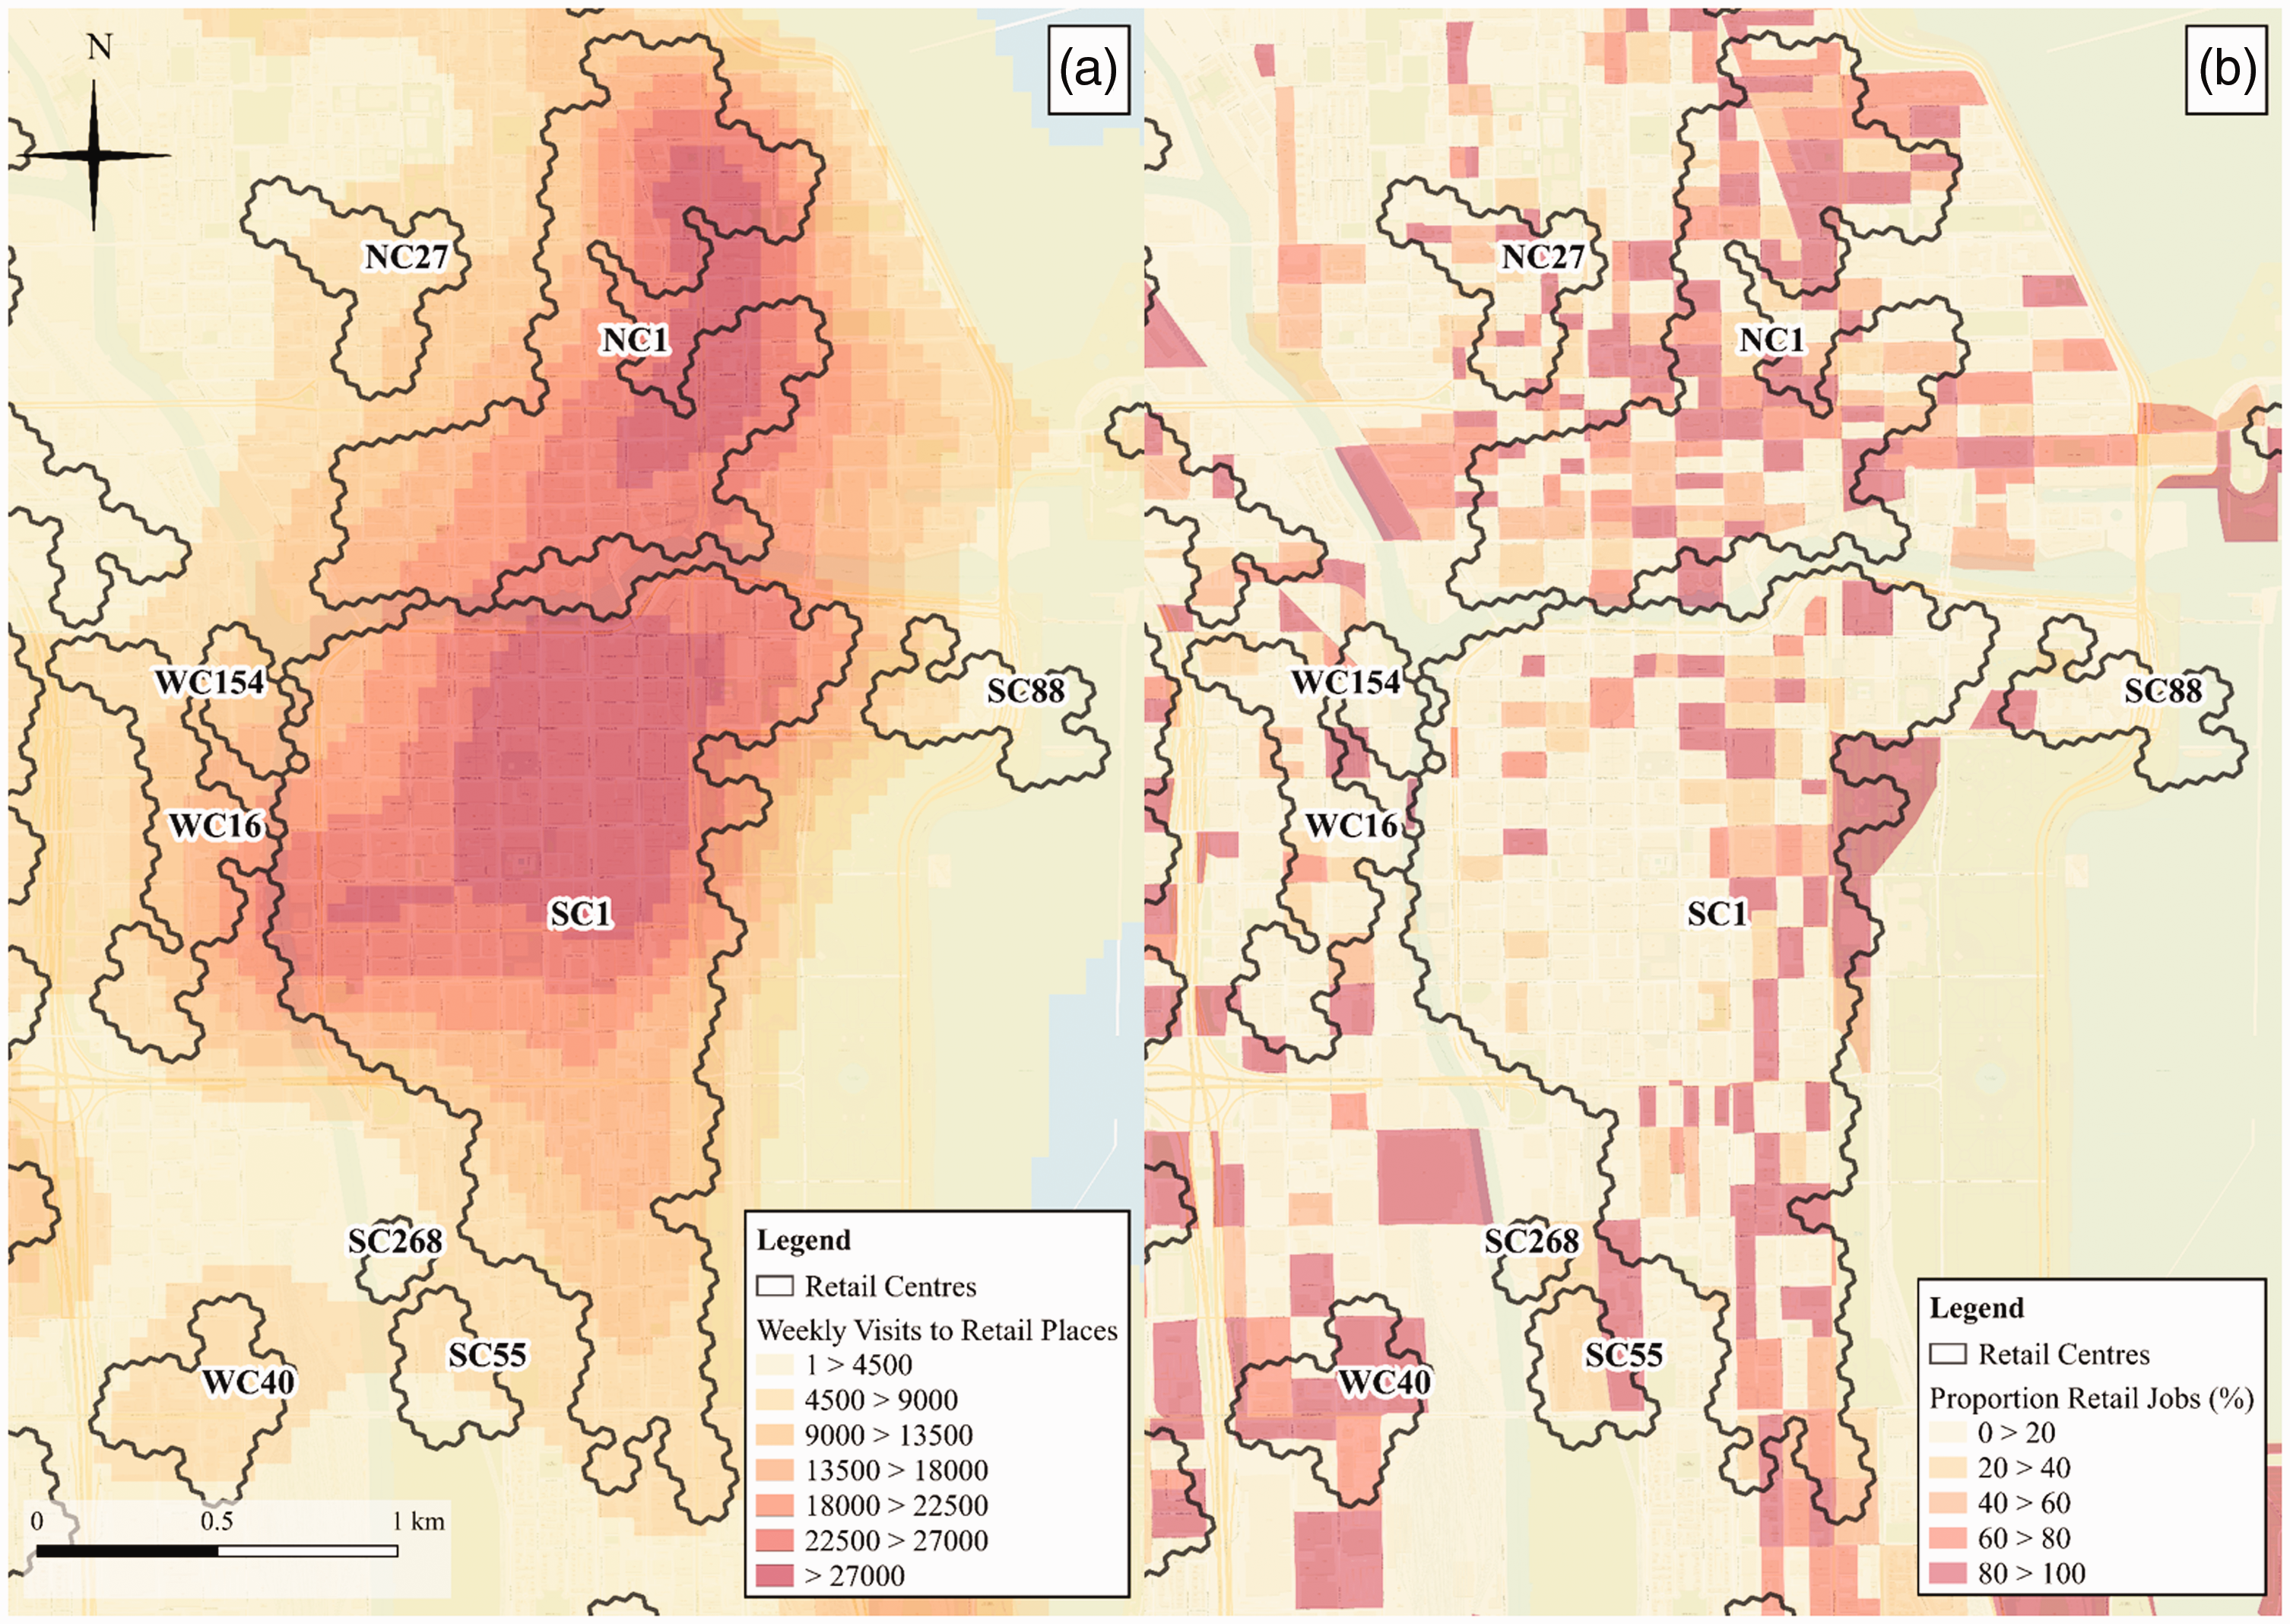
Validation of retail centre boundaries using SafeGraph ‘patterns’ (a) and data from the US Census Bureau (b).
To consider the validity of the retail centre boundaries, we compared them with two other spatial datasets on retail distribution – SafeGraph ‘patterns’ (SafeGraph Inc., 2020b) and employment data from the US Census Bureau (2018). In the example below for Chicago CBD (Figure 5), the centre boundaries seemed to align closely with the spatial ‘signature’ created by the ‘patterns’ data (5a) and encompassed the majority of census blocks identified as having a high proportion of retail employment (5b), with those not encompassed being sites of small retail centres (<10 units). Overall then, based on the authors’ collective understanding of the region and quantitative validation of the retail centres (Figure 5), this approach has arguably identified a set of retail centres that robustly summarise the structure of retail in metropolitan Chicago. Retail boundaries, especially in large urban areas, could be challenged based on the public perception; however, such an empirical delineation has clear advantages including the ability to updated over time, something not feasible with perceptions. Interestingly, the centres themselves vary in location, scale and extent; therefore, in order to derive a nuanced picture of their multidimensional characteristics and position within a system of (metropolitan) retail, we next explore these sites from a typological perspective.
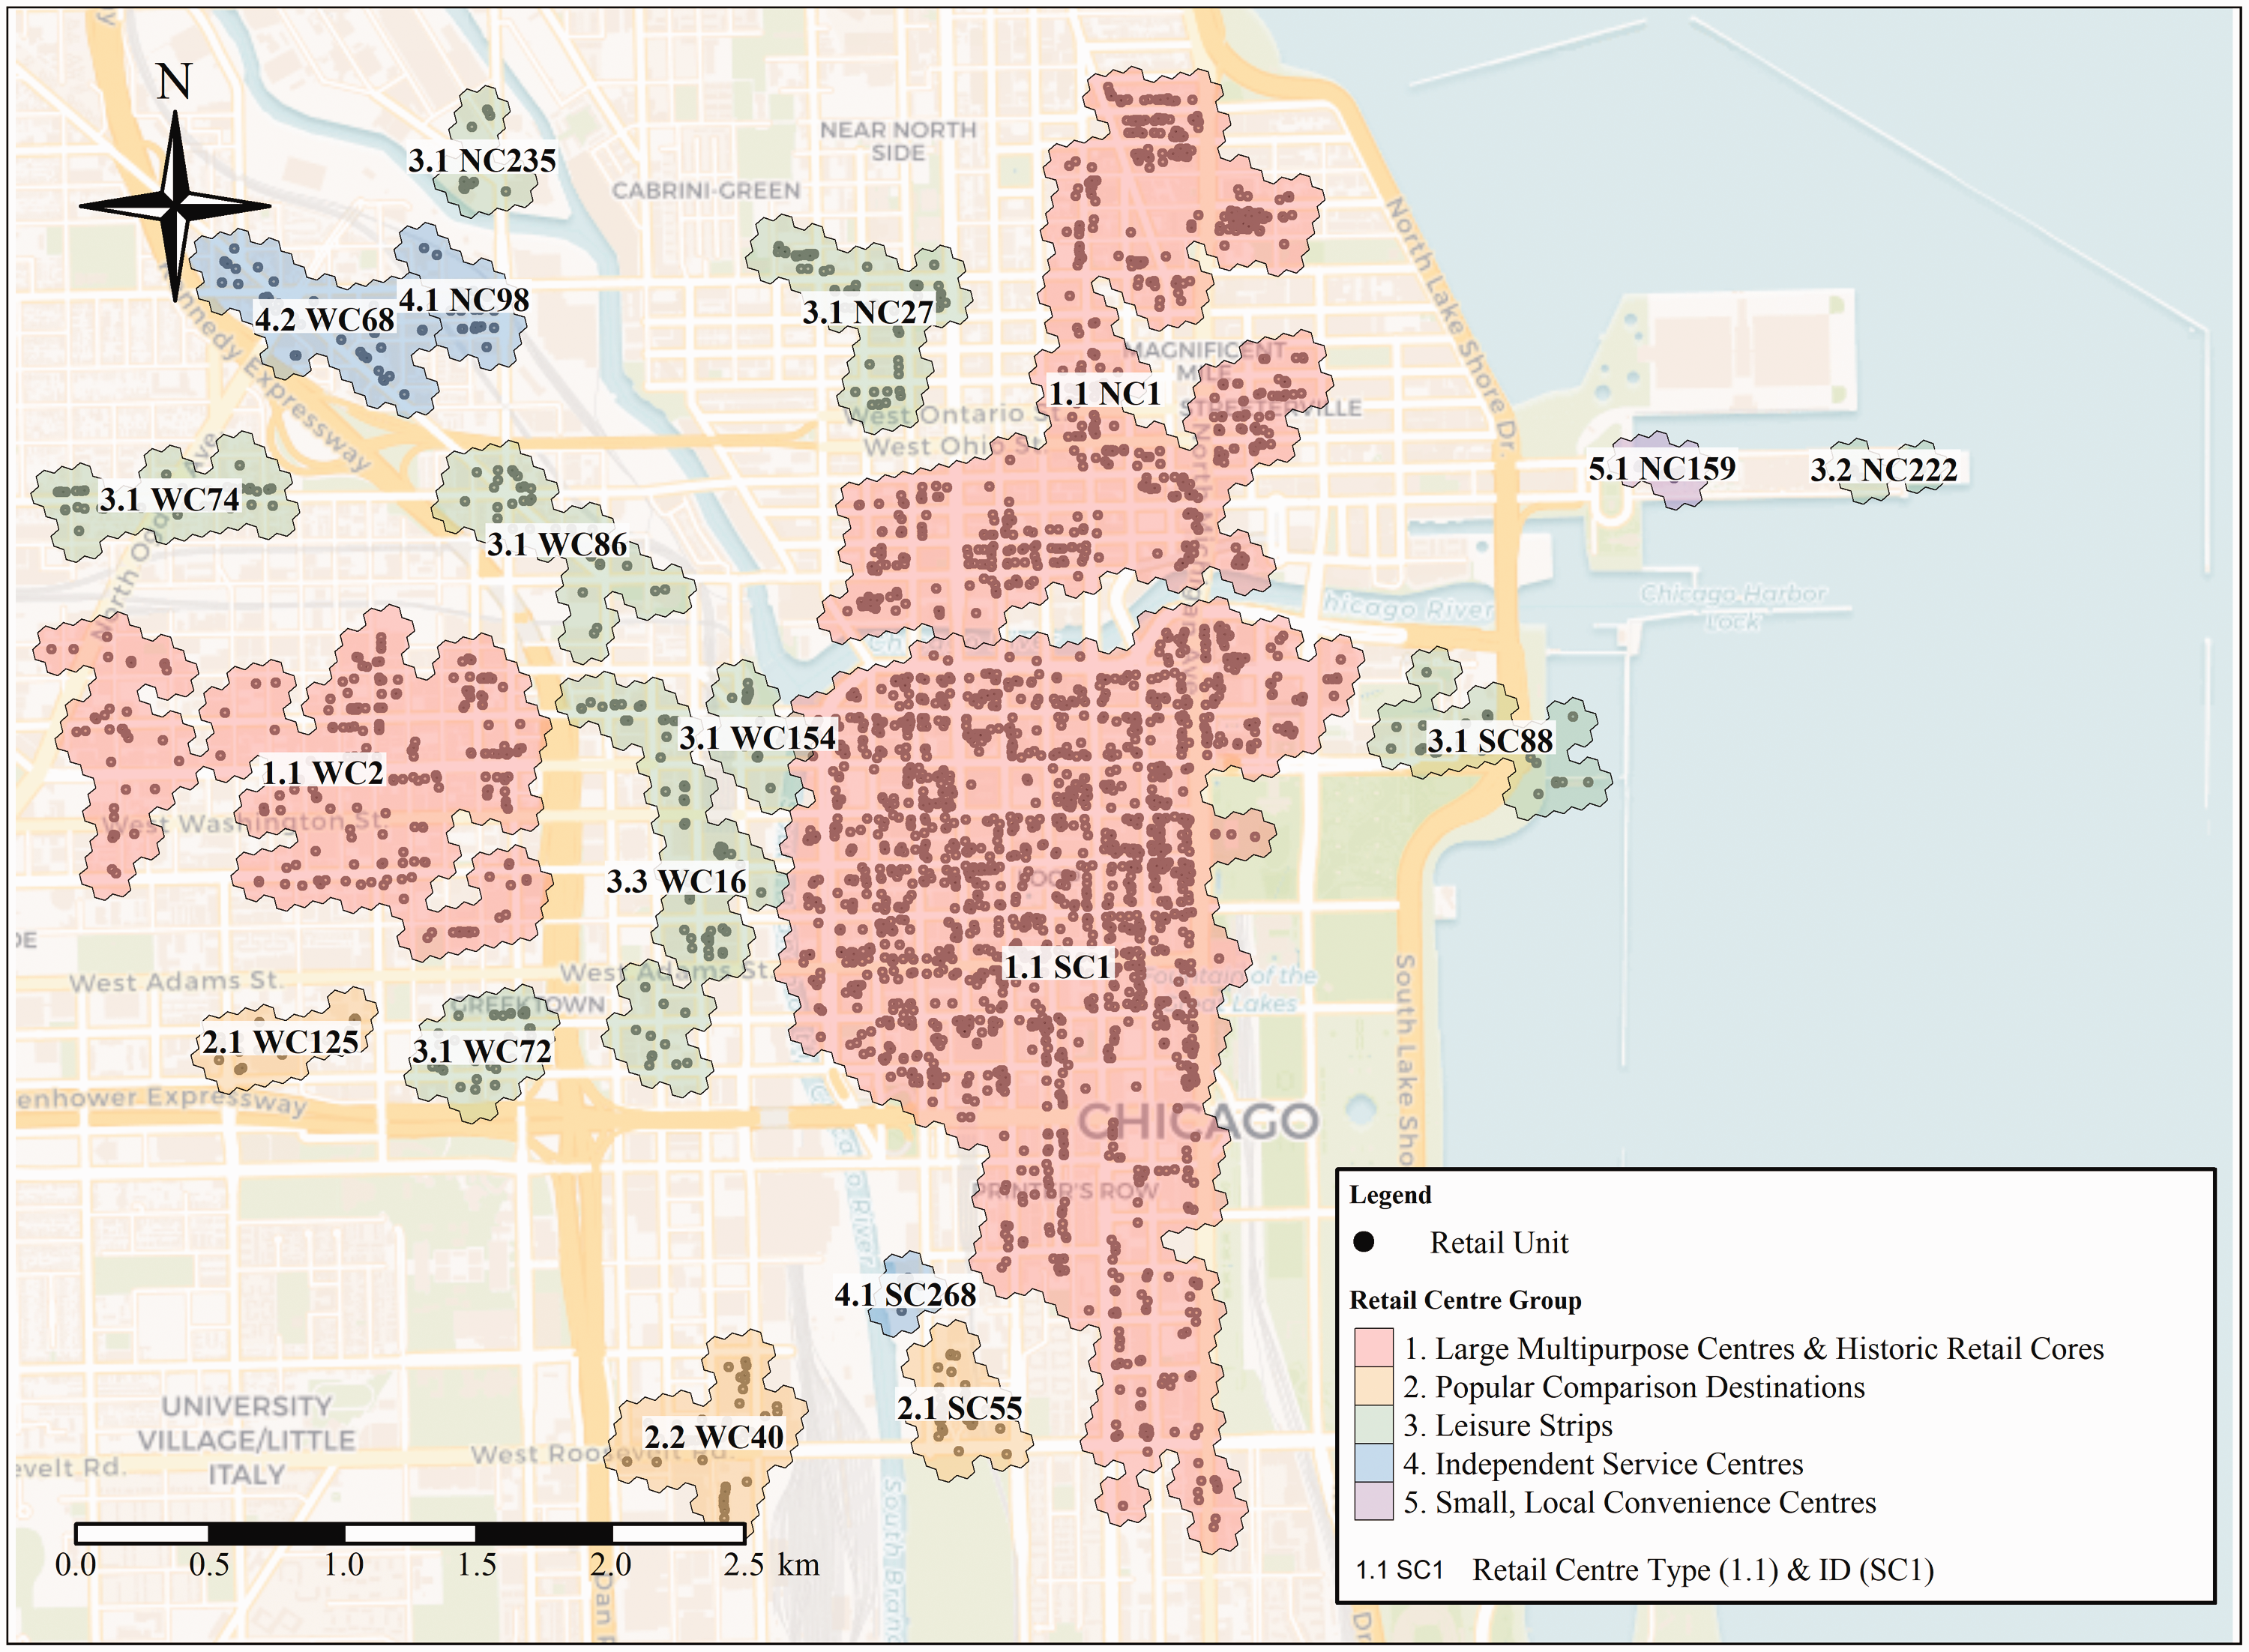
Delineated and classified retail centres in Chicago CBD.
A typological perspective on retail agglomeration within Chicago MSA
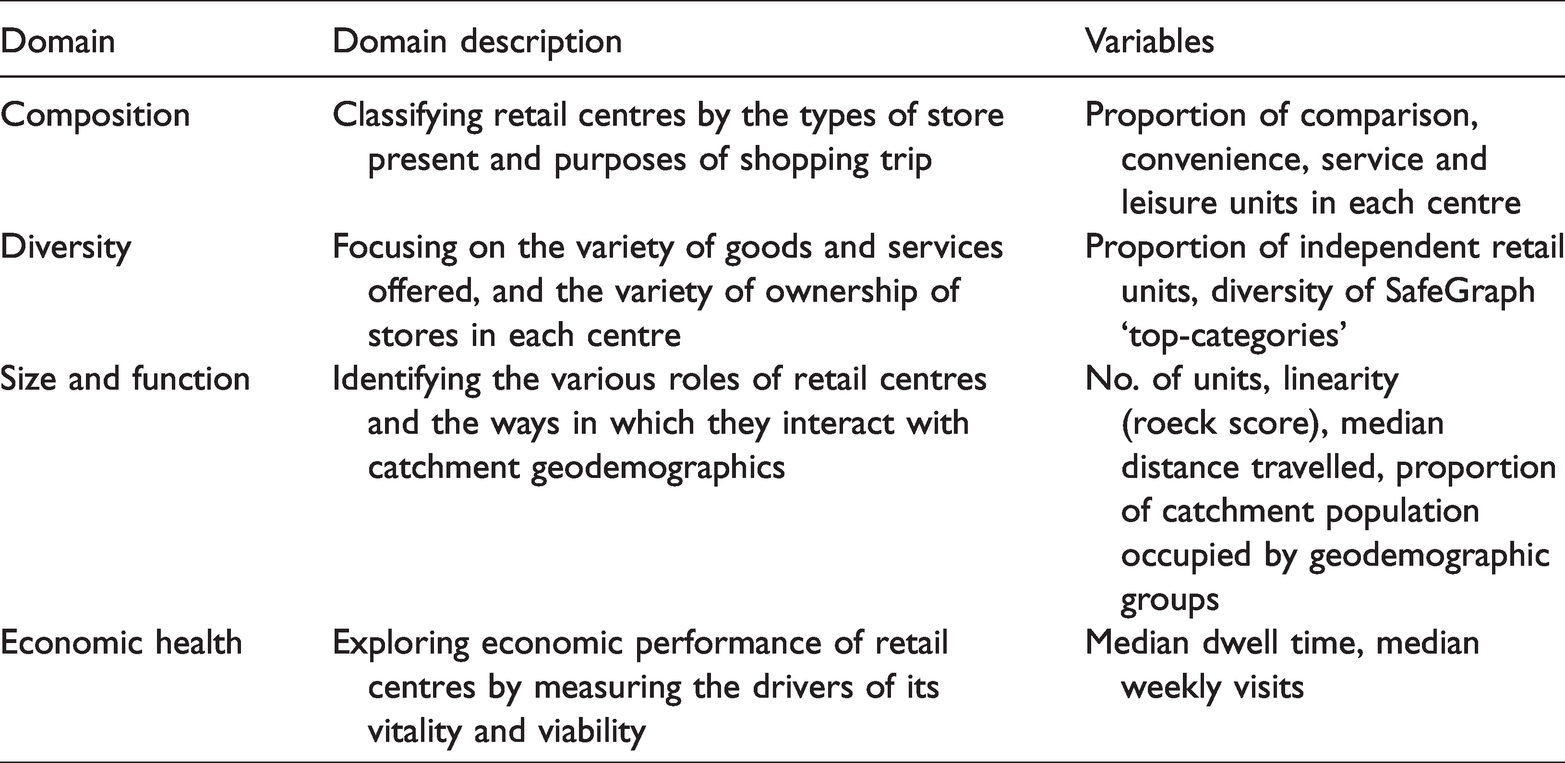
To develop a comprehensive classification for the retail centres, this study adopted the methodological framework developed by Dolega et al. (2019). Twenty-four variables were selected to align with those used for each domain in Dolega et al. (Table 1), with the vast majority derived from the retail locations themselves. However, in order to account for ‘economic health’, the ‘weekly patterns’ dataset was used (SafeGraph Inc., 2020b), with the variables (visits, dwell and distance travelled) used over vacancy rates and/or level of online exposure (as in Dolega et al., 2019), as the latter were not available. Prior to classification, Principal Component Analysis (PCA) was performed (Mumford et al., 2017), revealing significant variation in all variables, but four were removed due to issues with multicollinearity and a lack of coverage in Chicago. The remaining twenty variables can be seen below in Table 1, with more detail on each of the variables found in section C of the supplementary material.
The retail centre classification framework (Dolega et al., 2019) and variables used to implement the framework in this study.
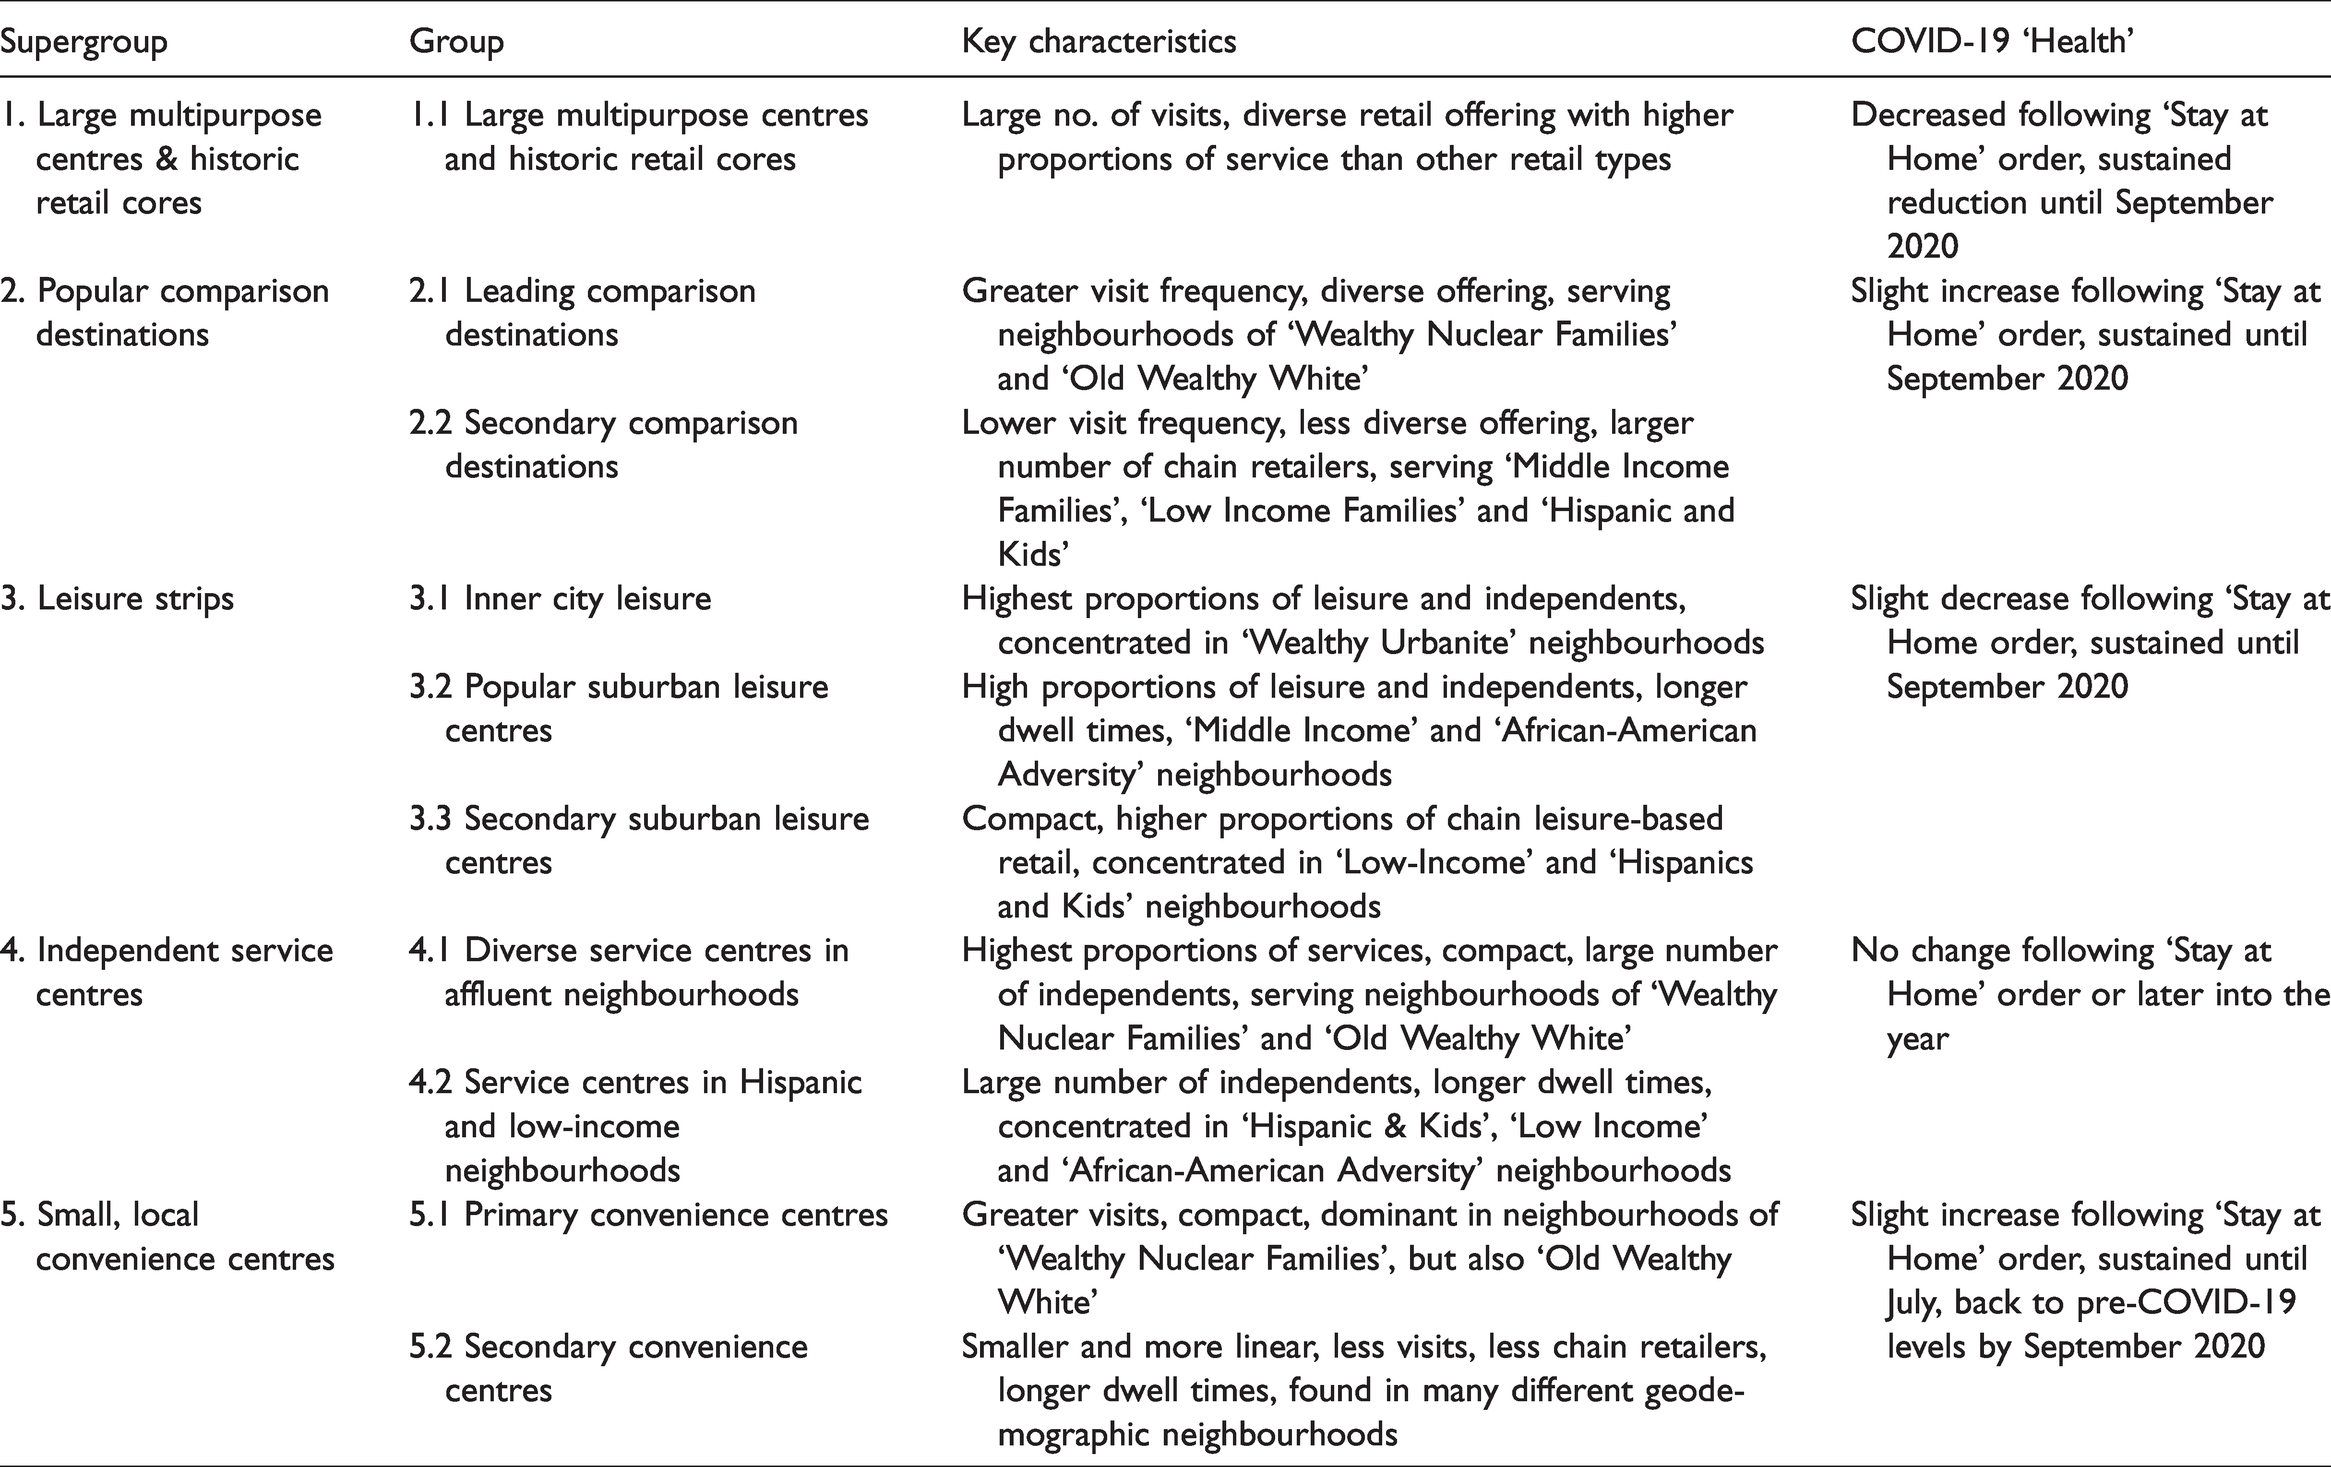
Before running the classification, the variables were standardised, and the optimal k value was determined using a clustergram in conjunction with average silhouette scores, to counteract any subjectivity in clustergram interpretation. The classification – using PAM – was performed twice, extracting a set of five retail centre ‘groups’ and ten nested ‘types’. The utility of this classification was enhanced by providing additional descriptive profiles highlighting their salient characteristics, summarised below in Table 2.
Salient characteristics of retail centre groups and nested types, including summary of their ‘health’ in response to the COVID-19 pandemic.
The geography of retail centre characteristics
The first group of centres typically existed at the ‘core’ of urban areas like Chicago and Elgin, and along established retail strips like Ogden Avenue. Inner city leisure (3.1) was concentrated in the CBD, whilst suburban leisure (groups 3.2 and 3.3) was more geographically dispersed. The distribution of comparison centres was also uneven, with the leading destinations (2.1) typically found in well-established retailing developments (e.g. ‘Fashion Outlets of Chicago’). As suggested by Casparis (1969), convenience and service retail (groups 4 and 5) was dispersed throughout the MSA, with secondary convenience (4.2) and service centres (5.2) concentrated in urban centres, whilst primary centres (4.1, 5.1) were found in suburban neighbourhoods.
In the case of Chicago CBD (Figure 6), it was unsurprising that both SC1 and NC1 were identified as being group 1 centres, given their status as major retail corridors (Credit, 2020; The Magnificent Mile Association, 2015). Furthermore, the density of leisure-based centres in the CBD was also expected, as a major 'hub' for bars and restaurants. Schaumburg Village had a notable concentration of primary comparison destinations (Figure 7), such as WC3 (Woodfield Mall), but also one secondary comparison centre (WC201) with a characteristically smaller and homogenous comparison offering. The overall dominance of comparison and service centres in Schaumburg is arguably unsurprising, as these sectors provide a significant majority of local employment (McMillen, 2003). Thus, as demonstrated here, this approach to retail classification arguably provides an accurate and robust representation of the structure of retail across Chicago MSA.
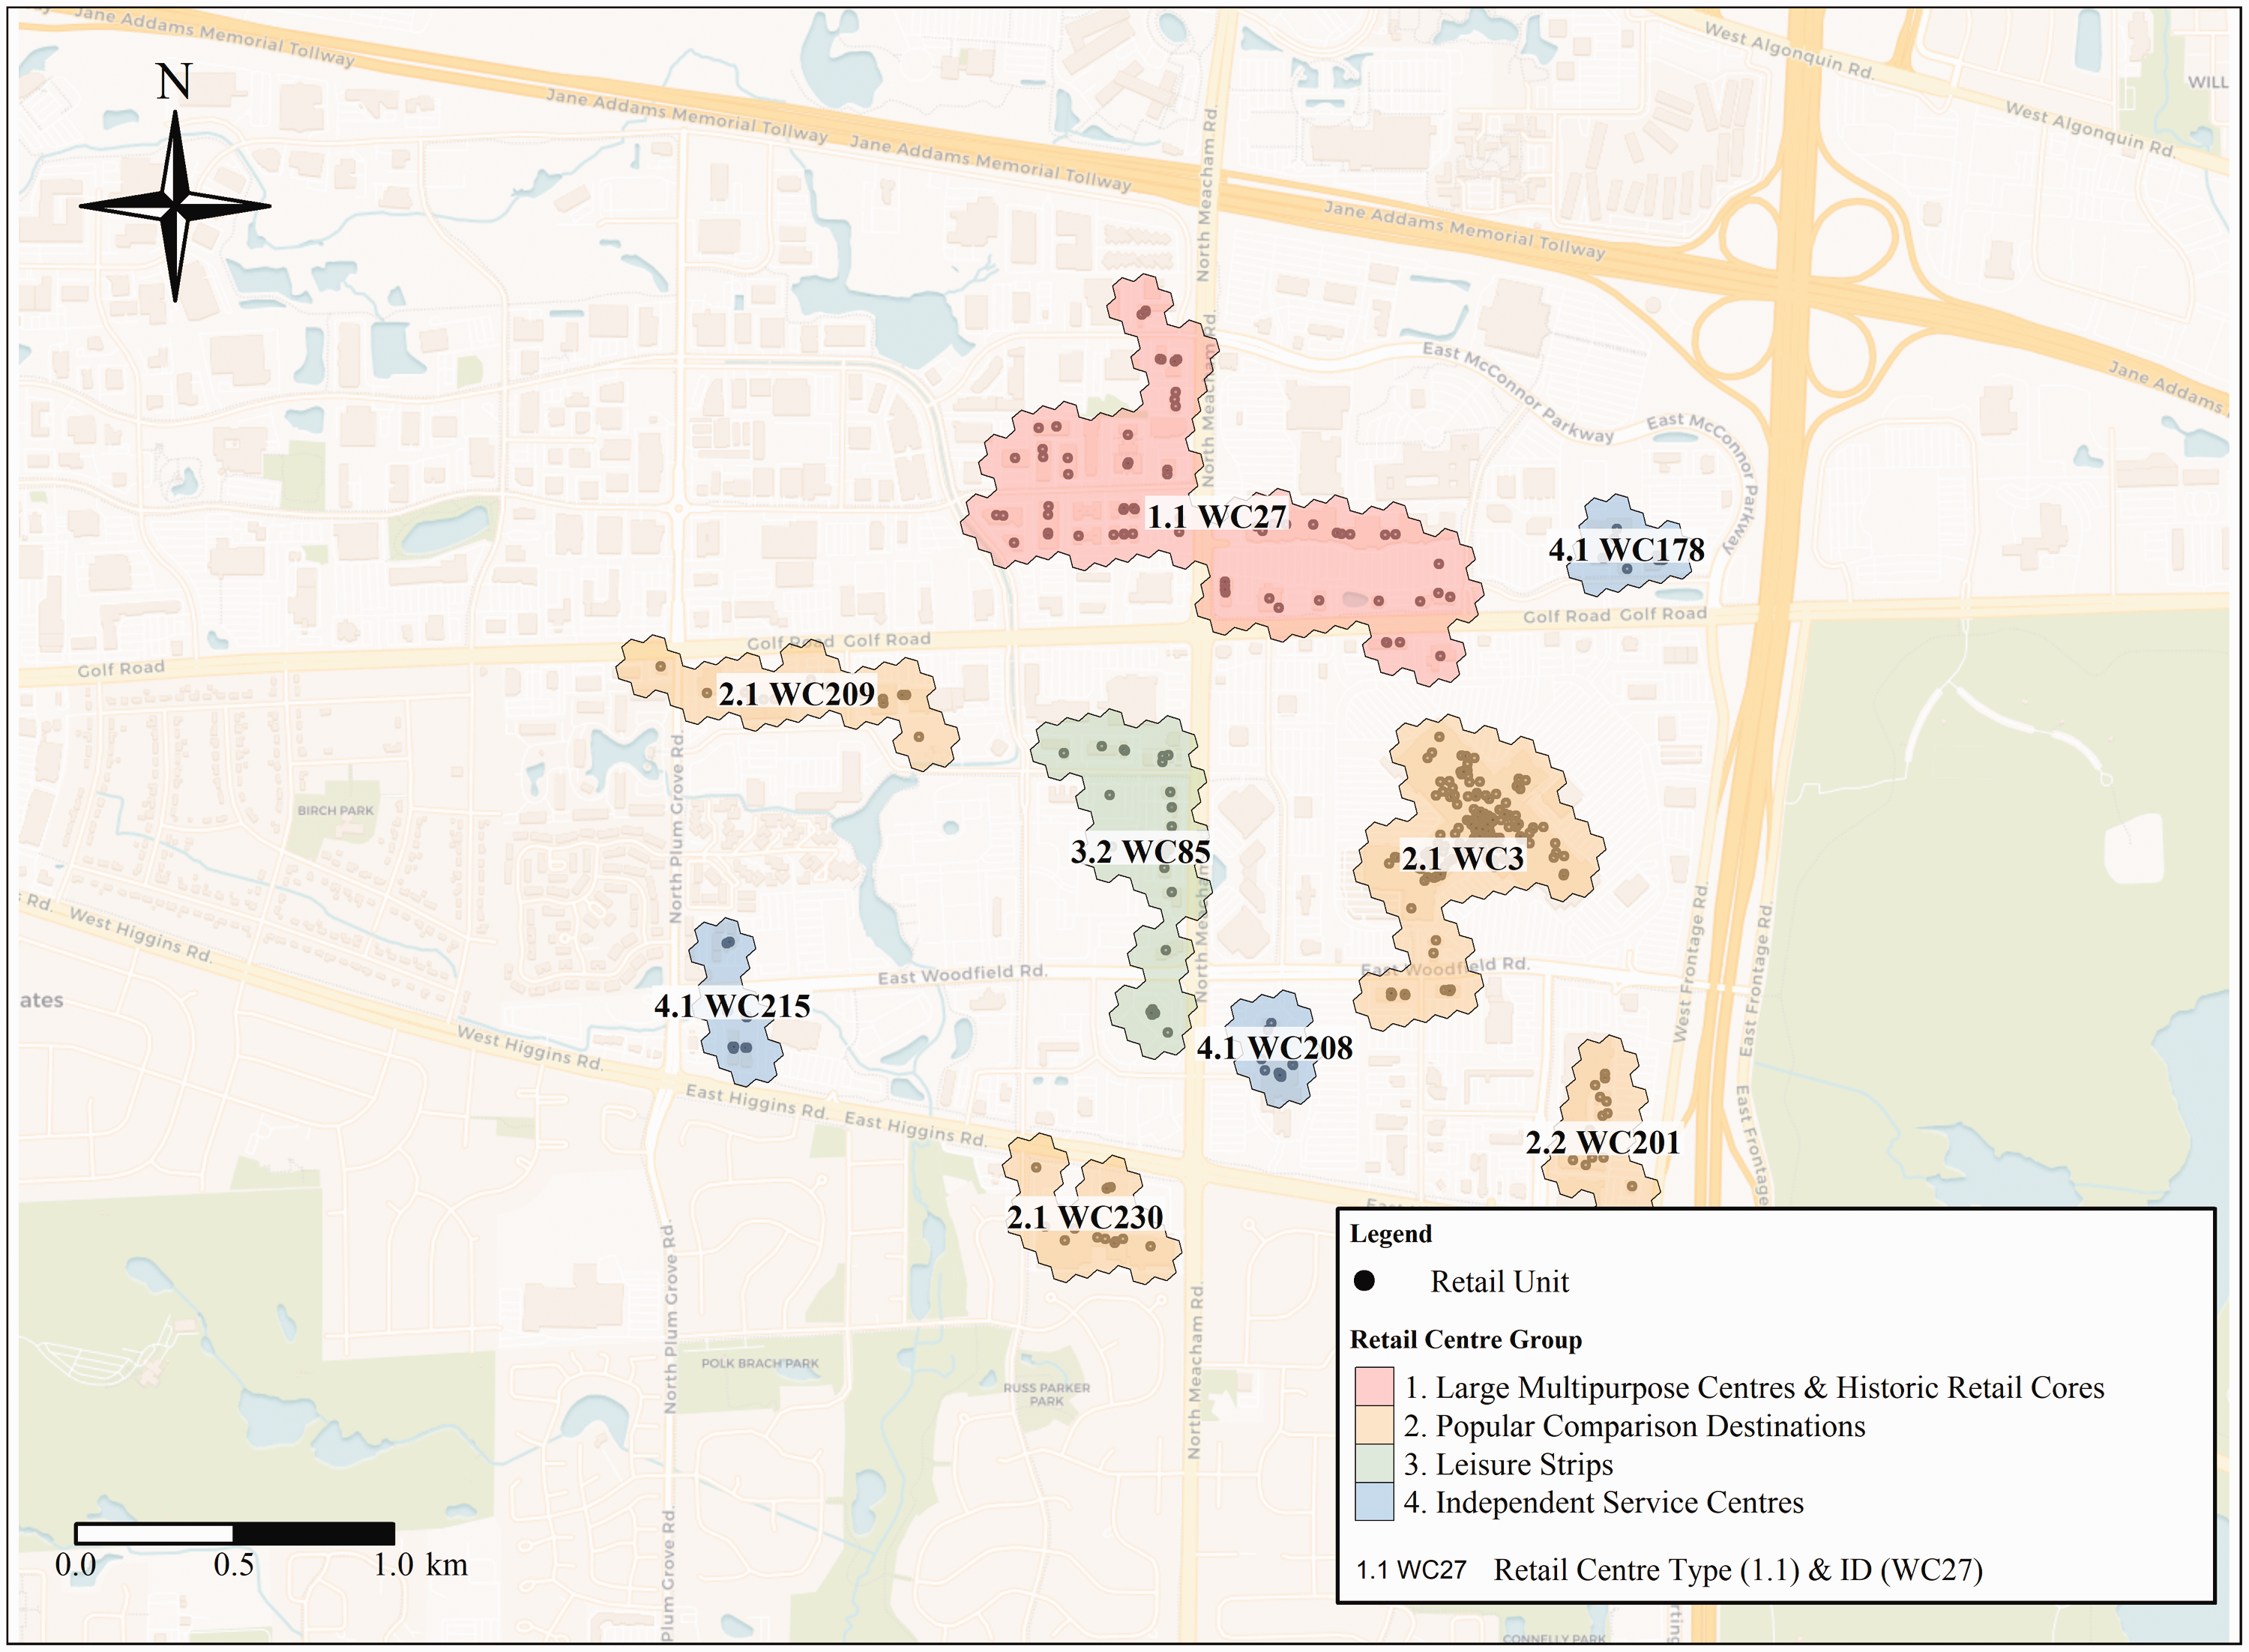
Delineated and classified retail centres in Schaumburg Village.
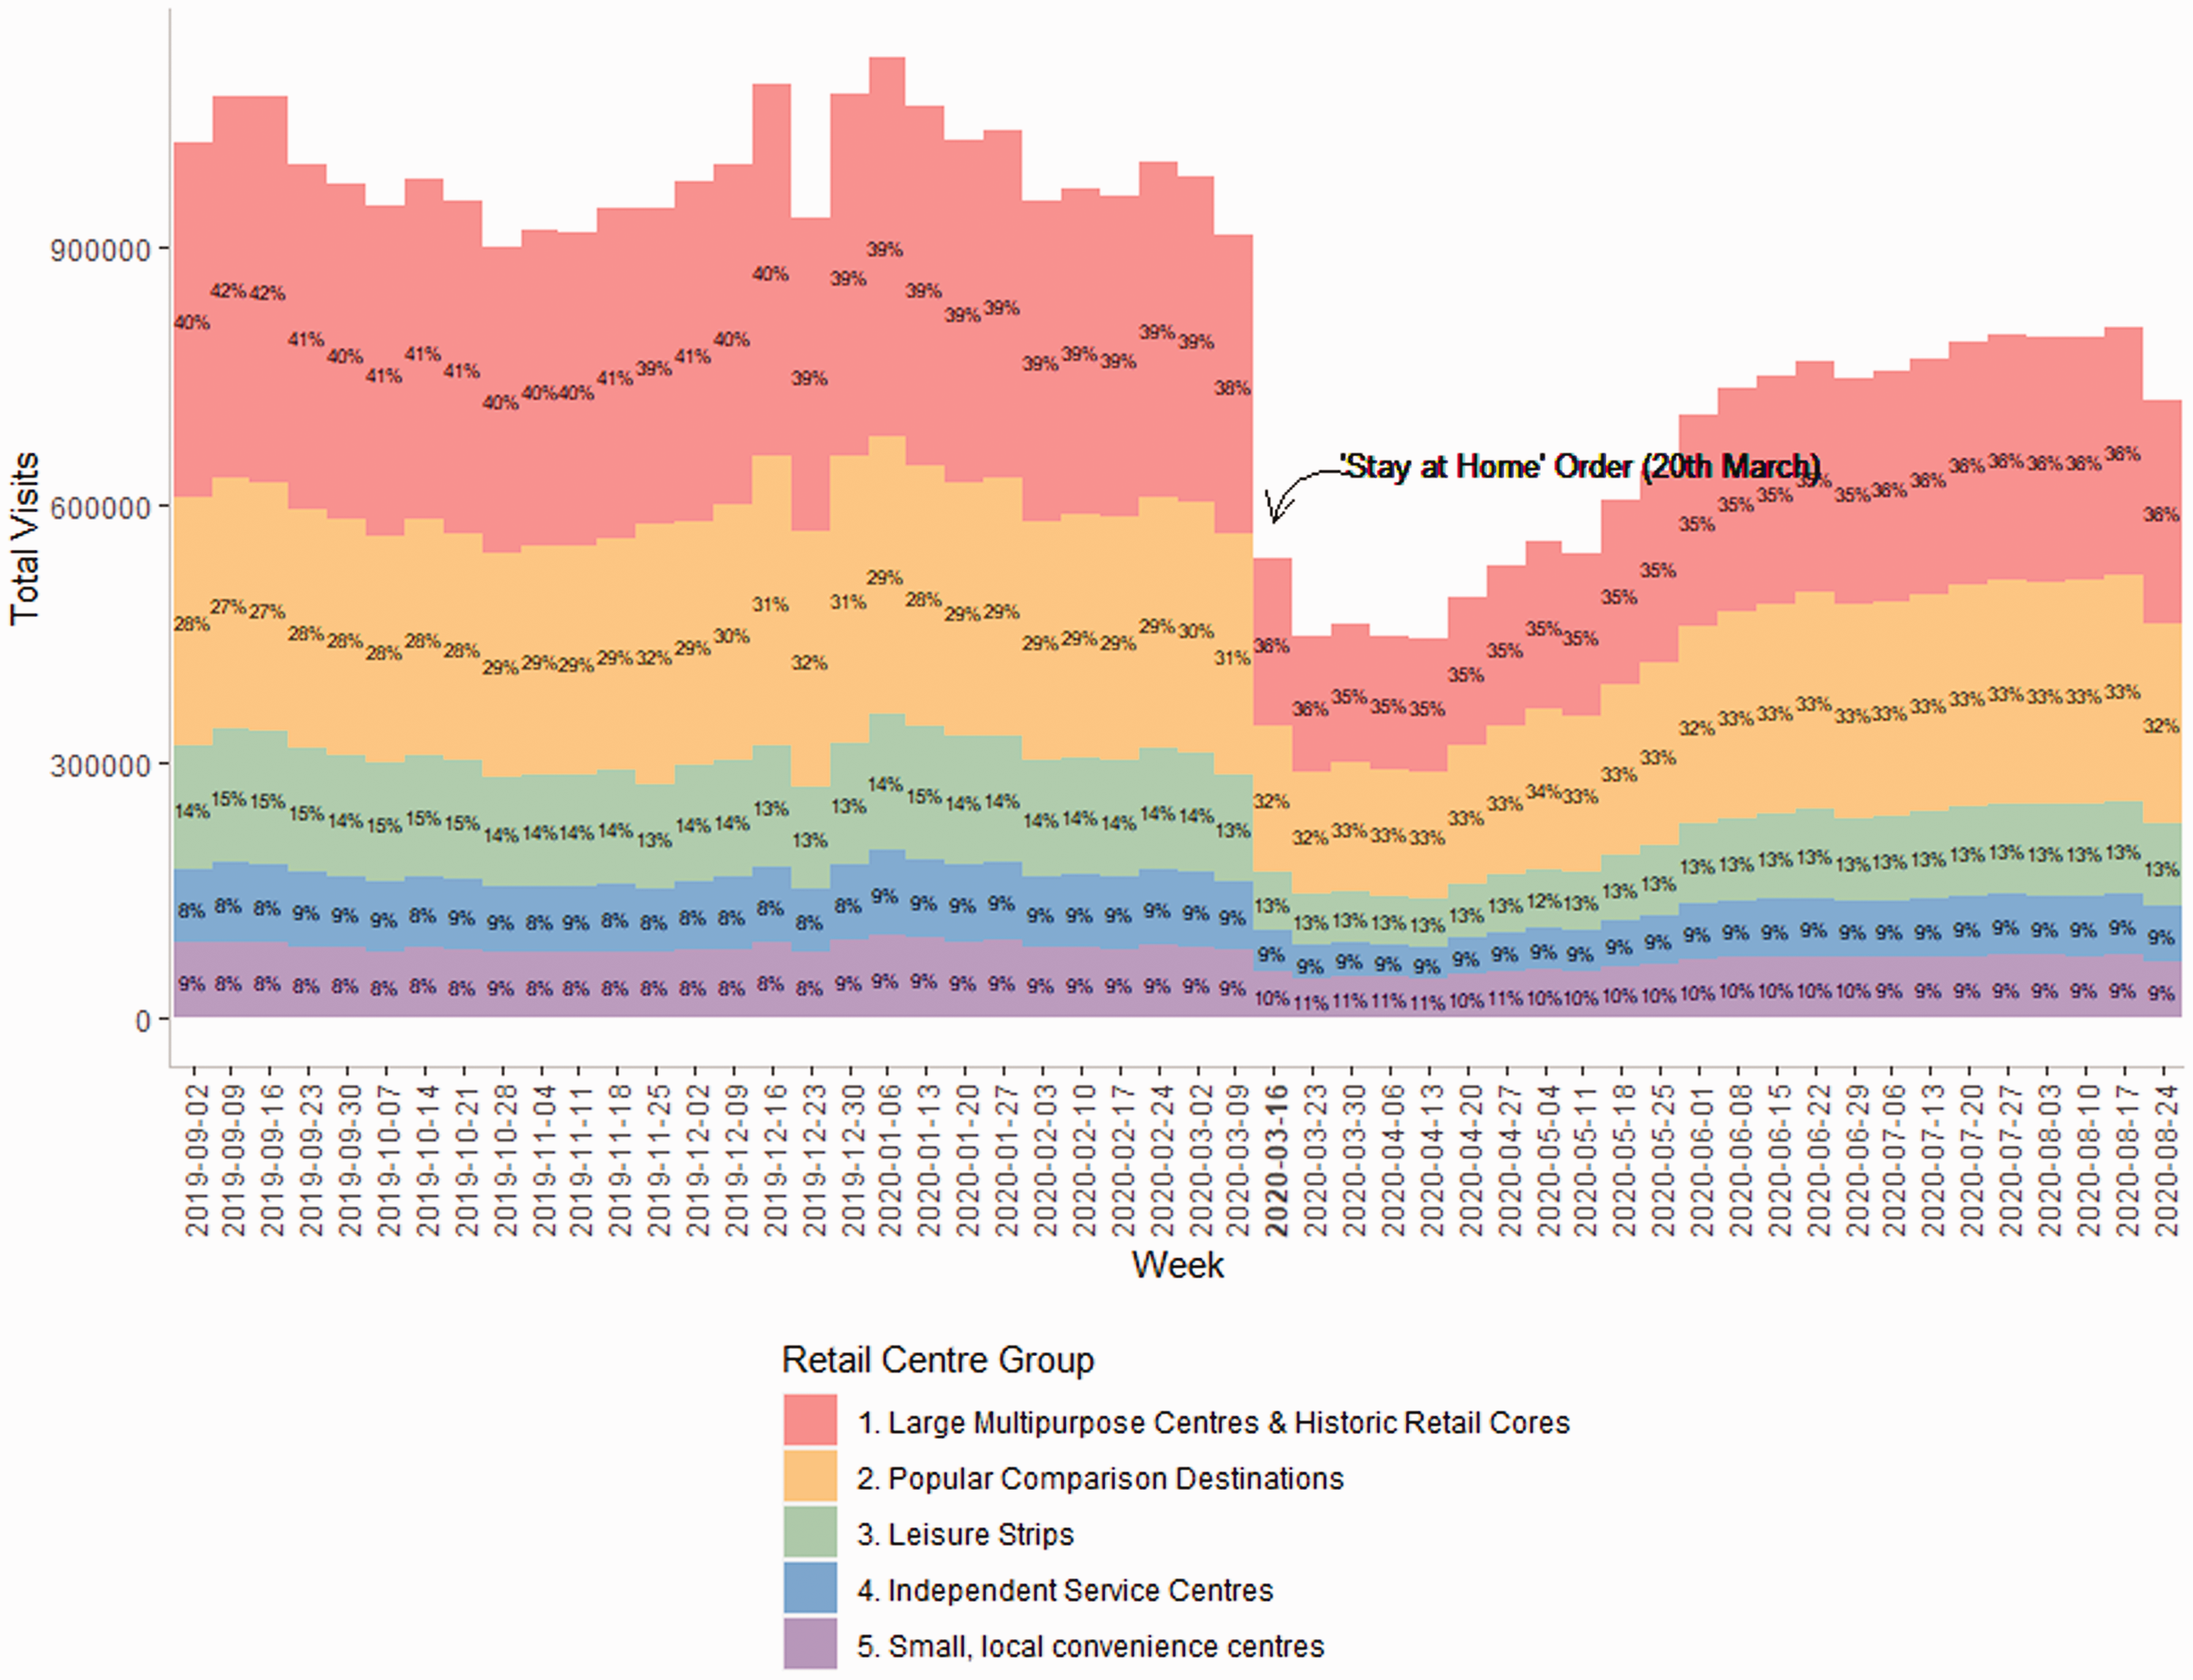
Change in total retail centre visits over the 12-month period, disaggregated by retail centre group to illustrate change in share (%).
COVID-19: Demonstrating the utility of retail centres
A plethora of studies have used retail centre definitions and their typologies to understand wider retail sector processes (e.g. Lloyd and Cheshire, 2017; Singleton et al., 2016), but with the exception of AbedRabbo et al. (2021), their application to understanding the COVID-19 pandemic has been limited. It has been widely documented that the pandemic has exacerbated sector challenges through enforced restrictions on retailers (e.g. ‘Stay at Home’ orders). Interestingly, however, some retailers have faced greater challenges than others (Nicola et al., 2020), creating indirect disparities in the ‘economic health’ of traditional retail agglomerations, a trend that has not yet been quantified. In this final section, adopting an exploratory approach, we demonstrate an immediate use-case for the centres (and typology) delineated in this study, to explore changes in visits to centres, as a proxy indicator of their ‘health’ (Bonaccorsi et al., 2020). Using the SafeGraph ‘weekly patterns’ dataset (supplementary material section A), we quantify disparities in the effects of COVID-19 on the ‘health’ of different structures and functions of retail in Chicago, through exploration of visits to the retail centres over a 12-month period, contributing to existing literature utilising similar mobility datasets (Bonaccorsi et al., 2020; Gao et al., 2020).
Retail centre dynamics and COVID-19
In general, the retail sector saw significant decreases in overall ‘health’ (Figure 8) coinciding with the ‘Stay at Home’ order (Pritzker, 2020), contracting in total visits by one-third in one week, and remaining suppressed until the end of April. Following Pritzker’s announcement, many retail centre groups saw decreased visit share, most notably the first group of centres, where share was down 2% (Figure 8). In contrast, the ‘small, local convenience centres’ saw increases in share that were sustained throughout April and May. This trend suggests a general shift from large city centre agglomerations towards the smaller, more local ones, typically offering greater proportions of ‘essential goods’ and performing better in terms of ‘economic health’ (Roggeveen and Sethuraman, 2020). What is surprising is that comparison centres did not seem to exhibit any notable decreases in ‘health’, despite documented declining popularity in ‘non-essential’ goods (Roggeveen and Sethuraman, 2020).
In the longer term, visits to retail centres remained suppressed, with interesting implications for the long-term ‘economic health’ of centres. Visit share around group four and five centres appeared to be returning to pre-COVID-19 levels, but group one centres continued to occupy a 4–5% reduction on average in visits, suggesting consumers continued to visit ‘primary comparison destinations’ over the more ‘traditional’ shopping locations. This is interesting and could contribute to speculation that traditional high streets are facing accelerated decline as a result of the pandemic, therefore potentially becoming no longer ‘fit for purpose’ as retail distribution networks. Whilst acknowledging the complexity of these processes, and the need for advanced modelling techniques to better quantify them, we argue that this approach and its findings are timely and significant. The insights generated into the apparent impacts of COVID-19 on the ‘economic health’ of different retail structures/functions in Chicago are useful and novel. Furthermore, we also demonstrate the utility of the retail centre framework proposed in this paper, by using it to contribute to a growing evidence base in a rapidly emerging field of research in retail – COVID-19.
Discussion and conclusions
Here, we have enhanced and extended, to an American setting, a data-driven framework for the derivation of retail centre agglomerations, specifically for the Chicago Metropolitan Area. Using data from SafeGraph, retail centres were delineated through integration of HDBSCAN and ‘H3’, and the functional ecologies of the 1,599 retail centres were presented as a ‘two-tier’ classification, constructed using the PAM algorithm. Finally, we demonstrate an immediate use-case for the framework and its outputs (retail centres), in providing insights as to the role of the COVID-19 pandemic on the ‘health’ of different structures and functions of retail.
Methodologically, this paper has demonstrated the effectiveness of HDBSCAN as a simpler and faster alternative to the modified-DBSCAN approach used in Pavlis et al. (2018). This arguably makes future delineations within other international settings more feasible; however, there are scalability concerns when accounting for street networks. The classification framework used here is also of significance, demonstrating its first international application since its conception (Dolega et al., 2019). Using variables deemed fundamental to understanding the contemporary retail landscape, and classification based on similarity and salient characteristics, we have provided a more representative insight into the spatiality of retailing (Dolega et al., 2019; Guy, 1998) than has been produced by other hierarchical or non-hierarchical classifications, both in and out of Chicago (Brown, 1992; Coca-Stefaniak, 2013).
Comprehensive retail centre definitions such as this have significant implications, contributing valuable insights into the interplay between external pressures and physical retail space, through indirect assessment of their evolutionary trajectories. Such insights can also contribute to the academic rigour on ‘E-commerce’ in the US (Grewal et al., 2017), for example through a greater understanding of the geographies of internet usage, a direct quantification of the ‘resilience’ of American retail centres to ‘E-commerce’ could be constructed (as in Singleton et al., 2016). Most interestingly, however, is the evident need for additional research to unpack the complex relationship between the retail sector and the COVID-19 pandemic, utilising this framework and its outputs to provide a stronger understanding of the wider retail sector response, not just specific store types. In particular, we believe there is significant potential in the modelling of various retail centre attributes (e.g. diversity, catchment geodemographics) in relation to ‘economic health’, as defined by metrics (e.g. Comber et al., 2020) rather than proxy indicators, to better comprehend the role of COVID-19 on the evolving American retail landscape. It is however apparent, that in order to achieve such insights, there must first be an understanding of where these retail agglomerations are, what characteristics they have and who is using them.
On this basis, we propose that there is significant scope for a delineation of the spatial extent and characteristics of retail centre agglomerations for the national extent of the US. Future research is needed to ensure a computationally more scalable approach to retail centre delineation, that is not limited to metropolitan areas. It is our view that such an increase in scale would also enhance the resolution of an American retail centre typology, through greater abundance and variance in centres (and characteristics) and incorporation of specific niches in American retail and urban morphology. It is also important to acknowledge that the approach and outputs are heavily influenced by the input retailer location data. However, we have argued, the SafeGraph ‘core places’ provides the most comprehensive, up-to-date and openly-accessible register of businesses in the US, and as such has significant potential in a proposed geographical expansion of this research. Such an expansion, utilising the framework and dataset posited here, would generate substantive insights into the spatiality of local, regional and national retail provision, whilst also providing a set of tools through which we can understand how retail provision continues to transform. Looking forward, this will be essential as American retail continues to traverse the COVID-19 pandemic and ‘retail apocalypse’.
Supplemental Material
sj-pdf-1-epb-10.1177_23998083211040519 - Supplemental material for A framework for delineating the scale, extent and characteristics of American retail centre agglomerations
Supplemental material, sj-pdf-1-epb-10.1177_23998083211040519 for A framework for delineating the scale, extent and characteristics of American retail centre agglomerations by Patrick Ballantyne, Alex Singleton, Les Dolega and Kevin Credit in EPB: Urban Analytics and City Science
Footnotes
Acknowledgements
The authors would like to thank SafeGraph Inc. for permitting access to various SafeGraph datasets (‘core places’, ‘weekly patterns’). Thank you also to Alessia Calafiore and Jacob Macdonald for their assistance and advice with the Open Source Routing Machine and H3 spatial indexing system, respectively.
Declaration of conflicting interests
The author(s) declared no potential conflicts of interest with respect to the research, authorship, and/or publication of this article.
Fundin
This paper is part of a PhD project funded by the Economic and Social Research Council (ESRC) and Geolytix, through the Centre for Doctoral Training.
Supplemental material
Supplemental material for this article is available online.
References
Supplementary Material
Please find the following supplemental material available below.
For Open Access articles published under a Creative Commons License, all supplemental material carries the same license as the article it is associated with.
For non-Open Access articles published, all supplemental material carries a non-exclusive license, and permission requests for re-use of supplemental material or any part of supplemental material shall be sent directly to the copyright owner as specified in the copyright notice associated with the article.