
Abstract
The COVID-19 pandemic has boosted public and scholarly debate about the relationship between infectious disease and the urban. Cities are considered contagious because they are hubs in (inter)national networks and contain high densities of people. However, the role of the urban and population density in the spread of pathogens is complex and is mediated by the wider bio-social environment. This paper analyses the role of population density in the outbreak of COVID-19 in the densely and highly urbanised context of the Netherlands. It compares the geography of the different phases in the epidemic and assesses when and where density plays a role. Using municipal data on the rate of infections and hospitalisations, this paper reveals that spatial patterns differ substantially in time, which does not appear to be simple diffusion. Using panel regressions, it is demonstrated that population density plays a role in those stages in which containment and mitigation measures were least strict, while in periods of lockdown other factors such as household size are associated with higher infection rates. It concludes that lockdowns may have greater effect in urban areas as key urban elements are temporarily cancelled out.
Introduction
Although the exact origins of SARS-CoV-2, causing the new respiratory disease COVID-19, are still unclear, the first official reports came from the metropole of Wuhan in Hubei Province, China. Shortly after its emergence in Wuhan, cases of COVID-19 were reported across the world. The emerging geography of the outbreak exposed the deeply interconnected, indeed global, world we live in. As Ali and Keil (2008) put it, infectious diseases are ‘networked’. They diffuse through networks of people, animals and goods. Global cities in particular are key nodes in such networks, connecting the bodies of people at different spatial scales. Scholars have suggested that globalisation may lead to a ‘single global disease ecology’ (Ali and Keil, 2008; Barrett et al., 1998). At the same time, the analysis of the geographical diffusion of an epidemic also reveals the highly localised nature of infectious diseases. Pathogens multiply in human and animal bodies, originating somewhere, and can be transferred via materials, water, and air, proliferating and spreading to other places (Haggett, 2000). This is what can be understood as the urban–global dialectic (Ali and Keil, 2008). Cities are often portrayed as ‘contagious’ (Ali and Keil, 2007) in two ways: they are hubs in the spread of disease between places due to their connectedness; and because diffusion is considered likelier within cities. The latter stems from the fact that human pathogens need sufficient (human) hosts to survive by maintaining cycles of infection and proliferation. It is therefore generally accepted that population density is a key factor for the emergence and the spread of infectious diseases (Ali and Keil, 2007). Larger urban centres are characterised by high densities of people and crowding, increasing the likelihood of the outbreak and rapid proliferation of diseases. Historically, dense human settlements have served as the birthplace of new viruses, pathogenic bacteria, and parasites, often of animal origin (zoonosis) (McNeil, 1976). Furthermore, contemporary scholarship of urban political ecologies suggests a clear link between different processes of (extended) urbanisation and a higher risk of infectious disease (Connolly et al., 2021). The encroachment of ‘the urban’ into ‘nature’, for instance, is believed to increase the risk of new zoonotic viruses or bacteria (Connolly et al., 2021). There are also numerous studies that point to the specific role of population density rather than population growth in the spread of infectious diseases (Alirol et al., 2011; Teller, 2021). Intensive forms of urbanisation (increasing density) are therefore also associated with infectious disease (Kendall et al., 1991; McMichael, 2001). As scholars of density have argued, however, density comes in many spatial forms (Keil, 2021; McFarlane, 2016, 2021). Population density averages of a city can only tell us so much about the risk of transmission of infectious diseases. There are multiple spatialities of density (McFarlane, 2016), which play or may play different roles in the diffusion of pathogens. It is increasingly clear that connectivities, that is, the scope and density of networks, rather than population density per se, might be more important for the emergence and more specifically the spread of viruses like SARS-CoV-2. Also, crowding is not the same as population density and may play a more important role than mere densities (Almagro and Orane-Hutchinson, 2020). In fact what matters is the opportunities for transmission, which may be enhanced by closeness of people, but also depends on a range of other factors. The role of the urban in the spread of infectious diseases is therefore not straightforward or mediated by characteristics of the pathogen itself and its wider environmental, social, and political context. Public health response, socio-economic conditions, specific demographies, and social hygiene are also key factors that shape the development of outbreaks (Kawlra and Sakamoto, 2021).
This paper aims to contribute to the ongoing debate about the role of the urban in general, and more specifically population density, in the diffusion of infectious disease by presenting a study of the geography of the COVID-19 epidemic in the Netherlands. The Netherlands is an interesting case to study urban characteristics and density due to the very high urbanisation rate and dense network of interconnected medium sized cities. Previous studies revealed that the role of population density was limited in the first wave (Boterman, 2020) but projected a faster development in cities in later stages of the pandemic. By analysing the development of the number of infections of SARS-CoV-2 and the hospitalisation rate related to COVID-19 over the period from March 2020 to June 2021, this paper assesses the role of population density in different stages of the epidemic. The outline of this paper is as follows: first, I briefly sketch the demographics of the epidemiology of COVID-19 and I review the existing evidence on the geography of COVID-19. I then present the policy responses and mitigation strategies first more generally and then more specifically in the Netherlands. Subsequently, I describe the geography of COVID-19 in the Netherlands in maps. After this I introduce the data and the methods of the paper. The analysis section discusses three models, which aim to estimate the effect of urban density on the spread of the virus. I conclude by showing the important differences and continuities in the factors associated with high municipal infection rates across the country during different regimes of national mitigation policies.
Epidemiology of COVID-19
The pace of transmission of infectious diseases depends on a range of parameters, among which the level of infectiousness, incubation period, fatality rate, and mode of transmission are key factors. The original variant of the Corona virus, SARS-CoV-2, has an estimated infection to fatality ratio (IFR) of 0.5–1% (WHO, 2020); an incubation time of 4–10 days and a reproduction number of 2.5, which is higher than regular influenza (Petersen et al., 2020). Mutations have created new variants 1 that were even more transmissible, which affected the pace of the spread. The alpha-variant that spread throughout the winter months of 2020/2021 had a higher reproduction number, which means that on average one person infected not 2.5 people, but about 4.5 instead (Kraemer et al., 2021). Initially the World Health Organization (WHO) maintained that transmission occurred primarily through larger droplets requiring close personal contact and contaminated surfaces. Although this is still believed to be the primary mode of transmission, it has now been established that smaller droplets (aerosols) play a central role in transmission too, which has triggered the widespread recommendation of wearing face masks.
The mode of transmission of pathogens has a clear effect on the pace and spread of an outbreak. However, the immune response of individual bodies, as well as the characteristics of the community, also affect how proliferation unfolds. Although much is still unknown about the variation in the individual response to infection with SARS-CoV-2, it is clear that there is huge variation in the risk of getting infected, the viral load people develop and the severity of the course of the infection (Chen et al., 2020). This also leads to a strongly differentiated individual contagiousness: a minority of highly contagious individuals are responsible for the majority of infections (Laxminarayan et al., 2020). In terms of the course of the disease in individuals several factors have been identified. First of all, it appears that men are more vulnerable to COVID-19 than women. Although men get infected less than women, they form the majority of hospitalised and terminal cases. In terms of age, the vast majority of the severe cases as well as fatalities are from the higher age bracket (RIVM, 2021; WHO, 2020). Of all cumulative hospitalisations 90% are older than 50 and 56% older than 70 (RIVM, 2021). Data on mortality rates reveal that 70% of all deaths related to COVID-19 are among people older than 80 and 92% are older than 70 (Coronadashboard, 2021). Young people get sick much less; of all reported fatalities less than 1% are younger than 40 and they represent about 5% of hospitalised cases (Boterman, 2020; Coronadashboard, 2021). Younger people, due to their more frequent contact with other people, are among the main receivers and key transmitters of the virus (Van Dissel, 2021). While initially young children were considered to play a minor role in the spread of the virus (Jones et al., 2020; Slot et al., 2020; Zhang et al., 2021), it now appears that it is the schools that are important drivers of the epidemic (Viner et al., 2020).
It has also been demonstrated that people with chronic health problems such as type-2 diabetes, cardiovascular issues and Chronic Obstructive Pulmonary Disease (COPD) have a much higher risk of severe COVID-19 than healthy people. Obesity and hypertension have also been identified as risk factors, both for hospitalisation and death (von der Thüsen and van der Eerden, 2020; Simonnet et al., 2020). It is therefore not surprising that from a wide range of countries it has been reported that COVID-19 is more widespread among lower socio-economic status communities. In many cities in the Global North this often closely overlaps and intersects with ethnicity/race and migration status (Kawlra and Sakamoto, 2021; Khazanchi et al., 2020). Although some studies have also linked vulnerability to COVID-19 to some phenotypical differences such as blood type (Zietz et al., 2020), it is increased exposure to the virus, generally poorer personal health conditions and less favourable housing conditions that are more important explanations (Almagro and Orone-Hutchinson, 2020; Chen and Krieger, 2021). Risk of contagion is strongly influenced by the different levels of risk people (have to) take in their everyday lives. For instance, jobs that require personal contact are evidently imposing a greater threat of getting infected than working from home. Delivery services, teachers, construction workers, factory workers, transportation workers, meat packers and most clearly health care workers are among the occupations that have been identified as running much more risk of infection (Almagro and Orone-Hutchinson, 2020; Maltezou et al., 2020; Middleton et al., 2020; St. Denis, 2020). The ability to work from home extends beyond work, as housing conditions and number of cohabitants may impact the feasibility of working remotely. Other factors that have been associated with infections are multi-generational and larger households. Also specific indoor activities, such as attending religious services, cause a higher risk of infection. In several countries orthodox religious communities are overrepresented in epidemiological statistics (Lee et al., 2020). The socio-demographic characteristics of places are thus likely to shape the spatial diffusion.
Geography of COVID-19
The geographical specificity of the outbreak has been the topic of a rapidly expanding body of knowledge. This geography of COVID-19 literature has also paid specific attention to the role of population density and the role of cities. In Italy, one of the most affected areas during the first wave in Europe, the epidemic had a clear concentration in the regions of Lombardy and Veneto and within these regions specific places accounted for a substantial number of new infections. Ascani et al. (2020) argue that the economic geography of Italy, especially of the manufacturing sector, correlates strongly with the geography of the outbreak. Population density did not emerge as a significant factor associated with spread, but connectivity (airports) did. In a comparison of metropolitan regions in the US, Hamidi et al. (2020) also find a clear correlation with connectivity and a faster spread between metropolitan regions, but no county-level density effect. In an overview paper of studies into the role of density in the diffusion of COVID-19, Teller (2021) finds a lack of consistency in the role of density. A range of studies (e.g., Feng et al., 2020; Jamshidi et al., 2020; Zhang and Schwartz, 2020) find density to have an effect, while others (e.g., Boterman, 2020; Hamidi et al., 2020) do not find a significant effect. All studies echo more general problematisations of the nature and effect of urban density (Keil, 2020; McFarlane, 2016). Moreover, as several studies also tried to incorporate into their analysis, mitigation and containment policies as well as compliance with imposed regulations are key mediating factors. The geographical application of these measures as well as their spatially variegated effects have not been sufficiently understood. Furthermore, many studies were originally conducted around the early stages of the global epidemic, but we are now approaching the third year of this crisis so the virus itself, its diffusion and its effects have mutated. As a result, growing knowledge about the different ways of transmission and changing attitudes to containment policies have also resulted in different regimes of mitigation affecting the geography and timing of the epidemic.
Mitigation measures
It is evident that the novelty of this strain of Corona virus precluded existing community (‘herd’) immunity, leading to rapid and – when left unchecked – unbounded spread. As vaccines became available in countries in the Global North in the course of winter 2020/2021 immunity in populations gradually improved. In most European countries it took until the summer of 2021 before the majority of the adult population was vaccinated. The period under study in this paper is primarily concerned with the period before mass vaccination. At the early stages of the pandemic, in most countries several measures were enacted to counteract the spread of SARS-CoV-2. Some of these measures were national, but especially in larger countries policy measures were spatially sensitive.
Given the mode of transmission, most measures included increased focus on personal hygiene and a drastic reduction in inter-personal contact, that is, social distancing. The WHO has consistently called for a test-and-trace strategy (test-test-test!) to identify cases early and encourage/enforce self-quarantine. In some countries initially, like Sweden and the Netherlands, the use of face masks was even discouraged but now a broad global consensus on the use of masks to prevent aerosol-based transmission has emerged (Lee et al., 2020).
In response to the global outbreak most countries adopted stringent measures of social distancing (Bertuzzo et al., 2020; WHO, 2020; Wilder-Smith and Freedman, 2020). In many countries staying at home for some periods was sternly advised and many commercial and social activities were not allowed or at least discouraged. While some differences in timing and degree can be observed between countries and within countries, by and large most people were asked to lockdown and stay at home as much as possible in periods where numbers soared. Also, in the Netherlands a series of increasingly strict measures were adopted in response, to first contain and later mitigate the spread of the virus. Prior to the availability of vaccines (a campaign which started in January 2021) and without widespread test-and-trace strategies, social distancing and the partial lockdown of indoor places of social interaction were the key mitigation strategies in the Netherlands (Anderson et al., 2020).
Much of the Dutch policies to contain the epidemic revolved around healthcare capacity, and that of intensive care units (ICU’s) in particular. COVID-19 related admissions to hospitals are a central parameter in the outbreak mitigation plan of the Dutch authorities. Since mid-March 2020 the central government has taken the lead in declaring nation-wide partial lockdowns to slow the spread of the SARS-CoV-2 virus, mainly to avoid a collapse of hospital care, especially exceeding the maximum ICU capacity. A full eradication (zero-cases) strategy does not appear to have been considered. The severity of the different lockdowns varied and also the degree to which measures have been respected by the public appear to fluctuate.
Table 1 describes the timing and duration of main mitigation measures. Although regional or locally specific measures were considered, all measures were implemented nation-wide. Grosso modo the first wave of the outbreak started with – what Dutch authorities referred to as – an ‘intelligent lockdown’, which entailed the closure of different establishments and encouraging people to stay at home, without closing shops and – apart from three weeks (15 March to 6 April) – without closing primary and secondary schools, which remained open throughout most of that stage of the outbreak. In the course of spring 2020 these measures were lifted and by the summer months restaurants, bars and all shops were allowed to open. Social distancing and increased focus on hygiene were still advised but face mask use was not encouraged. Despite signs of a new wave already apparent in August, no important mitigation policies were adopted. The start of the second upsurge in the number of infections, which retrospectively started in the final week of August and continued until early December 2021, was only counteracted by severe mitigation measures by mid-October and even stricter measures early in November. When cases started to drop some measures were – prematurely – lifted, leading to a new upsurge. Measures were intensified once more and were complemented with ever more stringent rules, including the closure of non-vital shops (14 December) and schools (16 December). Over the course of January numbers dropped and in February 2021 they flattened out, allowing for the lifting of some measures. Although, over March, daily infections and hospitalisations started to increase once more, additional measures were lifted. The increasing numbers of vaccinated people helped to bring numbers down during April and May.
Overview of national policy interventions aimed at containment of the spread of SARS-CoV-2 in the Netherlands.
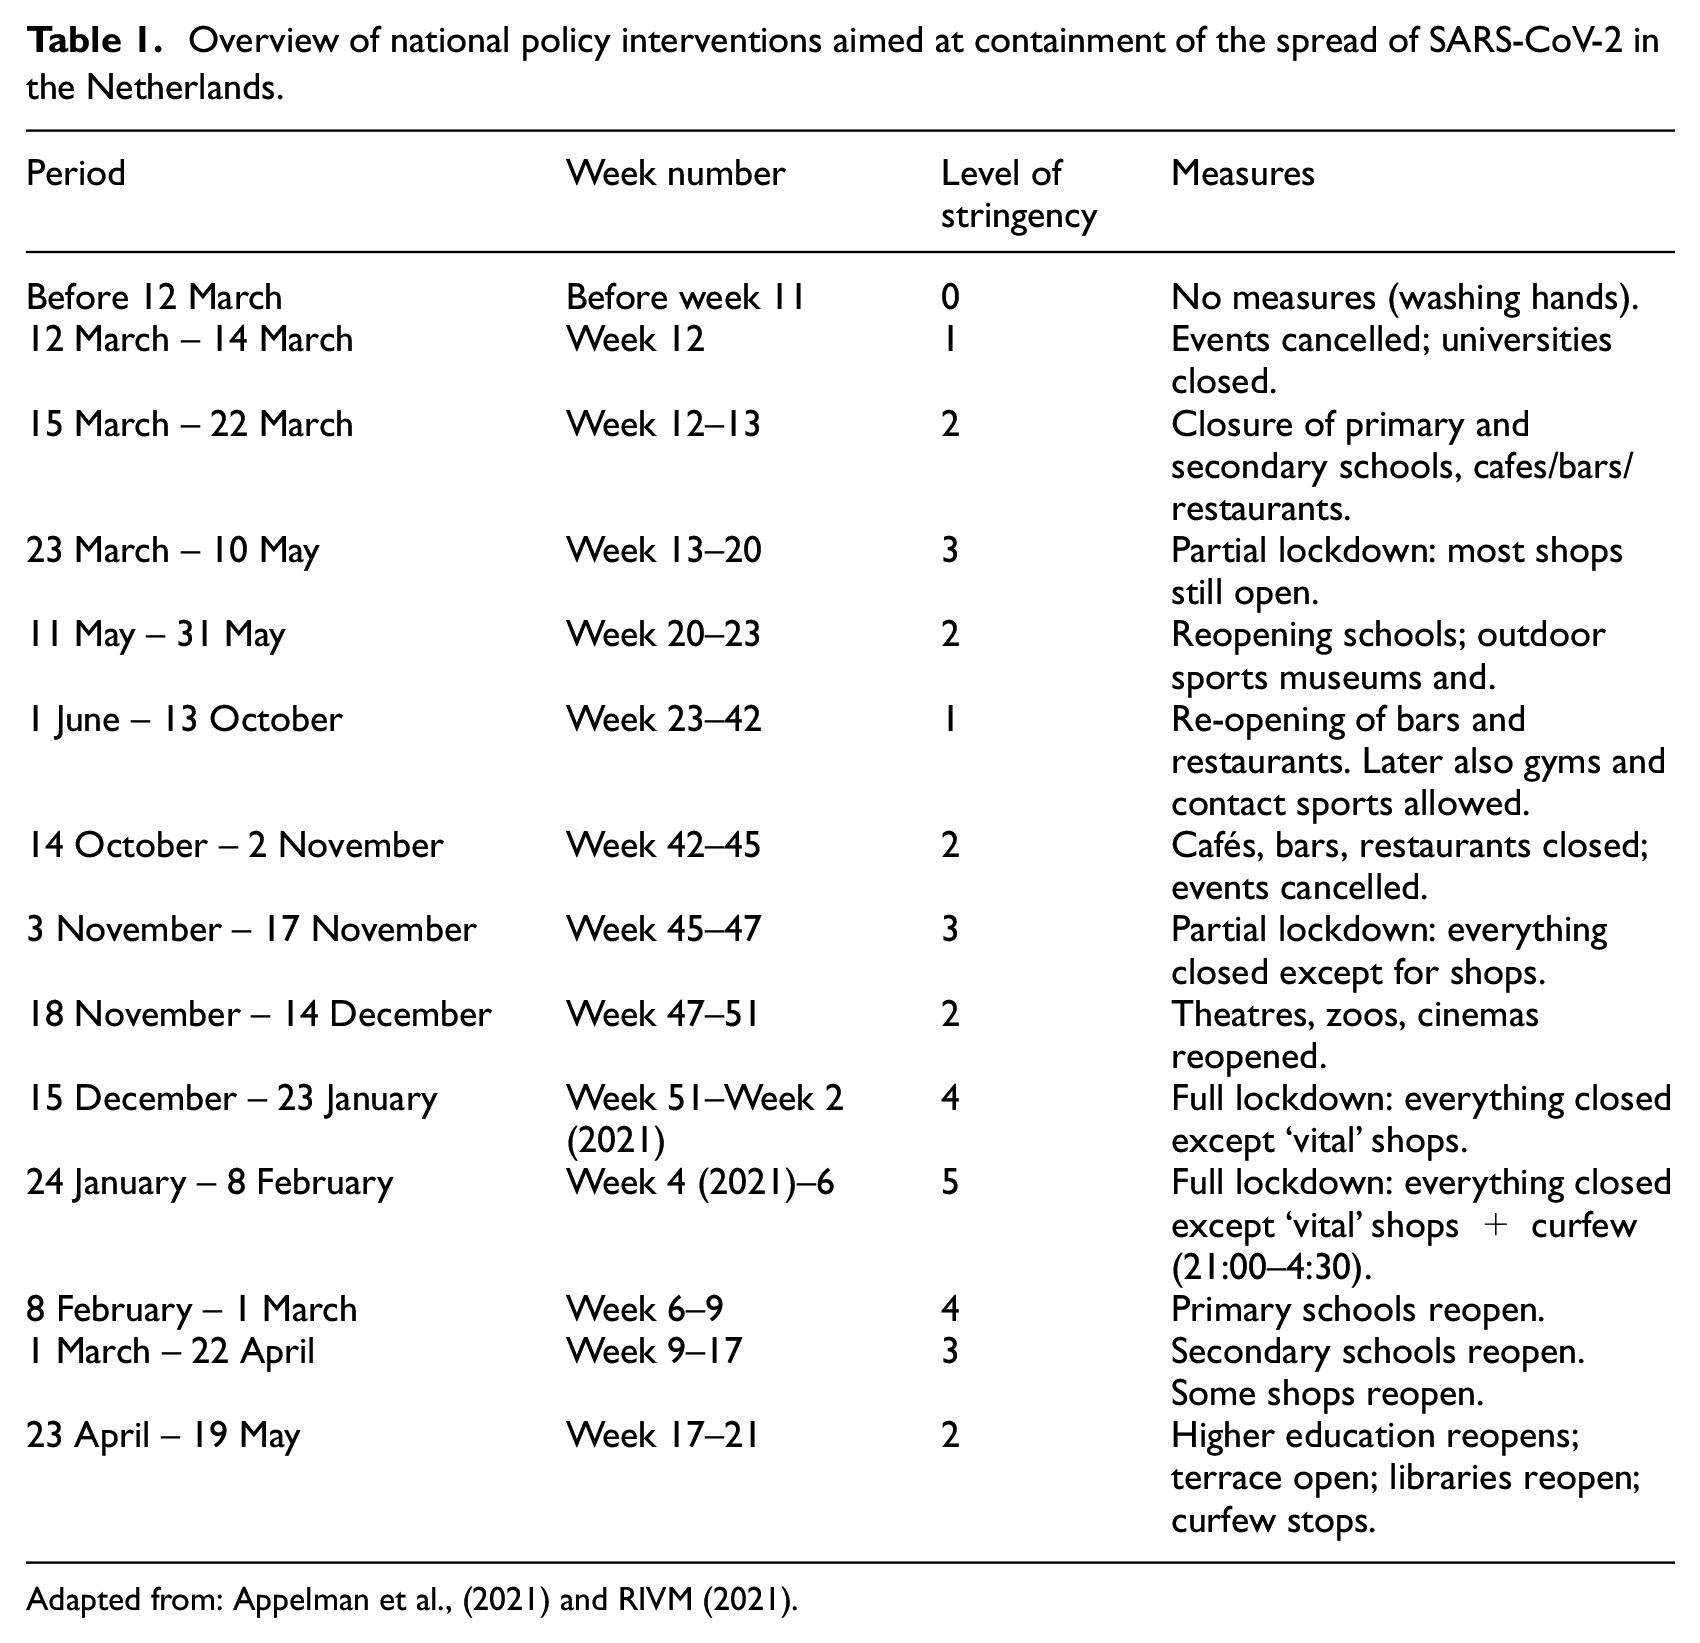
Adapted from: Appelman et al., (2021) and RIVM (2021).
As the epidemic stood in late 2021 it is possible to discern five distinct periods in the development of the outbreak in the Netherlands (Figure 1). These periods are a combination of the development of the number of new cases 2 and hospitalisations and of policy measures (‘lockdowns’) to mitigate the outbreak: first wave (end of February – 31 May 2020) with a lockdown from mid-March 2020; intermittent phase (1 June – final week of August 2020) with low numbers of infections and no lockdown; second wave, first peak (final week of August – final week of November 2020) with a first round of mitigation policies in mid-October and a partial lockdown from 3 November; second peak of second wave (December – February 2021) with a brief relaxation followed by a full lockdown in mid-December; and a third peak of the second wave (in the media and in other countries this was referred to as the Third Wave) which started in late February and ended early in June. Later stages of the epidemic have not been covered in this paper.
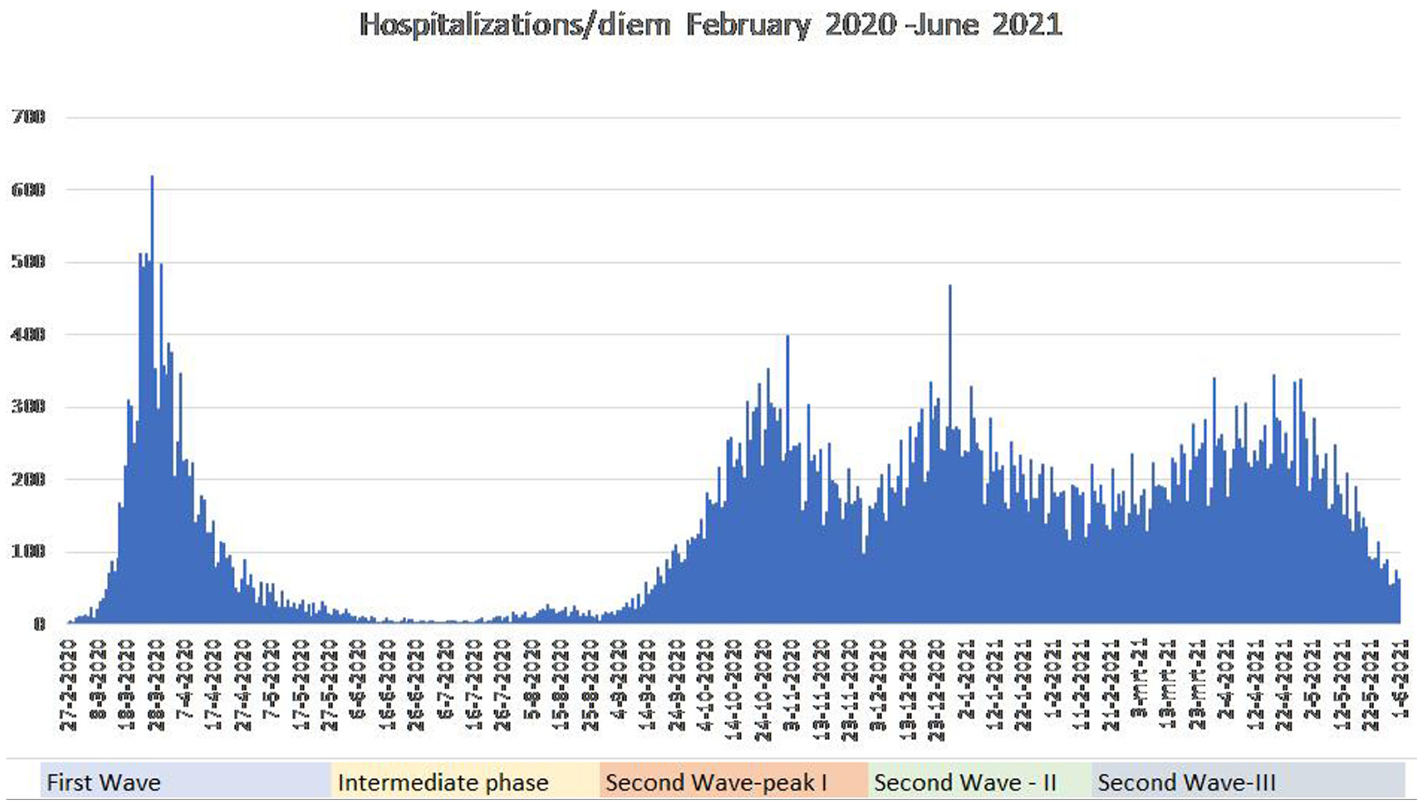
Number of hospitalisations related to COVID-19 in the Netherlands.
Geography of SARS-CoV-2 in the Netherlands
Figure 2 presents the spatial patterns of the SARS-CoV-2 epidemic in the Netherlands, based on infections per 1000 inhabitants. Initially the first wave of the epidemic was strongly concentrated in the Southern provinces, Noord-Brabant and Limburg, where superspreading during Carnival (February 2020) propagated rapid proliferation; from there the epidemic rapidly spread into other parts of the country. In this first wave, the low-density provinces of the North and to a lesser extent Zeeland had relatively lower numbers. The highly urban areas of the Randstad do not stand out in this stage. Only some pockets of infection can be discerned in municipalities with high numbers of Orthodox Christians (Boterman, 2020). The intermittent period and the first part of the second wave, however, have a distinctly different geography. Here the concentration areas appear to have been in the densely populated parts of the Netherlands, especially the largest cities Amsterdam, Rotterdam and The Hague. During the second peak-period of the second wave the number of cases reported in the Randstad provinces was declining in comparison with other areas, while a stronger concentration in the Eastern provinces and also again in Noord-Brabant and Limburg emerged. The third peak had a fairly equal spatial distribution, with somewhat stronger concentrations in the Southern provinces once more and lower numbers in the North. These shifting patterns over time may indicate a different role of spatial contextual factors in various stages of the epidemic.
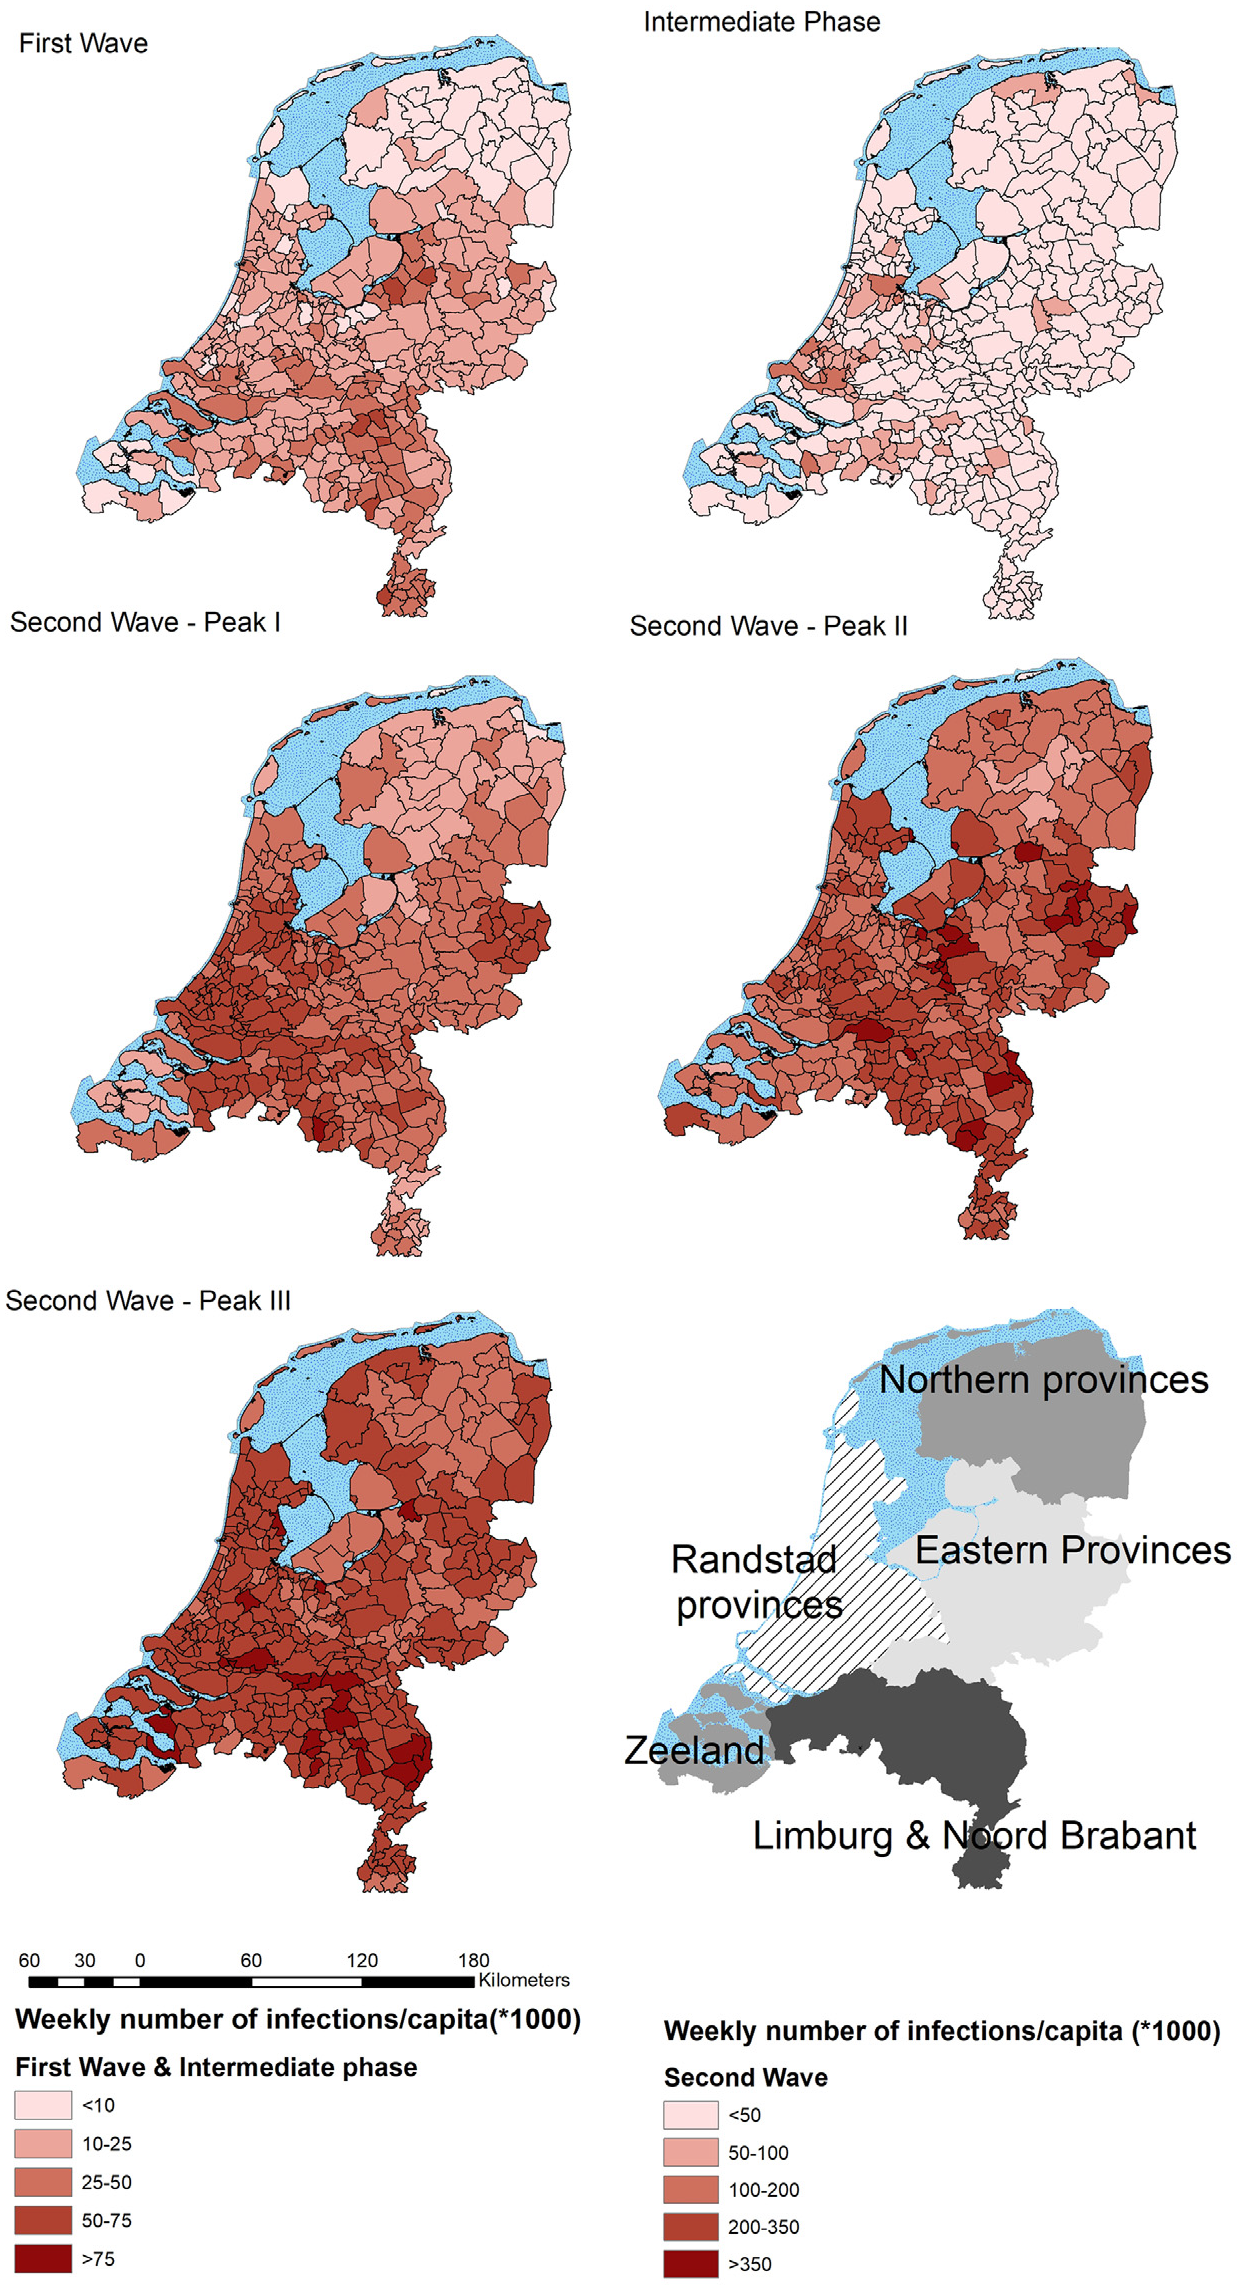
Geography of COVID-19 in the Netherlands.
Data and methods
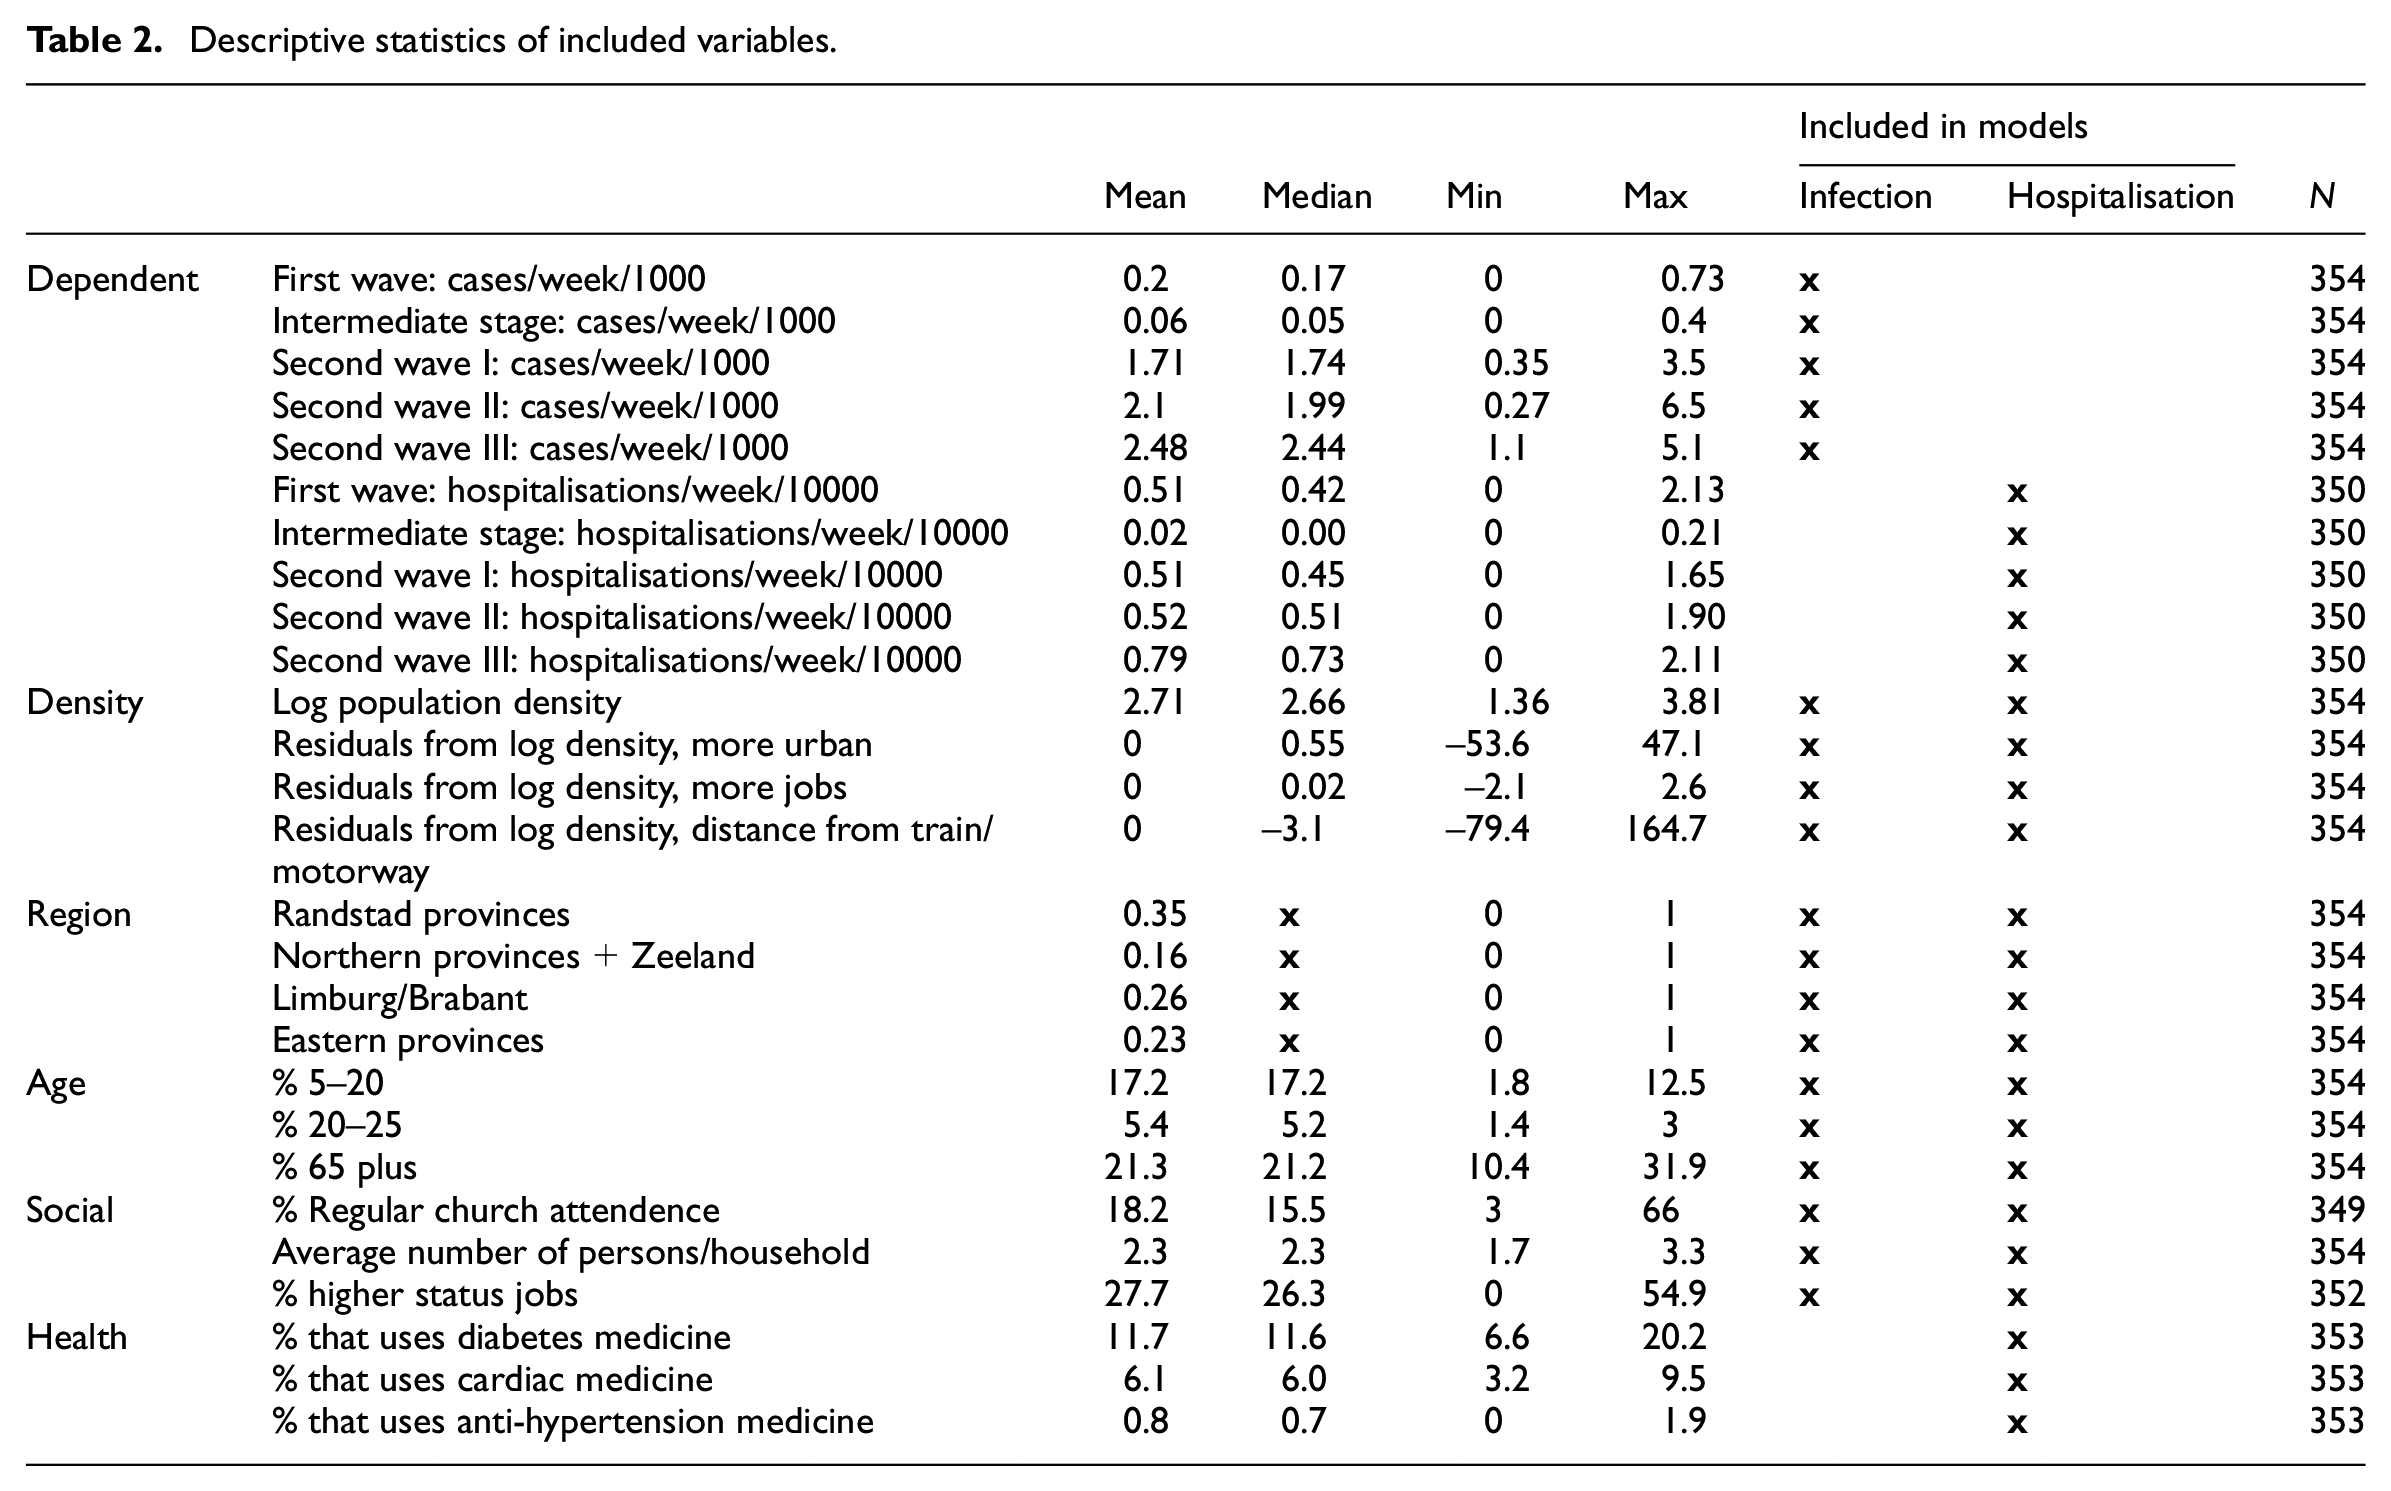
The analyses of this paper draw on public data issued by the Dutch National Institute of Public Health and the Environment (RIVM) on a daily basis since the start of the epidemic. The issuing of information has changed to a weekly report via the Corona-dashboard (coronashaboard.rijksoverheid.nl) of the Ministry of Public Health; daily figures are still reported. The daily (weekly) epidemiological status updates contain data about the number of positive tests, the number of COVID-19 related hospitalisations, ICU admissions and the reported deaths related to COVID-19 for the 354 Dutch municipalities (2019 boundaries). Since this paper is primarily concerned with the development of the infections, I do not focus on mortality. The numbers of fatalities per week were also too low to allow for a comparison of municipalities (too many zero cases). Moreover, the vaccination campaign and how this unfolded strongly affects the geographical and demographic patterns of the mortality rate. I therefore focus on positive cases and hospitalisations. To compare the different stages of the pandemic I use data on the number of cases and number of hospitalisations from the final week of February 2020 to the final week of May 2021. The incidence rates of infections and hospitalisation are divided by the population of the municipality, multiplied by 1000. I combined the epidemiological data related to the epidemic with other municipal data from the open data repositories of Dutch statistics (CBS, 2020). For the purpose of this study I created a dataset with data at the level of municipalities with factors that, based on the literature, could be expected to impact the development of the epidemic. There are four sets of variables: demographic, social, public health and spatial (Table 2).
Descriptive statistics of included variables.
The demography of municipalities is likely to have influenced the development of the epidemic. First of all, as always with infectious diseases, the frequency, density, duration and intensity of interpersonal contacts influence the speed of the proliferation. People with large social networks, and who gather in large groups, are generally more likely to contribute to the spread of a virus than people with smaller networks. It is therefore frequently suggested that young adults with many, frequent contacts may play a relatively important role in the development of the outbreak. I therefore included age groups in both the models for positive cases and hospitalisations. I included school aged children 5–20 and young adults 20–25 as groups that are expected to contribute to faster spread. Elderly people (older than 65) are included because they are expected to have fewer social contacts, behave more carefully during the pandemic and hence may correlate negatively with the spread of the disease.
The second category of variables included in this study is related to the social structure of municipalities. One risk factor playing a major part in the development of the epidemic is the degree to which people are able to stay at home and work from home. Workers in service industries and the public sector were able to do most of their office work from home. The structure of the local labour market hence impacts the degree to which the virus can spread. I have therefore included the share of highly skilled service workers (ISCO-4) in the municipal working force as a control variable. In addition, various studies have suggested that the spread of the virus in indoor spaces via aerosols also enhances the risk of contamination in churches and choirs (Prather et al., 2020). Given the fact that churches in the Netherlands were exempt from general lockdown measures, communities in which a substantial part of the population attended services on a regular basis ran a larger risk of a fast development of the epidemic. Also, ignoring social distancing regulations and recommendations among communities of faith might have contributed to a quicker proliferation of the coronavirus.
A third set of variables is related to the public health situation in municipalities. From epidemiological data it appears that the severity of COVID-19 increases strongly with age. Hospitalisation is therefore much more likely among relatively older groups. As I focus on hospitalisation rates, I included the share of people aged 65 and over in the population, who are the most likely group to experience severe COVID-19 and be admitted to hospital. Furthermore, from an expanding body of literature on the development of COVID-19 it appears that hypertension, cardiovascular diseases, obesity and diabetes are clear risk factors. The included types of medicine reflect the reported severity and co-morbidity of COVID-19 (Simonnet et al., 2020). The percentage of the elderly population in municipalities using diabetes medicine, cardiac medicine; and anti-hypertensives are included in the hospitalisation models.
A fourth category of variables are related to population density, which is the main focus of this study. The main variable is population density, measured as the number of inhabitants per square kilometre. To get a more balanced distribution I took the logarithm with ground number 10. Population density is more complex than just the density of the population: is it scaled. The Netherlands is a highly populated country where population densities in general are above the European average. Within the Netherlands, regional differences exist: the Northern provinces are the most scarcely populated; the Eastern and Southern provinces have moderately high densities and the Western provinces in which the Randstad conurbation is located has the highest population densities. I therefore divided the country into four parts: the Northern provinces and Zeeland, which have relatively low densities; Noord-Brabant/Limburg, which have moderately high densities and where the first wave of the epidemic started; the Eastern provinces, which have moderately high densities; and the Randstad provinces of Utrecht, North- and South-Holland. Furthermore, Dutch cities, while compact, have substantial densities but compared with inner cities of other European capitals such as Paris, Madrid, or Rome, population densities are not extreme. Within municipalities differences may occur, especially in large municipalities with several towns and population centres, where density may vary. The share of the population that lives in high concentration areas, highly urbanised areas (>1500 people/km2), could therefore deviate from what one might expect from population density averages. To also include the variation in urban features controlling for population density, the residuals of the (Ordinary Least Squares) regression of urban population share with population density are included. The residuals have negative values if the share of people living in urban areas is lower than what could be expected based on the population density; if the values are positive, it indicates that the share of people in highly urban areas is higher than expected based on population density. I repeated the same procedure for two other variables that closely correlate with population density: the number of jobs and the average distance from major highways and train stations. Both variables are added as additional measures of density and connectedness (which are strongly correlated).
Finally, the development time of the epidemic revealed significant differences. I calculated the average number of cases and hospitalisations per fortnight, starting from week 10 in 2020. The five stages of the outbreak and also the different intensities of temporary measures taken by the authorities to mitigate the spread are compared.
Models
To model the infection and hospitalisation rates per 1000 inhabitants I use Poisson models. Poisson models are commonly used in epidemiological studies (e.g., Zhang et al., 2021) as they are most suitable for modelling counts or rates of relatively rare phenomena in the population. I used Poisson regressions (command poisson in Stata 16) to estimate the incident rate ratio (IRR). Incident rate ratios indicate whether the predictor variable is negatively (below 1) or positively (above 1) affecting the expected incidence compared with the mean. To facilitate intuitive interpretation I included graphs that demonstrate the predicted incidence for the key independent variables.
The first set of models analyse the average number of cases of SARS-CoV-2 infections per two weeks for Dutch municipalities in the first wave; intermediate period; second wave-first peak; second wave-second peak and second wave-third peak. The second set of models covers the hospitalisation rate for the same periods.
The third set of models estimates the development of the infections and hospitalisations per two weeks. Here I reshaped the dataset as a panel study. The incidence rate is calculated using panel poisson regression (command xtpoisson in Stata 16). The two-weekly periods are introduced as a time-series variable and the interaction effects between time and population density are calculated. The poisson models are tested for their goodness of fit (estat gof command), which revealed no significant effect for overdispersion of the dependent variables. I focus on the role of population density and therefore calculated the marginal effects of density for each of the bi-weekly periods.
Analysis
Model 1
From the first set of models it appears that population density at the municipal level correlates negatively in the first wave, but positively in the intermediate phase and throughout the second wave. The same applies to the role of relative urban characteristics and the relative number of jobs. What also appears from Table 3 is that young adults correlate positively (IRR higher than 1) with infection rates, in some stages of the pandemic, but not in others. Also, household size appears to be a risk factor, while higher service jobs may be negatively correlated with infection rates.
Model 1: Cases/week/1000.
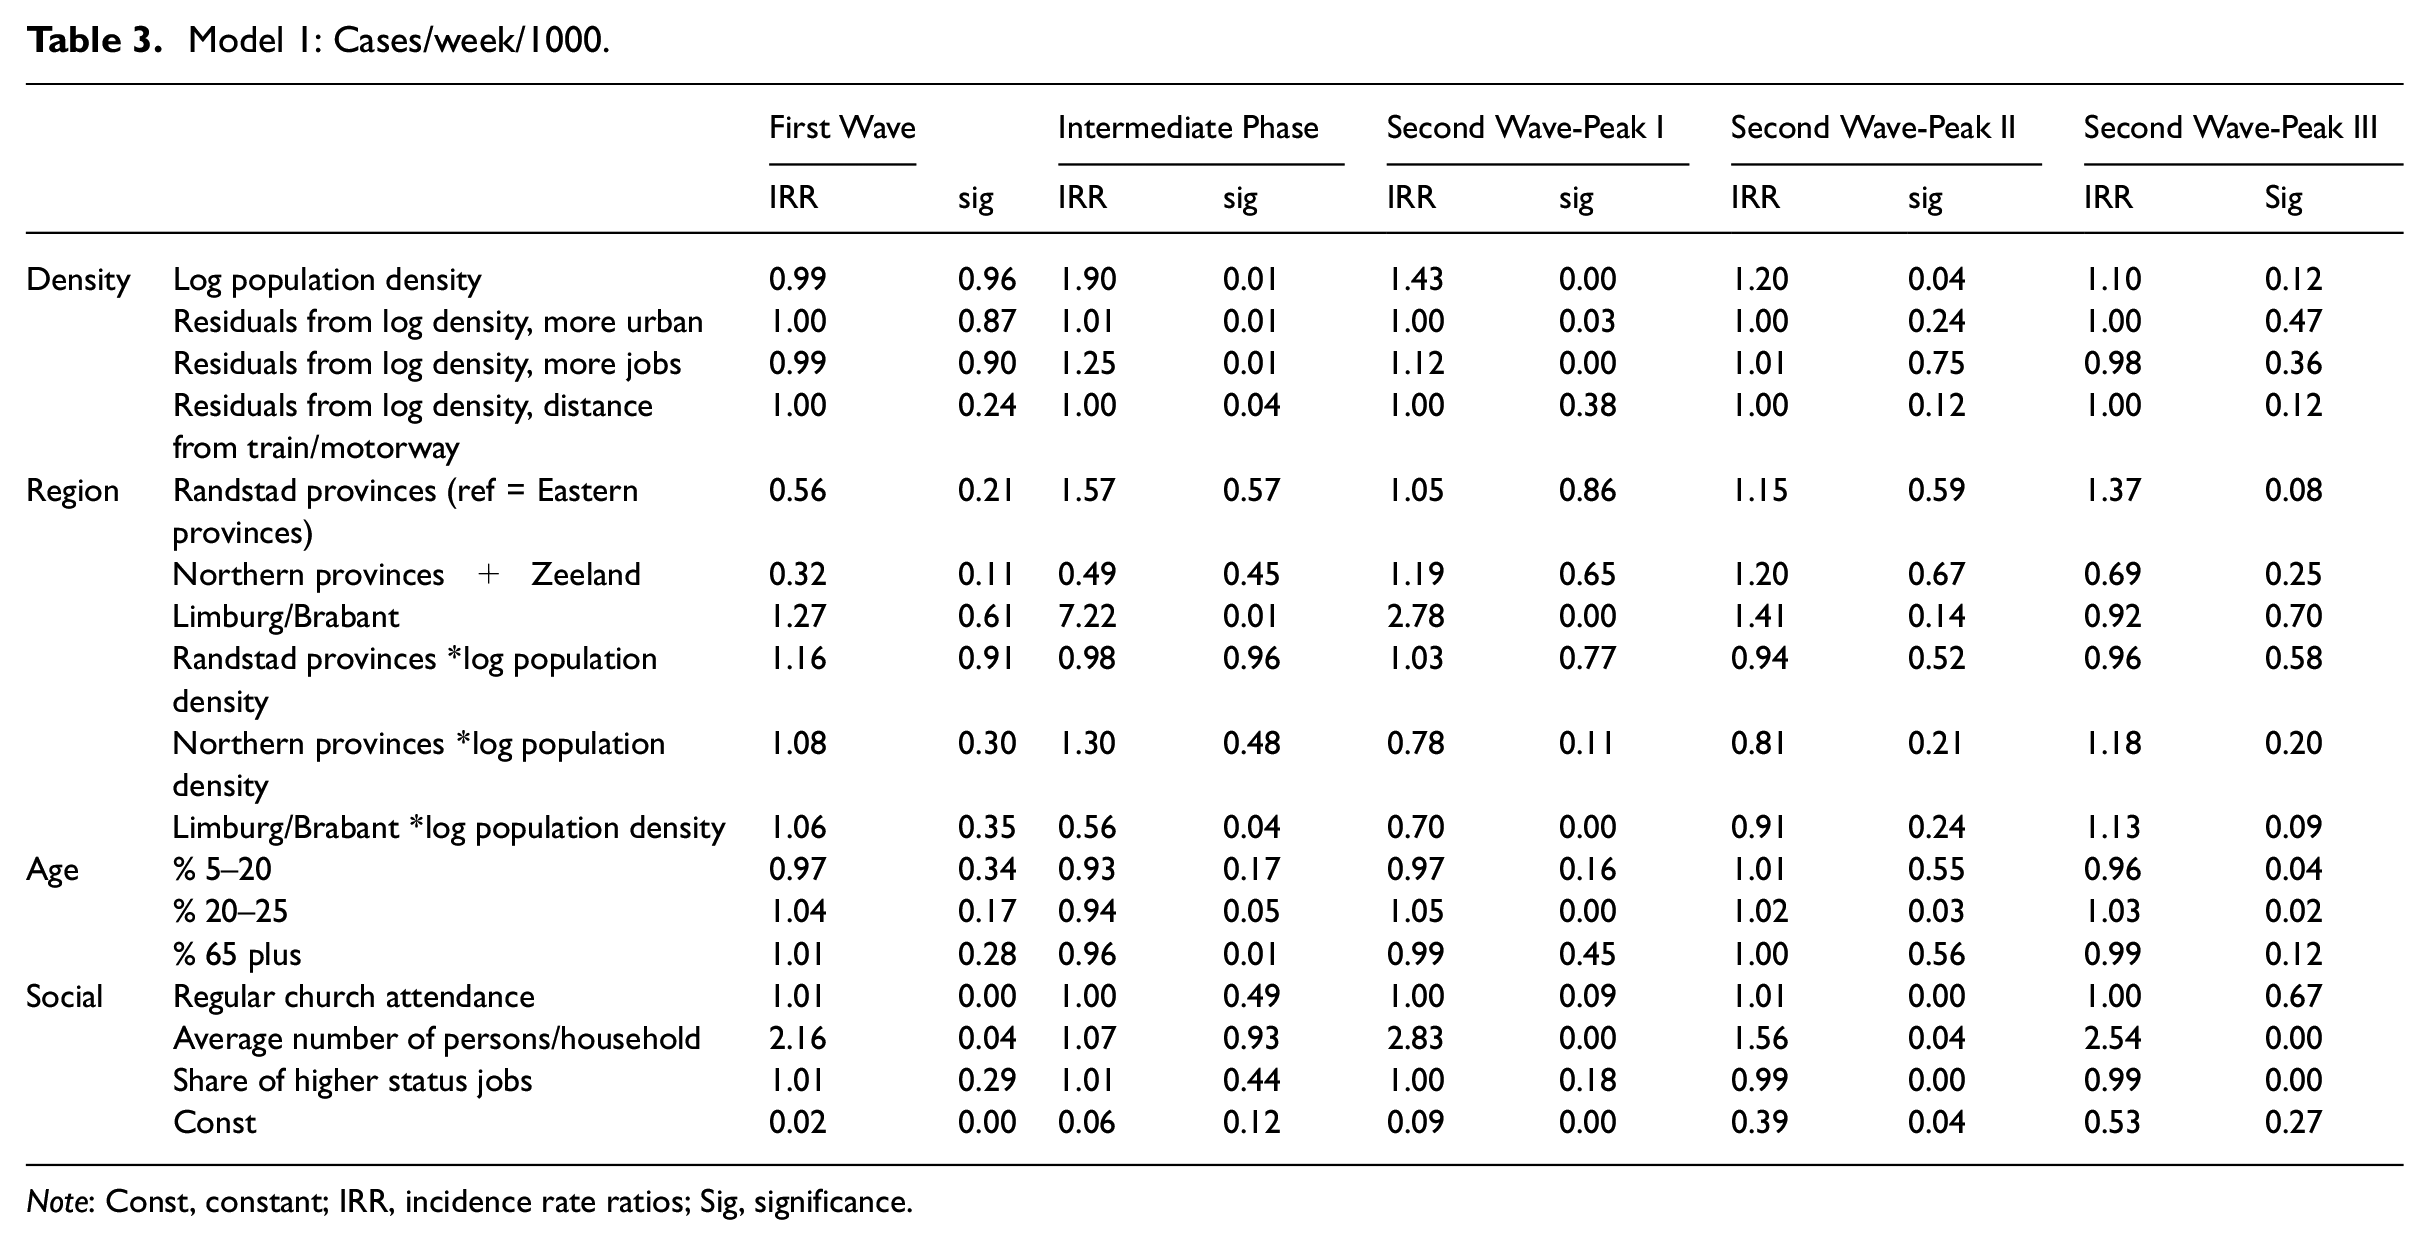
Note: Const, constant; IRR, incidence rate ratios; Sig, significance.
A clear regional effect can be observed. The provinces of Limburg and Brabant have a significantly higher rate of incidences compared with the other provinces in most stages of the pandemic. The least populated regions, the Northern provinces and Zeeland, consistently appear to have a lower incidence rate. The interaction effects between region and density, however, are difficult to interpret at face value. Therefore Figure 3 shows the predicted incidences across population density and region for the five stages. From Figure 3 it becomes clear that the stages indeed differ substantially in terms of the effects of region and density. In the first wave, density at the municipal level does not appear to play a role, but regions differ significantly: Brabant and Limburg are more affected than the Northern provinces and Zeeland, while the other regions do not significantly stand out. During the intermediate stage in the summer months and in the first and third peak of the second wave, population density is mainly relevant in the Randstad provinces and the Eastern provinces but not significant in other regions. In the second peak no clear differences can be observed.
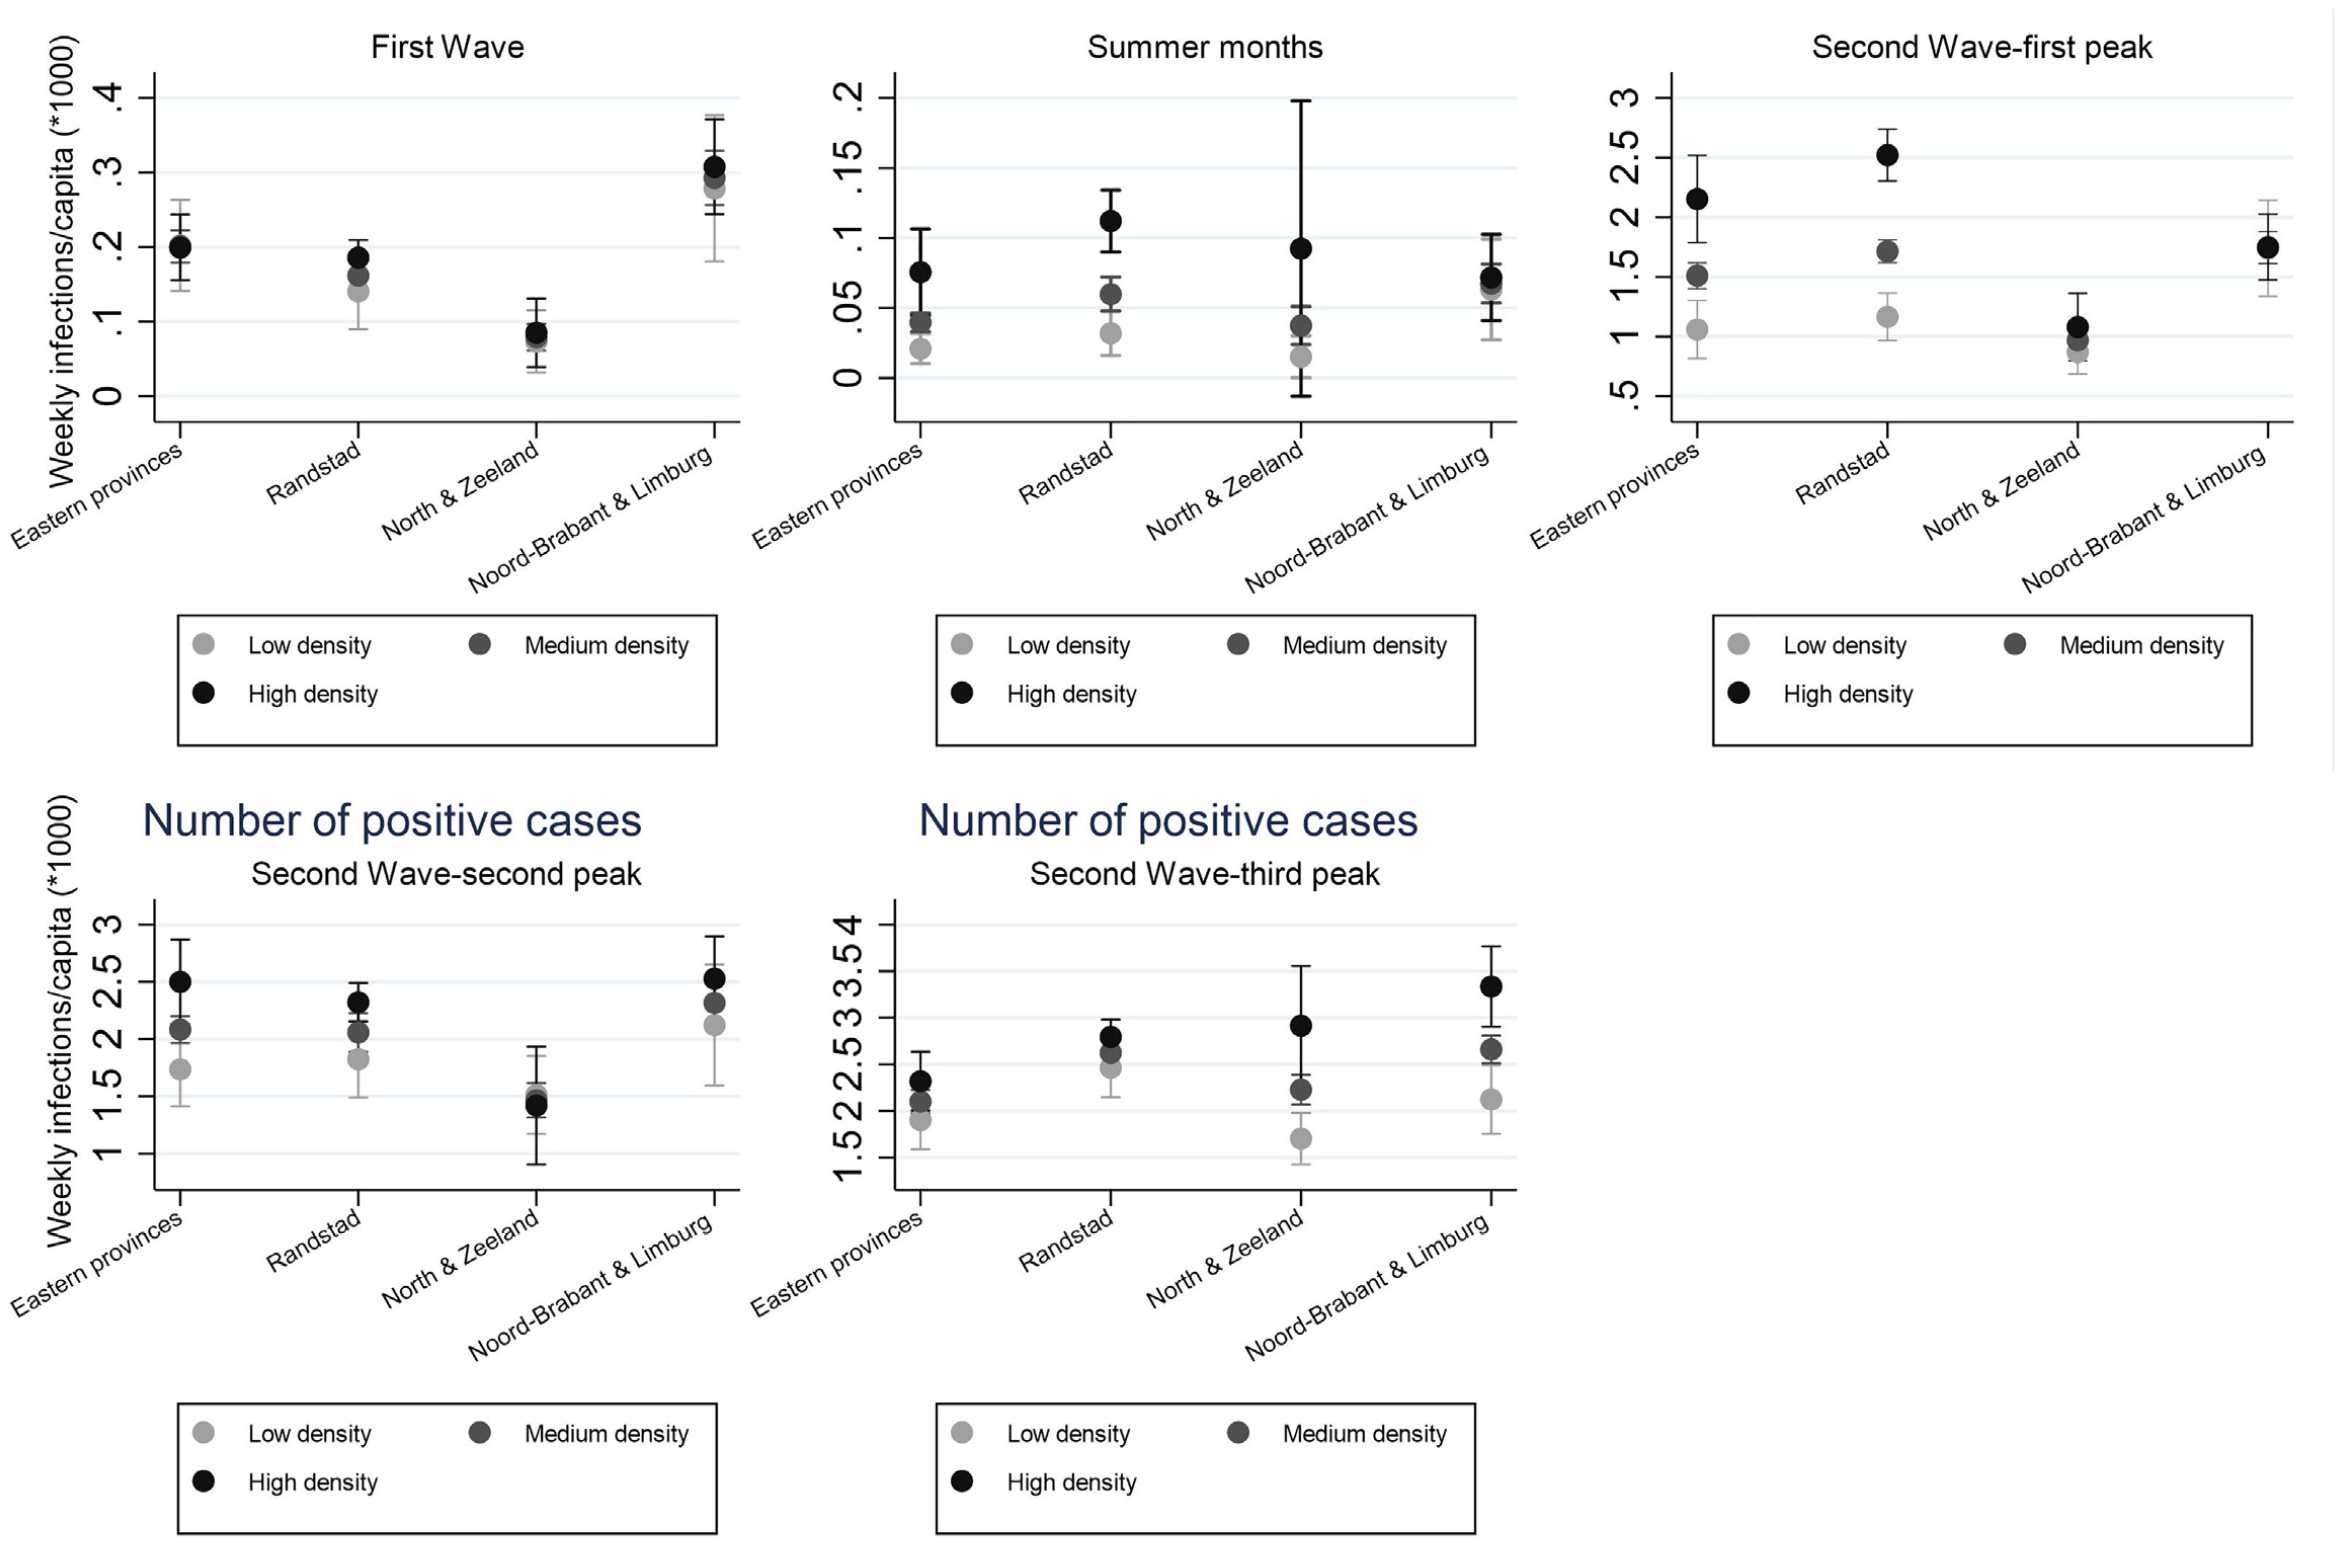
Infection rate per week, marginal effects of population density.
Model 2
The second model estimates the effects of density on hospitalisation rate (Table 4). The findings are similar to the previous model. Of the controls, some significant relations stand out: numbers of young adults increase the risk of hospitalisations in the municipality, while the share of older people is not significant except for the second peak of the second wave, where they also correlate positively with hospitalisations. Also, a large average household size increases the risk of hospitalisations. Mostly, young age and a high number of household members increase the risk for vulnerable people to be exposed. The medicine use variables show significant, yet somewhat mixed effects.
Model 2. Predicted number of hospitalisations per week/per capital (*1000).
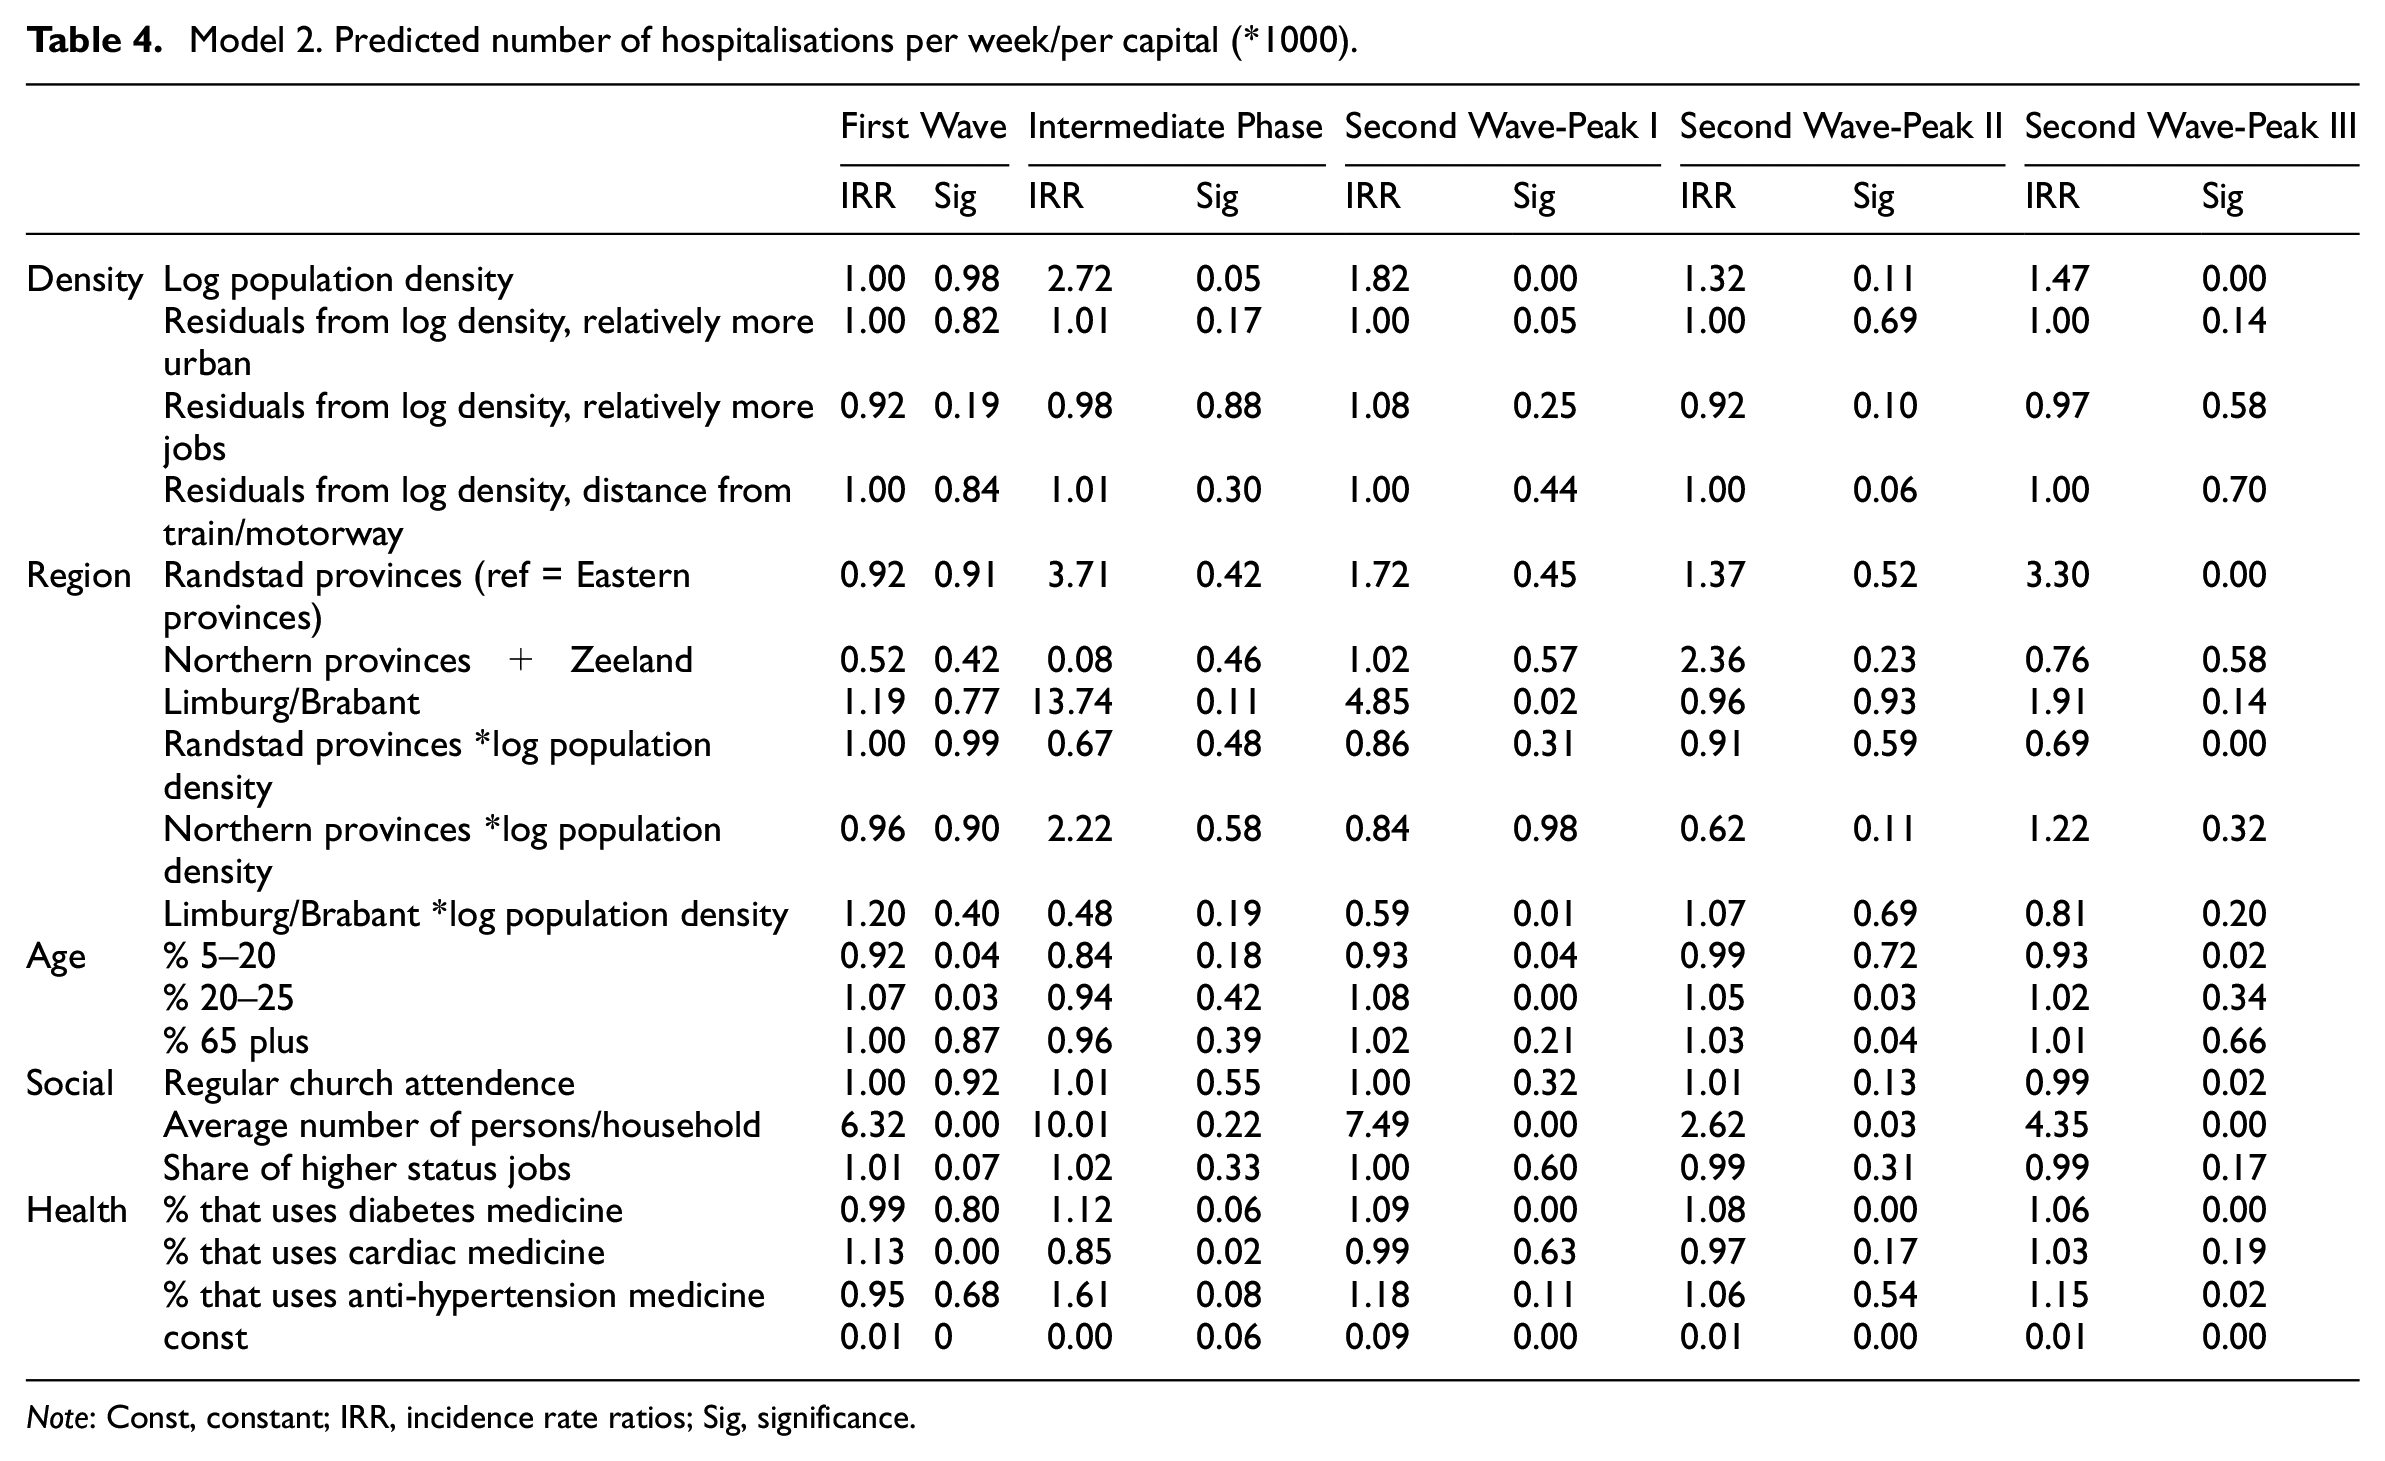
Note: Const, constant; IRR, incidence rate ratios; Sig, significance.
Density correlates negatively in the first wave and positively in the later stages, and the number of jobs and relative urban nature have a positive effect on predicted hospitalisations. In addition, a regional effect can be observed: the Randstad provinces reveal higher hospitalisation in the intermediate phase but the low-density provinces appear less affected. To facilitate easy interpretation of the combined effects of region and density, Figure 4 shows the predicted number of hospitalisations per week, per 10,000 inhabitants. While in the first wave Brabant and Limburg have the highest rate of incidences, irrespective of density, in the second wave (both peaks) density appears to be correlated with higher hospitalisations in the Randstad, Eastern provinces and Brabant and Limburg. The low-density provinces of the North and Zeeland also reveal a density effect in the first and third peak of the second wave.
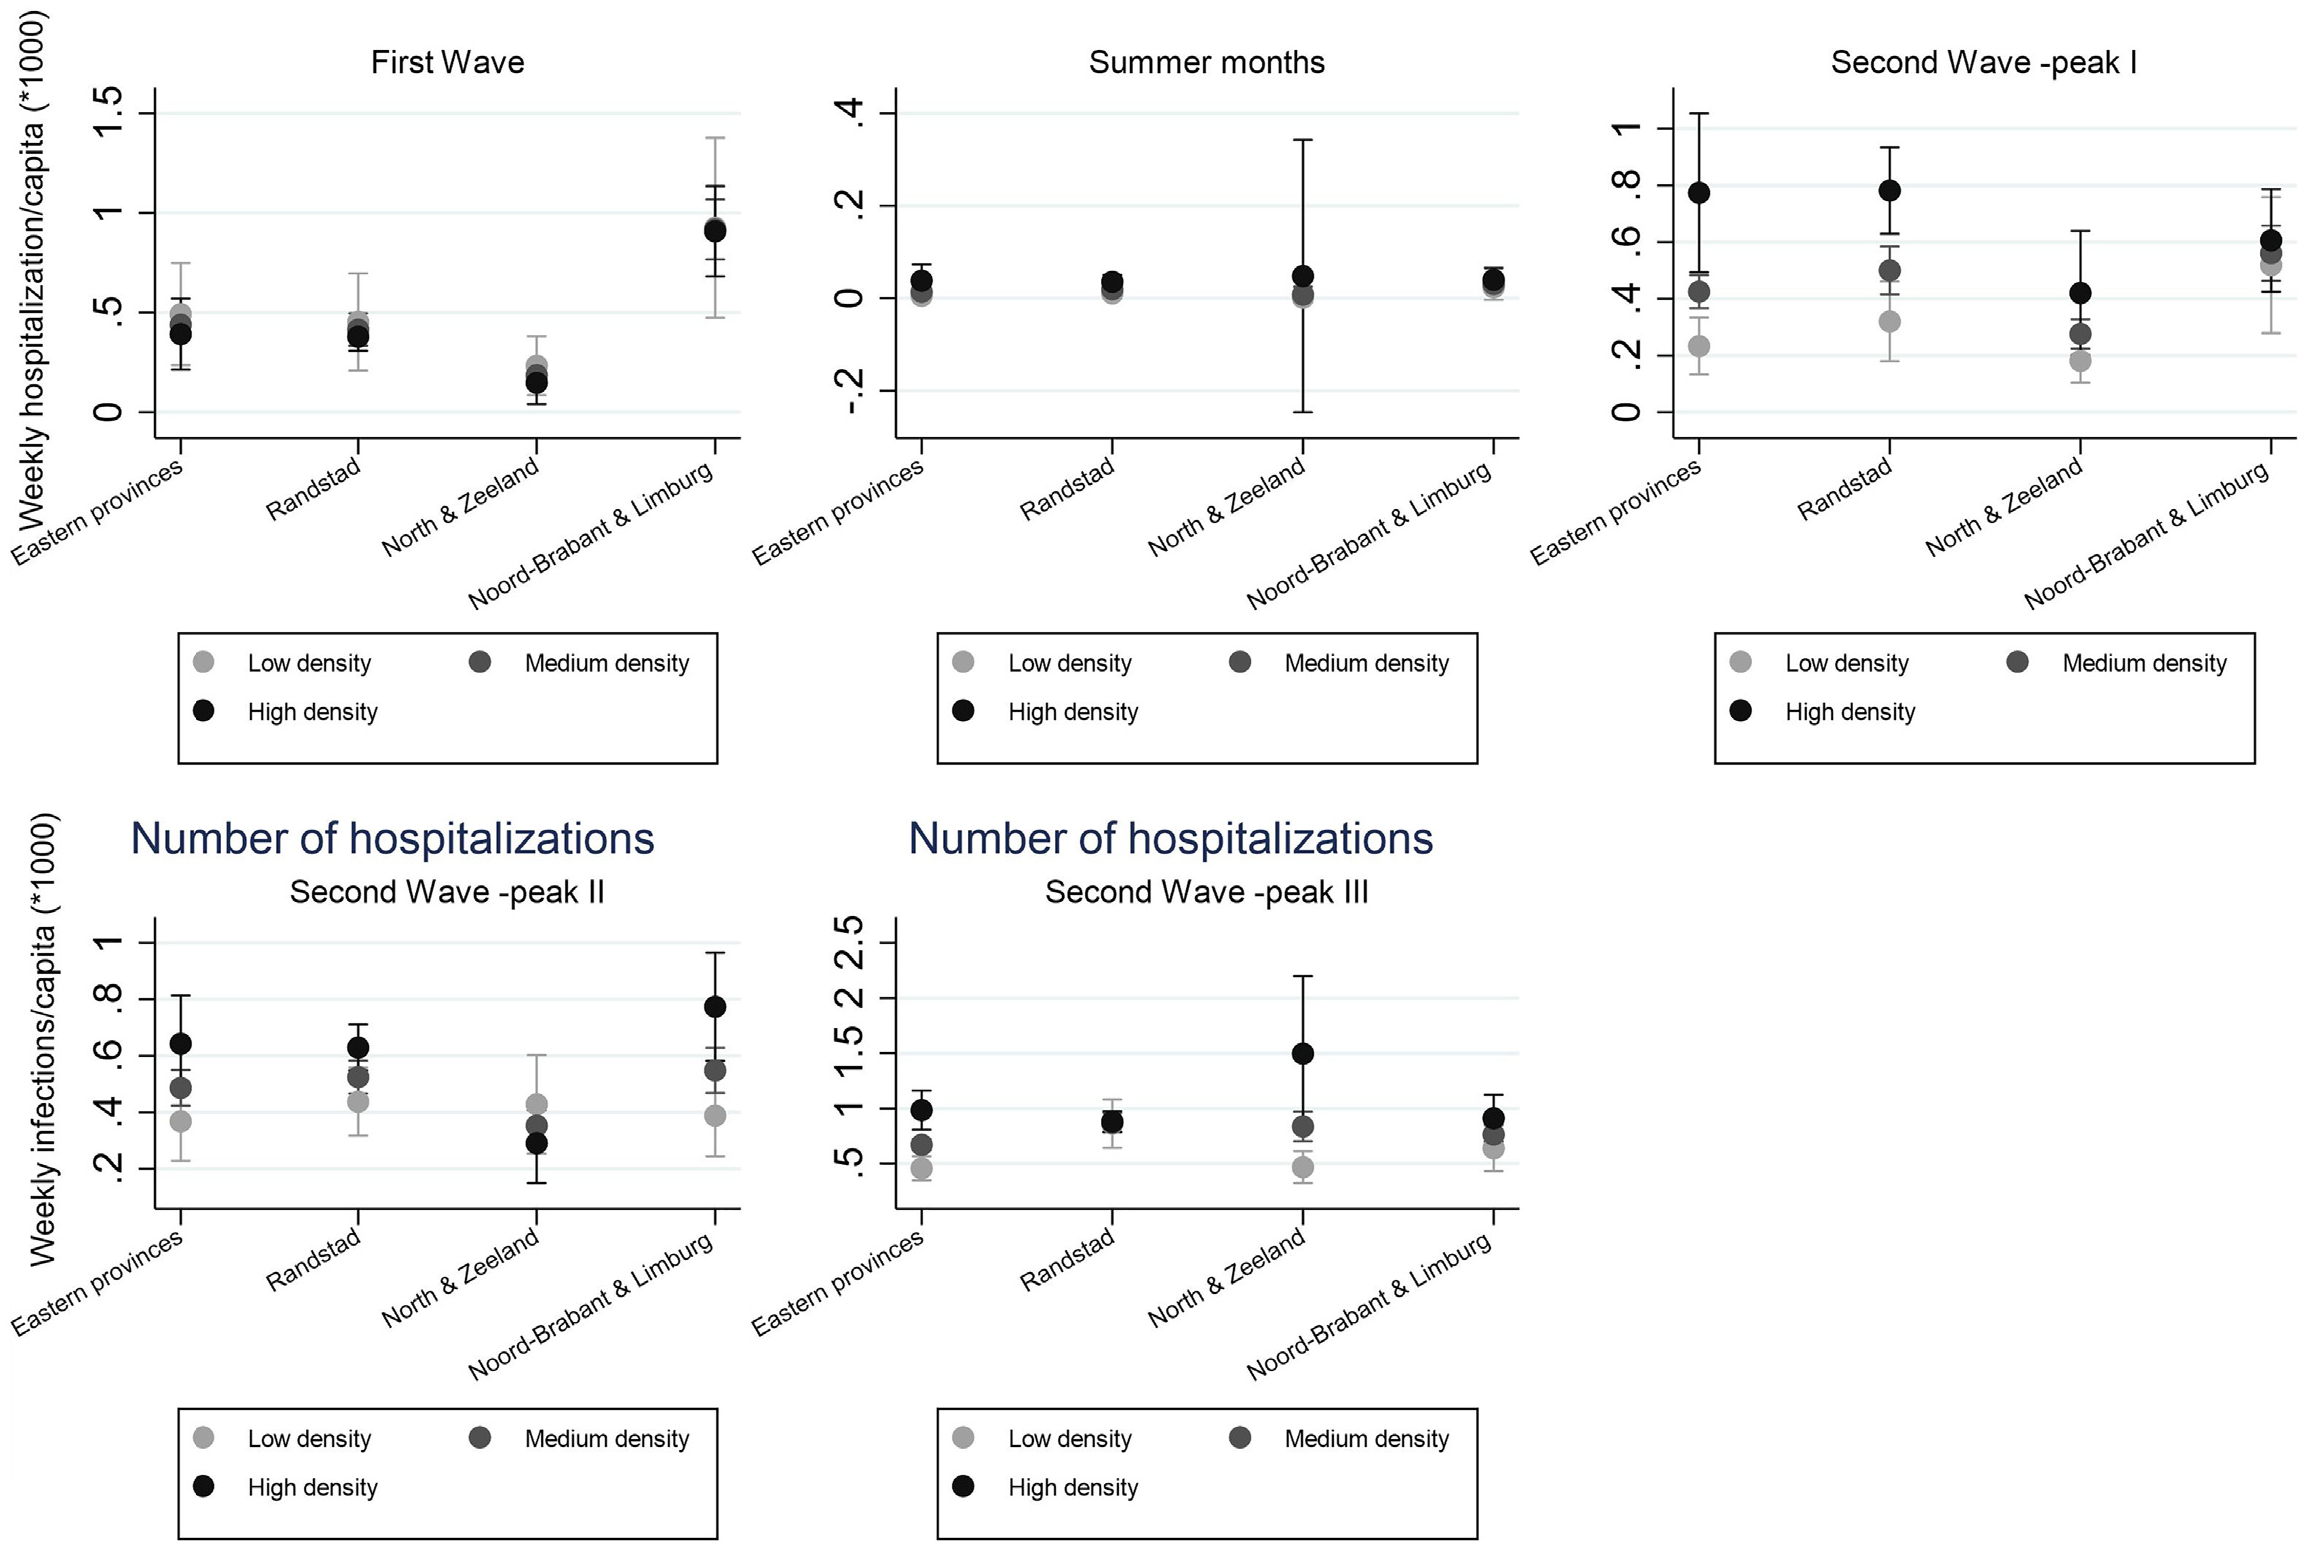
Predicted incidences of hospitalisation.
What thus emerges from the two models discussed above is a rather complex relationship between density, region and the spread of the virus. Some of the control variables have effects as expected, but also here some temporal variation can be observed. The next model assesses the development of the epidemic over time in more detail.
Model 3
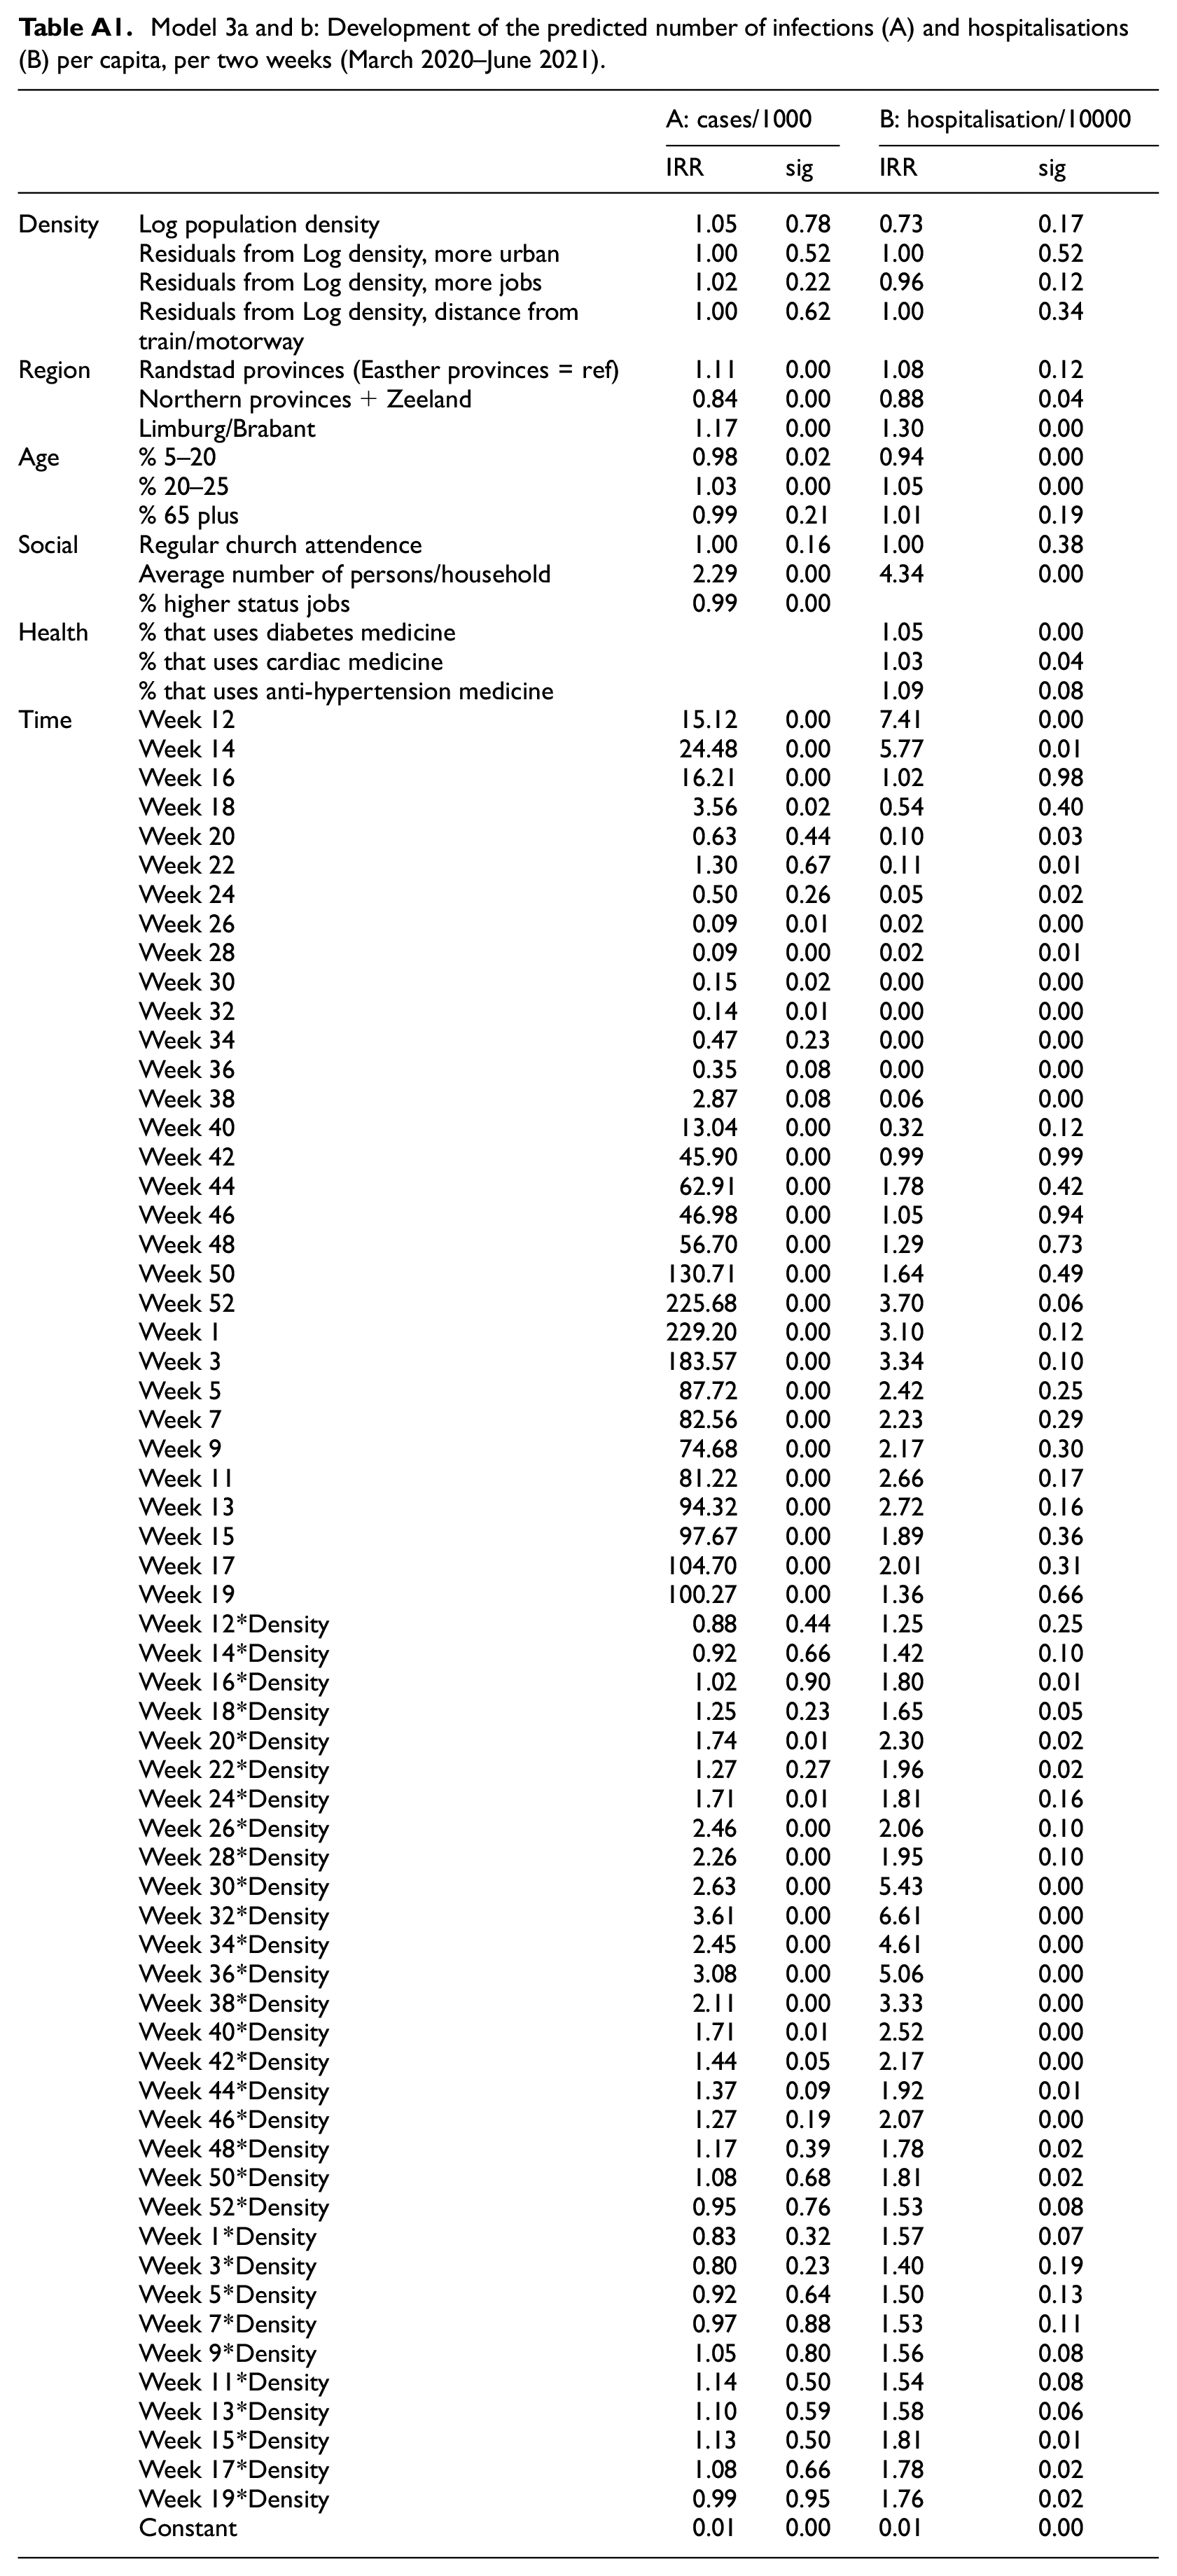
The third set of models estimates the development of the epidemic over time. Utilising the epidemiological data as a time series with observations per fortnight, the models estimate the role of population density as well as different control variables, which are the same as those used in the previous sections. The full models can be found in the Appendix. Here it can be found that apart from the main focus of this paper: population density, the model also yields some interesting results with respect to the controls. Share of young adults appears to be correlated with both higher infection and hospitalisation rates, but share of schoolchildren is significantly negative. Share of older people has no significant correlation. Church attendance is not significant, but the number of persons per household is. Average household size has a strong effect on both infections and hospitalisations. Perhaps it is a proxy for intergenerational contact, or for relatively frequent contacts more generally. Also, medicine use has a positive correlation with infection and hospitalisation. The share of higher status jobs has a weak significant negative effect on infections. To assess the effects of density in more detail, Figures 5 and 6 present the marginal effects of population density on the predicted number of cases and hospitalisations for the 12th week of 2020 until the 19th week of 2021 (week 72). The figures also include information on the containment and mitigation policies in place (as qualified in Table 1). A vertical line indicates a lockdown (its width the severity of the lockdown); a dashed line indicates a partial lifting of measures. Figures 5 and 6 show that during the first wave (weeks 10–20), population mostly correlates negatively with both predicted numbers of infections and hospitalisations. Over the course of the summer months and the first stage of the second wave (weeks 20–45), population density has a strong and significant effect on infections and hospitalisations. When lockdown measures are enacted the correlation between density and infections and hospitalisations disappears. Throughout the second peak of the second wave, density is negatively correlated again. In the third part of the second wave the relationship disappears once more.
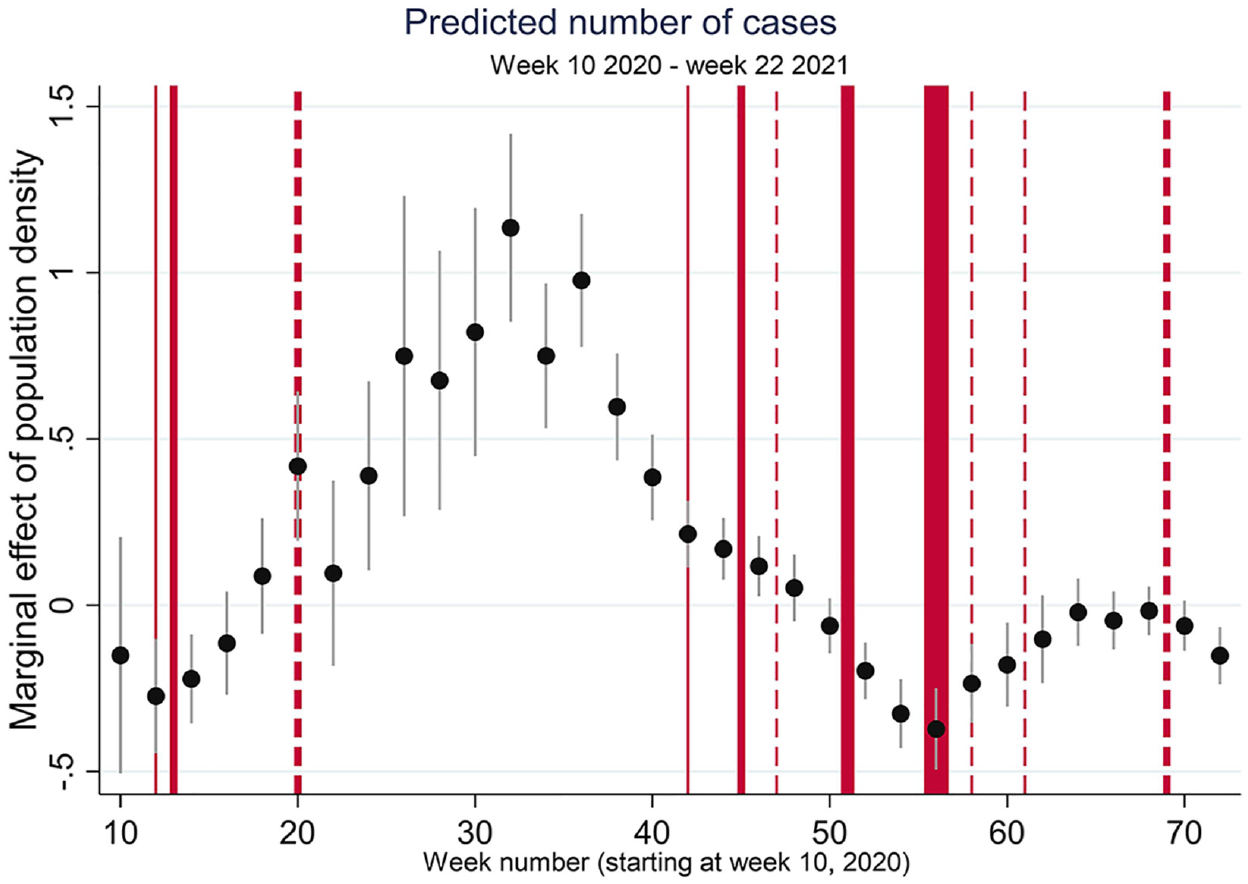
Predicted infections per week; marginal effects of population density.
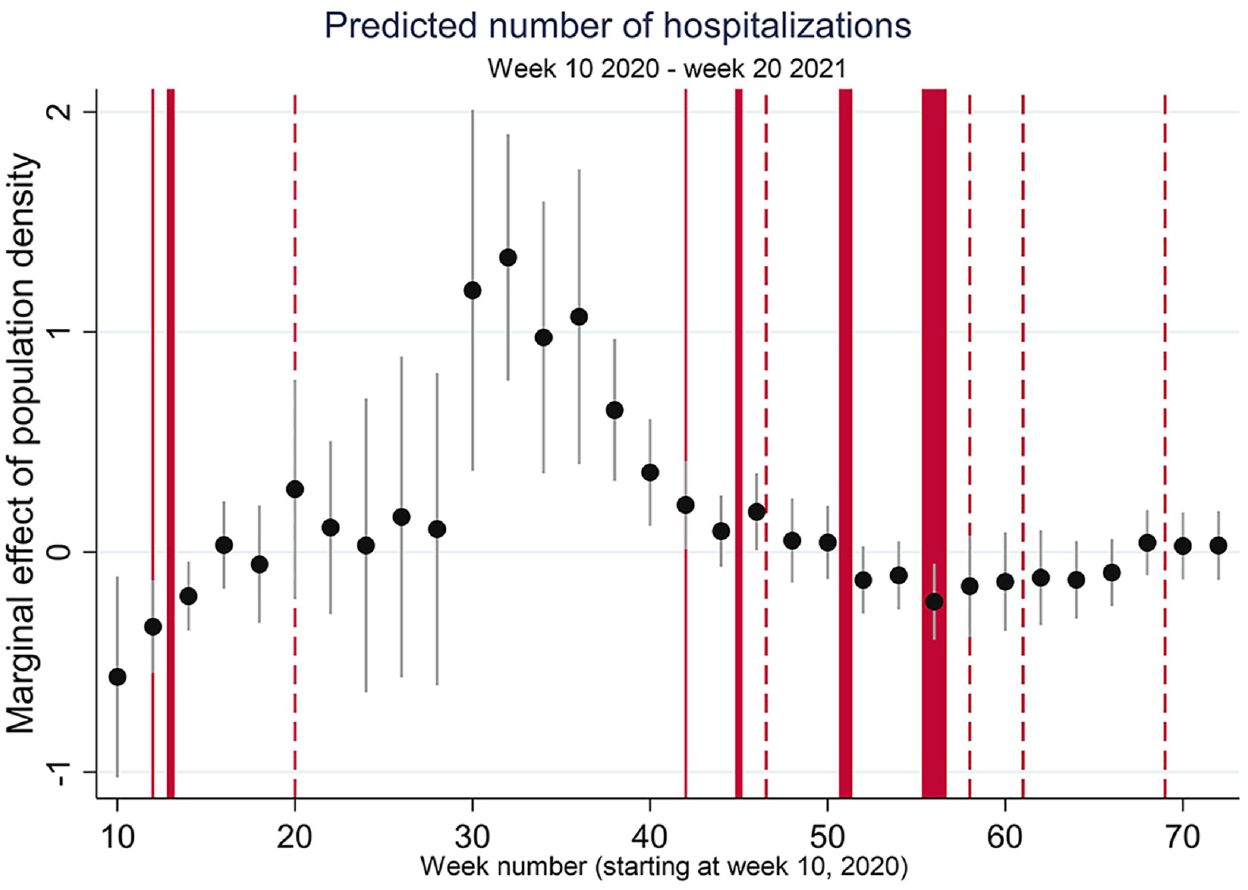
Predicted hospitalisations per week; marginal effects log10 population density.
Conclusions
The evidence of the development of the SARS-CoV-2 pandemic presented in this paper points to a complicated role of population density. The expanding literature on COVID-19 shows consistency and differences in epidemiological developments across countries, within countries, within regions and within cities (Alirol et al., 2011; Teller, 2021). In several countries, there have been periods in which large, well-connected metropolitan areas were the main epicentres of the epidemic, but not everywhere and not all the time. The evidence of this paper, focusing on the Netherlands, suggests that there is no ‘natural’ relationship between urban features, density and the spread and effects of the outbreak of an infectious disease (Wolf, 2016). This relationship is mediated by a wide range of factors that include demography, socio-economic conditions, and cultural factors, but moreover are also very strongly impacted by policy measures and the degree to which these policies are and can be complied with. This paper analysed the geographical and temporal development of the outbreak in the Netherlands. Comparing the geography of different stages of the epidemic revealed substantial differences in the role of different factors that correlate with infections and hospitalisation rates.
First, the lack of a consistent pattern and the highly localised nature of outbreaks, point to the fact that a virus is always introduced somewhere. International examples show that well connected cities are likely places where this may occur (Ali and Keil, 2007, 2008). Once introduced, specific crowding events and superspreading by highly contagious individuals play a key role in the development of the epidemic. The epidemiological role of superspreaders (Laxminarayan et al., 2020) could perhaps explain why geographical patterns appear haphazard and capricious, especially in stages of an epidemic of relatively low numbers. Nonetheless, throughout the first wave, concentration in Noord-Brabant and Limburg, initially linked to superspreading during Carnival, remained quite persistent and both provinces are still among the most affected areas. Also, during the summer months and September the large cities in the Randstad, with high densities, clearly emerged as hotbeds. Although concentrations in these parts of the country persisted for several months, these relatively high rates, however, faded by the end of the year.
Second, and perhaps most importantly, the development of the epidemic also appears to reflect the effects of mitigation policies. Lockdowns and stay at home orders affected the rate of transmission and in several instances in the past year halted the exponential increase in the number of infections. However, the degree to which the lockdowns reduced the potential for community spread through transmission varies and is contingent on the degree of compliance but also on the wider socio-demographic composition of places. The networked nature of infectious diseases implies that breaking up networks by removing nodes will reduce the speed of transmission. The size, scope and specific qualities of those networks are differently organised in space. The effects of lockdown measured reducing interpersonal contact opportunities are therefore likely to be geographically differentiated. The analysis of this paper suggests that lockdowns have most effect in places where interactions are most significantly reduced. In urban areas, where under ‘normal’ circumstances interaction opportunities are plenty, and networks are both spatially extensive and intensive (Ali and Keil, 2008; Keil, 2020; McFarlane, 2016), lockdowns take away most of the potential effect of urban densities. If lockdowns also limit movement between places and hence reduce the connectivity of places, cities are also more likely to experience this effect. During lockdowns where working from home is commended, places of encounter are closed and social distancing is encouraged, cities might lose their multiplier effect in transmissions. Moreover, households are small and generations typically live relatively segregated lives. If we consider the remaining possibilities for transmission in an otherwise partly locked down society, contagion at home should become relatively more important. Intra-household conditions, such as size but also age composition of the household, might therefore be a factor that facilitates transmission in periods of intensive lockdowns. It may be, therefore, that in periods of heavy lockdown the relative concentration of new cases is in areas where the effects of lockdowns are felt less and life is more ‘business as usual’.
Conversely, in the period in which the transmission of virus was relatively unbounded, high-density municipalities, especially in high-density regions, clearly reported the highest incidences. Also, the share of young people correlated with infections in this period. It thus appears that once a virus is present in the community and connectivities between places and social networks are intact, cities may indeed be more likely to be ‘contagious’. Nonetheless, as the case of the epidemic of SARS-CoV-2 in the Netherlands shows, geographical patterns are capricious and moreover appear to be strongly mediated by public health response and compliance. This makes a case for governance of epidemics that is spatially sensitive and takes the multiple geographies of density into account when effectively addressing outbreaks of infectious disease.
Footnotes
Appendix
Model 3a and b: Development of the predicted number of infections (A) and hospitalisations (B) per capita, per two weeks (March 2020–June 2021).
| A: cases/1000 | B: hospitalisation/10000 | ||||
|---|---|---|---|---|---|
| IRR | sig | IRR | sig | ||
| Density | Log population density | 1.05 | 0.78 | 0.73 | 0.17 |
| Residuals from Log density, more urban | 1.00 | 0.52 | 1.00 | 0.52 | |
| Residuals from Log density, more jobs | 1.02 | 0.22 | 0.96 | 0.12 | |
| Residuals from Log density, distance from train/motorway | 1.00 | 0.62 | 1.00 | 0.34 | |
| Region | Randstad provinces (Easther provinces = ref) | 1.11 | 0.00 | 1.08 | 0.12 |
| Northern provinces+Zeeland | 0.84 | 0.00 | 0.88 | 0.04 | |
| Limburg/Brabant | 1.17 | 0.00 | 1.30 | 0.00 | |
| Age | % 5–20 | 0.98 | 0.02 | 0.94 | 0.00 |
| % 20–25 | 1.03 | 0.00 | 1.05 | 0.00 | |
| % 65 plus | 0.99 | 0.21 | 1.01 | 0.19 | |
| Social | Regular church attendence | 1.00 | 0.16 | 1.00 | 0.38 |
| Average number of persons/household | 2.29 | 0.00 | 4.34 | 0.00 | |
| % higher status jobs | 0.99 | 0.00 | |||
| Health | % that uses diabetes medicine | 1.05 | 0.00 | ||
| % that uses cardiac medicine | 1.03 | 0.04 | |||
| % that uses anti-hypertension medicine | 1.09 | 0.08 | |||
| Time | Week 12 | 15.12 | 0.00 | 7.41 | 0.00 |
| Week 14 | 24.48 | 0.00 | 5.77 | 0.01 | |
| Week 16 | 16.21 | 0.00 | 1.02 | 0.98 | |
| Week 18 | 3.56 | 0.02 | 0.54 | 0.40 | |
| Week 20 | 0.63 | 0.44 | 0.10 | 0.03 | |
| Week 22 | 1.30 | 0.67 | 0.11 | 0.01 | |
| Week 24 | 0.50 | 0.26 | 0.05 | 0.02 | |
| Week 26 | 0.09 | 0.01 | 0.02 | 0.00 | |
| Week 28 | 0.09 | 0.00 | 0.02 | 0.01 | |
| Week 30 | 0.15 | 0.02 | 0.00 | 0.00 | |
| Week 32 | 0.14 | 0.01 | 0.00 | 0.00 | |
| Week 34 | 0.47 | 0.23 | 0.00 | 0.00 | |
| Week 36 | 0.35 | 0.08 | 0.00 | 0.00 | |
| Week 38 | 2.87 | 0.08 | 0.06 | 0.00 | |
| Week 40 | 13.04 | 0.00 | 0.32 | 0.12 | |
| Week 42 | 45.90 | 0.00 | 0.99 | 0.99 | |
| Week 44 | 62.91 | 0.00 | 1.78 | 0.42 | |
| Week 46 | 46.98 | 0.00 | 1.05 | 0.94 | |
| Week 48 | 56.70 | 0.00 | 1.29 | 0.73 | |
| Week 50 | 130.71 | 0.00 | 1.64 | 0.49 | |
| Week 52 | 225.68 | 0.00 | 3.70 | 0.06 | |
| Week 1 | 229.20 | 0.00 | 3.10 | 0.12 | |
| Week 3 | 183.57 | 0.00 | 3.34 | 0.10 | |
| Week 5 | 87.72 | 0.00 | 2.42 | 0.25 | |
| Week 7 | 82.56 | 0.00 | 2.23 | 0.29 | |
| Week 9 | 74.68 | 0.00 | 2.17 | 0.30 | |
| Week 11 | 81.22 | 0.00 | 2.66 | 0.17 | |
| Week 13 | 94.32 | 0.00 | 2.72 | 0.16 | |
| Week 15 | 97.67 | 0.00 | 1.89 | 0.36 | |
| Week 17 | 104.70 | 0.00 | 2.01 | 0.31 | |
| Week 19 | 100.27 | 0.00 | 1.36 | 0.66 | |
| Week 12*Density | 0.88 | 0.44 | 1.25 | 0.25 | |
| Week 14*Density | 0.92 | 0.66 | 1.42 | 0.10 | |
| Week 16*Density | 1.02 | 0.90 | 1.80 | 0.01 | |
| Week 18*Density | 1.25 | 0.23 | 1.65 | 0.05 | |
| Week 20*Density | 1.74 | 0.01 | 2.30 | 0.02 | |
| Week 22*Density | 1.27 | 0.27 | 1.96 | 0.02 | |
| Week 24*Density | 1.71 | 0.01 | 1.81 | 0.16 | |
| Week 26*Density | 2.46 | 0.00 | 2.06 | 0.10 | |
| Week 28*Density | 2.26 | 0.00 | 1.95 | 0.10 | |
| Week 30*Density | 2.63 | 0.00 | 5.43 | 0.00 | |
| Week 32*Density | 3.61 | 0.00 | 6.61 | 0.00 | |
| Week 34*Density | 2.45 | 0.00 | 4.61 | 0.00 | |
| Week 36*Density | 3.08 | 0.00 | 5.06 | 0.00 | |
| Week 38*Density | 2.11 | 0.00 | 3.33 | 0.00 | |
| Week 40*Density | 1.71 | 0.01 | 2.52 | 0.00 | |
| Week 42*Density | 1.44 | 0.05 | 2.17 | 0.00 | |
| Week 44*Density | 1.37 | 0.09 | 1.92 | 0.01 | |
| Week 46*Density | 1.27 | 0.19 | 2.07 | 0.00 | |
| Week 48*Density | 1.17 | 0.39 | 1.78 | 0.02 | |
| Week 50*Density | 1.08 | 0.68 | 1.81 | 0.02 | |
| Week 52*Density | 0.95 | 0.76 | 1.53 | 0.08 | |
| Week 1*Density | 0.83 | 0.32 | 1.57 | 0.07 | |
| Week 3*Density | 0.80 | 0.23 | 1.40 | 0.19 | |
| Week 5*Density | 0.92 | 0.64 | 1.50 | 0.13 | |
| Week 7*Density | 0.97 | 0.88 | 1.53 | 0.11 | |
| Week 9*Density | 1.05 | 0.80 | 1.56 | 0.08 | |
| Week 11*Density | 1.14 | 0.50 | 1.54 | 0.08 | |
| Week 13*Density | 1.10 | 0.59 | 1.58 | 0.06 | |
| Week 15*Density | 1.13 | 0.50 | 1.81 | 0.01 | |
| Week 17*Density | 1.08 | 0.66 | 1.78 | 0.02 | |
| Week 19*Density | 0.99 | 0.95 | 1.76 | 0.02 | |
| Constant | 0.01 | 0.00 | 0.01 | 0.00 | |
Acknowledgements
The author would like to thank the anonymous referees for their constructive comments and Lasse Suonperä Liebst for advice on the statistical models.
Declaration of conflicting interests
The author declared no potential conflicts of interest with respect to the research, authorship, and/or publication of this article.
Funding
The author received no financial support for the research, authorship, and/or publication of this article.