
Abstract
The changing nature of retail coupled with rapid technological and social developments, are posing great challenges to the attractiveness of traditional retail areas in the UK. In this paper we argue that the definitions and classifications of town centres currently adopted by UK planners and policy makers are outdated, because of their focus on retail occupancy. Instead, we propose a more dynamic definition and classification of centres, based on their activity volumes and patterns, which we obtain from footfall data. Our expectation is that adopting this activity-based approach to defining and classifying centres will radically alter the way in which they are developed and managed.
Introduction
Overall, 2018 proved to be a dire year for the UK retail sector. Major firms such as House of Fraser and Toys R Us went into administration, and a total loss of 2594 stores affecting more than 46,000 employees (Centre for Retail Research, 2019) is evidence that the UK high street is undergoing a period of disruptive change and that its future is not just retail (Wrigley and Lambiri, 2014). The subsequent need for town centres to improve community cohesion, liveability, wellbeing and sustainability, rather than just improving retail infrastructure and shopping, is central to numerous recent high street reports (e.g. Grimsey et al., 2013; Housing, Communities and Local Government Committee, 2019). In a similar vein, the National Planning Policy Framework strongly advocates for the development of a network and hierarchy of town centres that will “promote their long-term vitality and viability – by allowing them to grow and diversify in a way that can respond to rapid changes in the retail and leisure industries, and thus allow a suitable mix of uses (including housing) and reflect their distinctive characters. (Ministry of Housing, Communities and Local Government (MHCLG), 2018)”
We argue that this lack of progress is due, in part, to outdated interpretations of high streets and town centres in policy reports and documents (Cheshire et al., 2015). This has led to a myopic focus on retail development that has squeezed out other uses (Distressed Town Centre Property Taskforce, 2013). To improve the type of policy and practice that will lead to more adaptable high streets and town centres (Timpson Sir et al., 2018), we believe it is time to develop measures of high street, town or city centre performance more reflective of multifunctional uses and not purely dependent on retail. One of these measures is footfall, or pedestrian counting, which refers to ‘the number of people walking up and down a given town centre (or single street) regardless of their reasons for doing so’ (Coca-Stefaniak, 2013:24), and this is recognised in policy and planning use as a key indicator of town centre vitality and viability (DoE, 1996). As places are inherently dynamic in nature (Dolega et al., 2019), footfall provides a means to analyse dynamic patterns of behaviour and levels of activity within the urban grid.
In this paper, we focus on footfall data in order to identify distinct footfall patterns reflective of a place’s dynamism and measured user demand. As such, the research aim of this paper is to explore the potential for footfall to identify new classifications that depend on how these centres are actually used, rather than what retail is on offer.
By analysing a data set of hourly footfall data, from some 155 town and city centres, we find footfall data indicates patterns of usage and reveals the different functions a centre has; comparison shopping, speciality, holiday, and multifunctional as well as its level of attractiveness (volume of footfall). The key contributions of the paper are:
A classification of town centres that is reflective of different uses. A hierarchy of town centres based upon how busy they are. Methodology and evidence to support our classifications. Recommendations on how our classifications can support future policy and engage stakeholders to sustain town centres and high streets (Timpson Sir et al., 2018).
Literature review
Hierarchical challenges for UK town centres
The choice of relevant estimators for classifying town centres is a difficult process, as town centres have different characteristics and functions in terms of diversity of activities and uses, the type and intensity of economic activities, types and uses of property, and visitor attractions (Thurstain-Goodwin and Unwin, 2000: 307). This suggests a move towards a pluralistic understanding of town centres, as supported by recent empirical evidence (Cheshire et al., 2018; Chiaradia et al., 2012; Dolega et al., 2016) that highlights how the vast array of town centre activities and uses can reveal peoples’ spatial behaviours, the level of centre attractiveness, and the needs of their catchment area. However, there are still substantive challenges that can be attributed to policy and practical interpretations of town centres. It can be argued that the current state of UK town centres is a by-product of the ‘perfect storm’ in retailing over the past decade. The proliferation of Internet retailing and the use of out-of-town shopping destinations by consumers, coupled with dwindling disposable incomes and increasing business rates for businesses, have seriously threatened the vitality and viability of town centres (Genecon LLP and Partners, 2011; Grimsey et al., 2013; Wrigley and Lambiri, 2015). From a policy perspective, however, the planning and design of most UK town centres is based on retail location and organisation models (e.g. central place theory and retail-focused gravity models) that follow a pattern of ‘centrality’ that classifies and ranks centres in terms of chain store representation, catchment population, retail floorspace, income, number of stores, retail sales data, number of goods available, and non-retail aspects (e.g. hospitals, colleges, football teams) (Brown, 1992). These classifications aim to explain central places’ vertical mobility, and the possibility for places to jump up and down this settlement scale (Dennis et al., 2002). However, shoehorning retail establishments in town centres in the name of retail-driven town centre attractiveness and competition, with the absence of adequate data and a poor understanding of the social and economic conditions in these areas (Astbury and Thurstain-Goodwin, 2014; Thurstain-Goodwin and Unwin, 2000), has had detrimental effects on towns. These effects have, in part, contributed towards site selection policies by the multiple retailers that have led to the phenomenon of clone towns with identical retail formats in central locations, which crippled diversity (New Economics Foundation, 2004), led to small shop decline (Hallsworth, 2010), and eventually led to a reduction in retail productivity (Cheshire et al., 2015).
Retail planning policy has also failed to account for the rise of the Internet as a major alternative channel in terms of retail attractiveness. Indeed, signs of an impending decline in traditional retail due to the advent of electronic shopping were documented more than 20 years ago (Batty, 1997). As Hallsworth and Coca-Stefaniak (2018: 138) highlight, the Internet broke down the traditional understanding that dictates that ‘goods and services are locally supplied in line with local demand’, and thus led to substitution effects between Internet and bricks-and-mortar retailers, that were especially significant for non-food (comparison) retail categories and bigger centres (Weltevreden and van Rietbergen, 2009). As Jones and Livingstone (2018: 51) purport, the proliferation of Internet retail is the latest episode in the culmination of 40 years of wider structural change in the fabric of our towns, meaning that ‘any retail hierarchy is now at best blurred’. Thus, there is a need to develop a more nuanced understanding of how cities and towns operate beyond retail, by challenging the collapsed retail hierarchy (Jones, 2017) and moving towards a holistic, data-driven approach to town/city classifications. In this vein, Dolega et al. (2019) argue for a non-hierarchical classification of consumption spaces that highlights the dynamic nature and the hybridity of town centres, by using non-commercial socioeconomic data along with retail occupancy and diversity indicators. Nevertheless, as the authors argue, there is still a need to incorporate and understand new forms of data on a micro-level, such as footfall dynamics, in order to enhance the quality of town/city classification.
Footfall as measure of Centre attractiveness
Traditionally, footfall counts have been linked to the level of attractiveness of a location and its ability to satisfy catchment needs successfully, as well as an indicator of potential spend (Coca-Stefaniak, 2013; Genecon LLP and Partners, 2011). Footfall provides a means to measure daily, weekly and yearly patterns of visitor behaviour in a place (Monheim, 1998), but can also reveal gaps in terms of consumer behaviour and experience (Hart et al., 2014). Whereas location modelling provides a prediction of the potential attractiveness of a place (Dolega et al., 2016), footfall is a measure of the actual day-to-day patterns of visitors, and has the advantage of very little lag between cause and effect, indicating changes in behavioural patterns and temporal fluctuations (Lugomer and Longley, 2018) beyond consumption practices, which further highlights the importance of micro-geographical data in the ways we study town centre multifunctionality.
It follows, therefore, that footfall patterns need to be analysed in a more open-ended fashion and not strictly as a socio-economic measure of town centre success (Griffiths et al., 2013). Footfall, in this sense, can explain the complex emergent qualities of ‘live’ town centres that contribute to the process of town centredness (Hillier, 1997, 1999), by highlighting the interlinkages between different forms of activity (Vaughan et al., 2010), thus allowing us to explore how diverse town centre uses can broaden our understanding (Griffiths et al., 2013).
This links back to the research aim of this paper, which is to explore the potential for footfall to identify new classifications that are more reflective of how these centres are used. Our research is in line with other recent attempts (Lugomer and Longley, 2018; Murcio et al., 2018) to understand spatio-temporal footfall patterns and provide temporal classifications of towns and cities with the help of clustering methodologies and the use of continuous and up-to-date data. However, unlike the previous authors who use WiFi sensor technology to assess footfall activity, we use historical town centre data from a leading supplier (Springboard) accumulated from their pedestrian counters. Overall, footfall counts from some 155 towns and cities from all regions of the UK were examined, going back to 2006 in some cases. In the following section, we present the methodology behind our analytical study of UK footfall.
Classifying centres using footfall data
An earlier study using just 55 towns, identified interesting variations in monthly footfall (Millington et al., 2015), suggesting that four different classes of town existed (comparison shopping, holiday, speciality and convenience). Comparison shopping towns had a noticeable peak in footfall in the lead-up to Christmas. The holiday towns were busy in the summer and quiet in the winter. Speciality towns started to get busier after Easter, with the largest peak in footfall occurring in the summer, followed by a smaller peak before Christmas. The convenience towns had relatively flat footfall throughout the year with no noticeable peaks or troughs. In the present study we investigate monthly patterns, using more rigorous methods on a much larger data set. All the town and city centres in our study have at least one footfall counter, which is installed in the prime retail area, following a careful survey in collaboration with town centre stakeholders (see Section 1 in the online Supplemental Material). Many centres have additional counters in other shopping or night-time economy areas. For reliable analysis of monthly patterns, we include only those counters that have been in continuous operation for at least two years. We use K-Means clustering (Forgy, 1965; MacQueen, 1967) to generate ‘signature benchmarks’, so that it is possible to track changes in footfall profiles for towns and cities over time, as well as carry out classifications for the ‘here and now’. Principal Components Analysis (PCA) (Hotelling, 1933; Pearson, 1901) is used to validate the separability of the clusters and extract key distinguishing features of the monthly patterns. We also investigate the relationship between signature type and annual total footfall, to see whether some town types are busier than others. Finally, we introduce our work relating monthly signatures and total annual footfall to the traditional ‘UK Retail Hierarchy’ (popular with planners and other stakeholders).
Creating the benchmarks using K-means clustering
First of all, our data cleaning process (Section 2 of the online Supplemental Material) eliminates data from a small number of counters with serious faults, as these can badly distort clustering operations. For each town we then compute a percentage monthly footfall profile for a ‘representative year’, by combining monthly averages for all counters in a town with at least two years of data available (see Section 3 of the online Supplemental Material). Throughout our studies, decisions on exactly which towns to include in a particular analysis are determined solely on data availability. Springboard is gaining new clients every year, thus start and end date parameters imposed by a particular analysis will define the number of towns/cites that can be included.
K-means clustering aims to partition n data points into K clusters (where the value of K is selected in advance by the user), such that each observation belongs to exactly one cluster. The ‘centre of gravity’ for each cluster, known as its ‘centroid’, serves as a representative for that cluster, and its position minimises the within-cluster sum of squares in terms of the distances of each point from its cluster centroid. For this study we use the Euclidean distance metric. Silhouette values (Rousseeuw, 1987) provided some supporting evidence for our choice of K-means as our clustering method, as well as helping us determine the best value of ‘K’ (the number of clusters) to use. However, this technique is better suited to data that forms more cleanly separated clusters than occurs with our footfall data (see Section 4 of the online Supplemental Material). Principal Components Analysis proved to be a more reliable validation method for us (explained later).
The K-means clustering algorithm, by its very nature, will generate a new set of centroids for every new set of input data. For this reason, in early 2017 we used K-means to create a set of static benchmark centroids to make it possible to track changes in town centre signatures over a period of time. All the location data available up until the end of 2016 (125 centres) was used, provided that it covered at least two years for each counter. We tried K = 2,3,4,5 and found K = 4 produced clusters of towns showing recognisable ‘within cluster’ features, following a detailed examination of which towns appear in each cluster. The four resulting centroids which form our benchmarks for future classifications are illustrated in Figure 1. We name them as ‘comparison shopping’, ‘holiday’, ‘speciality’ and ‘multifunctional’.
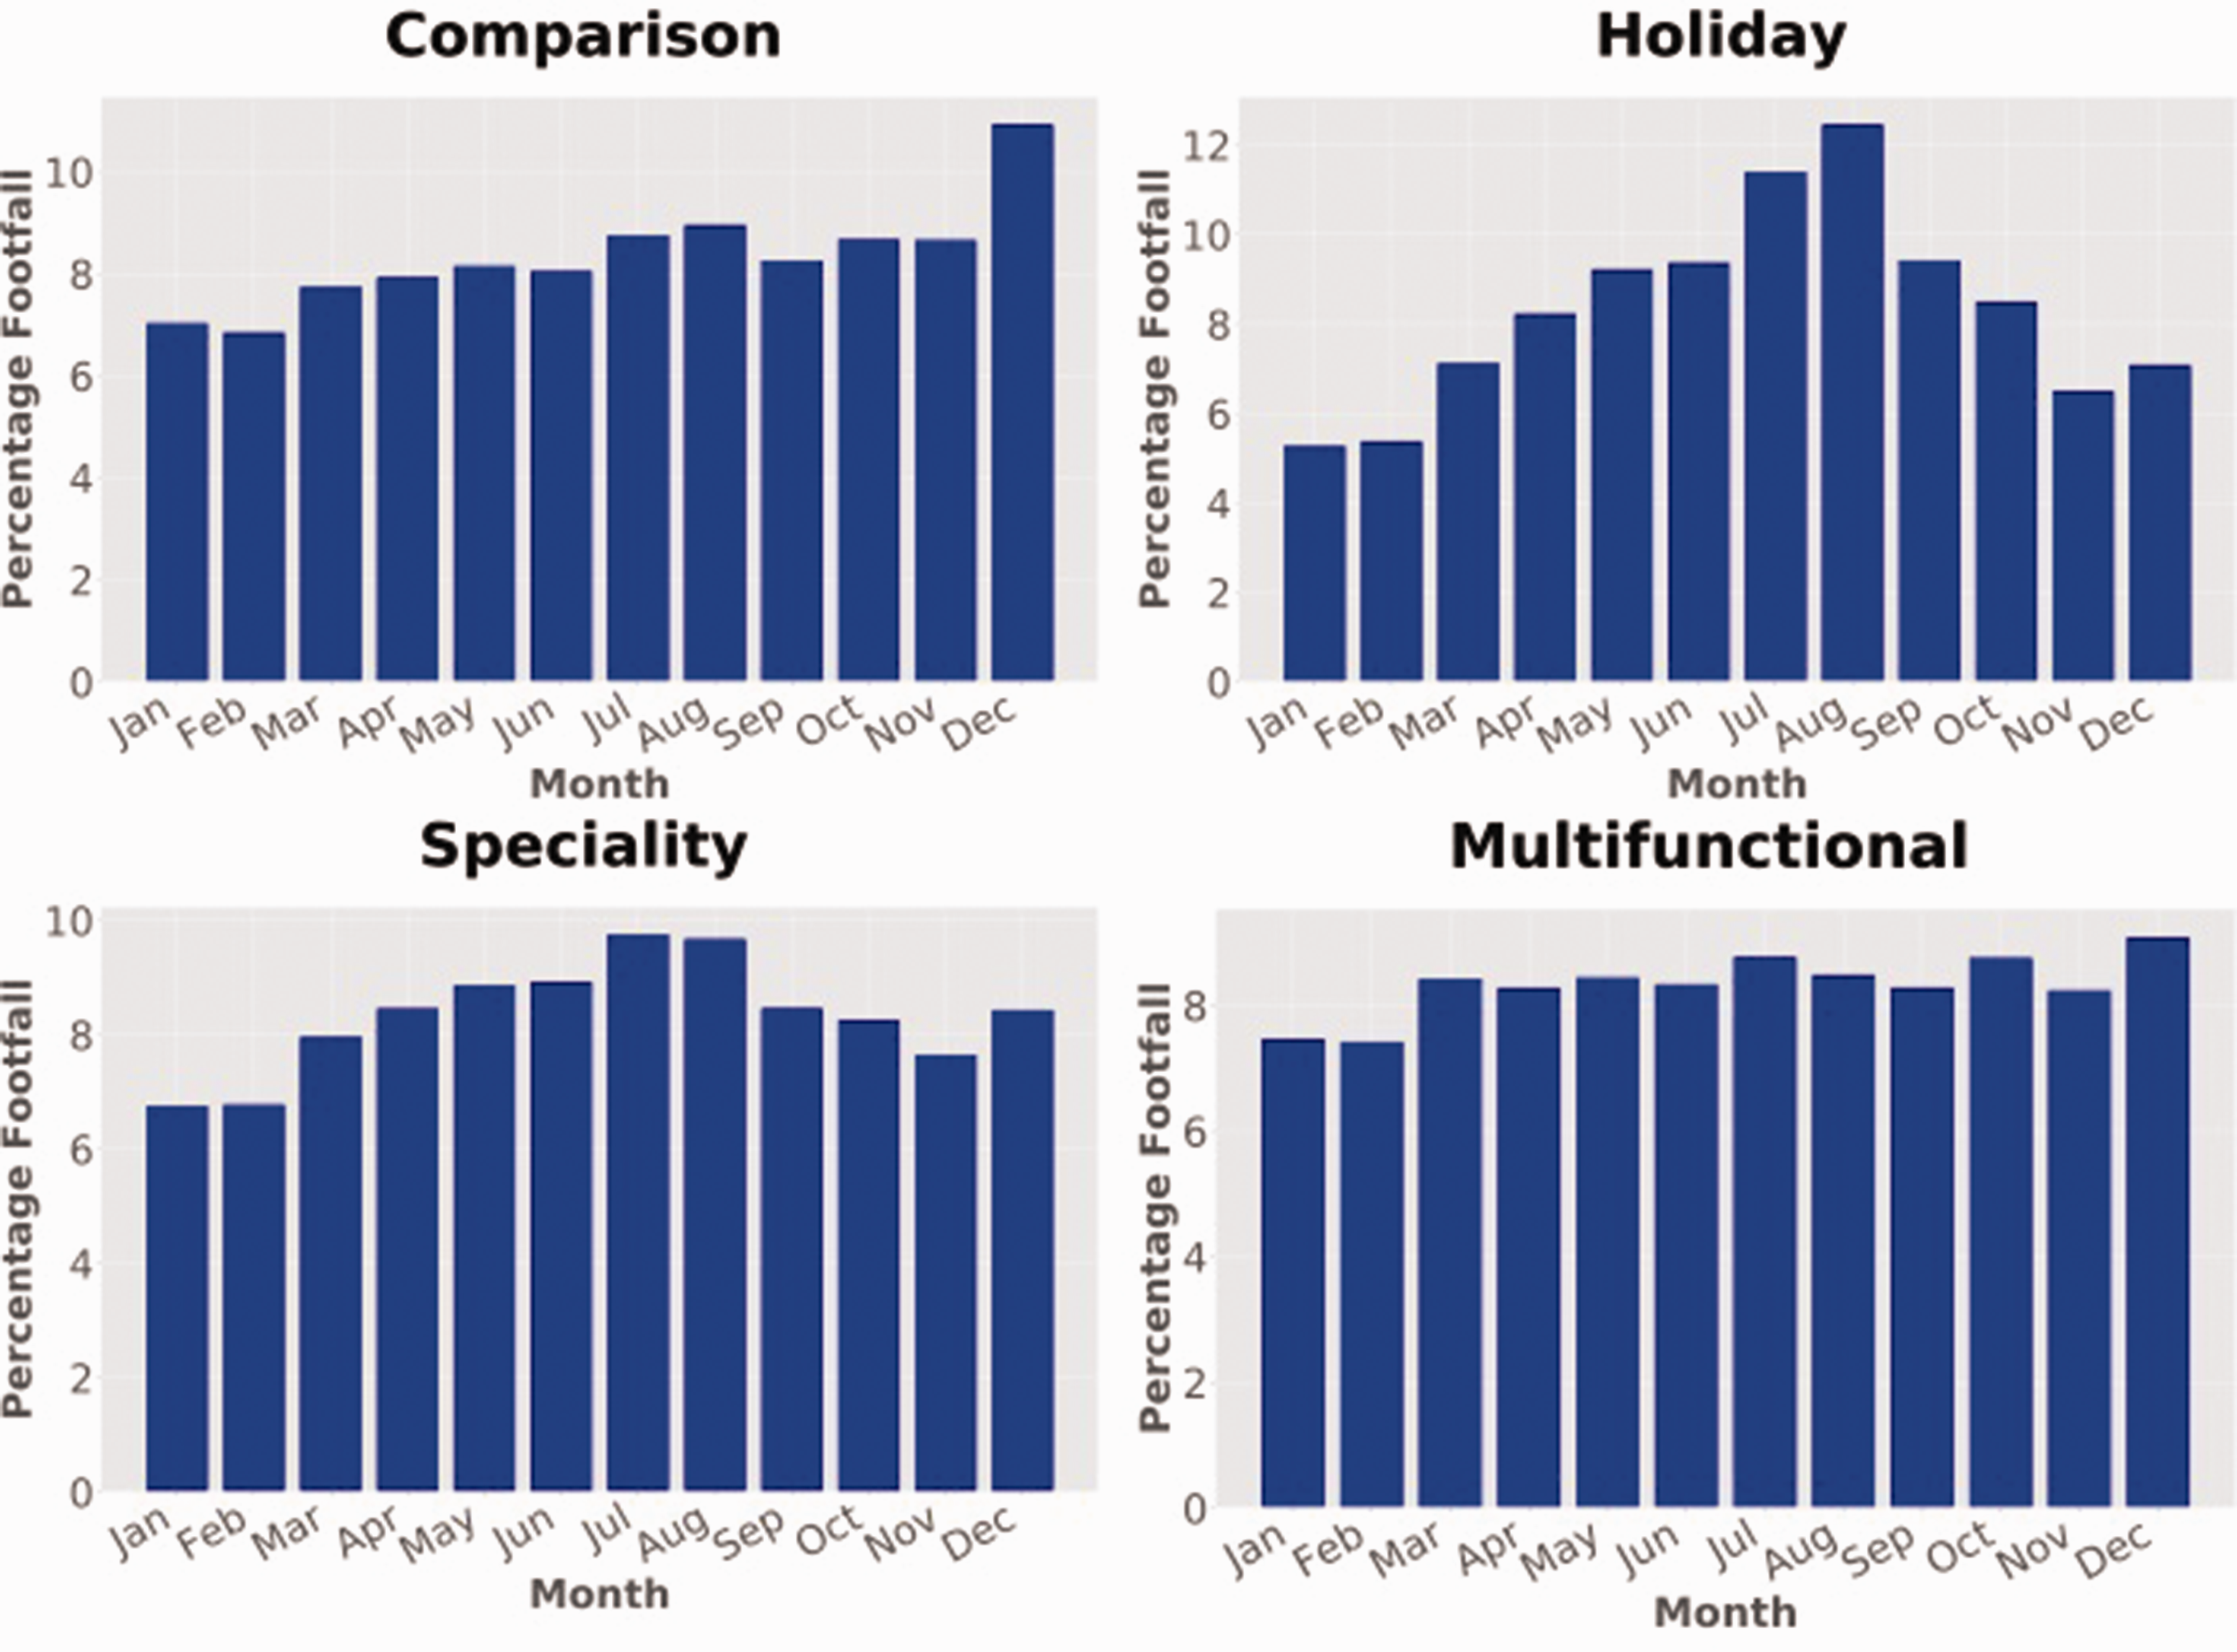
Four distinct monthly footfall centroids.
We then use Principal Components Analysis (PCA) for two reasons: (1) to validate the four different classes, and (2) to identify the key months that distinguish between them. From Figure 2 (left) it can be observed that 80% of the variance is explained by the first two principal component, PCA1 and PCA2. The ith principal component can be computed for any particular retail centre, j, by evaluating the sum of the products of the 12 loadings

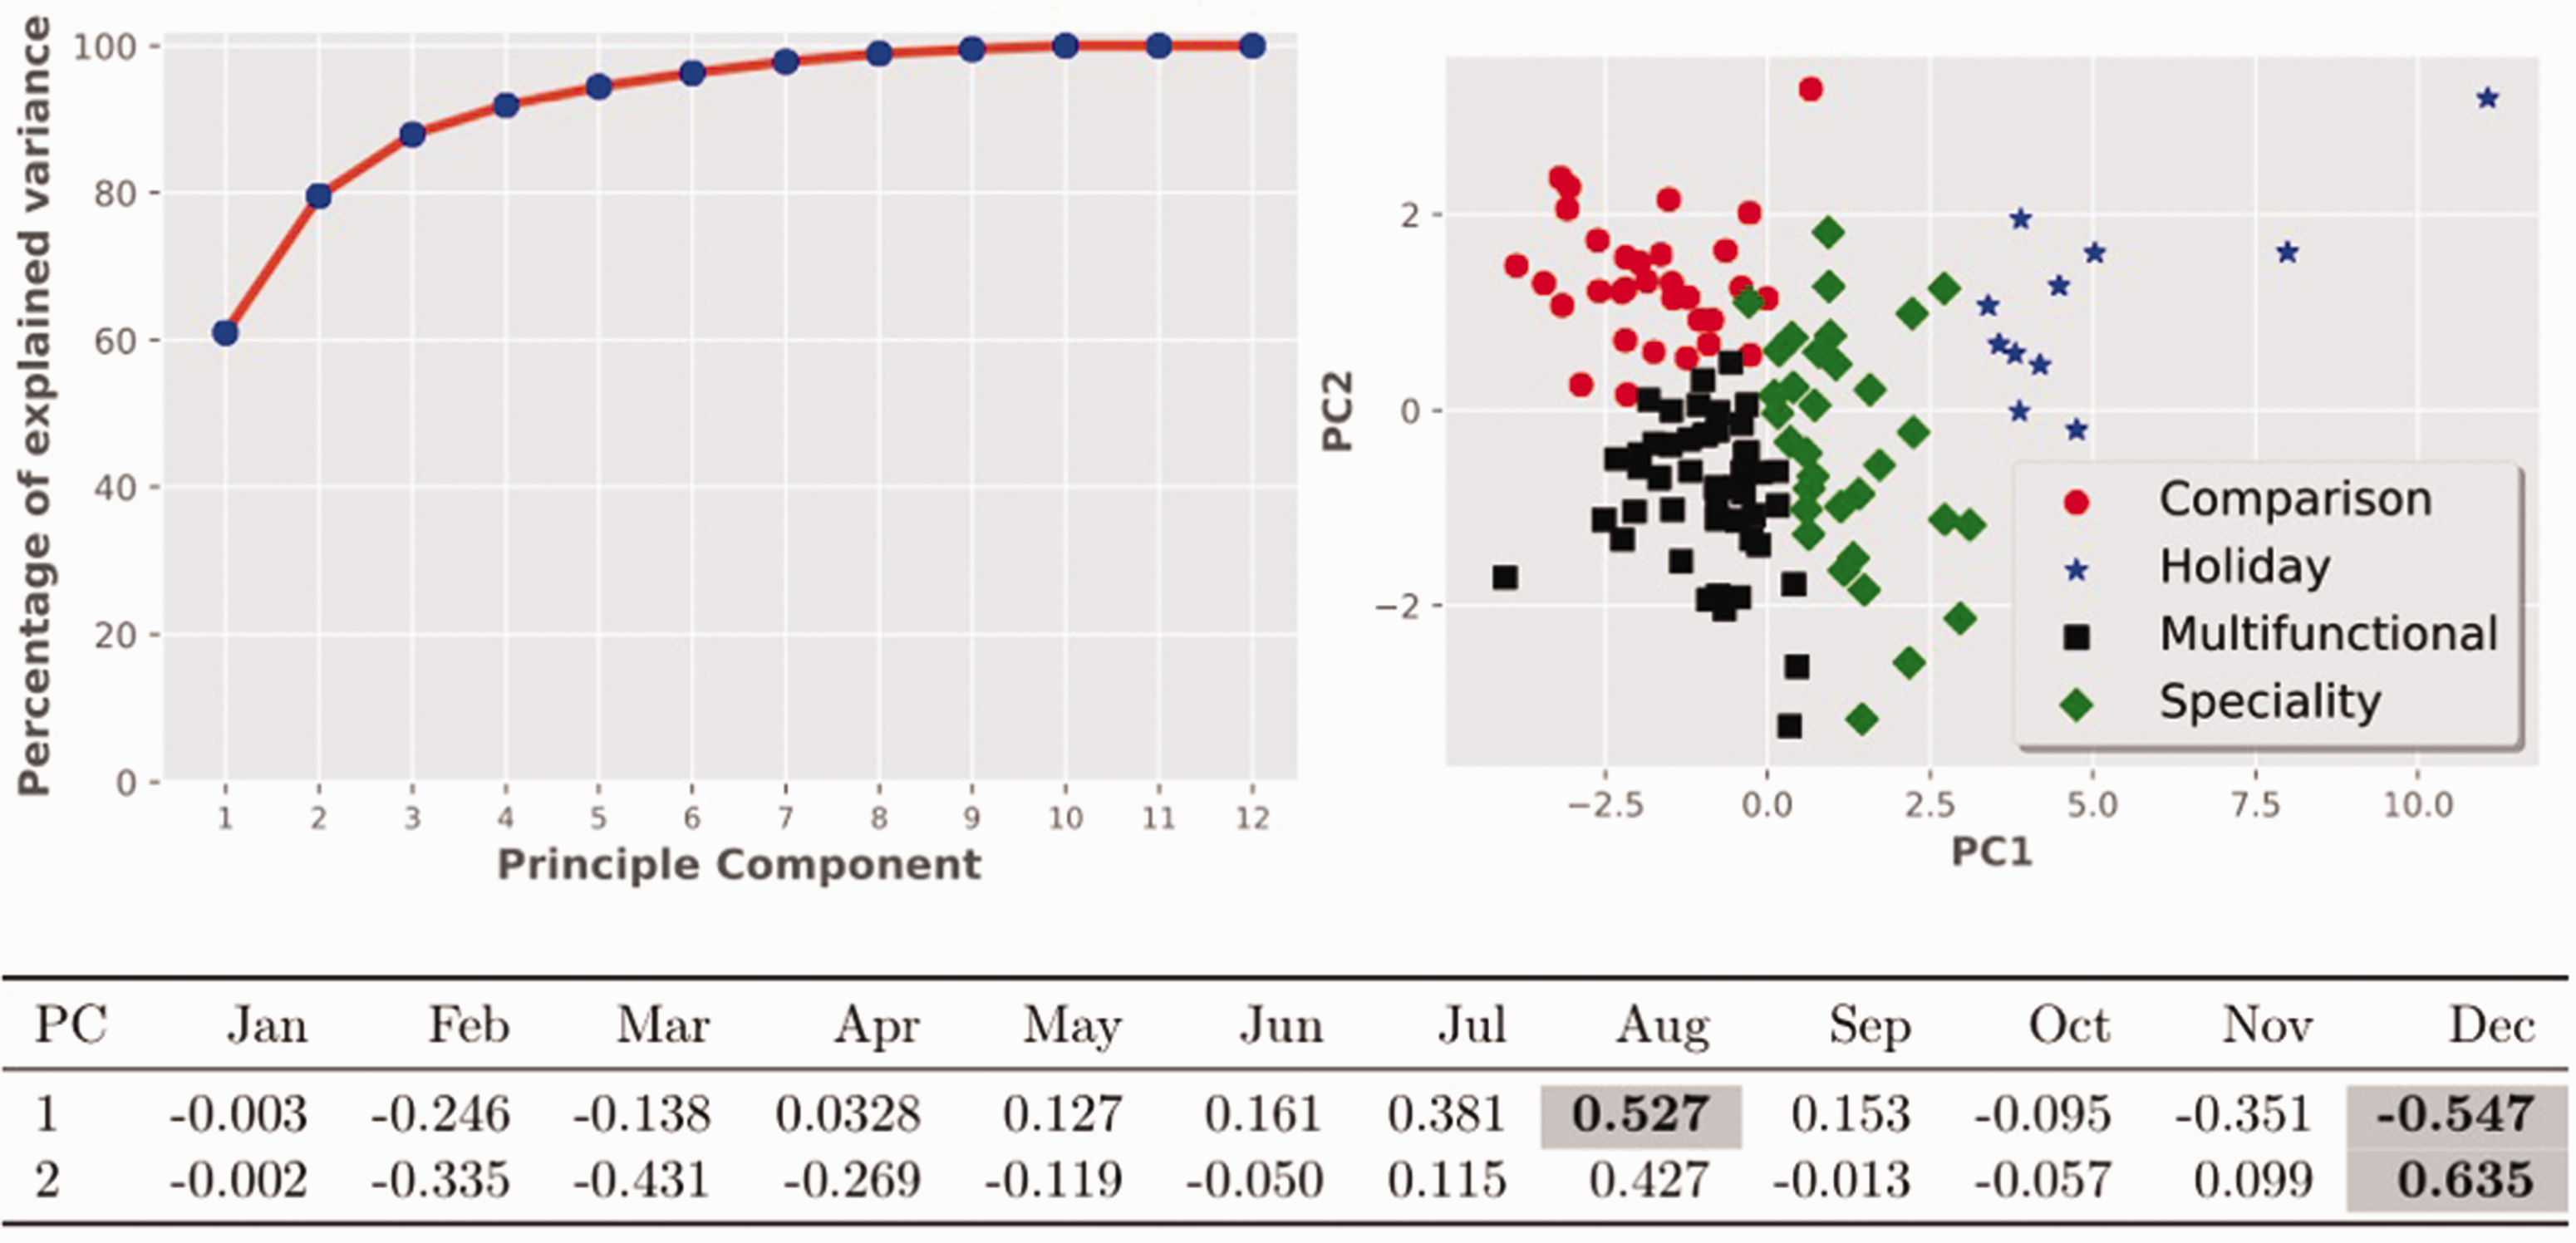
Left: PCA percentage of explained variance. Right: Scatter Plot of PC1 versus PC2 for 125 town and city centres. Bottom: Loadings for PC1 and PC2, showing key months of August and December.
Using the benchmarks to compute up-to-date signatures
‘Fixing’ our benchmarks provides a mechanism to observe changes in the signatures of individual towns in the coming years. For the purpose of this study, we computed a set of signatures using all the data available (at least two years of each counter) for 155 towns and cities, up to and including December 2018, and then recorded the Euclidean distances of these signatures from each benchmark centroid, classifying that town according to the closest match. The results obtained are 33 comparison, 16 holiday, 50 speciality and 56 multifunctional (see Section 5 in the online Supplemental Material for a map and a full classification of the towns). Examination of our signature classifications provide a good match with our expectations, for typical town types. For example, 15 of the 16 holiday towns are by the sea, and all the comparison towns, apart from one, are cities or large towns (the exception is Ballymena in Northern Ireland, which is a special case because it is relatively isolated, with no major towns nearby). Many speciality towns are either by the sea, close to it, or have a significant historical or cultural offer. The multifunctional towns have a broader range of profiles, as mentioned previously. Although we also tried tracing changes in signature classifications for towns and cities based on three year moving windows, we concluded, that the results are not of sufficient interest at this stage to include in this paper, with no significant overall trends observed (see Section 6 in the online Supplemental Material). It is worth mentioning that we also experimented with hierarchical clustering, which substantially verified our K-means classification (see Section 7 of the online Supplemental Material).
Key characteristics of footfall signatures
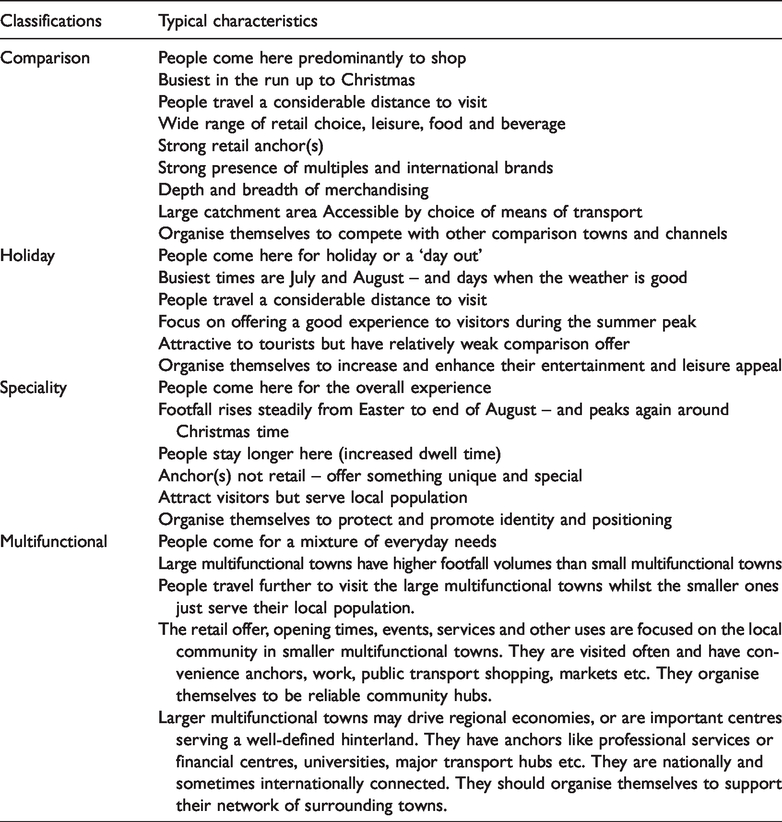
The key features of our classifications distinguish between a shopper economy, a visitor economy, and an economy focusing mostly on the ‘everyday’ (e.g., employment, regular shopping, accessing public transport, etc., see Table 1). Furthermore, the comparison, holiday and speciality centres validate the town types hypothesised in the earlier study Millington et al. (2015), whilst the multifunctional type matches the profile previously referred to as ‘convenience’. We renamed this type because the earlier classification contained only small and medium sized towns, whilst in this new study (using a larger data set) several large towns and cities also presented with this pattern, thus we decided that ‘multifunctional’ is a more fitting term for a range of centres that share a fairly flat footfall profile throughout the year, because of a regular pattern of use by people visiting the centre for a variety of reasons. The volumes of footfall are indicative of the catchment areas these people are drawn from, so large multifunctional centres (cities) are drawing people from a wider area than the small multifunctional centres (towns), that are serving a local catchment. Below we present an example of each of our town types.
Key locational characteristics of the four town types.
Comparison: Manchester is a major UK shopping destination. In 2017 it was ranked by Colliers (Blackett, 2017) as the leading retail centre outside of London. Manchester is consistently rated highly for its proportion of premium and luxury retail, range of retail choice, lack of retail vacancy, strength of retail rents and the amount of consumer spend. Manchester has strong retail anchor(s) like Harvey Nichols, Selfridge’s and a 150,000 ft2 Primark. The strength of Manchester’s retail offer means it attracts shoppers from a large catchment area (including international visitors) and is easily accessible by a choice of transport modes. Management and marketing strategies are focused on competing against other comparison centres. Investment has been made into a free bus service, TV and radio advertising campaigns and Christmas markets in order to draw shoppers away from The Trafford Centre (a major out-of-town retail development).
Holiday: Blackpool, although not as popular with holiday makers as it once was, it still attracted 18 m tourists in 2017, according to a recent economic impact survey cited in Blackpool’s local paper (The Blackpool Gazzette, 2017). These tourists may visit the shops but, unlike comparison towns, the retail offer is not the main anchor. Instead visitors to Blackpool are attracted by the town’s significant natural asset, the seaside, as well as the range of other attractions that are concentrated in Blackpool, like the Promenade, the Pleasure Beach, the piers, the lights, and the Winter Gardens (Edensor and Millington, 2018). Marketing and management strategies are focussed on targeting tourists and making sure that they are satisfied. Because the retail/service offer is focused on serving holidaymakers and day-trippers, during the summer months, much of the merchandise and offer is not relevant to the local catchment. Further, as many businesses shut down completely during the winter months, this can make for a rather bleak experience for local residents (The Guardian, 2018).
Speciality: Windsor, in common with holiday towns, attracts a large number of visitors. However, according to a recent visitor survey by the local council (Royal Borough of Windsor and Maidenhead, 2017), the majority of these (89%) are day visitors. The same survey also identified Windsor Castle being the main reason people visited the town. In Windsor, heritage is the ‘anchor’ that attracts footfall, especially during the summer months, but the town also has a strong retail offer. In 2014, in the most recent town centre study, undertaken by (Cushman and Wakefield, 2015) it was ranked just outside (107) the UK’s Top 100 centres. In the same report (p. 3), the consultants describe the town as having ‘an established ‘twin’ role serving local, day-to-day shopping and service needs in addition to the needs of tourists and day-trip visitors’. Management and marketing strategies in the town reflect this with a wide variety of civic, cultural and community groups focussed on protecting and promoting the town’s uniqueness. These groups co-exist alongside the more standard ‘visit Windsor’ marketing campaigns, focussed on attracting national and international tourists.
Multifunctional: Altrincham is perhaps not as widely known as the other settlements chosen as examples of the various town types. Altrincham was the winner of England’s Best High Street in 2018. Accepting the award, Elizabeth Faulkner, CEO of the town’s Business Improvement District, described the town as a ‘modern market town’ and ‘a great place to live, work and visit’. Encouraging/facilitating a diversity of uses in the town has been at the heart of its marketing and management strategies (Parker et al., 2017). Over recent years a variety of footfall anchors have been reinstated or upgraded in the town, including a library, a transport interchange and a hospital. In addition, co-working spaces have been encouraged, as well as in-fill residential, meaning more people live and work in the town. On the back of this, retail has been revitalised, especially with the reinvention of the traditional market hall into a food hall, along with an influx of independent retailers.
An activity hierarchy
For annual footfall volumes, we identify the counter in the busiest part of each of our 155 centres, and for each centre compute the arithmetic mean of all full years of data available. Our data show that the comparison towns are typically busier than the other three town types (see Section 8 of the online Supplemental Material). We also look at our findings in the context of the ‘UK Retail Hierarchy’. Whilst many different interpretations of the retail hierarchy exist, in practice most planning authorities in the UK designate centres using a simple hierarchy (major city; regional centre; sub-regional centre; major town; town; district). Before our analysis could begin, the designation of the 155 towns and cities in our data set was established. There is no central listing of this information, so the research team located each one through searching planning documentation, available on-line (see separate Spreadsheet in the Supplemental Material). This search enabled centres to be assigned a designation (note: we had no districts in the data set).
Using a Kruskal–Wallis test to compare the annual footfall across each of the five categories in the hierarchy, we discovered very strong evidence for a difference in footfall volume between at least two of the groups (χ2 = 86.525, df = 4, p < 0.001). Figure 3(a) illustrates the key results. Although the boxes indicate a clear decreasing trend as we move down the retail hierarchy, Dunn’s pairwise tests do not show any significant difference in footfall volume between adjacent hierarchy members, with the exception of sub-regional centre and major town. However, these tests show a significant difference in footfall volumes between all non-adjacent pairings. (The full results of Dunn’s pairwise tests can be found in Section 9 of the online Supplemental Material.)
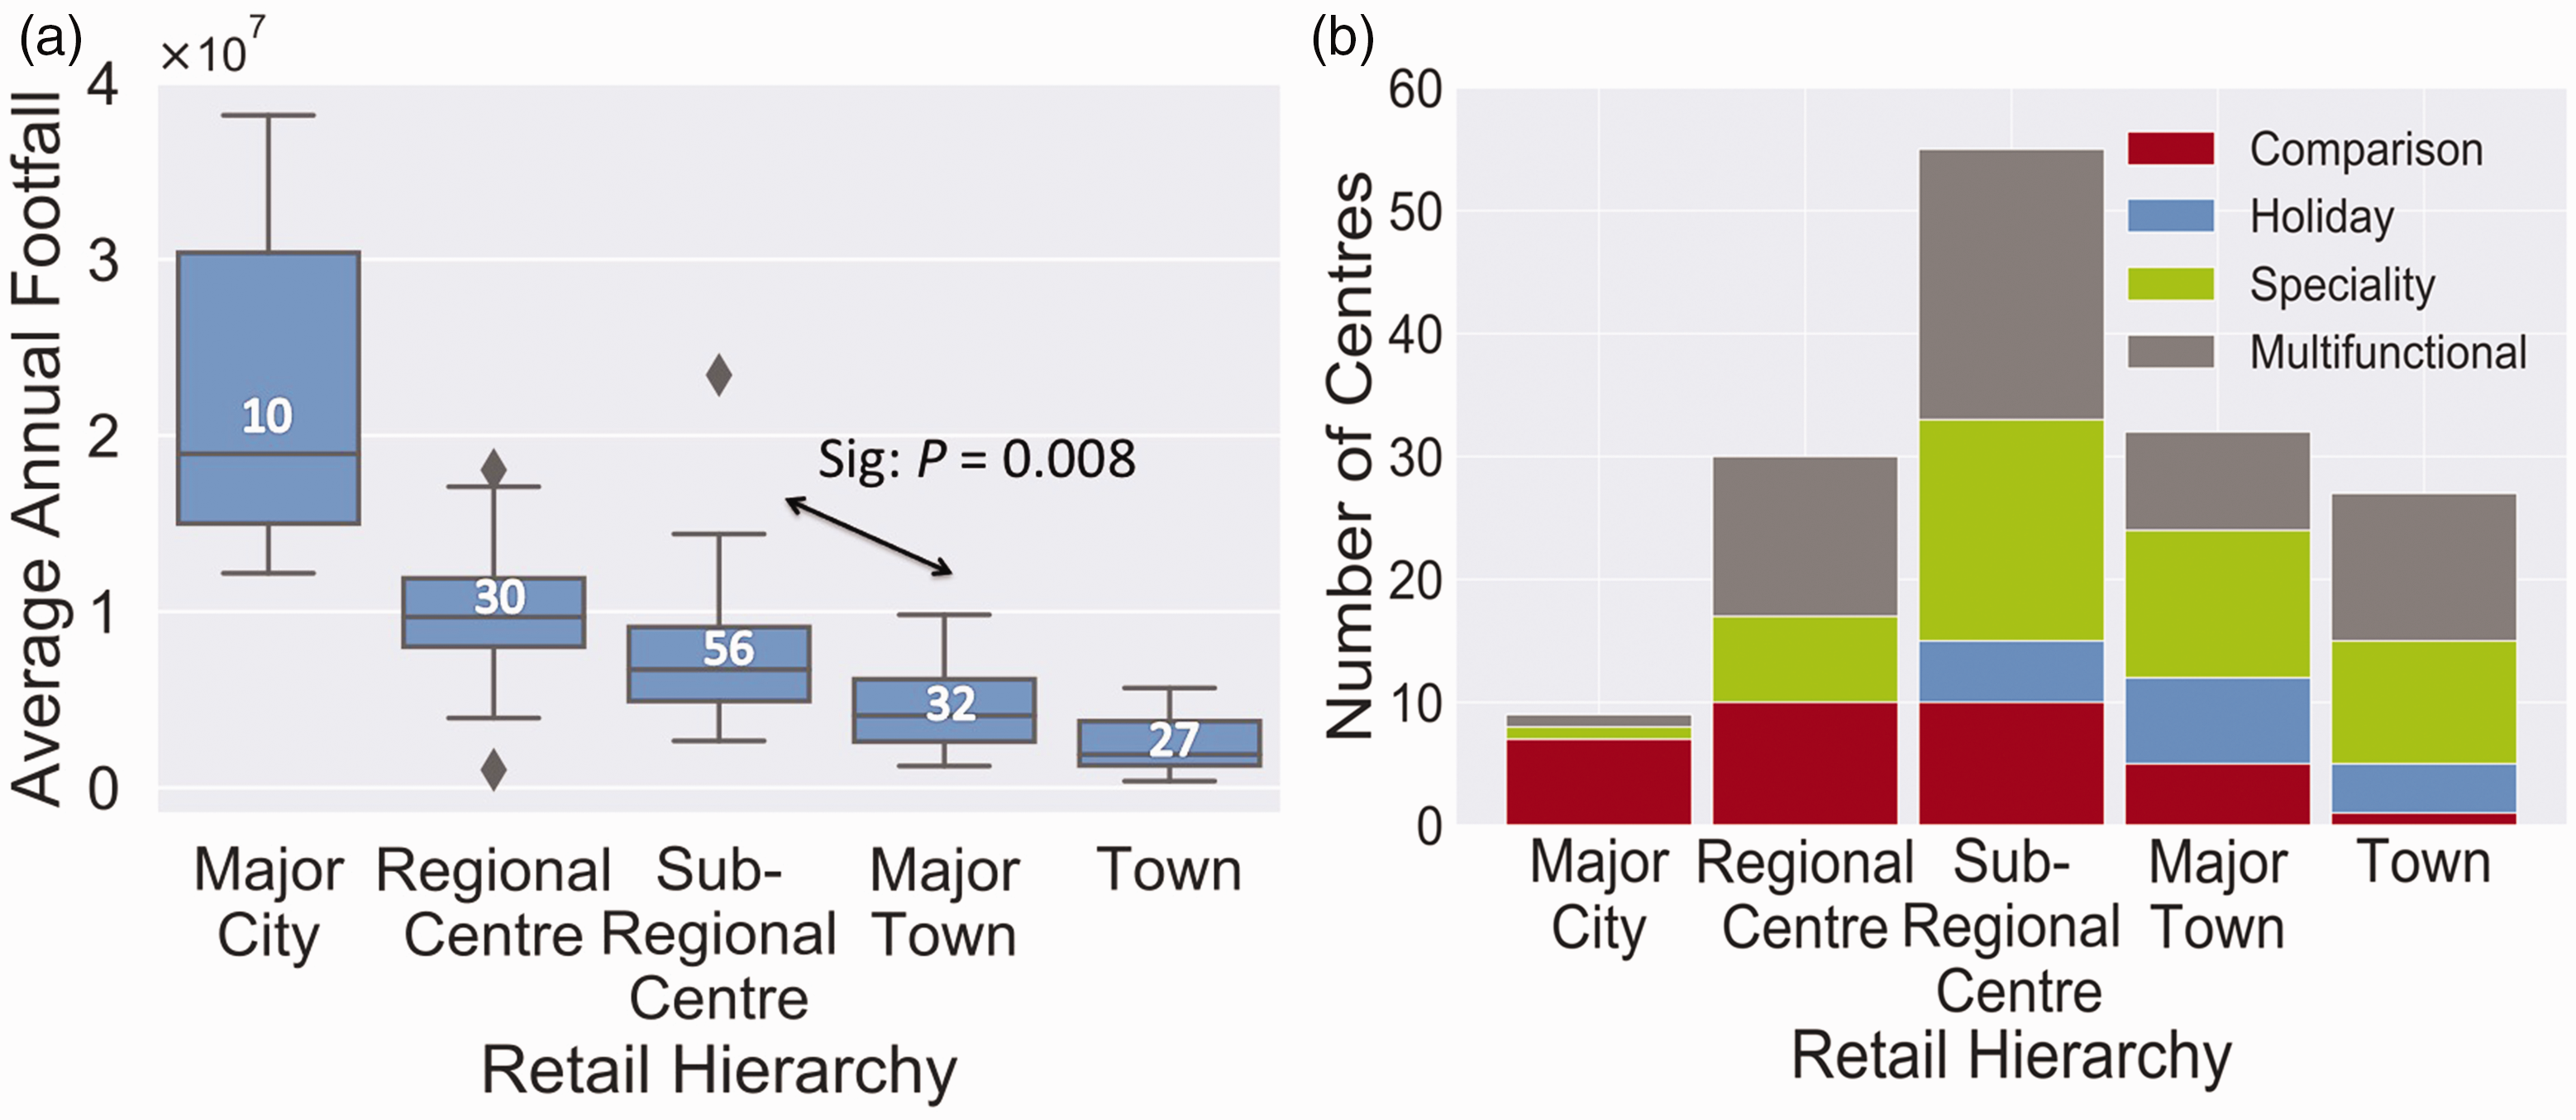
(a) Average annual footfall for centres according to their positions in the retail hierarchy. (b) Distribution of signature types for 155 centres UK, according to their position in the retail hierarchy.
There are two possible reasons why there is no significant difference in footfall volume between three of the four adjacent levels. First, there may be more levels than are needed, in terms of representing a significant difference in attractiveness of the centre. Second, the existing designation of towns and cities may not reflect their ability to attract footfall. This may be because they have been incorrectly designated, or, footfall may not be an indicator of attractiveness. We think it is more likely to be the former, as there are no standard methods of establishing a designation, or even guidance, in planning policy.
Figure 3(b) illustrates the distribution of signature types for our 155 town and city centres. It would appear that major cities are predominantly comparison types, but the other levels in the hierarchy are made up of a variety of types. However, there is only one example of a comparison type at the town level, and there are no holiday towns in the major city or regional centre categories. A χ2 test shows that there is a significant difference in signature distribution between at least two levels in the hierarchy (χ2 = 34.837, df = 12, p < 0.001).
A Fisher test using the Bonferroni correction for multiple comparisons, indicates that there is a significant difference in the distribution of signature types between major cities and sub-regional centres, major cities and major towns, major cities and towns, regional centres and major towns, and regional centres and towns. A further Fisher test showed a significant difference between the way comparison and holiday types are distributed in the hierarchy and also between comparison and speciality and comparison and multifunctional types. (More details in Section 10 of the online Supplemental Material.)
Discussion
Whereas understanding the spatial patterns of retail has been a huge area of research (Clarke et al., 1997) for many years, from the hierarchical based patterns of central place theory (Christaller, 1933), most traditional methods have taken little or no account of growing trends such as online shopping and out-of-town malls. In addition, such techniques have problems with defining the catchment area and the relative position of different centres in terms of attractiveness and the geographical extent of retail influence (Dolega et al., 2016). The under-representation of non-retail considerations in such classifications has also been identified as problematic (Hall et al., 2001), as has the functional view of retail hierarchy which fails to account for the demands of the customer (Reynolds and Schiller, 1992). Unlike the multiple data sources used by these studies, the present research has focused solely upon extracting information about a location from footfall data. Rather than making assumptions about potential numbers of visitors based on catchment, or assessing ‘attractiveness’ according to the retail offer, counting footfall tells us how many people are actually using a place. As footfall has been cited as the ‘lifeblood’ of a town centre’s vitality and viability (Birkin et al., 2017; Dolega et al., 2019), our first contribution is to propose footfall as a universal measure of activity, that provides a means of classifying place based on the patterns and volumes of usage.
In relation to patterns of usage, our results reinforce the message that town centres are not dying, just changing. The Principal Component Analysis (PCA) uncovers shopping as being one of two main components of variations in footfall (December peak), the other being tourism (August peak). All towns serve an everyday function, pulling people in regularly for work, transport, education as well as some shopping and leisure attractions to visit (bars, restaurants, cinemas, etc.), but some locations are attracting greater numbers of shoppers (for a comparison shopping offer) or visitors (for day trips or holidays) or, in the case of speciality towns, a mixture of people shopping or visiting, or more likely, people shopping and visiting. Because the PCA identifies the months of August and December as key indicators of signature, even locations that do not invest in hourly footfall counting technology should be able to conduct basic pedestrian counts during these months to get some indication of their signature type. We discuss some of the typical characteristics of these signature types in Table 1.
Nevertheless, whilst spot-checks on footfall may result in some data that can be compared to the footfall signatures we have identified, we believe there are distinct advantages to having ongoing, continuous, and reliable footfall counts. As far back as 1994 government guidance strongly encouraged local authorities to measure footfall as a key indicator of vitality and viability. In the latest version of the National Planning Policy Framework planning authorities are expected to define a network and hierarchy of centres and promote their long-term vitality and viability. However, no definition of such a hierarchy, or guidance as to the different order, or scale of centres, that might populate such a hierarchy are contained in the guidance. In practice, many local planning authorities designate their centres using a traditional retail hierarchy, but there are other classifications that are also widely used, from providers such as CACI and Javelin, all of which are heavily weighted towards multiple-retailer occupancy. Our analysis of the relationship between the simplified retail hierarchy used in most planning documents and footfall indicated that there is no significant difference in footfall between major cities and regional centres, regional centres and sub-regional centres or major towns and towns. Looking at adjacent pairs of categories, only sub-regional centres had significantly more footfall than major towns. This suggests that current designations are a poor proxy for attractiveness, and planning decisions that are based on these may well be flawed. With a lack of objective and, arguably, relevant criteria being used to designate a position in the hierarchy, it is understandable why there may well be confusion. Given how poorly the traditional hierarchy relates to footfall volumes, it could be worth considering removing some of the existing levels, to produce a reduced hierarchy (Major City, Regional Centre, Town, District) as this may make it easier for planners or other decision makers to define networks and hierarchies of centres. This reduced hierarchy could also be used as a benchmark, to compare the other hierarchies and rankings, provided by commercial data providers. This would enable local authorities to use the data provided by retail consultants with more consistency and monitor the evolution of their centres in a more consistent fashion.
Finally, our study also shows the significance of reliable, on-time and accurate data at the micro-level, which can contribute to more systematic, evidence-based decision-making. Other studies of footfall patterns in town centres have been limited by manually collected data samples (Lai and Kontokosta, 2018; Monheim, 1998) whilst Oyster cards and Twitter data have proven useful for studies involving mass-mobility (Sulis and Manley, 2018). Alternative technology-based footfall counting suitable for town centres includes WiFi data (Poucin et al., 2018), mobile mast location and call records (Xu et al., 2018). However, for both WiFi and mobile data, signal coverage can be variable, and WiFi connection reliability can also be an issue. In addition, these forms of data depend upon individuals using social media or mobile enabled devices. On the other hand, Springboard data from footfall counters have the advantage of recency, accessibility, anonymity and is not dependent upon any form of technology used by an individual. It is therefore a much more inclusive measure.
Conclusions
In this paper, we explored the potential for footfall to identify new classifications of centres, ones that are more reflective of how places are used, now retail is not the anchor it was. We call these classifications footfall signatures and have identified four types, comparison shopping, speciality, holiday and multifunctional. We also proposed that footfall could be a useful measure of attractiveness; our analysis has verified this and enabled us to propose a reduced hierarchy of centres with four categories (Major City, Regional Centre, Town, District).
As expected, comparison shopping locations are often associated with higher annual footfall overall, as this group contains the major centres where multiple retailers prefer to concentrate. Nevertheless, there are smaller centres with comparison shopping signatures in our data set. This challenges the current thinking that all smaller towns have too much retail and that retail premises should be converted to other uses, like residential. We argue that the identification of signatures from activity patterns offers towns far more insight into their purpose and can help local decision makers pursue the most appropriate developments.
The footfall obtained from continuous footfall counting is an objective criterion by which planners can sense-check the designation of centres in networks and hierarchies. Footfall is a very responsive indicator as it based on the real-time behaviour of people, rather than estimates of catchment or shopper populations (which are a function of multiple-retailer representation) or data from telephone surveys of peoples shopping habits, which suffer from all the usual methodological flaws. Nevertheless, footfall data, like any other source of data is not without its weaknesses. First, not all locations may be able to invest in the technology needed to gather reliable footfall data. Second, the counters may not always be located in the busiest parts of town, as hot-spots change over time. Third, pedestrian flows can be disrupted by all sorts of factors, from the weather to roadworks. Finally, whilst we have included 125–155 towns in our classifications and experiments, there are more than 1300 town and city centres in the UK Cheshire et al. (2018).
We believe the identification of signature types will help understand the changing nature of town centres and high streets and help the process of adaptation. Local authorities and other place management bodies (e.g. Business Improvement Districts) are ill-equipped to manage change and make decisions that are not based upon estimating future retail capacity, because, at present this is the only method they have. Nevertheless, it is important to understand footfall signatures as merely indicative of a more dominant function of a location – the footfall behind each signature represents every single visit made with every single purpose. In other words, people will be going on holiday to comparison shopping centres, similarly some people will be shopping in holiday towns etc. In the same way existing classifications have reduced the function of all towns to retail, we would not want the same mistake to be made with our signatures.
Supplemental Material
EPB911412 Supplemental Material1 - Supplemental material for Footfall signatures and volumes: Towards a classification of UK centres
Supplemental material, EPB911412 Supplemental Material1 for Footfall signatures and volumes: Towards a classification of UK centres by Christine Mumford Cathy Parker, Nikolaos Ntounis and Ed Dargan in Environment and Planning B: Urban Analytics and City Science
Supplemental Material
EPB911412 Supplemental Material2 - Supplemental material for Footfall signatures and volumes: Towards a classification of UK centres
Supplemental material, EPB911412 Supplemental Material2 for Footfall signatures and volumes: Towards a classification of UK centres by Christine Mumford Cathy Parker, Nikolaos Ntounis and Ed Dargan in Environment and Planning B: Urban Analytics and City Science
Footnotes
Declaration of conflicting interests
The author(s) declared no potential conflicts of interest with respect to the research, authorship, and/or publication of this article.
Funding
The author(s) disclosed receipt of the following financial support for the research, authorship, and/or publication of this article: This work contains findings from the Innovate UK project ‘Bringing Big Data to Small Users' (Innovate UK 5098470).
Supplemental material
Supplemental material for this article is available online.
References
Supplementary Material
Please find the following supplemental material available below.
For Open Access articles published under a Creative Commons License, all supplemental material carries the same license as the article it is associated with.
For non-Open Access articles published, all supplemental material carries a non-exclusive license, and permission requests for re-use of supplemental material or any part of supplemental material shall be sent directly to the copyright owner as specified in the copyright notice associated with the article.