
Abstract
Using open-source data, we show that despite significant reductions in global public transit during the COVID-19 pandemic, ∼20% of ridership continues during social distancing measures. Current urban transport data collection methods do not account for the distinct behavioural and psychological experiences of the population. Therefore, little is known about the travel experience of vulnerable citizens that continue to rely on public transit and their concerns over risk, safety and other stressors that could negatively affect their health and well-being. We develop a machine learning approach to augment conventional transport data collection methods by curating a population segmented Twitter dataset representing the travel experiences of ∼120,000 transit riders before and during the pandemic in Metro Vancouver, Canada. Results show a heightened increase in negative sentiments, differentiated by age, gender and ethnicity associated with public transit indicating signs of psychological stress among travellers during the first and second waves of COVID-19. Our results provide empirical evidence of existing inequalities and additional risks faced by citizens using public transit during the pandemic, and can help raise awareness of the differential risks faced by travellers. Our data collection methods can help inform more targeted social-distancing measures, public health announcements, and transit monitoring services during times of transport disruptions and closures.
Introduction
Urban mobility is being rapidly transformed through widespread deployment of information technologies and collection of new data designed to improve access and personalize transportation services. However, these developments have largely not considered the diverse mobility needs of vulnerable citizens (Lenz, 2020). Here we define a vulnerable traveller as someone having specific mobility needs and as a result could assume additional psychological, physical or material risk not faced by the general public. For example, urban mobility patterns are diverse, where demand can be gender-specific reflecting household divisions of labour, for example, caring activities (household errands, caring for others) are more frequent and shorter distances than commuting to work (Nobis and Lenz, 2005); trips taken by women, youth and seniors can be restricted to daylight hours due to concerns over personal safety (Giesel and Rahn, 2015); and, new migrant and lower income households can be more dependent on public transit rather than owning personal vehicles (Lubitow et al., 2017). There is a complex interplay between socioeconomic, gendered and demographic factors that influence urban mobility patterns often overlooked by planning and policy (Gauvin et al., 2020). Therefore, for our analysis, our definition of vulnerable riders is broader than definitions of vulnerability related to specific health conditions and risk to COVID-19. However, it is likely that these vulnerable riders would also be captured to some degree in our dataset, where further disaggregation could be the focus of future research.
Importantly, the COVID-19 pandemic has amplified existing inequalities in urban transport systems. Public transit in major cities is experiencing massive reductions in ridership due to social distancing measures and closures of urban services and destinations (Liu et al., 2020). Yet low income, ethnic and other vulnerable groups have continued to use public transit facing higher health risks combined with reduced transit services compromising already unstable front-line jobs (Glanz et al., 2020; Valentino-DeVries et al., 2020). Under normal circumstances, vulnerable citizens are often more dependent upon public transit than the general public that have the economic and physical means to access more mobility options (Neutens, 2015). Transit planning relies on ridership data, fares and passenger counts to determine demand trends, but an important gap is not understanding the unique traveller experiences during major disruptions like COVID-19 (Bassolas et al., 2020). A major challenge for transit authorities moving forward is re-building public trust to sustain viable operations, while also deploying strategies to mitigate the physical and mental health risks faced by vulnerable citizens that will continue to rely on public transit.
Current transport data collection methods (travel diaries, traffic volume and bicycle/pedestrian counts, travel time data, transportation network inventory or vehicle classification counts) do not account for the behavioural and psychological experiences of the population including gender differences, age, ethnicity and socioeconomic status (Lenz, 2020). While new mobility technologies and applications are able to collect detailed personal traveller data, it is often proprietary and not publicly available. We use open social media data to overcome these challenges, as they are much easier to access. Specifically, we apply sentiment analysis on a rich Twitter data set (517,000 tweets) representing the experiences of nearly 120,000 transit riders collected before and during COVID-19 in Metropolitan Vancouver. This allows us to improve our understanding of the distinct behavioural experiences of travellers at a detailed level during a major transit disruption in a representative metropolitan city. Our goal is to demonstrate a novel data collection method and machine learning analyses of social media to help plan for smart and inclusive transportation systems during normal operations, and to prepare for times of massive disruption. The paper proceeds with i) a review of literature on COVID-19 and transport inequality, and opportunities for new data science in transport planning, ii) description of data and methods, and iii) results and discussion.
Literature review
COVID-19 has amplified transport inequality
People around the world rely on public transit to access essential amenities and services including food, jobs, education and healthcare to improve their quality of life (Michalos and Zumbo, 1999; Wang, 2021). Additionally, for people without a car, access to public transit has positive benefits for social inclusion (Lucas, 2006). However, the publicly funded benefits that can arise from access to new transit infrastructure investments are not always distributed equally among different population groups located within a region (Foth et al., 2013). For example, low-income citizens unable to afford a personal vehicle are more dependent upon public transit to reach job opportunities and social activities beyond their immediate vicinity (El-Geneidy et al., 2016). Therefore, a transit system that does not serve the needs of all citizens can exacerbate social and economic disparities (Razza, 2015). In major urban areas, the inequitable distribution of public transport can increase safety, health and environmental risks (Lubitow et al., 2017).
Public transit ridership during the COVID-19 pandemic has decreased by up to 80% in major cities around the world (Gutiérrez et al., 2020). However, many lower-income workers face the dual challenge of higher health risk combined with financial hardship (Tirachini and Cats, 2020). Economic disadvantage is associated with higher morbidity and during major natural or human made disruptions the disadvantaged are the most likely to experience negative outcomes (Fothergill and Peek, 2004). Increased risk and vulnerability for people dependent upon public transit has become even more pronounced during the COVID-19 pandemic. Inequalities in accessing financial and health resources can affect people with the greatest risk of infection. This vulnerability is compounded for people unable to adopt recommendations to socially distance, discontinue work and other measures to avoid or mitigate health risks (Van Bavel et al., 2020).
Citizens that rely on public transit cannot always avoid crowded areas, and lower wage workers often do not have health benefits, paid sick leave, or the option to work from home (Glanz et al., 2020). Since social distancing measures on mobility have come into effect, broad patterns of inequality in global cities have emerged, for example, in the US the top 10% of income earners have limited their movement far more than the bottom 10% of earners within the same metro regions with transit stations in poorer neighbourhoods remaining crowded (Valentino-Devries et al., 2020).
Planning for future disruptions with urban data science
Studies using data science and machine learning methods have assessed the various implications that massive disruptions have had on public transit during the pandemic (Enoch et al., 2021; Kutela et al., 2021). Qualitative surveys have also shown a high level of uncertainty among transit authorities in recovering operating costs over the long term due to a decrease in ridership (Coppola and De Fabiis, 2020). Integrating conventional survey methods with machine learning have also been used to understand travel behaviour (El-Diraby et al., 2019); and comparing commuting patterns between car and public transit during travel restrictions to inform strategic transport planning models and future land use planning (Beck et al., 2020).
It is also anticipated that social distancing will limit transit capacity into the foreseeable future and alternative mobility options will be required especially in cities where personal car use is unfeasible and environmentally damaging (Brooks et al., 2020). Scenario analysis has also been used to explore interpersonal distancing measures (Coppola and Fabiis, 2021), and opportunities for mobility as a service to supplement private and public transport to reduce congestion (Hensher, 2020), and other studies argue that current impacts on transport and high-density areas could lead to behavioural change with respect to individual mobility patterns (Budd and Ison, 2020; Khavarian-Garmsir et al., 2021), or how stimulus plans will be needed to capture transport related social, health and climate co-benefits (Koehl, 2020). Importantly, there are concerns that the public transport sector will be negatively impacted over the longer term if citizens continue to associate public transit with higher risk and related negative views (Tirachini and Cats, 2020).
Under normal circumstances, transportation planning already faces considerable challenges in the quality of data for equity analysis (Tran and Draeger, 2021). This is due to the limitations of travel survey methods that fail to capture variation in travel behaviour, and does not accurately represent demand patterns (Martens, 2017). Moreover, there is systematic underrepresentation of minority, low-income and other vulnerable populations in conventional transport data collection (Lubitow et al., 2019). However, the recent increase and availability of human mobility and transportation infrastructure data is an opportunity to improve the representation of diverse travel behaviour especially for the disadvantaged. During the current pandemic, and to plan for the future, there is need to leverage new data collection methods and analyses to deploy safety measures, and related response mechanisms to future disruptions on public transit (Buckee et al., 2020).
Many of the people most dependent upon public transit including low-income, minorities, youth, seniors and women are vulnerable during normal times. The recent pandemic has amplified existing inequalities, and this is playing out on public transit. A major challenge for transit authorities moving forwards is decreasing risk and rebuilding trust among its ridership, especially for the most vulnerable segments of society without the means to pursue alternative mobility options. Here we demonstrate a novel data collection methodology using social media, and deploy sentiment analysis to understand the psychological and behavioural conditions of vulnerable citizens before and during large-scale closures of public transit.
Data bias and limitations
There are important limitations to data that should be addressed in further work. First, the use of social media is biased towards riders that have access to mobile devices leaving out at least some proportion of total transit users. There is likely to also be bias towards a subset of riders that actively use social media since we cannot assume that having access to a mobile device necessarily leads to use of social media, specifically Twitter in this case, which also leaves out multiple other social media platforms popular with other demographics (Facebook, Instagram, TikTok). Having said that, our final filtered data sample included male and female genders, a wide age range (<20 to >50 years) and non-English speaking transit users. An important next step would be to collect and integrate data across multiple social media platforms using additional key word constraints. Other important limitations include validating the Twitter data set to GTFS schedules which are vehicle based and do not represent actual ridership. It is currently difficult to access actual transit ridership data for proprietary reasons, but our methodology could easily be adapted if that data was released by transit authorities in Metro Vancouver. However, our methodology and analysis does not focus on representing public transit ridership in real time, and we acknowledge that the Tweet itself could be conducted before, during or after a journey has taken place. So, there could be further bias in reporting the travel experience depending upon myriad psychological factors that influence the memory of a journey, for example, recency bias where recent events are favoured over historic ones (Tversky and Kahneman, 1973). To overcome this challenge, future work could focus on collecting geolocated and time stamped data, allowing for trajectory analysis of distinct travellers showing where and when they Tweet, however this introduces important privacy concerns that need to be addressed in further technical and policy research. Our methodology and analysis should therefore be seen as a way to augment current transport data collection methods and not replace them. Additional travel behaviour data collection methods are particularly important given the expense and time delay associated with household surveys when compared to the unpredictable nature of transit disruptions.
Methods
Data collection and validation
We used the Twitter API, to download ∼700,000 tweets on public transportation in Metropolitan Vancouver on a daily basis. We validated our data using two key steps including: (1) filtering the data using a restrictive combination of key words, and (2) comparing the temporal distribution of the filtered twitter data to the peak and non-peak demand distribution of transit arrivals using the General Transit Feed Specifications (GTFS). After the data was cleaned, we were left with a data set of 492,840 tweets in English language for 590 days until 13 November 2020, and 24,219 tweets in other languages for 430 days. In total, we could capture tweets from 119,267 people experiencing public transit, from which ∼40K transit riders could be assigned age and gender. See Supplementary Material for complete description of data collection.
Machine learning based sentiment analysis, age and gender estimation
Sentiment analysis is a machine learning method using Natural Language Processing (NLP) to identify positive and negative polarities as well as different emotions within a body of text (Alessia et al., 2015). It has been widely used for understanding population and social dynamics in detail including measuring human health, happiness and quality of life (Alajajian et al., 2017; Dodds et al., 2015). Here, we use a dictionary-based approach which compares each word in a body of text with a sentiment lexicon and assigns a respective sentiment value to the text in case of a match. Following Reagan et al. (2017) for a given text T, each word denoted w, in a sentiment dictionary D, gives word sentiment scores

Therefore, a normalized sentiment score
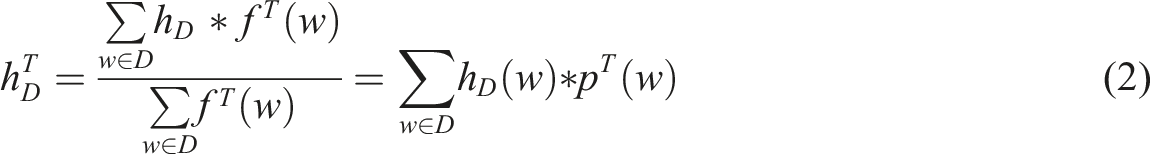
For our analysis, each word w is assigned to one or more emotions or sentiment based on a sentiment dictionary D. The total sentiment score per tweet Tw is the sum of the individual sentiment scores per word
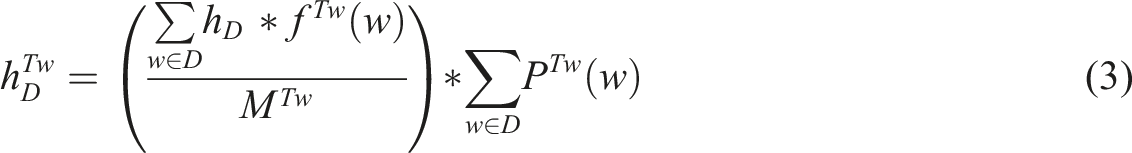
For tweets in different languages, this normalization procedure is carried out per language. We chose to use the National Research Council (NRC) of Canada emotion lexicon due to the variety of emotions and possible cultural differences in the assessment of emotions in dictionaries from different countries. It is a list of 14,182 words and their associations with eight emotions (anger, fear, anticipation, trust, surprise, sadness, joy and disgust) and two sentiments (negative and positive) (Mohammad and Turney, 2010). See Table S2 in Supplementary Materials.
As the metadata in our Twitter corpus does not provide information on age and gender, we use the publicly available profile pictures of Twitter users and the pretrained OpenCV and TensorFlow solution ‘py-agender’ to estimate age and gender, which is a computer vision approach based on deep convolutional neural networks (Antipov et al., 2017; Krizhevsky et al., 2012). Generally, computer vision applies a face detection function (h) on an image

Results and discussion
Public transit disruptions and COVID-19
Figure 1(a) shows the global reductions in public transit ridership by up to 80% based on data samples of major cities in Canada, the United States and France, which correlates with increases in COVID-19 reported cases from March 2020. We can see the highest reductions in public transit exceeding 80% occurred in Canada and France with correspondingly lower cases of COVID-19, as compared to the least reductions in transit ∼70% in the United States corresponding to a higher rate of cases. While public transit could play a role in COVID-19 transmission, it is not the only factor, which is shown by subsequent increases in transit ridership in France and Canada while reported cases remained flat over the same time horizon (Joselow, 2020; O’Sullivan, 2020). The United States on the other hand does show continued increases in COVID-19 cases that correspond to increases in public transit ridership. (a) Global reductions in public transit and the rise of COVID-19 cases in Canada, United States and France. Data sources: TransitApp, 2020, New York Times, 2020; and (b) Metropolitan Vancouver trend analysis of reductions in public transit ridership, increases in COVID-19 cases, and social distancing measures in Metro Vancouver. Response measures (M) include: Non-essential travel stopped (M1, March 12), strict physical distancing measures (M2, March 16), business shutdown (M3, March 21) and reopening measures for business (M4, May 19), and schools (M5, June 1). Data source: Province of British Columbia (2020).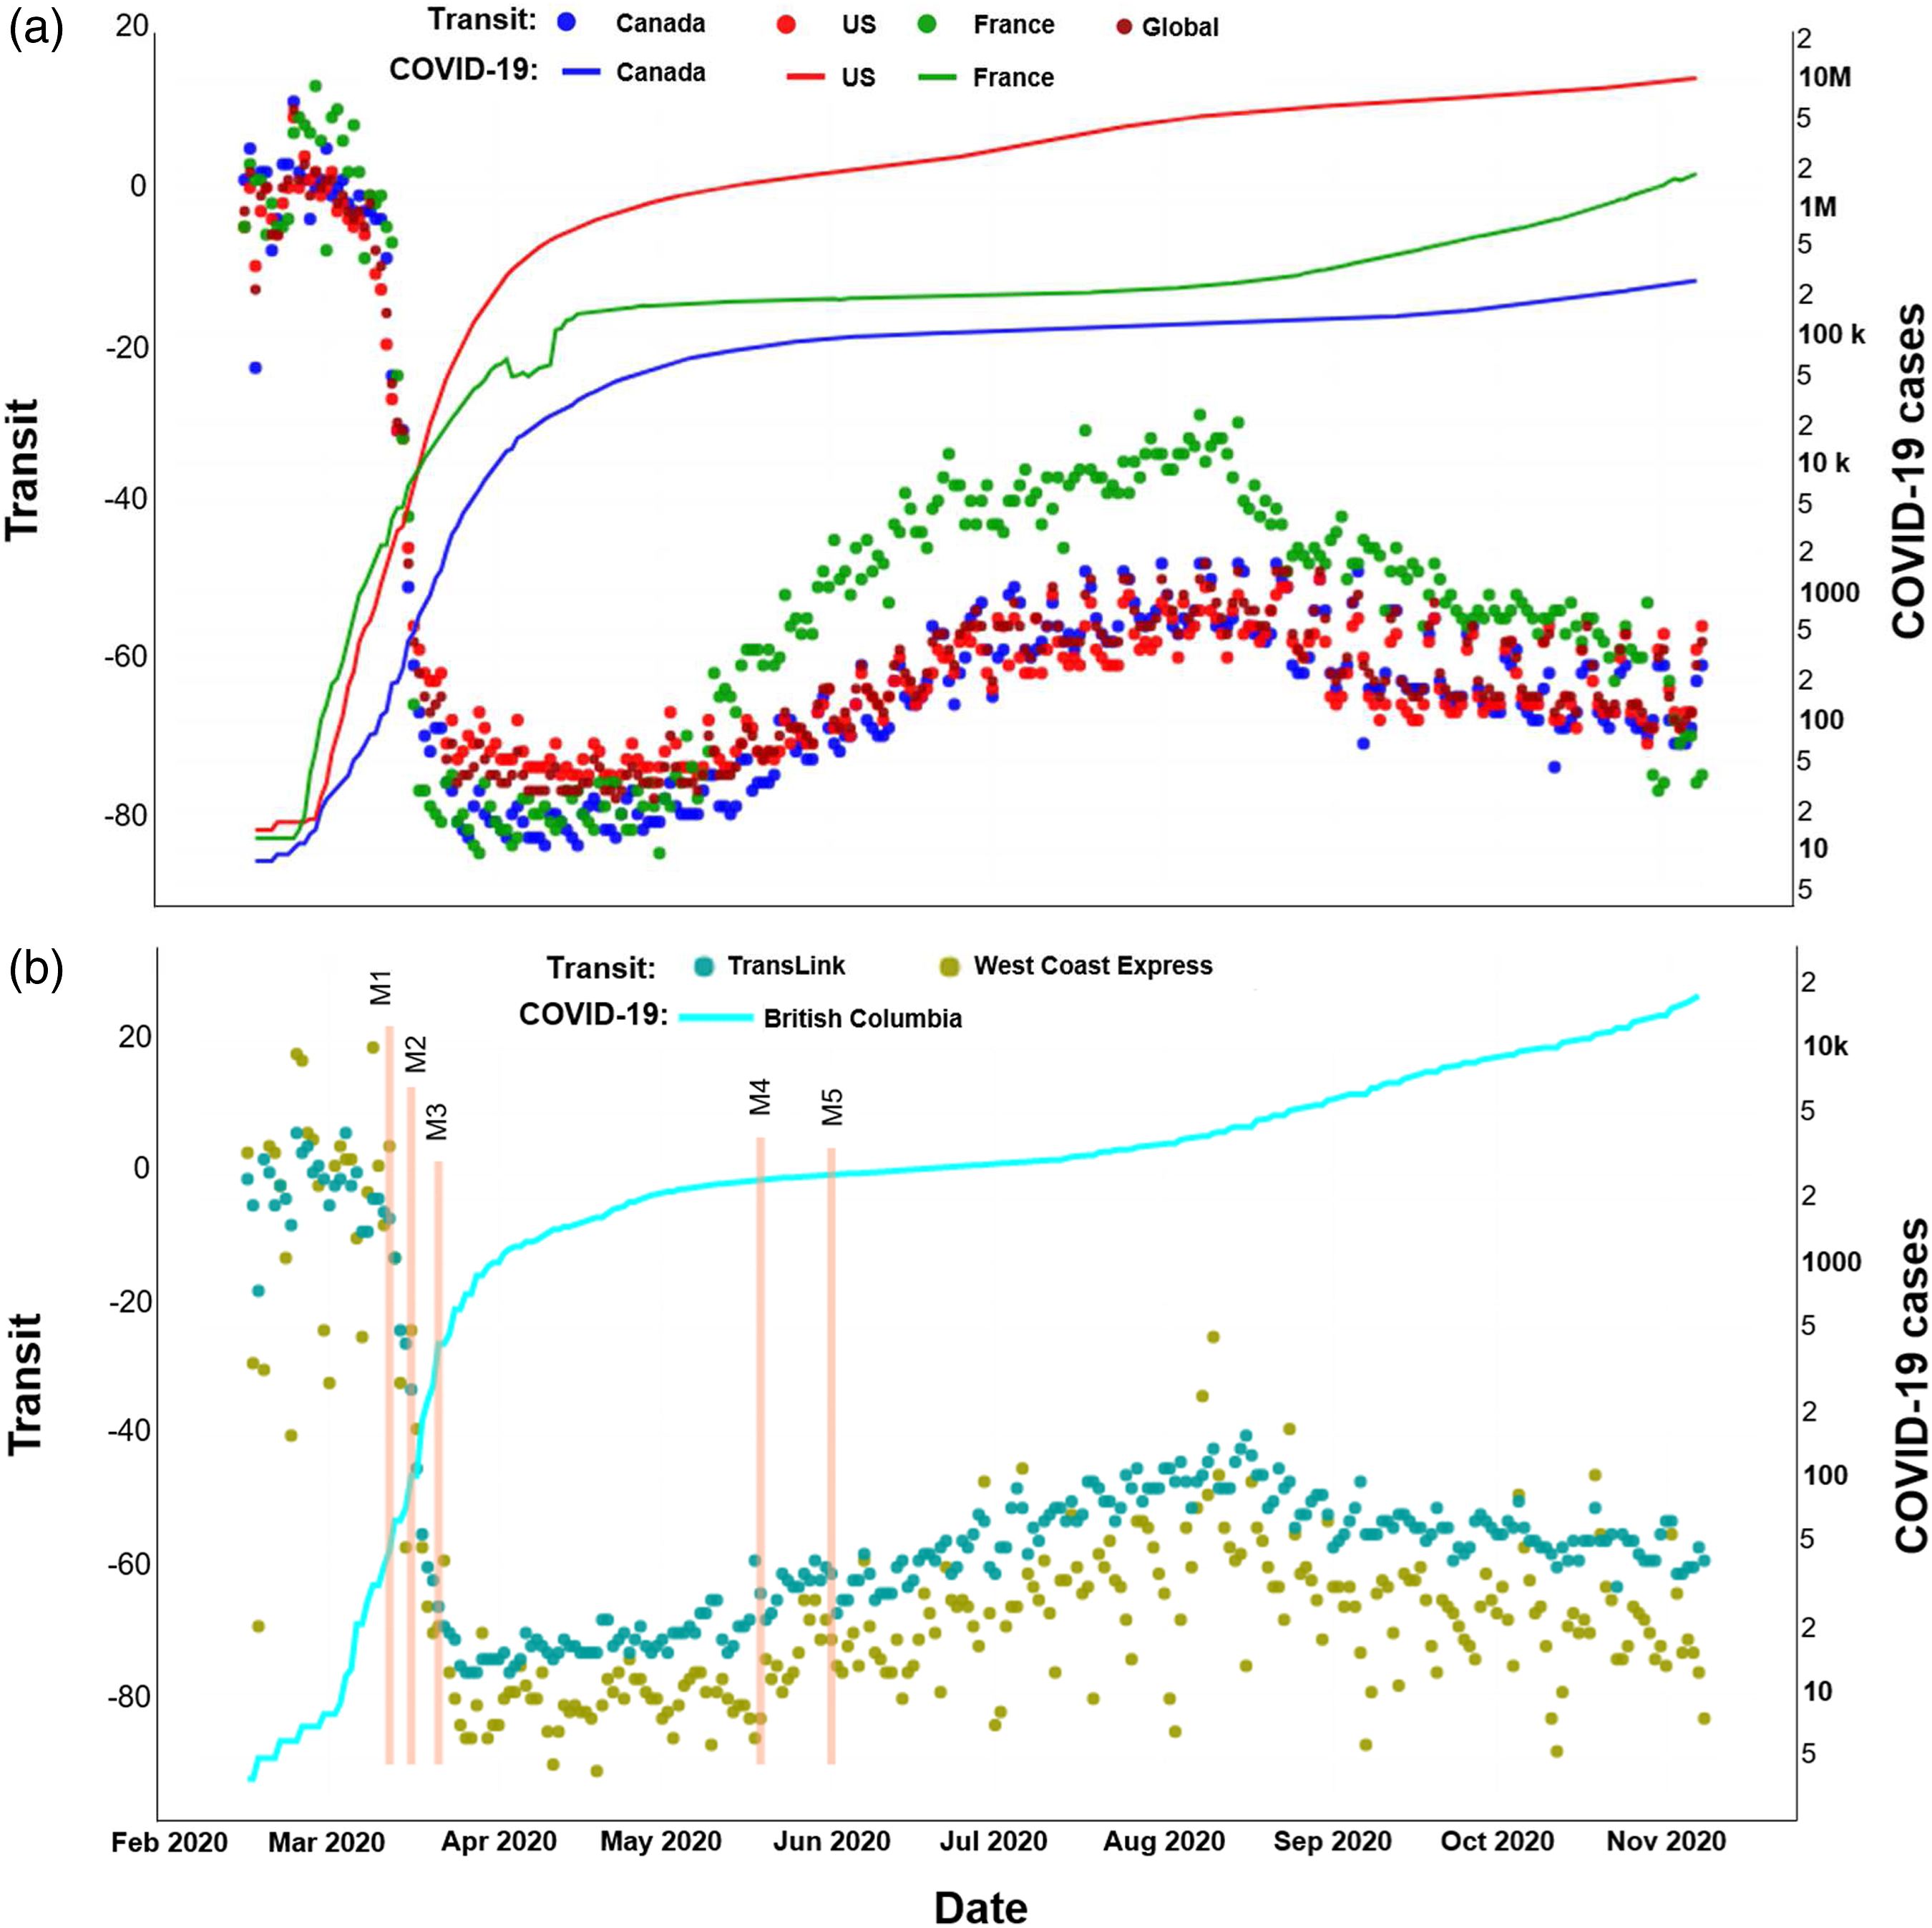
The ability to track these global trends represents an important initiative of data sharing by the private sector, in this case TransitApp (2020), which began to release open data on global transit reductions, along with the New York Times (2020) that tracked and provided publically available data on COVID-19 cases over the same time. The baseline analysis of global trends between public transit ridership and COVID-19 cases around the world allows us to conduct a more detailed case-study analysis of Metropolitan Vancouver, which is representative of a large industrialized city with a well-developed public transportation infrastructure network. Figure 1(b) shows the correlation between reductions in public transit ridership in Metro Vancouver and the rise of COVID-19 cases reported in British Columbia with >80% of those cases occurring in Metro Vancouver. Figure 1(b) also shows the dates of when measures were implemented by the government at the onset of the pandemic including: stopping non-essential travel (M1), strict physical distancing (M2), and business shutdowns (M3), along with subsequent reopening of businesses (M4) and schools (M5) (Province of British Columbia, 2020).
Transit ridership experience before and during COVID-19
The above analysis shows that there are important gaps in understanding travel experience at the local level and for diverse travellers during a massive disruption. Figure 2 shows our results indicating that our sentiment analysis effectively tracks the behavioural response of transit riders before the onset of the pandemic, and the following two waves of increased COVID-19 cases during the spring and fall of 2020. There is a heightened increase in responses across all sentiments on public transit when comparing April 2019 to April 2020 when non-essential travel restrictions came into effect. Following the second wave of COVID-19 cases, the highest overall negative sentiment scores are from September to October 2020 in particular signals of anger, disgust, fear and sadness, which reveals the psychological stress levels of travellers before and during the pandemic. Comparing strength of sentiments about public transit before and during public transit closures and social distancing measures in Vancouver, April 2019 to October 2020. Sentiment scores (0–1) are normalized by sentiment for comparative purposes with higher values indicating a stronger negative sentiment signal among transit ridership during the first and second waves of COVID-19 in April and September 2020. The strong negative sentiment signal in November 2019 is due to non-pandemic localized events, see main text. Data based on Twitter text linked to key words associated with Metropolitan Vancouver public transport.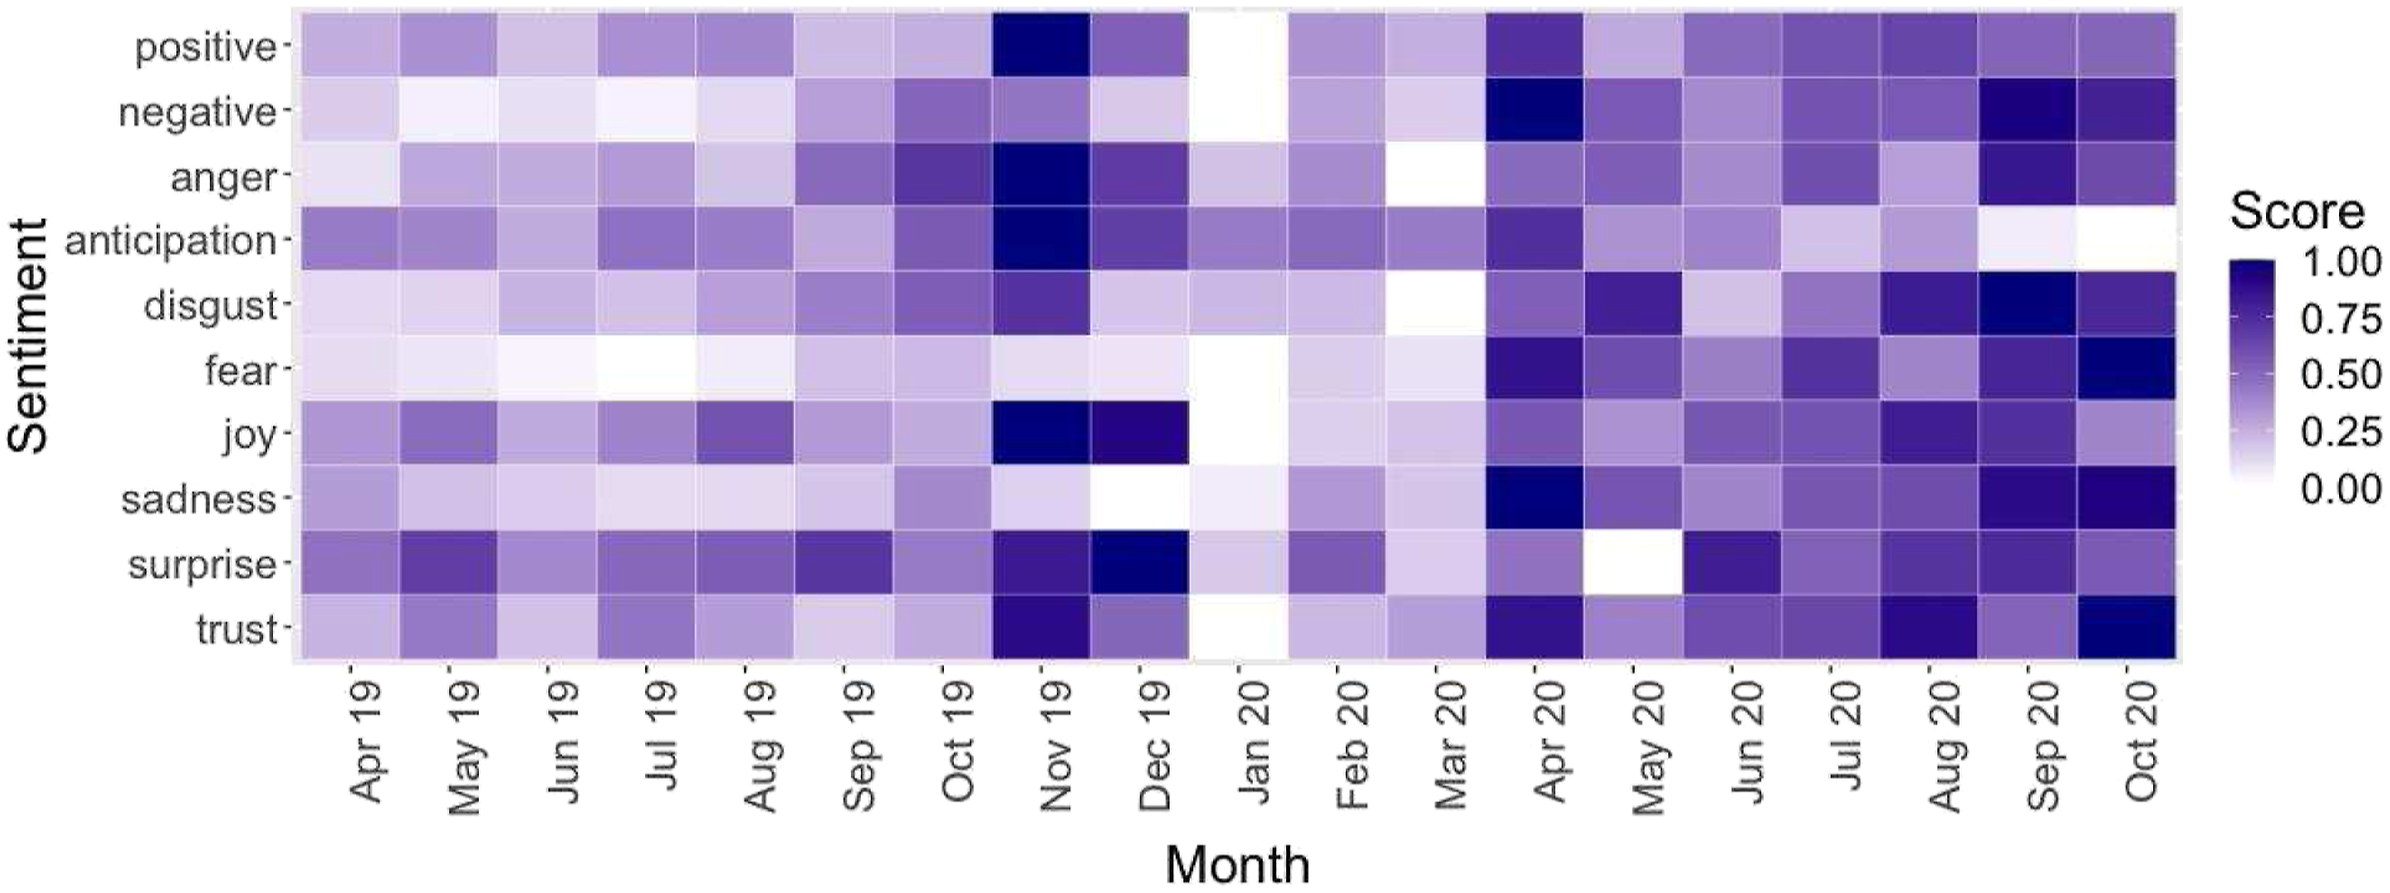
Interestingly, the negative sentiments quickly dissipated in May 2020, only 1 month after the initial onset of heightened stress levels. This may indicate travellers’ ability to quickly adapt to massive disruptions, and settle into patterns of normative behaviour. This suggests that transit operations need to focus on providing support to travellers at the initial outset of a disruption in order to maintain public confidence in transit services, while ensuring travellers remain responsive to additional social distancing measures on transit over the medium to long-term, which is important as the public becomes fatigued with continued lockdowns.
In addition to COVID-19 related sentiments, our methodology and analysis is able to pick up customer responses to other events affecting public transit, which can assist with transit operations under normal and disruptive conditions. The spike in sentiments during November 2019 is due to a multiple-day transit strike and disruption of service. In particular, we see strong levels of anger and surprise, but also of trust, joy and anticipation. The latter could be explained by the tentative deal reached by the union representing transit workers and their employer, Coast Mountain Bus Company in late November 2019 (Schmunk, 2019).
Detecting vulnerable citizen experience on public transit
Transportation planning typically assumes a high level of homogeneity in travel experience often due to a lack of detailed behavioural data on end-users (Miller, 2017). National household surveys, while important, do not capture gender, age or ethnic diverse travel experiences (Nobis and Lenz, 2005). A contribution of our sentiment detection methodology is to disaggregate end-user experience on public transit and compare behaviour before and during the pandemic. Figure 3 shows our results indicating that people have distinct behavioural experiences on public transit based on their age. Overall, youth (0–20 years) and seniors (>50 years) have more similar sentiment responses compared to middle age groups (21–50), with the exceptions of youth having lower levels of trust, and seniors more surprised over time than all other age groups. There are noticeable upward trends in fear (3D), disgust (3F) and anger (3H) among different age groups, with positive sentiments remaining comparatively flat over the same duration. In addition to overall trends, all age groups show sharp increases in negative sentiments by the second wave of COVID-19 by October 2020 while using public transit. This indicates additional psychological stress, which may compound the challenges already faced by vulnerable citizens with higher health risk, transit dependency or special mobility needs. Our findings run contrary to conventional transportation planning that assumes homogeneous end-user experience on public transit, and how major disruptions like COVID-19 can further amplify existing vulnerabilities among some citizens. Transit rider experience disaggregated by age group and sentiment in Metropolitan Vancouver from April 2019 to October 2020. Age groups disaggregated from 0 to 20, 21 to 35, 36 to 50 and >50 years, with linear trend lines. Normalized sentiment score (0–1) with higher scores indicating stronger sentiment response.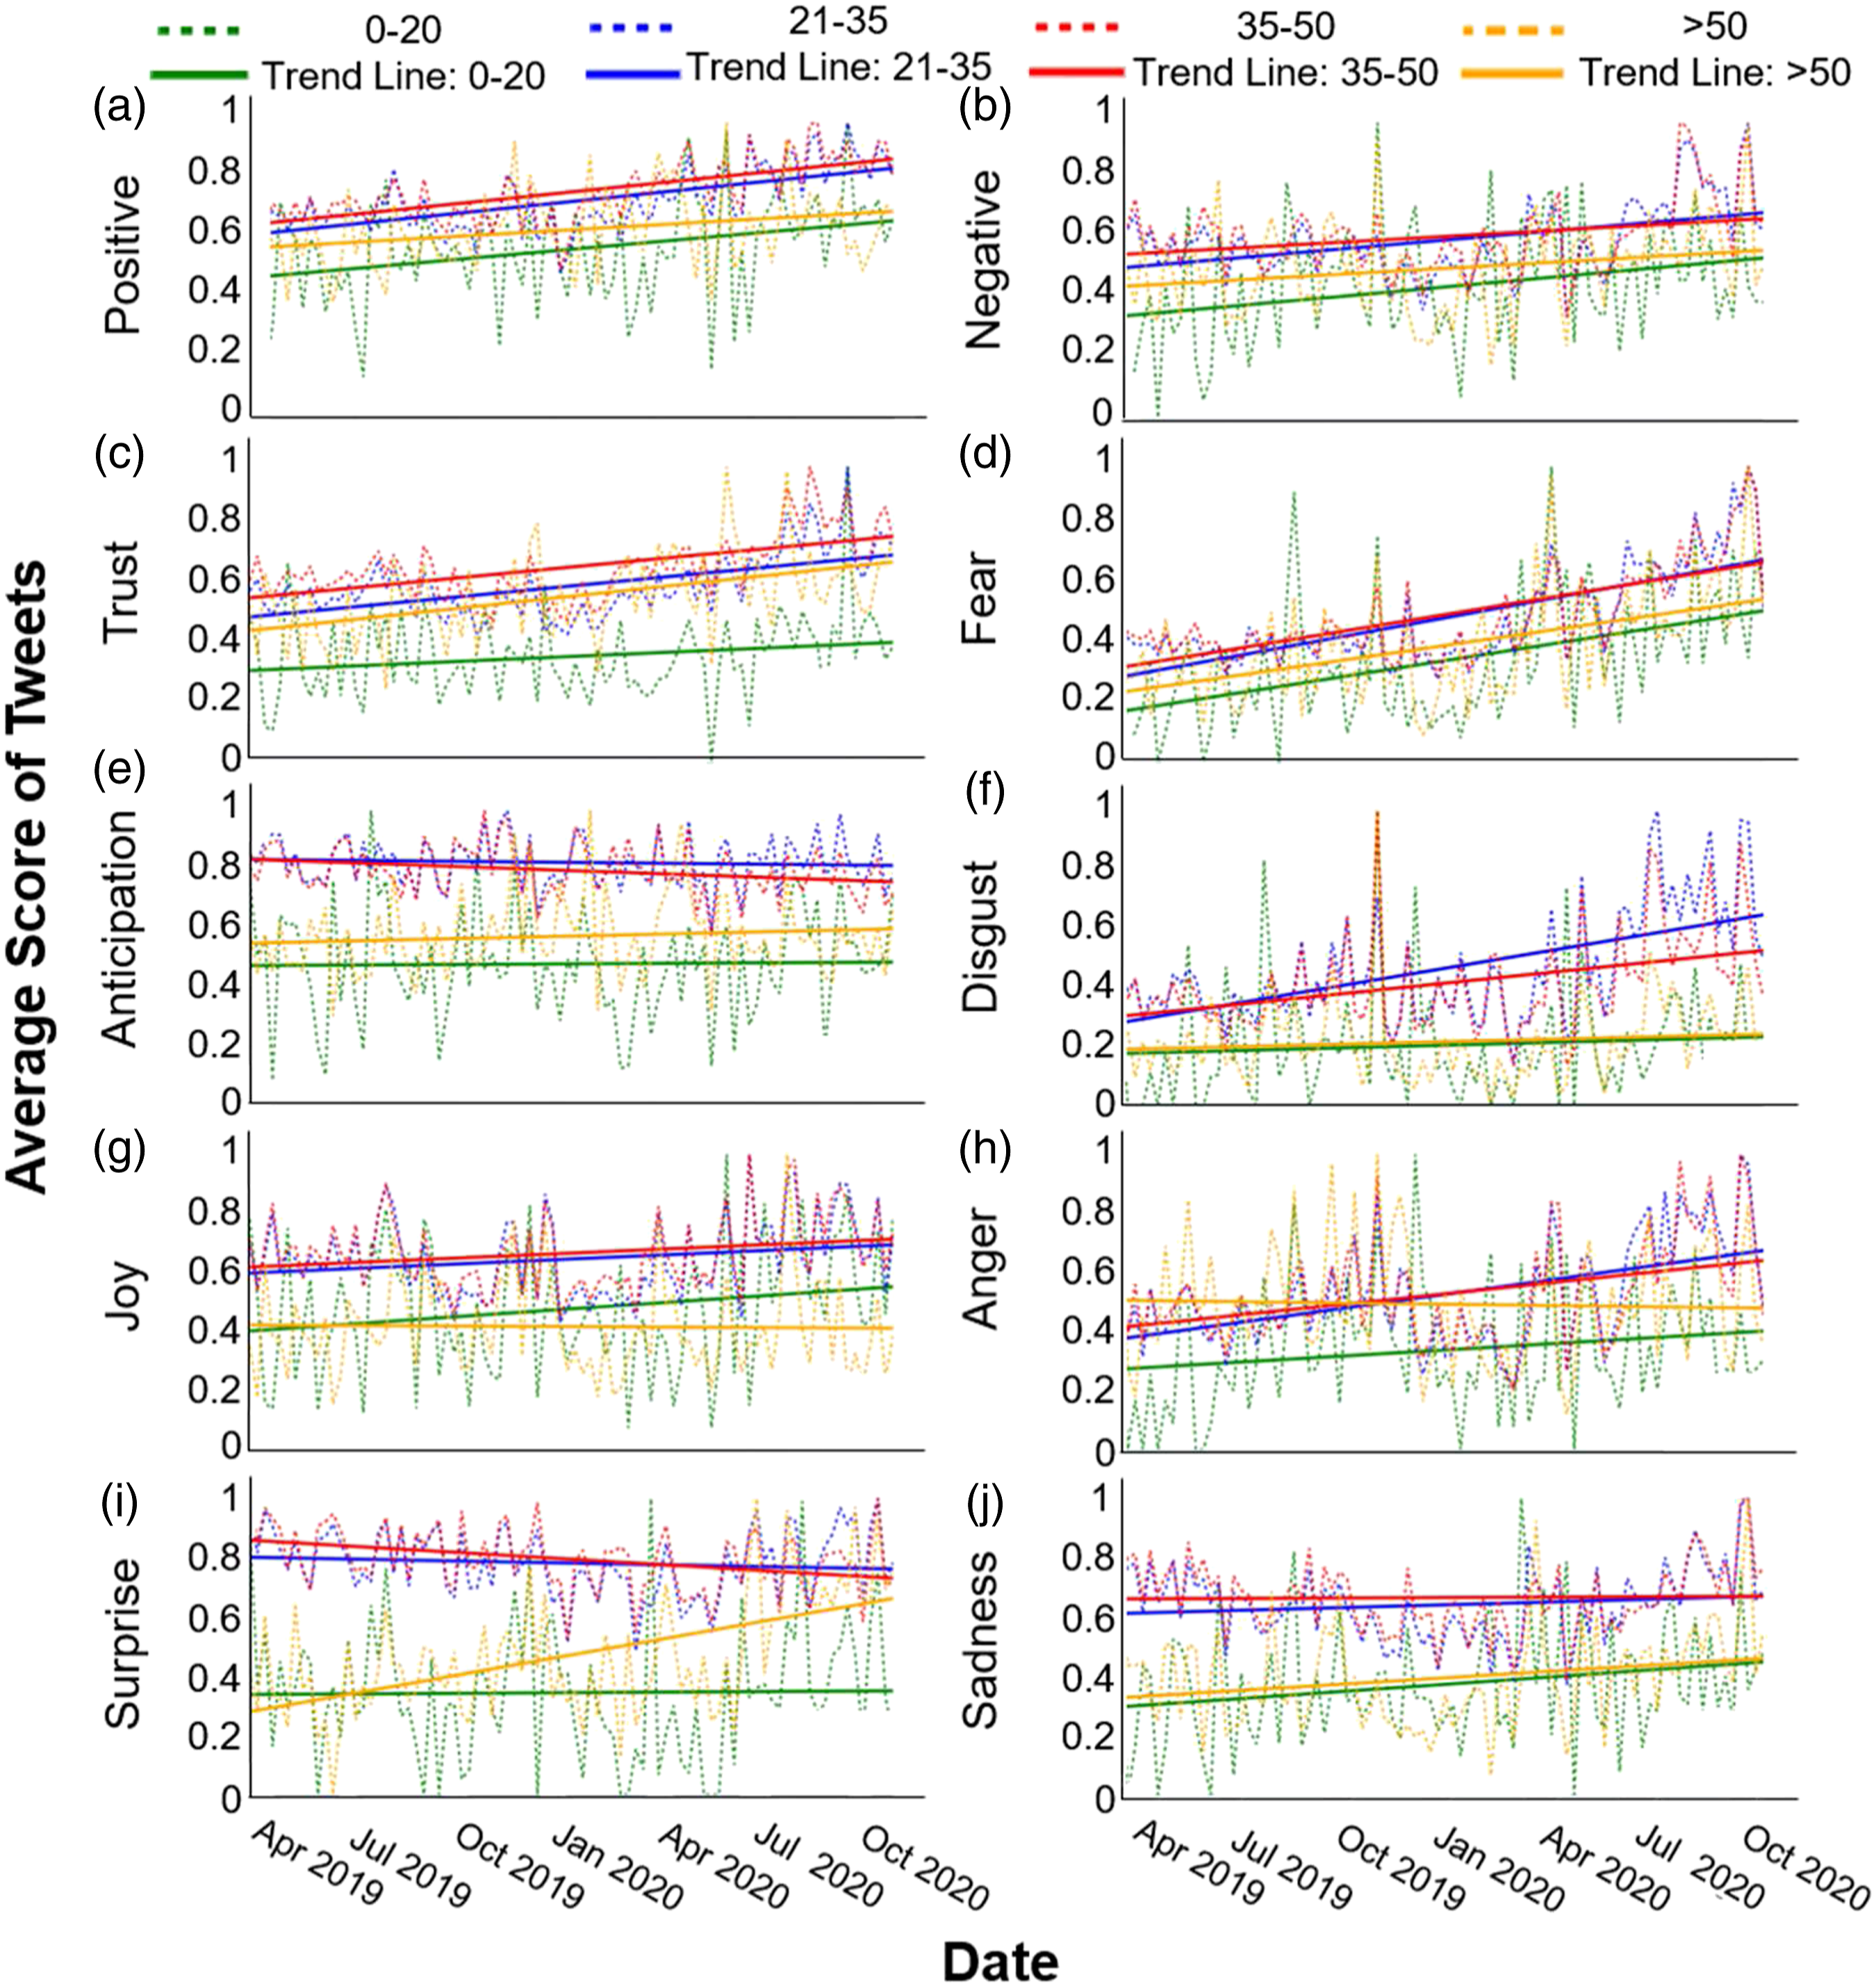
Another important consideration are the different experiences on public transit based on gender. For example, personal safety is a more important concern for women than for men when using public transit (Nobis and Lenz, 2005). We acknowledge the limitations of our current analysis that does not detect other self-identified gender groups, which is an important consideration for future work. However, distinguishing experiences between men and women begins to address an important gap in current transit planning (Lenz, 2020). Figure 4 shows our results indicating similar sentiment trends between men and women, except for lower levels of trust and higher levels of disgust among women. By the second wave of the pandemic in October 2020, there are distinct increases in negative sentiments for men and women including fear, sadness and anger. Women can face heightened risk on public transit, which can be exacerbated during times of reduced services such as transit policing and monitoring. Our sentiment methodology can contribute to detecting psychological stress and help inform strategies to mitigate the disproportionate risks faced by women and other gender diverse groups while using transit. Transit rider experience disaggregated by male/female and sentiment in Metropolitan Vancouver from April 2019 to October 2020. Normalized sentiment score (0–1) with higher scores indicating stronger sentiment response.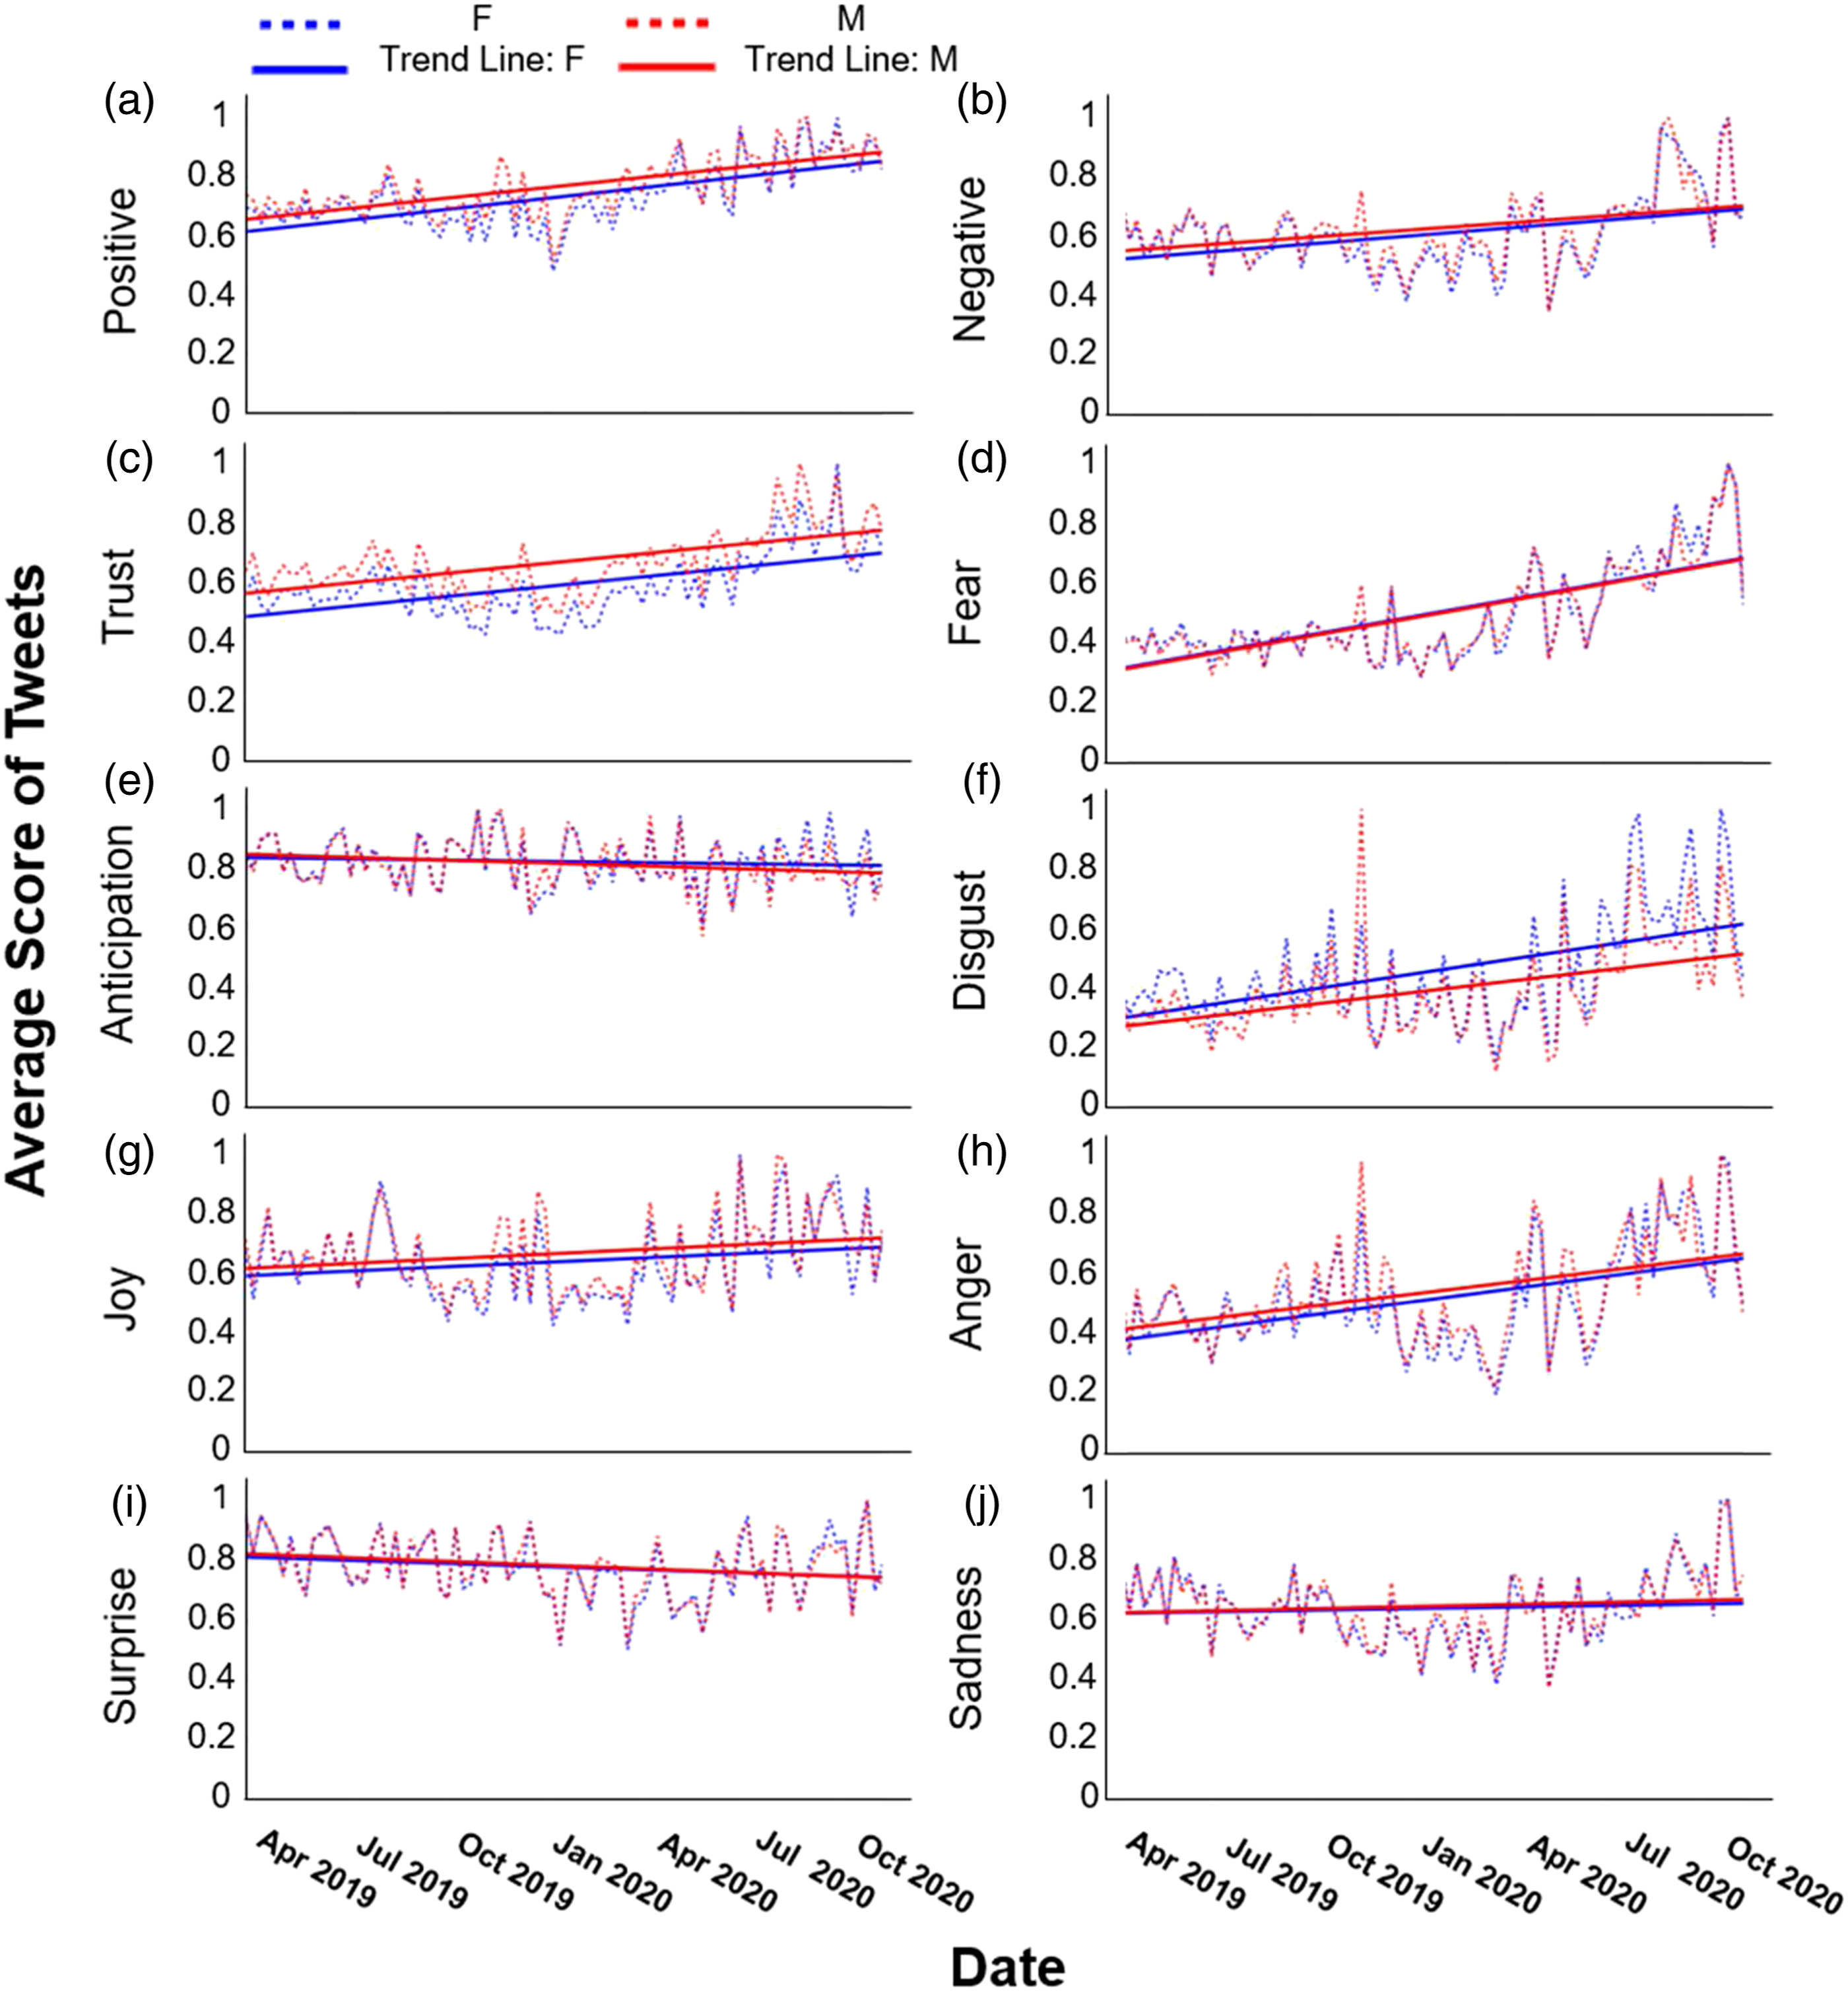
Figure 5 shows sentiment scores on an hourly basis from April 2019 to July 2020. We select sample positive and negative sentiment results based on gender and younger (21–35 years) and middle (36–50 years) age categories. We select these population categories to highlight our methods’ ability to capture strong sentiment signals with high time resolution among distinct population segments. Our results indicate in pre-pandemic times younger women have higher negative sentiment scores late in the day (3–8 pm) and early morning (1–3 am). However, by April 2020 during the first wave of COVID-19, younger men have the highest negative scores from 3 to 8 pm. Monitoring travel behaviour on an hourly basis throughout the day can assist in managing peak travel demand on the transportation network, and also account for different gender and age specific daily travel patterns. For example, this can assist in monitoring the well-being of late-night workers, and/or female travellers who may face higher risk and stress when having to commute at night for work or leisure. Sentiments by 24-h period (Y-axis) before and during the first wave of COVID-19 from May 2019 to July 2020 (X-axis). Scores disaggregated by gender and age group: Panels (a) Positive female, (b) Negative female, (c) Positive male, (d) Negative male, (e) Positive 21–35 years, (f) Negative 21–35 years, (g) Positive 36–50 years, (h) Negative 36–50 years. Sentiment scores from 0 to 1 with lighter shades indicating higher sentiment score, and size of bubble indicates relative volume of tweets, that is, a large light yellow coloured bubble indicates a high number of tweets with a strong sentiment signal compared to a small dark purple bubble indicating a low number of tweets and a weak sentiment signal. Results show high positive sentiment scores pre-pandemic around 10 am and 3 pm, and high negative sentiments across gender and age groups during the pandemic typically from 3 pm to 8 pm throughout March and April 2020.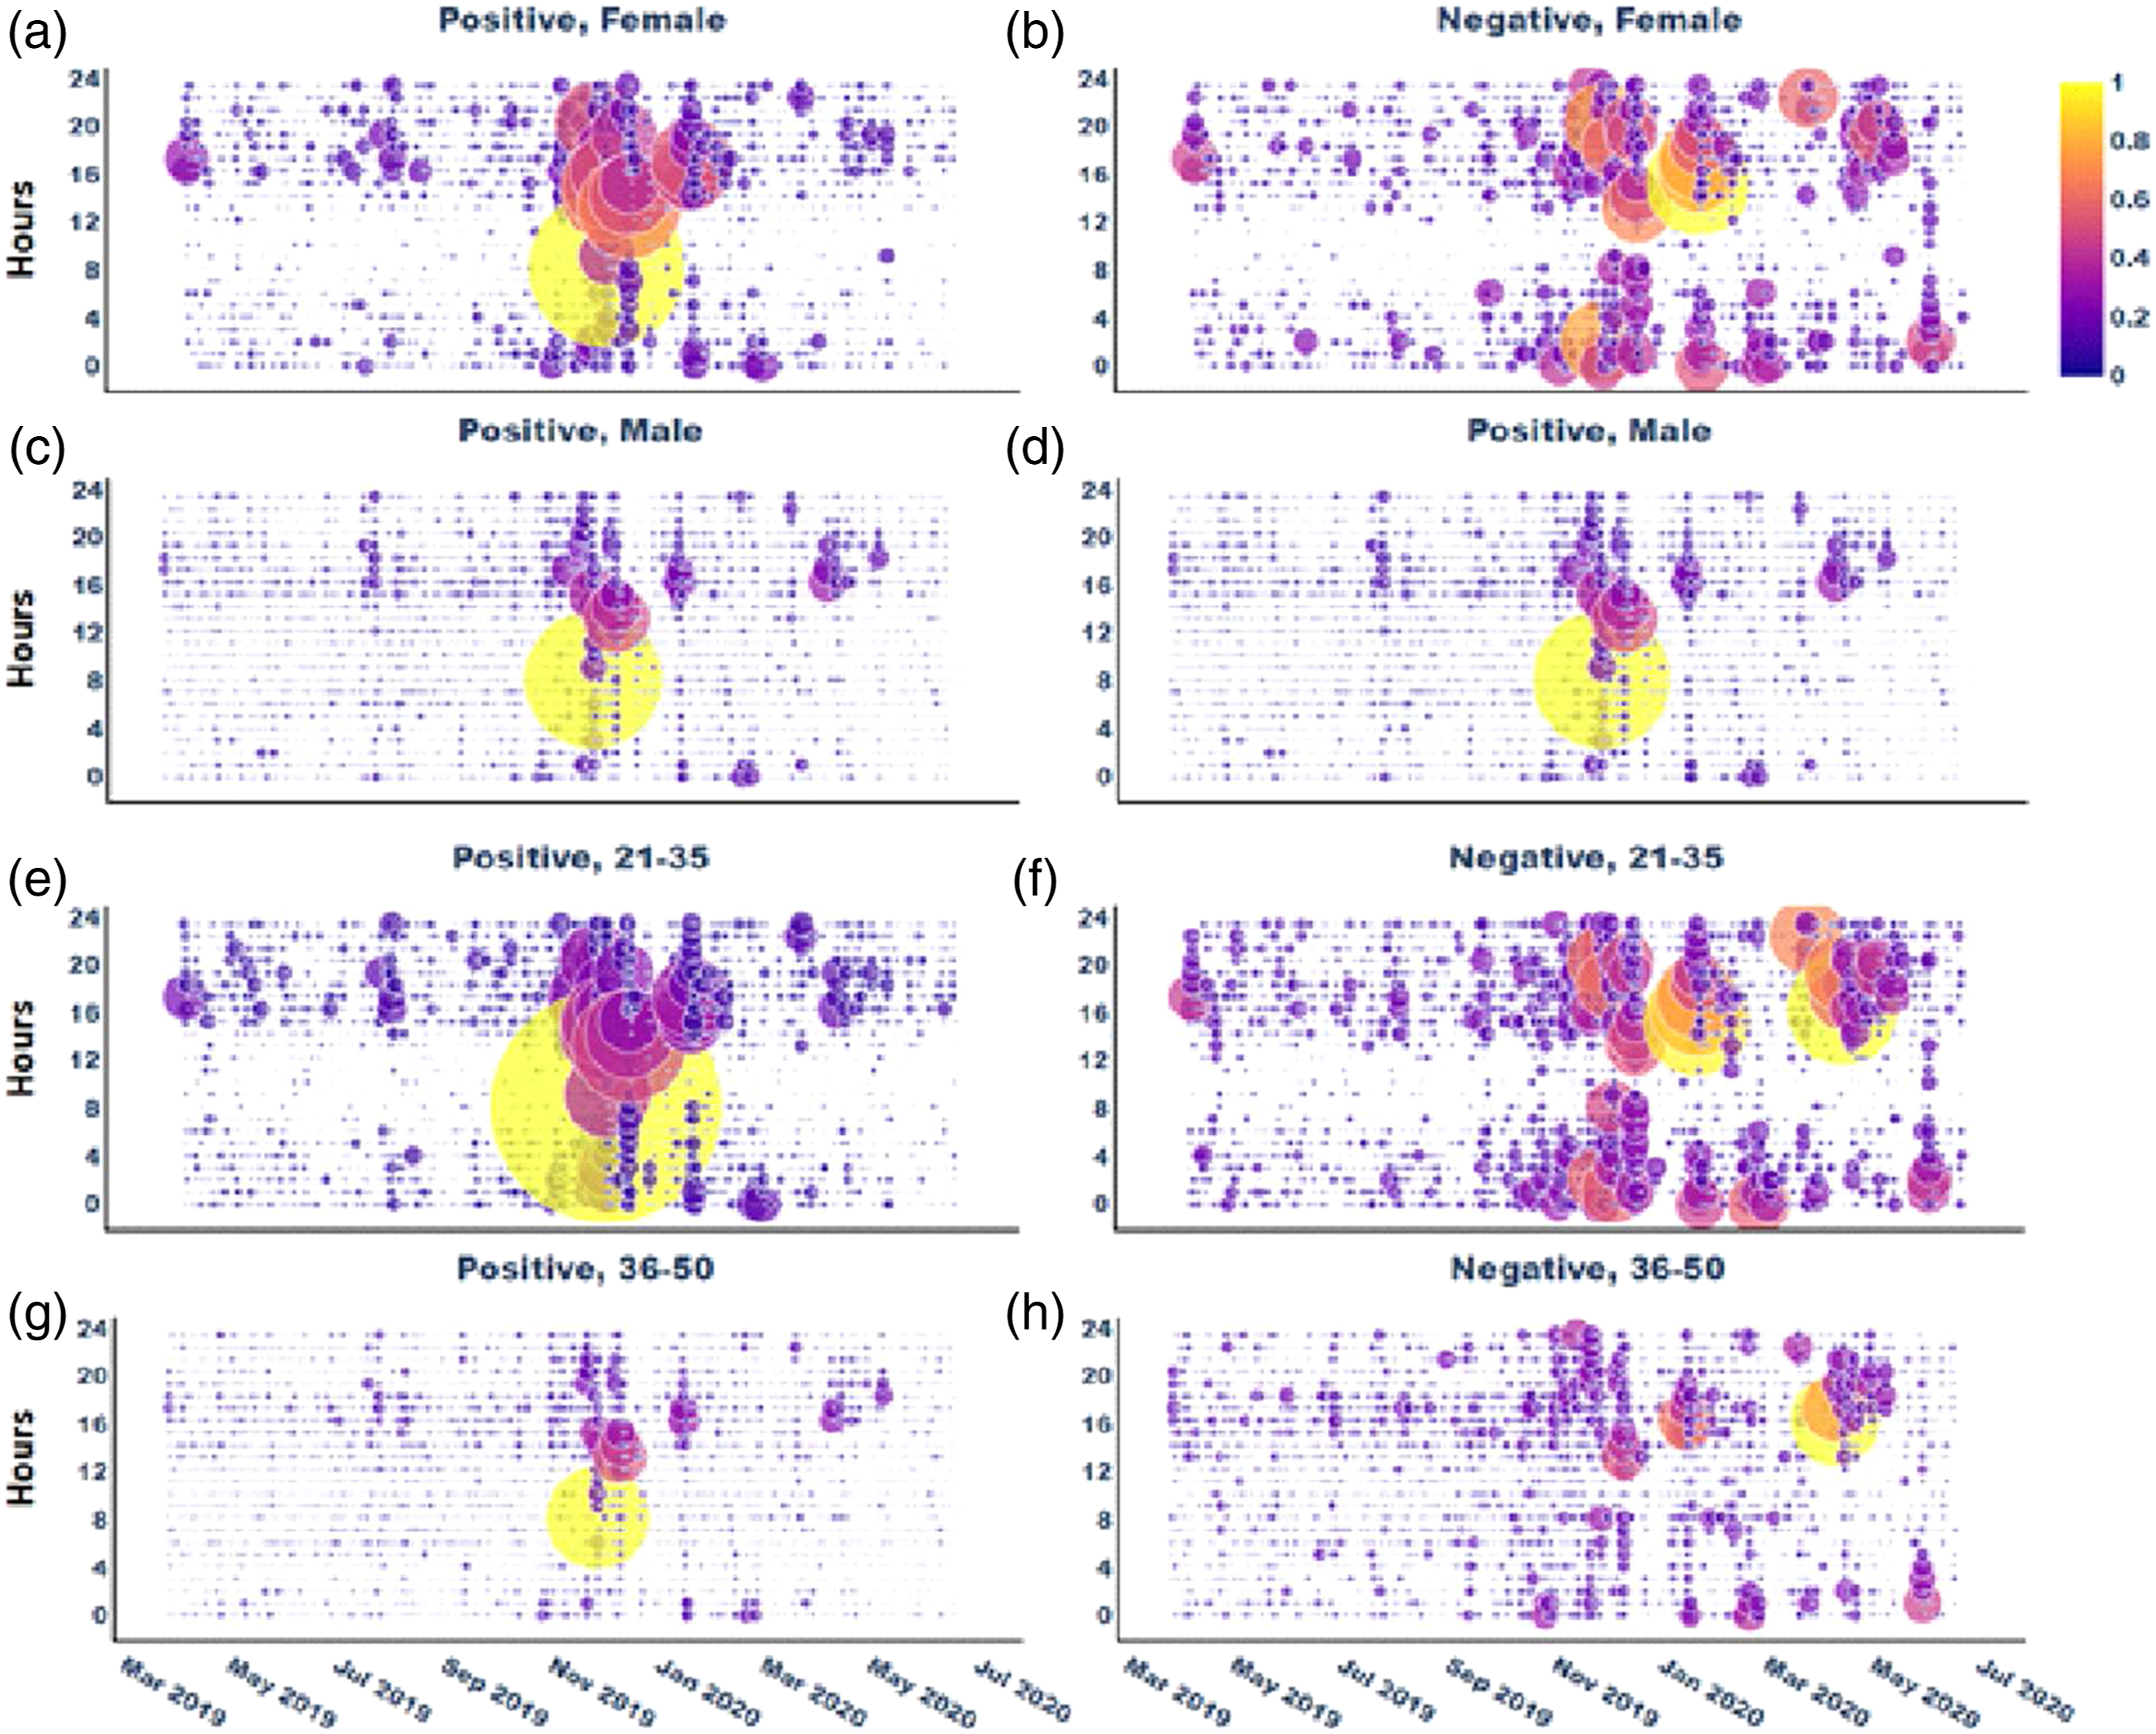
Many cities are experiencing high growth in migrant populations that depend on public transit for job searching and reaching basic amenities while transitioning to new livelihoods (Kristal et al., 2018). COVID-19 has shown how lower income households, many of them ethnic populations, continued to use public transit during lockdown measures to reach frontline low paying jobs without the flexibility to work from home (Gutiérrez et al., 2020). Many transit planning authorities including in Canada do not routinely collect ethnicity data posing a significant challenge for understanding the particular needs of migrant populations that critically rely on these services for sustaining livelihoods (Grant and Balkisoon, 2019). Figure 6 shows a heightened level of behavioural responses across non-English speaking groups after the onset of COVID-19. This demonstrates how sentiment analysis can help detect a diversity of travel experiences for different ethnic groups. Language barriers and acts of discrimination against ethnic minorities are common on public transit (Lubitow et al., 2017), and our methodology can help inform measures to monitor the experience and perceived safety of minorities while using transit. Average sentiment score per tweet by ethnic group in January and October 2020. Normalized sentiment scores (0–1) with higher values indicating stronger behavioural responses. Data samples selected in January 2020 just before the onset of the first COVID-19 wave and in October 2020 during the second-wave of cases in Metropolitan Vancouver.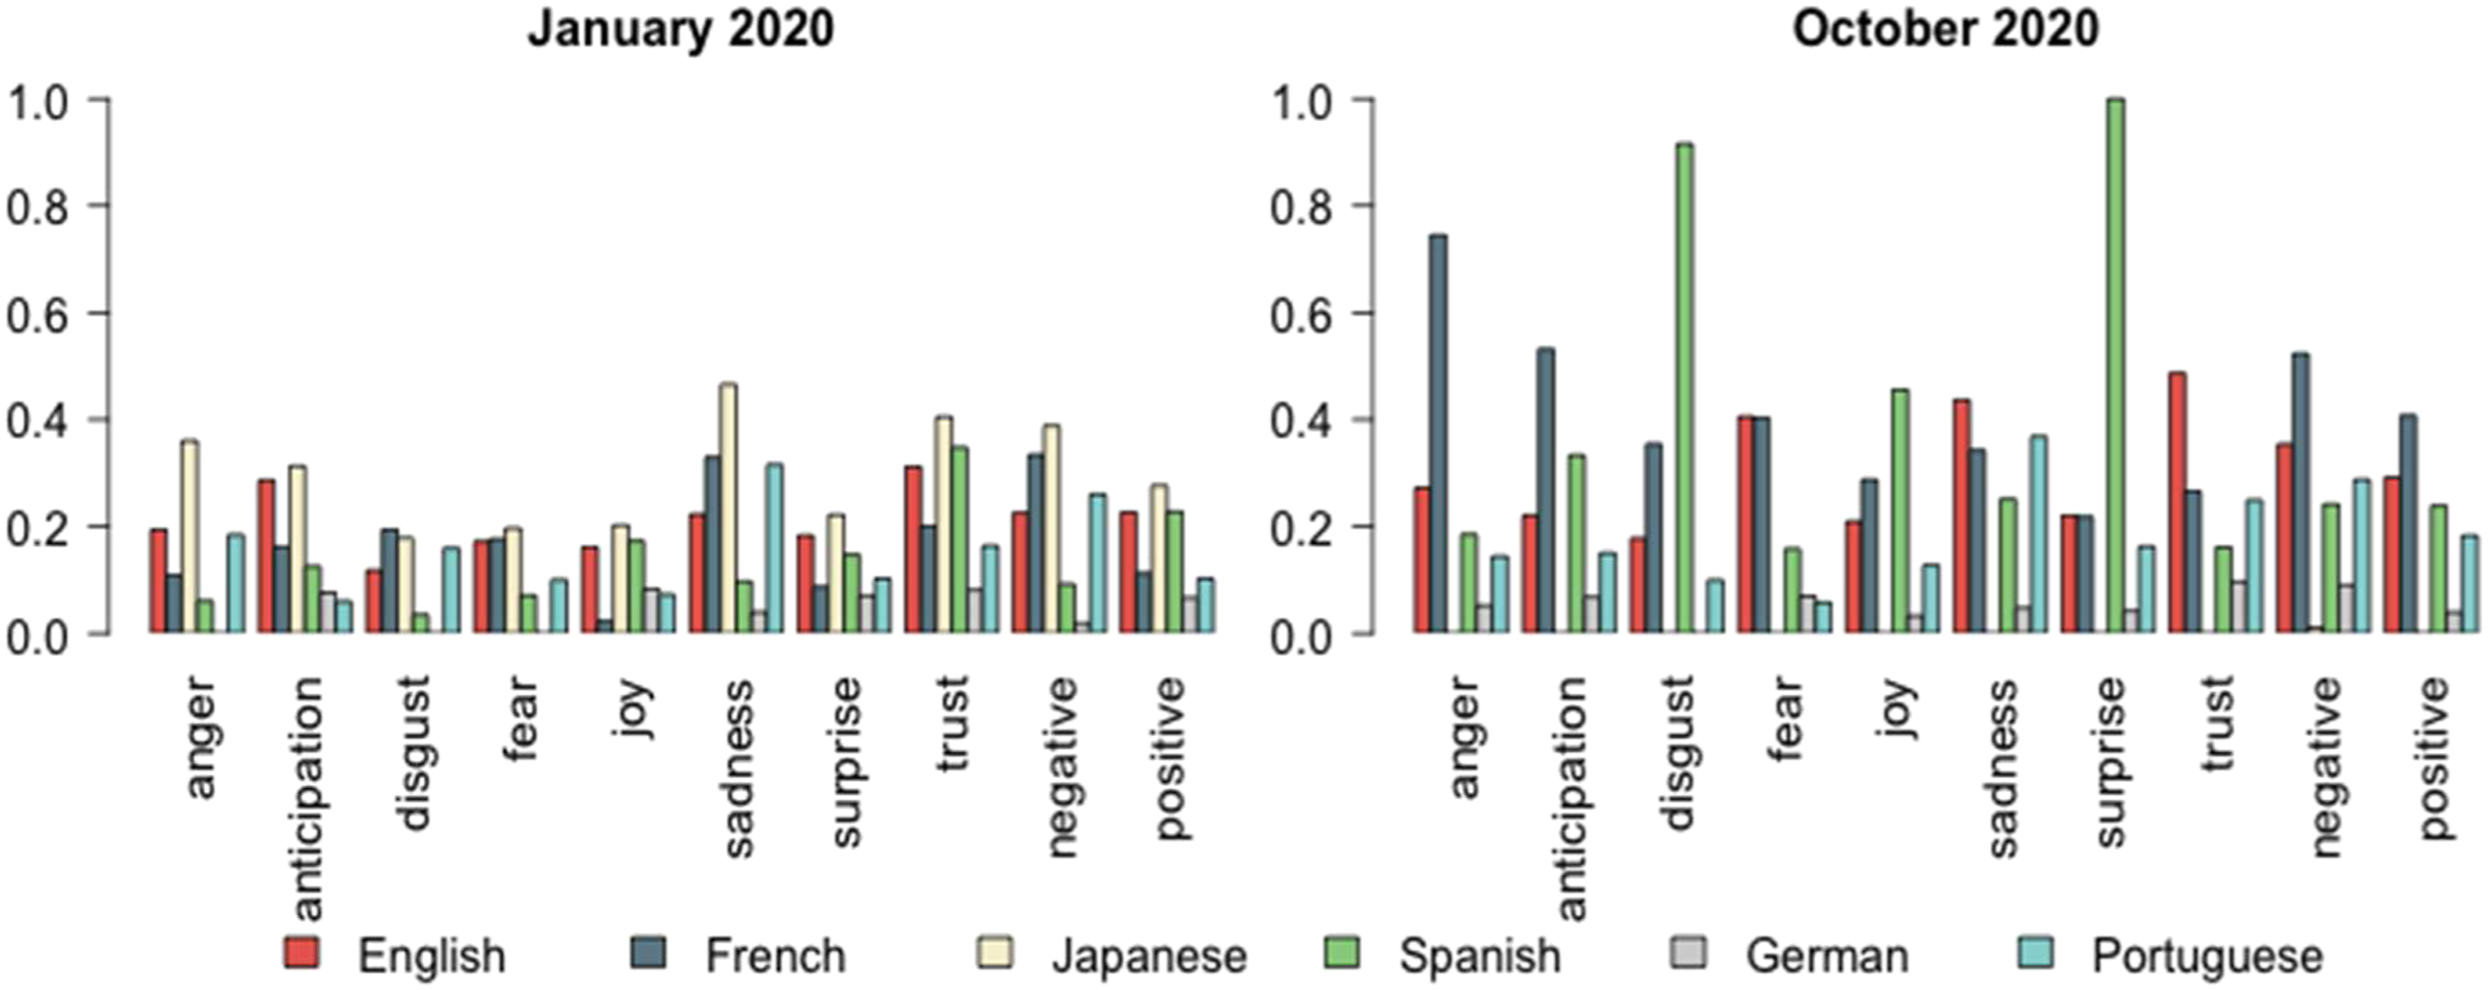
Ethnic minorities that have faced historical discrimination can have lower levels of trust in public institutions thereby being less open to providing personal travel data (Lubitow et al., 2019) and have lower acceptance of public health information (Claibourn and Martin, 2000). This suggests the need for more targeted information campaigns to build trust among ethnic citizens either to improve adoption of social distancing measures during major disruptions or help alleviate psychological stress faced by continued transit use. Our results can help augment data collection of ethnic populations and their travel experiences on public transit to tailor public health announcements and inform transit closures.
Conclusions
The future of transit planning and the deployment of new smart mobility services needs to account for the different needs of diverse citizens (Lenz, 2020). Understanding individual level transport experiences through social media can help inform new data collection methods and demand modelling that accounts for different journey purposes and patterns between men and women, the safety concerns among diverse gender groups, youth and seniors, or the specific travel needs of new migrants and lower income households (Mendez et al., 2019). Importantly, what needs to be factored into current and future social distancing measures are the inequalities faced by the most vulnerable citizens that place them at greater risk and with less socioeconomic and physical means to weather the storm. Our methods can be refined to help inform: future social-distancing measures, that could be more responsive to both the frequency of travel but also the emotive response of travellers differentiated by age, gender and ethnicity; information campaigns and language services could be more targeted specifically for non-English speaking travellers who may be new migrants that critically depend on public transit for job search and access to other basic amenities; and, transit monitoring services to help mitigate safety risks faced by women, children or night time workers that may depend on transit during non-peak hours.
Supplemental Material
Supplemental Material - Monitoring the well-being of vulnerable transit riders using machine learning based sentiment analysis and social media: Lessons from COVID-19
Supplemental Material for Monitoring the well-being of vulnerable transit riders using machine learning based sentiment analysis and social media: Lessons from COVID-19 by Martino Tran, Christina Draeger, Xuerou Wang and Abbas Nikbakht in Environment and Planning B: Urban Analytics and City Science
Footnotes
Author contributions
MT designed research, analyzed data, wrote first manuscript draft. CD, XW, AN implemented research, collected and analyzed data, edited draft manuscript
Declaration of conflicting interests
The author(s) declared no potential conflicts of interest with respect to the research, authorship, and/or publication of this article.
Funding
The author(s) disclosed receipt of the following financial support for the research, authorship, and/or publication of this article: We acknowledge funding support for this research from TransLink New Mobility Grant Program.
Supplemental material
Supplemental material for this article is available online.
References
Supplementary Material
Please find the following supplemental material available below.
For Open Access articles published under a Creative Commons License, all supplemental material carries the same license as the article it is associated with.
For non-Open Access articles published, all supplemental material carries a non-exclusive license, and permission requests for re-use of supplemental material or any part of supplemental material shall be sent directly to the copyright owner as specified in the copyright notice associated with the article.