
Abstract
Given Japan’s substantial exposure to many kinds of natural hazards, such as earthquakes, tsunamis, and typhoons, it has been a priority to invest in resilience, guided by evidence-based modeling. In 2011, the Great East Japan Earthquake and Tsunami became the costliest natural disaster ever recorded. This study applied a geographic information system using assumed tsunami-affected data calibrated in a recursive computable general equilibrium model to perform an economic impact assessment and an estimated recovery budget. We simulated 100 years of tsunamis and a 10-year sectoral recovery package for the sectors related to the ocean economy, such as kelp, net fishery, squid, other fisheries, food processing, and recreation, with a capital-use subsidy policy regarding investment strategy. We found that the aqua sector is incredibly vulnerable and would not recover with the capital-use subsidy within Hakodate City’s financial capability. Nevertheless, the recovery policy could still ease output price changes. On the other hand, the recreation sector could recover to pre-disaster conditions, but at huge fiscal and social costs. Meanwhile, the food processing sector’s recovery could generate social benefits and have a spillover effect on other fisheries sectors. The application of geographic information system in tsunami-prone areas could strengthen the precision of economic analysis. Such evidence-based modeling could visualize the economic impact to assist policymakers and stakeholders in foreseeing disaster risk and implementing more effective building resilience measures.
Keywords
Introduction
Damage caused by natural disasters has been a core concern for policymakers because the unpredictability of such disasters could necessitate unexpected government resource allocation. Hence, quantitative analysis and the application of technology play vital roles in disaster risk reduction. For this reason, spurred by the unforeseen incidence of disasters around the globe, research on economic modeling has attracted considerable interest. One of the expected functions of these quantitative approaches is to study the socio-economic impacts of natural disasters.
Economic modeling and frameworks have been developed in the presence of arguments pertaining to limitations regarding handling hazard damage in accordance with geographic features. Okuyama (2008) summarized the strengths and weaknesses of the input–output (IO) analysis, the social accounting matrix (SAM), and the computable general equilibrium (CGE) models. IO table datasets enable straightforward economic modeling analysis. However, CGE, by virtue of its nonlinearity, is capable of capturing price changes and their social welfare consequences, but it is limited with respect to incorporated resources and predetermined parameters. Rose et al. (2011) indicated that the flow of goods and services produced by property consisting of capital stock and labor endowment reflects business interruption triggered by disasters such as earthquakes. The multiplier effects are highly associated with the supply chain, while such interdependence could be interpreted from the IO table, if the damage estimates are conducted using an evidence-based approach. Such flow analysis is more competitive than stock analysis for its provision for spatial and sectoral linkages. The details of modeling dialogues can be found in Boisvert and Boisvert (1992), Brookshire et al. (1992), Rose et al. (2004), and Rose and Liao (2005).
There are three types of conventional economic models: IO, SAM, and CGE. Okuyama (2008) pointed out that the merits of the above methodologies include (1) the estimation of business interruptions without stock damage, (2) focus on an economic performance measure, (3) consistency with traditional economic indices, and (4) the provision of specific policy recommendations by analyzing and estimating disasters’ short-run impacts. IO table datasets enable economic modeling analysis of IO and CGE; however, CGE is superior to IO on a few points. CGE can analyze both the demand and supply sides, price change effects, and limits on incorporated resources, and the analysis framework is not limited to linearity. Some studies have used CGE analysis, such as Boisvert and Boisvert (1992), Brookshire et al. (1992), Rose et al. (2004), and Rose and Liao (2005). Okuyama (2008) pointed out some limitations of CGE, namely its underestimation of economic damage and, referring to Rose and Liao (2005), the fact that the assumption of optimal behavior in CGE is only based on predetermined disaster occurrence.
In their dynamic CGE analysis, Rose and Liao (2005) focused on the impact analysis of businesses’ resilience to water supply lifeline disruptions caused by disasters, whereas solutions for the limitations of CGE modeling to handle hazard damage on a greater scale and across a longer time span for output recovery are desirable. Economic modeling and frameworks have been gradually developed for industry-level policymaking. Okuyama and Chang (2010) interpreted the National Research Council’s (1999) evidence, including data availability, scope, broad influences, uncertainty and stability, and dynamic processes. In response to data availability, disaster data are mostly available in a limited range and are not directly connected to socio-economic damage or spatial effects.
For disaster impact analysis, Huang and Hosoe (2016) and Huang et al. (2020) estimated capital stock damage in an assumed earthquake scenario using city-level information pertaining to collapsed buildings. In order to estimate economic damage due to lifeline failures in the Memphis region, Cole (1998) conducted SAM based on county-level economic data and GIS-based location data. Veen and Logtmeijer (2003) demonstrated economic hot spots computed from multipliers of the IO table combined with geographical industry information obtained through GIS. Yamano et al. (2007) revealed economic and social vulnerability to industrial activities and population density in the form of a hot spot map using IO and GIS. To overcome the limitation of the geographical data used in CGE modeling, we applied the GIS to directly connect socio-economic data, in short, capital loss. Disaster damage and casualties are generally spaciously diverse, in response to various problems’ aspects, following papers that have combined economic modeling with spatial capital loss.
To increase disaster preparedness, policy discussions should aim at holistic recovery planning, with clarification regarding which industrial categories governments should prioritize in terms of providing financial assistance. We thus integrated CGE economic modeling with GIS data to provide an evidence-based approach and plausible policy recommendations in response to tsunami disaster risk. This research aimed to perform a sectoral impact assessment of tsunamis and create a 10-year recovery plan capable of responding to the most devastated tsunami disaster scenario, with clarification of the industries for which Hakodate City should prioritize investment.
Data
Method and analytical flow
Hakodate City was selected as the research case for data availability and its socio-economic importance to Japan’s ocean economy. Hakodate is a city located in the southern Hokkaido prefecture, facing the Tsugaru Bay area, surrounded by the Tsushima and Oyashio currents. Since the 19th century, it has developed as an offshore fishery basement. According to the Hokkaido prefecture annual fishery report (Hakodate City, 2013), total yearly fishery production is 57,000 tons (fifth in Hokkaido), while the total annual fishery production yield is valued at 19.3 billion JPY (second in Hokkaido). Hakodate has flourished because of the longevity of its high fishery production; however, the geographical characteristics that facilitate such productivity also make the area vulnerable to ocean-related disasters. Hakodate has experienced massive tsunamis due to large earthquakes such as the Chile Earthquake (1960), injuring 855 people (while 142 people are dead or still missing); Tokachi-Oki Earthquake (1968); as well as the Great East Japan Earthquake and Tsunami (GEJE) in 2011, for which the maximum wave height was 40.1 meters, killing more than 15,000 people (while around 2500 people are still missing) and costing the Japanese economy about 156 billion USD in losses (TDL, 2019., Cabinet Office Japan, 2016). .
There are several analytical methods to calculate natural disaster damage. The most inclusive calculation is based on estimated regional capital and labor loss, with the national government mostly conducting these assessments. In addition to risk assessment, this research departs from the existing estimation methods while it aims to investigate the most cost-effective investment recovery strategy to identify which industry should be prioritized for recovery investment under time and resource constraints.
In this line of research, in order to provide the supplement spatial analysis aspects of economic modeling, we applied a tsunami hazard map published by Hakodate City and connected it to the amount of capital for each street address. The amount of capital is categorized into around 100 industry segments. To increase the depth of the analysis of higher-order effects, we focused on office building capital losses. Since general office buildings accommodate multiple companies (sectors) on different floors, tsunami damage differs by height. However, although tsunamis do not typically engulf higher floors, lower-floor physical damage can certainly extend upwards; that is, when the first floor is flooded, the whole building’s business-as-usual (BAU) operations are halted.
To develop an analytical method that accommodates scientific data for damage estimates and policy simulations, the research proceeded as follows: (1) calculate the tsunami damage to capital and labor, mainly by using the geospatial information system (GIS); (2) calculate the city’s economic loss using an IO table; and (3) create recovery process scenarios and policy simulations using a CGE model. This research mainly focused on business sectors with offices listed in the Economic Census (Statistics Bureau of Japan, 2016). Therefore, the damage results that were calculated differed from the data representing Hakodate City’s total economic damage. Table 1 summarizes the data that were used, obtained through free access open data sourcing from various institutes. The office data are classified into 99 industries, which are aggregated into 16 sectors in the IO table (Supplemental Table A.1.) that was used for the 10-year recovery policy simulations.
Summary of data used.
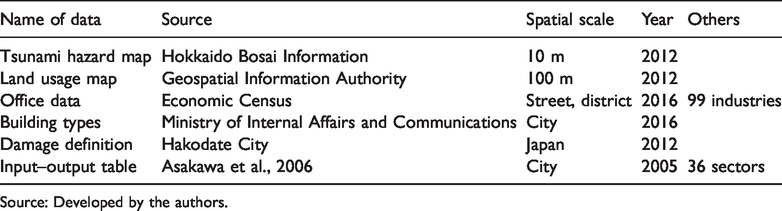
Source: Developed by the authors.
Tsunami damage analysis
Office building location data
To estimate the number of offices and employees in Hakodate City, we examined office data to obtain the number of offices and employees in each of the 99 industries that were examined. The data are accumulated for each street in Hakodate City, and we assumed equidistance in the building areas defined by Japan’s Geospatial Information Authority land usage map. Generally, offices are situated on different floors in buildings; therefore, as previously mentioned, tsunami damage to offices should differ depending on the floor on which a particular office is located. However, it can be assumed that once the lower floor of a building is flooded by a tsunami, it will be difficult for offices on the upper floors to do business. This study therefore assumed equal damage to street-level offices.
Tsunami height data
Figure 1 shows the spatial distribution of the tsunami flooding height for Hakodate City, based on Hokkaido Disaster Risk Reduction Information (2012a, 2012b), assuming that an Mw 9.1 earthquake occurred southeast of the Hokkaido Pacific rim (approximately 350 km from Hakodate City). We calculated each street’s maximum height to estimate the worst case scenario damage. According to the district’s cascading layer and the tsunami hazard map, the coastal areas are all in the at-risk-for-flood zone. Most of all, the southwest area is where downtown is located in terms of the harbor, logistics, and market facilities.
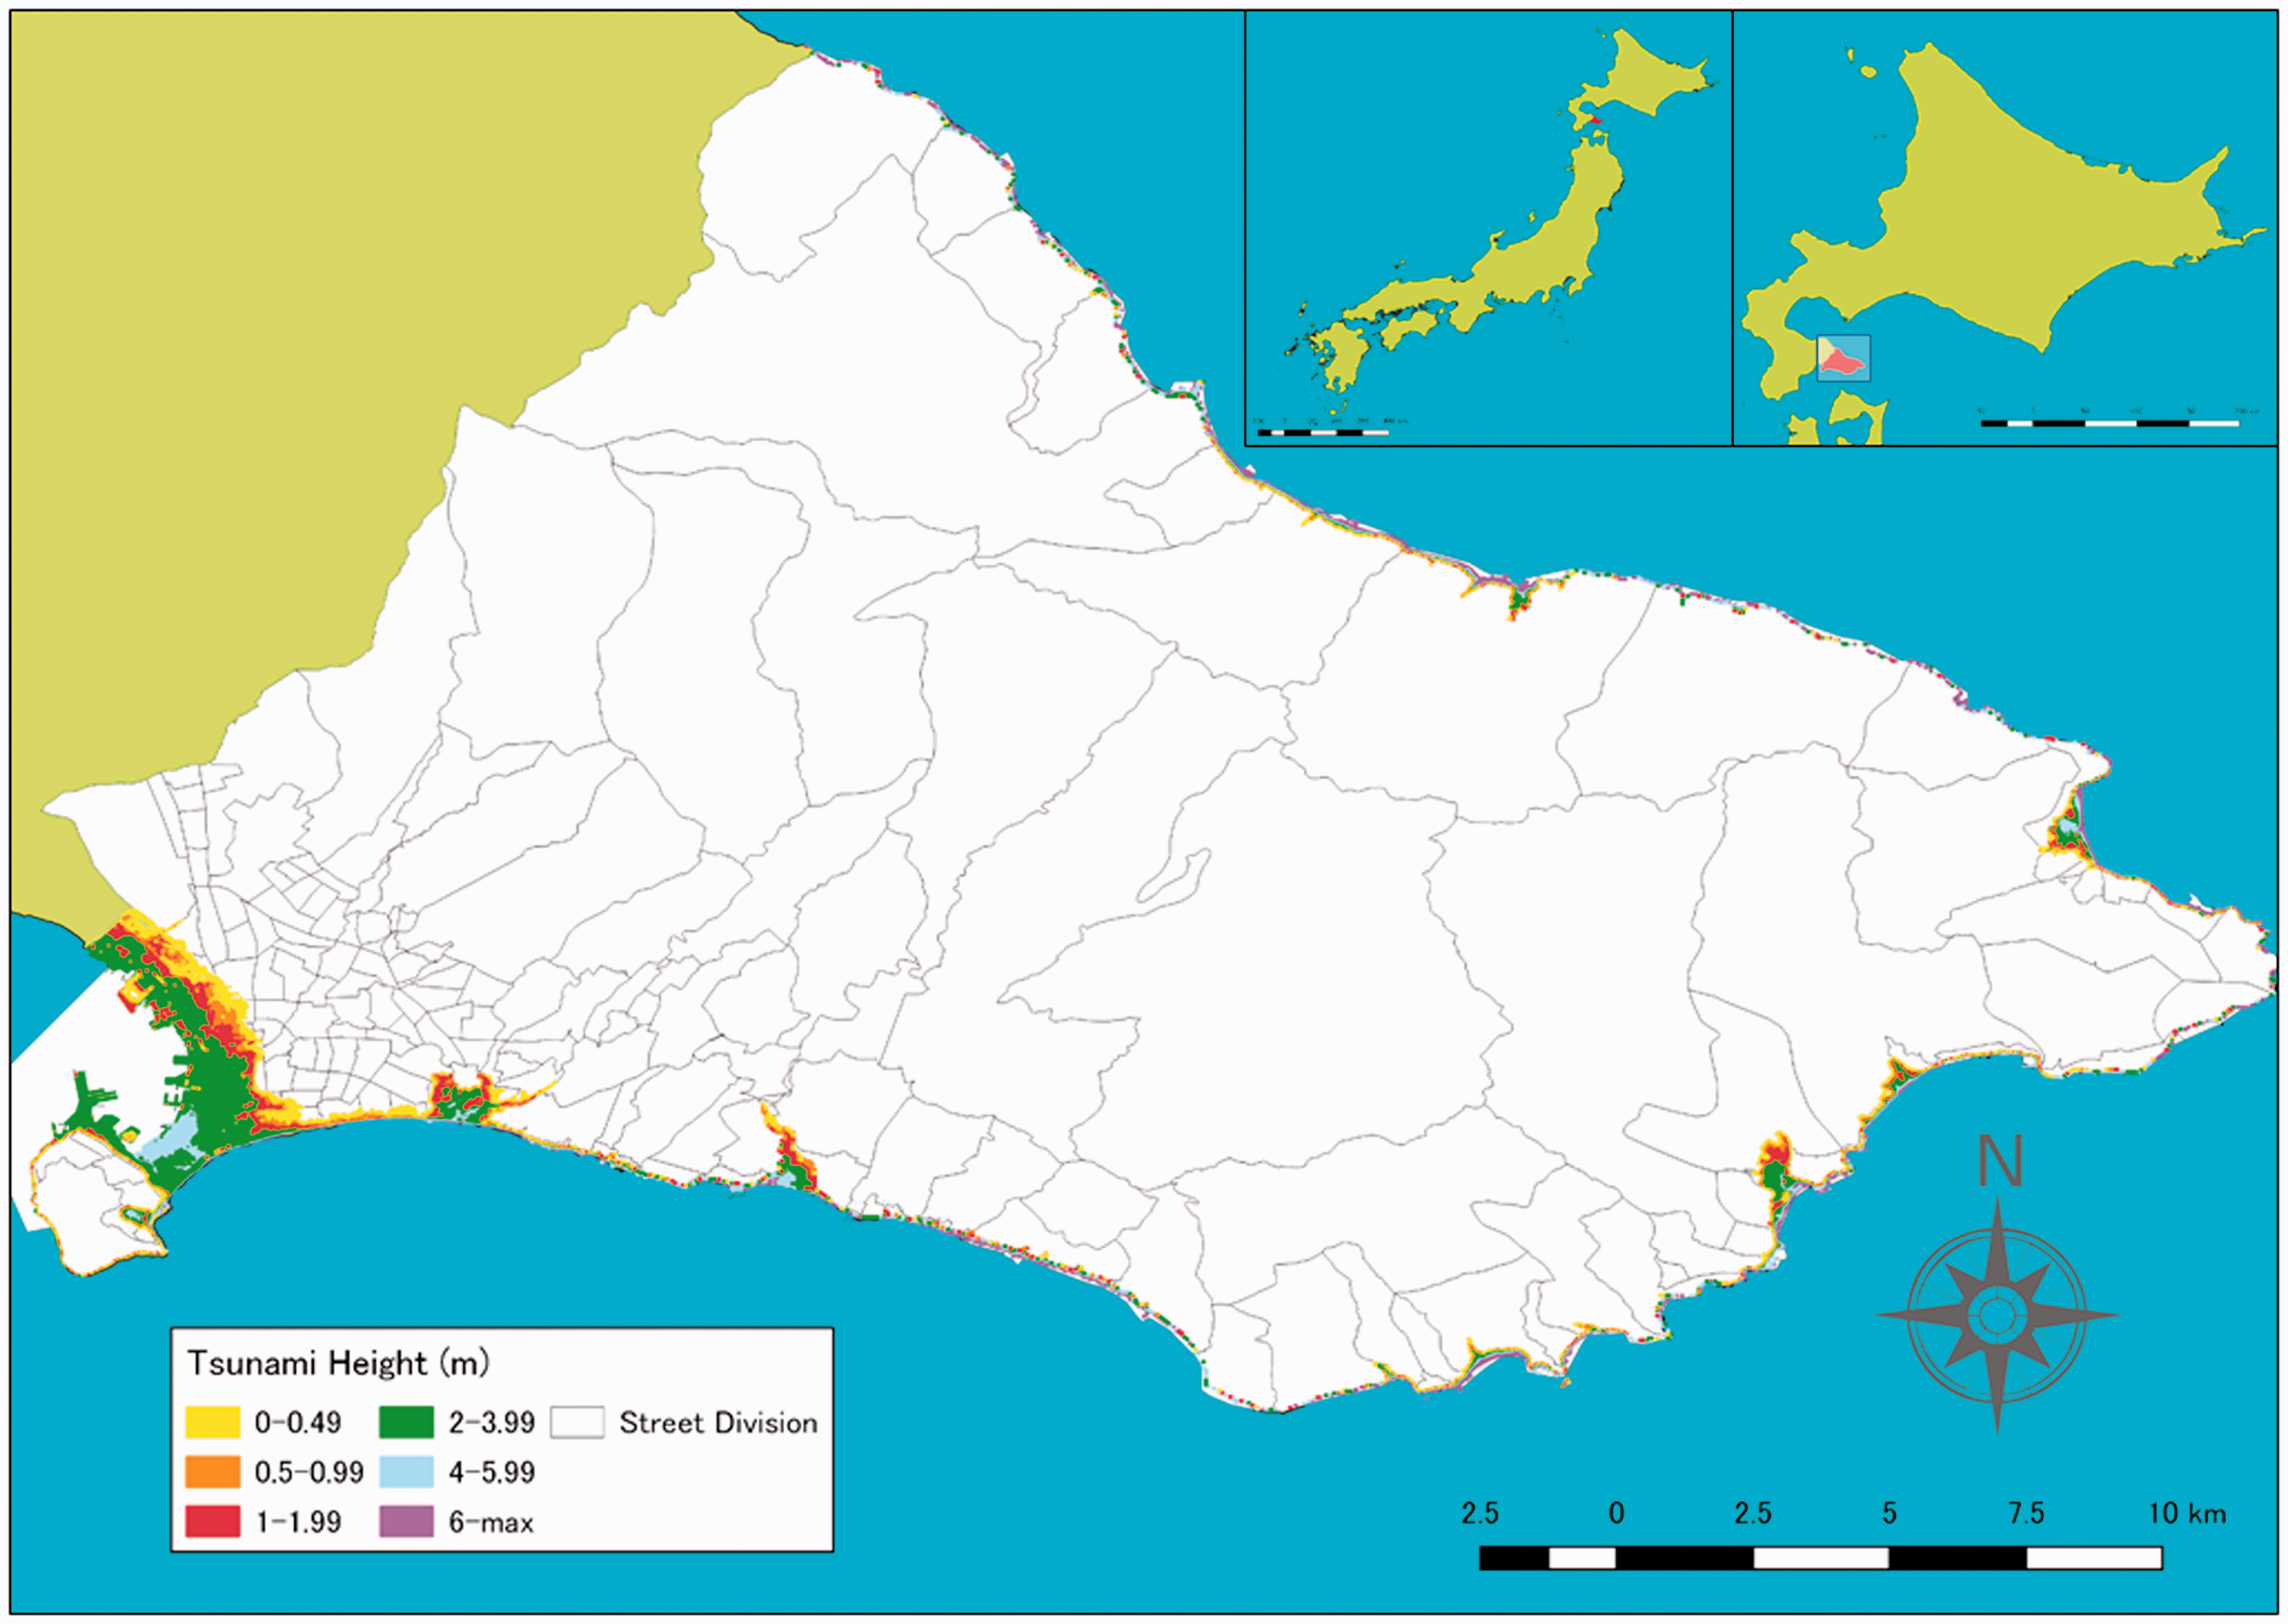
The tsunami-affected area.
Due to the data limitation presented by the geographical distribution of offices in Hakodate City, we estimated it by cascading the business land usage area at the street level, as defined by the Geospatial Information Authority, using satellite images. Generally, the western district shows higher rates than the eastern district because of the major office clusters situated in the former for better access to transportation, such as railways and shipping. A tsunami is likely to flood the entire business area in the western region. However, as mentioned earlier, the tsunami height on the west coast will be lower than on the east coast, hence estimating office damage distribution is complex. The summary statistics for tsunami height and the office cover rate are presented in Table 2.
Descriptive statistics for tsunami height.
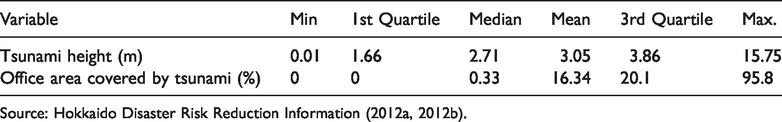
Source: Hokkaido Disaster Risk Reduction Information (2012a, 2012b).
Defining tsunami damage
Tsunami damage differs with building type; for instance, ordinary wooden buildings are more vulnerable to disasters than non-wooden buildings. Due to this variation, the number of street-level buildings by building type was relevant to this study. Street-level data are unavailable for Hakodate City; however, we calibrated the city’s 2016 tax revenue records to ascertain the number of each type of building, under the assumption that each street has the same building type ratio (Table 3). There are only two categories of official data in Hakodate City: 78.2% of buildings are wooden, while the other 21.8% are non-wooden.
The types of buildings in Hakodate.
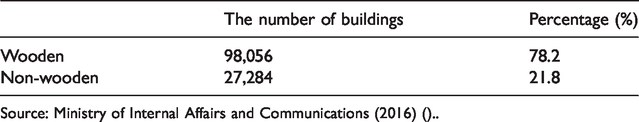
Source: Ministry of Internal Affairs and Communications (2016) ()..
We also sourced the damage definition for each building type from the report published by the Hakodate City Government (Hokkaido Disaster Risk Reduction Information , 2006); this yielded four categories: fully destroyed, half-destroyed, undated over, and under floors. Based on this definition, we made classifications according to our estimates (Table 4).
Tsunami damage definition.
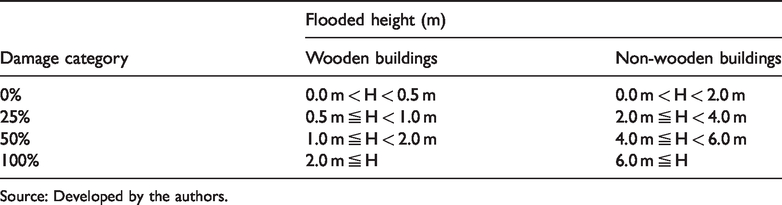
Source: Developed by the authors.
Sector classification
The data used for analysis were sourced from the Hakodate City IO table (Asakawa et al., 2006). The table contains 36 sectors and detailed information for the fishery sector, which can be used toward better policy implications for the city’s development. We aggregated the sectors into 16 sectors (Table 5), and the SAM refers to Supplemental Appendix 2. Among the classified sectors, we identified the following as related to the ocean economy: kelp (SWD), net fishery (NEF), squid (SQI), other fisheries (FIS), food processing (PRO), and recreation (REC). These are the primary sectors on which this study focused.
The aggregated sector classification.
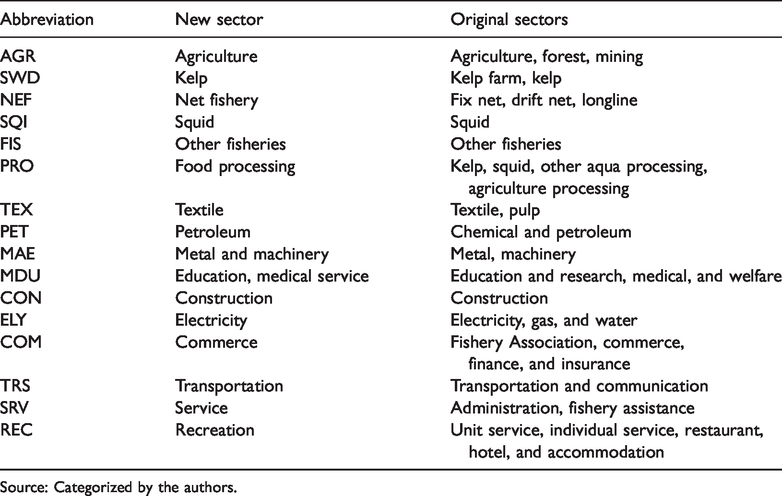
Source: Categorized by the authors.
Tsunami impacts
Combining the datasets allowed us to calculate the sectoral capital and labor damages in Hakodate City. The combined data coordinated with the IO table to estimate the damage to the economy. In this study, GIS statistics provided more detailed information on the assumed tsunami’s effect at street level. By multiplying the damaged building weight (represented in %) depending on tsunami flood height, the sectoral capital and labor endowment losses could be calculated (Table 6), with more geographic implications based on the height of the flood.
The sectoral impact of the tsunami under the flooded area.
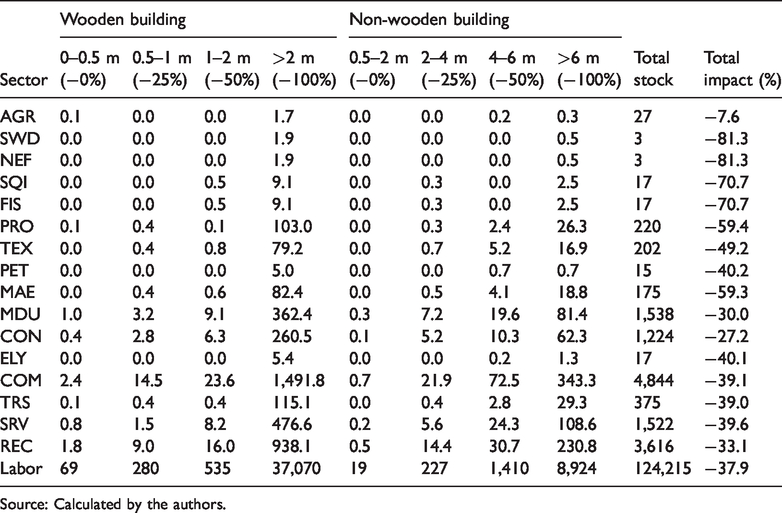
Source: Calculated by the authors.
The damage estimates show that the aqua sector would sustain severe damage; specifically, kelp (SWD) and net fishery (NEF) by 81.3%, and squid (SQI) and other fisheries (FIS) by 70.7%. Food processing (PRO) would also be damaged by 59.4%, while recreation (REC) would sustain losses of 33.1%. Labor loss is estimated at 37.9%; this refers to temporary unemployment due to building damage in the flood-affected area, rather than employee casualties. Therefore, the labor endowment could recover yearly, based on the recursive setting.
Analysis
Model structure
To analyze the tsunami’s impact, we applied a recursive CGE model to capture economic activity and conduct policy simulations for selected sectors’ recovery paths. Based on the model structure developed by Hosoe et al. (2010), we accommodated Hakodate City’s IO table using Huang and Hosoe (2016) and Huang et al. (2020) disaster analysis methods. To strengthen geographic vulnerability in order to increase accuracy, we further calibrated the capital and labor losses estimates according to the GIS. The model structure (Figure 2) and essential formula are as follows:
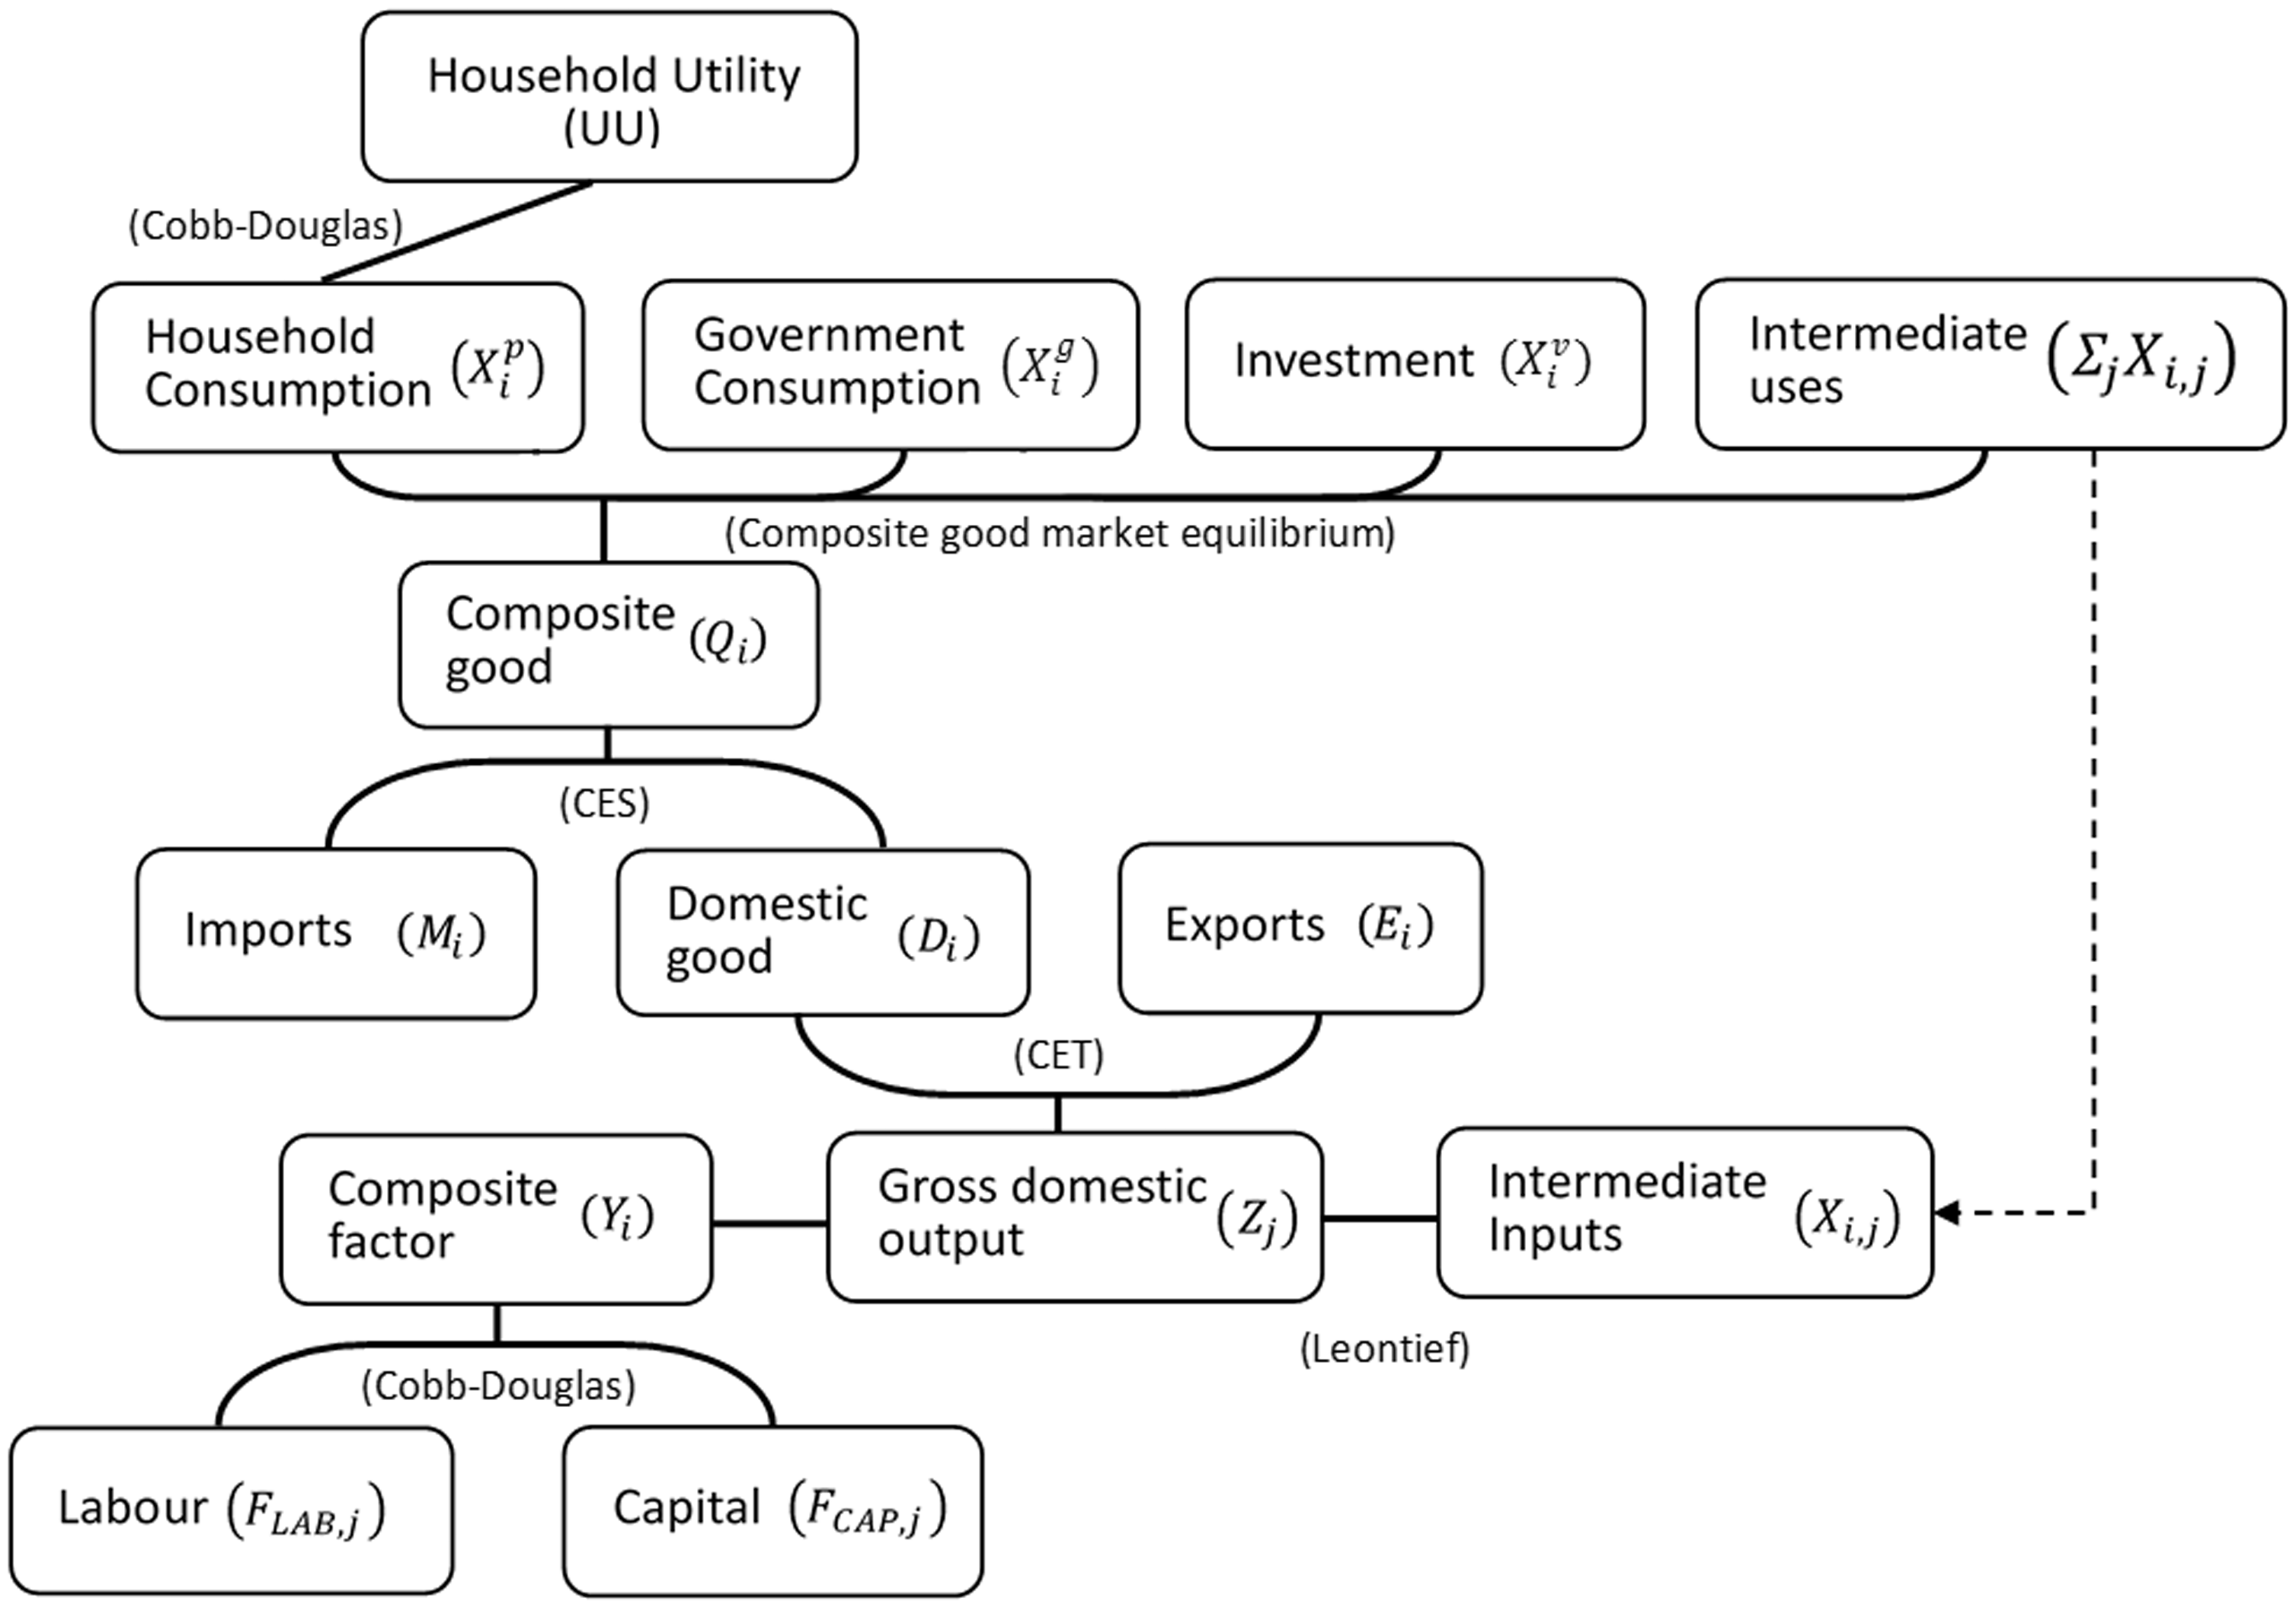
The CGE model structure.
Production is based on the assumption of substitution between capital and labor in value-added production with Cobb–Douglas type production functions. While labor and capital input contribute to sectoral output, the Leontief-type function is employed as the production function for gross output, which is comprised of value-added and intermediate input. The gross output is transformed into domestic goods and exports, with constant elasticity of transformation (CET) functions. Composite goods are produced with domestic goods and imports, with constant elasticity of substitution (CES) functions. Ultimately, the assumption of Armington’s composite goods (Armington, 1969) is used by the household and the government, in addition to investment and intermediate uses, with elasticities calibrated from GTAP Database 9.0. Finally, the household is assumed in the Cobb–Douglas type utility function, which is dependent on the consumption goods composite.
Essential formulae for policy simulation
Gross domestic output transformation function:
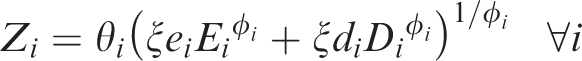
where Zi = sectoral output, ξ = share parameter, Ei = export good, Di = domestic good,
ei = exchange rate; ϕi = trans. elasticity parameter
Import demand function: Export supply function: Domestic good demand function
where
Household demand for goods:
where pq = the price of Armington’s goods, pf = the factor price, Sp = private savings, and Td = tax.
The recursive dynamic CGE model was developed based on the static model (Hosoe et al., 2010; Huang and Hosoe, 2016), while the intertemporal structure is similar to the static model. Following Hosoe (2014), dynamic model application for disaster recovery paths can also be found in Huang and Hosoe (2017). In the model structure, the capital factor is immobile, meaning that the capital that is lost in a disaster cannot be immediately rebuilt by mobilizing capital from other (less affected) sectors. In contrast, because labor endowment grows exogenously at the population growth rate, labor is mobile among sectors. This is reflected in the following equation:
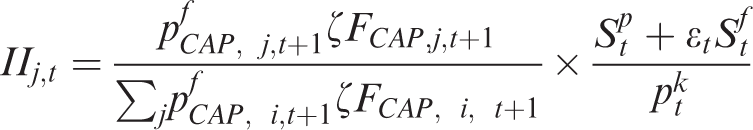
Recursive dynamics are utilized, linking economic activities between periods. In the t-th period, private savings Spt are generated with a constant saving propensity ssp. Foreign savings in the foreign currency Sft are exogenously given within a period, growing over time at the population growth rate. The exchange rate εt is endogenously determined for the current account balance. Following the parameter setting in Hosoe (2014), savings are sourced from the government behavior stated in SAM and are endogenously allocated to investment in the j-th sector IIj,t according to its expected relative profitability in the next period.
The welfare function is determined by:

UU: utility level (given); UU(·): utility function
A Cobb–Douglas type utility function is assumed to analyze social welfare, which is measured by Hicksian equivalent variations (EVs) based on household consumption reduction. Welfare refers to the expenditure function that contributes to EVs in the utility before UU0 and after UU1 in response to disaster shock, with output and price changes. Recovery policy implementation may increase the fiscal burden, resulting in a change in household welfare as a social cost. If the price of import goods is lower than domestic goods, consumption and production may also change.
Scenarios
The CGE model can capture an open economy’s disaster confrontation status. Given their interdependence, the reduction of the production factors of capital stock and labor endowment would affect the amount produced and the price of the output. The recursive setting also helps to simulate policy intervention by adding the capital stock and its social welfare consequence to resource allocation. The scenarios and assumptions that apply to the disaster impact and policy simulations are stated in the next section.
The tsunami occurs in the first year (t = 0)
Based on the GIS statistics, the Business Census, and the tsunami-affected area, the change in production factors is illustrated in the form of reductions in sectoral capital stock and labor endowment. Although it is a single-region IO table, geographic information contributed to the calculation of all possible affected areas. The overall impact is calculated individually (Table 6) in the first period (t = 0) as the occurrence of a disaster (a tsunami).
A 10-year capital-use subsidy policy
Based on the accumulated body of devastating disaster recovery experiences, although a recovery plan can help a sector resume its BAU output level, i.e. the pre-disaster condition, stakeholders should consider the enormous fiscal and social costs at which this may come. Furthermore, the capital-use subsidy could be more cost effective than the production subsidy policy because of lower market distortion by the capital factor (Huang and Hosoe, 2017).
In the case of the Great East Japan Earthquake and Tsunami in 2011, 10-year primary recovery projects were undertaken in various aspects. We have therefore provided a 10-year recovery policy for selected ocean-related sectors, namely kelp (SWD), net fishery (NEF), squid (SQI), other fisheries (FIS), food processing (PRO), and recreation (REC). A policy simulation was conducted for each sector, specifically from Periods 1 to 10 (t = 1–10).
Since recovery policy content can be varied, to simplify the approach, in the interest of straightforward policy implications, we used capital-use subsidy as the representative method. The subsidy could serve as an incentive for the industry to invest in capital stock to supplant the damaged capital stock, such as buildings and manufacturing facilities, in order to resume the pre-disaster output level in the 11th year. Each sector would require a different level of support, according to their individual tsunami disaster impacts. In addition to the fiscal burden of policy implementation under Hakodate City’s budget constraint, households bear the social costs under drastic price and consumption adjustment conditions.
Recursive modeling assumptions
The model structure is nonlinear, and each sector would produce according to its optimal factor input condition in the Cobb–Douglas function. However, capital and labor factors have different recovery paths in response to policy interventions.
The capital factor
The capital sector is immobile within the industry, implying that capital stock cannot flow from one sector to another. Meanwhile, its increment can only increase through investment, or else activity is determined based on the optimal sectoral decision of revenue distribution. The capital-use subsidy could illustrate policy effectiveness toward sectoral output recovery.
The labor factor
The labor factor is mobile, implying that human resources can flow among sectors, and labor can switch to other sectors under their optimal utility. Based on an analysis of evacuees’ return and employment following the Great East Japan Earthquake (Yamasaki et al., 2017) and other disasters, in the context of a stimulus recovery (Huang and Hosoe, 2017) path, we assumed that the labor force could recover 75% annually and fully recover in the fifth year.
Results
In the policy simulations, we examined a 10-year recovery policy for the sectors that are related to the ocean economy. A sensitivity test for the robustness of the results is presented in Supplemental Appendix 1. Based on the CGE model structure of economic interdependence among sectors, households, and government behaviors, we examined the most feasible capital-use subsidy rates within Hakodate City's financial capability. Table 7 demonstrates the subsidy rate for the recovery policy and the consequences.
The capital-use subsidy rate for a 10-year recovery policy.
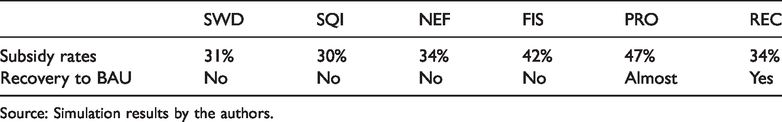
Source: Simulation results by the authors.
For the aqua sectors, recovery to the BAU level is unreachable, despite the capacity-use subsidy input. Given that these four sectors’ estimated capital stock damage is 70%–80%, the aqua sector’s production level could not be sustained in the presence of such a devastating factor reduction condition, even with policy intervention. Moreover, the output price of a highly disaster-affected primary sector may be far less competitive than import goods from other regions, thus derailing production motivation.
Output change
Figure 3 shows the selected sectors’ recovery paths with the capital-use subsidy. The bold line represents the post-disaster output level, and the dotted line is the output level with policy intervention. The simulation results indicated that the kelp (SWD) and other aqua sectors (SQI, NEF, and FIS) could not recover in the 11th year due to severe tsunami damage. In contrast, the food processing sector (PRO) could recover, albeit barely, to the BAU level under the recovery policy. This situation implies that the aqua sectors’ resilience is far from satisfactory, thus requiring a substantial measure to reduce disaster risk.
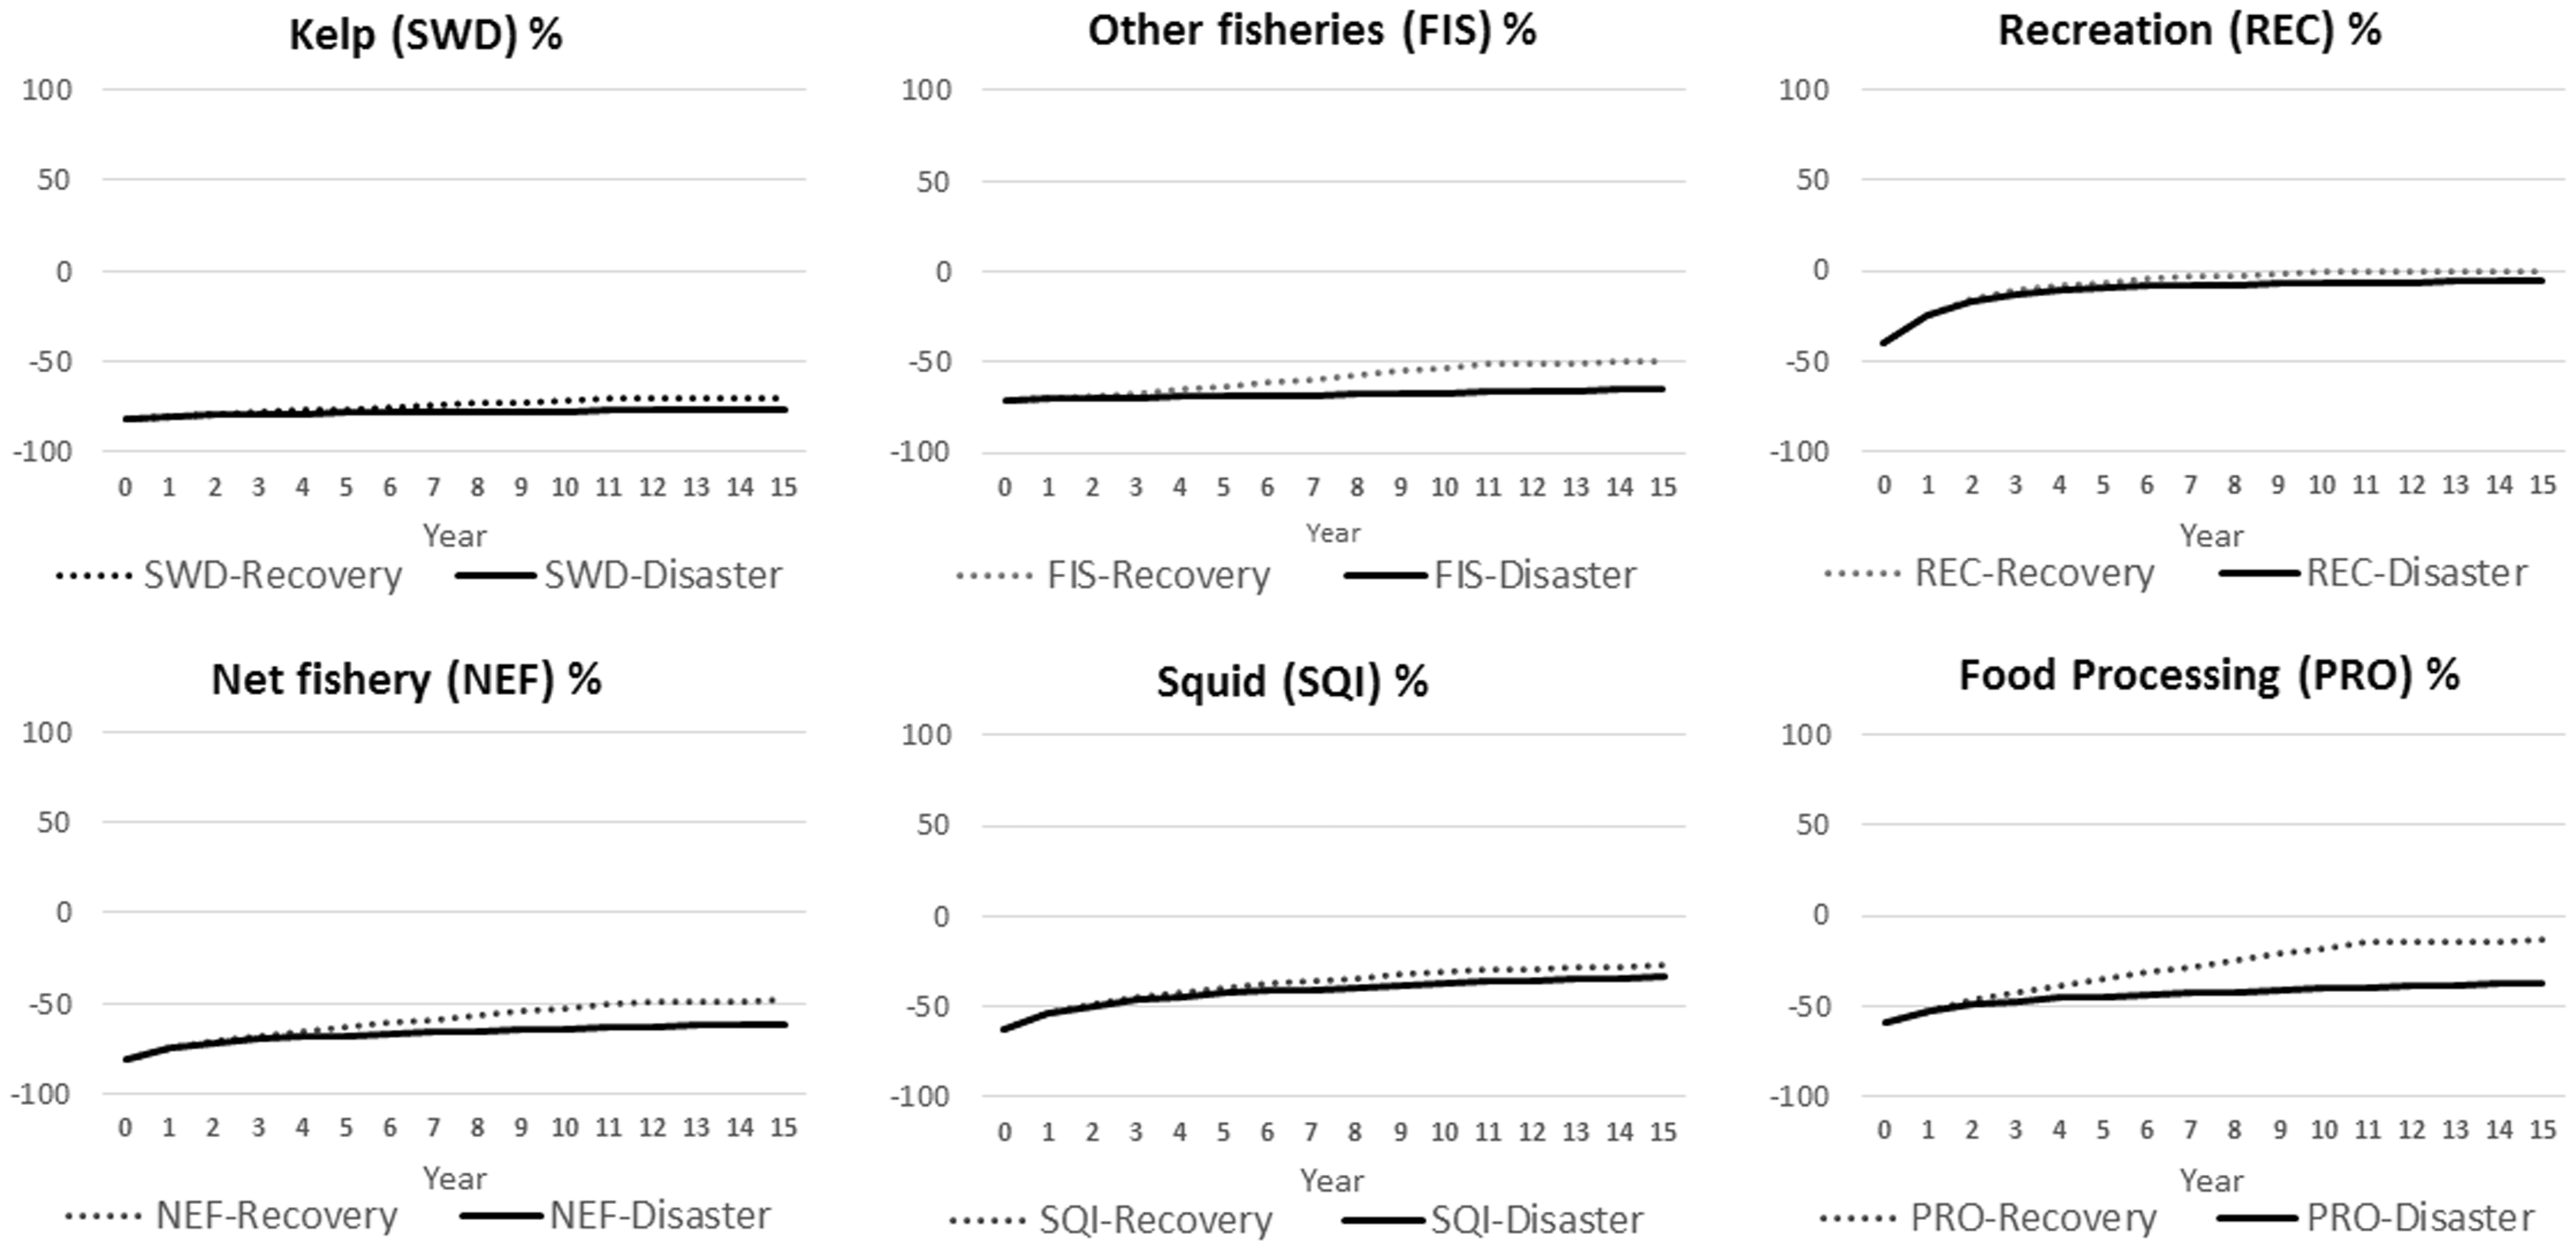
Sectoral output changes with the recovery policy.
Output price changes
Figure 4 displays the output price change in the disaster scenario and with policy intervention. Although the capital-use subsidy could not help output recover to the BAU level, we observed that the policy eased rising prices, especially in the other fisheries (FIS) and squid (SQI) sectors. Prices in the squid (SQI) and food processing (PRO) sectors could return to their pre-disaster levels after the implementation of the 10-year supported recovery policy. On the other hand, the disaster shock-related reason for price drops in the recreation (REC) sector may be the decrease in aggregate demand. The capital-use subsidy policy could help the recreation sector become a more price-competitive sightseeing attraction.
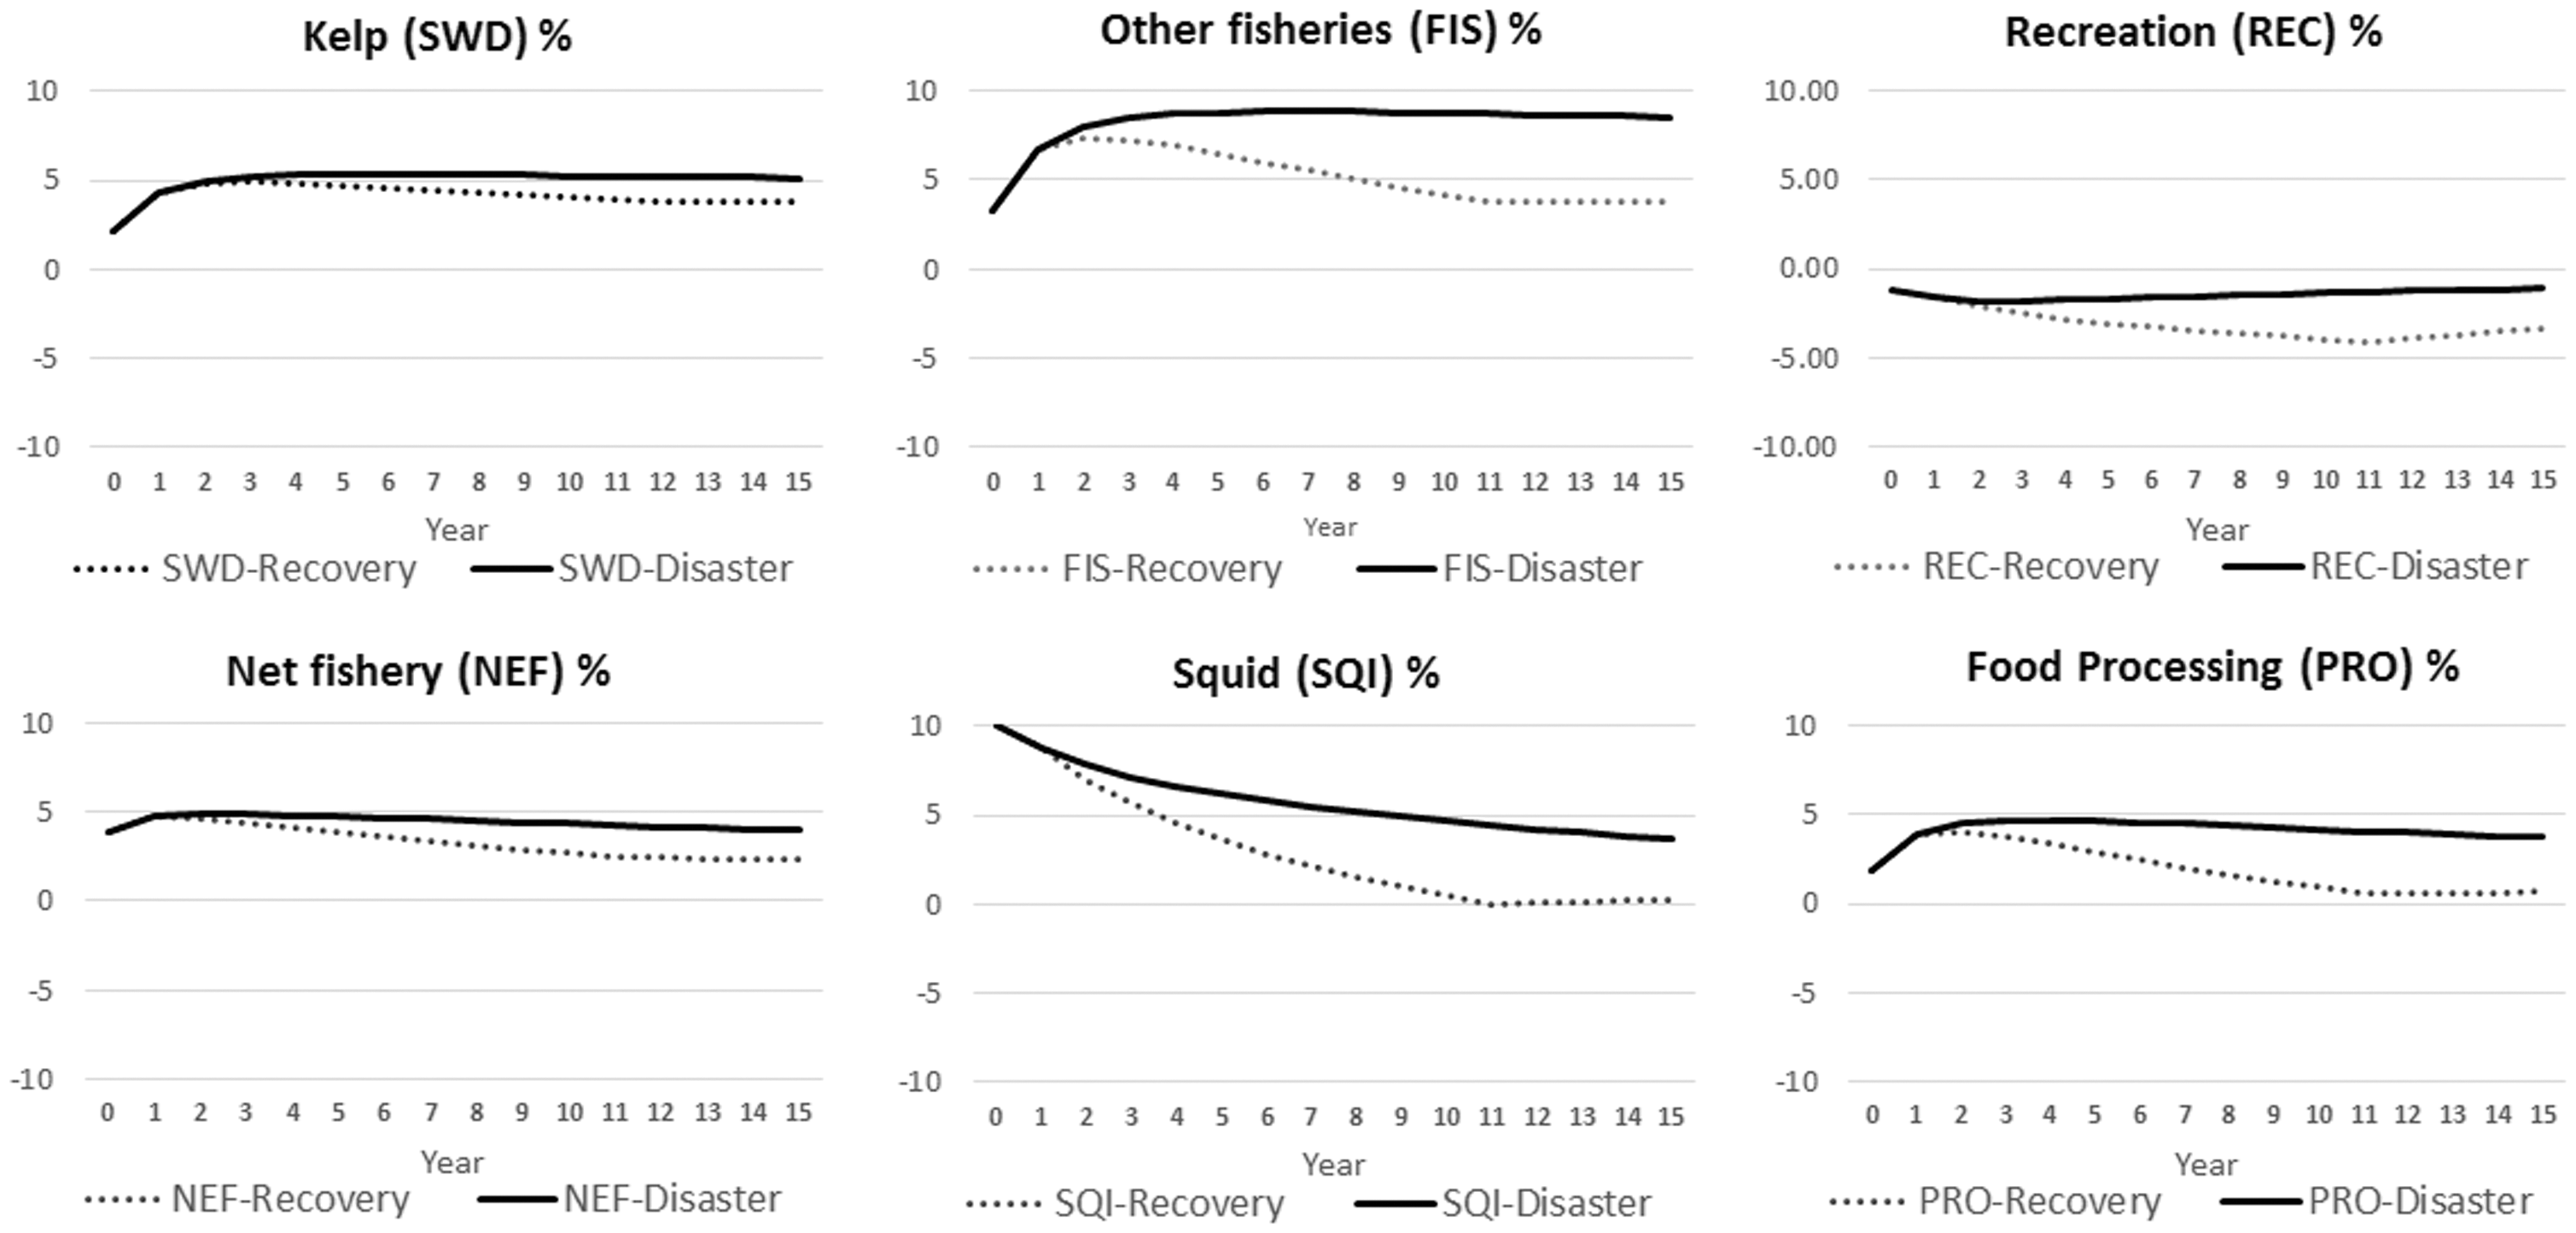
Sectoral output price changes under the recovery policy.
The fiscal cost and the social costs/benefits
Regarding policy costs, Figure 5 shows the annual fiscal cost of the 10-year capital-use subsidy recovery policy and, as measured by welfare analysis, the social costs/benefits associated with household utility changes in response to output and price changes. Since the aqua sector (SWD, FIS, NEF, and SQI) could not recover to the BAU level, we focused on the recreation (REC) and food processing (PRO) sectors with respect to the fiscal cost sourced from the lump-sum tax. The annual fiscal cost of REC is nearly 20,000 million JPY, implying that reconstruction consumes a substantial portion of the budget.
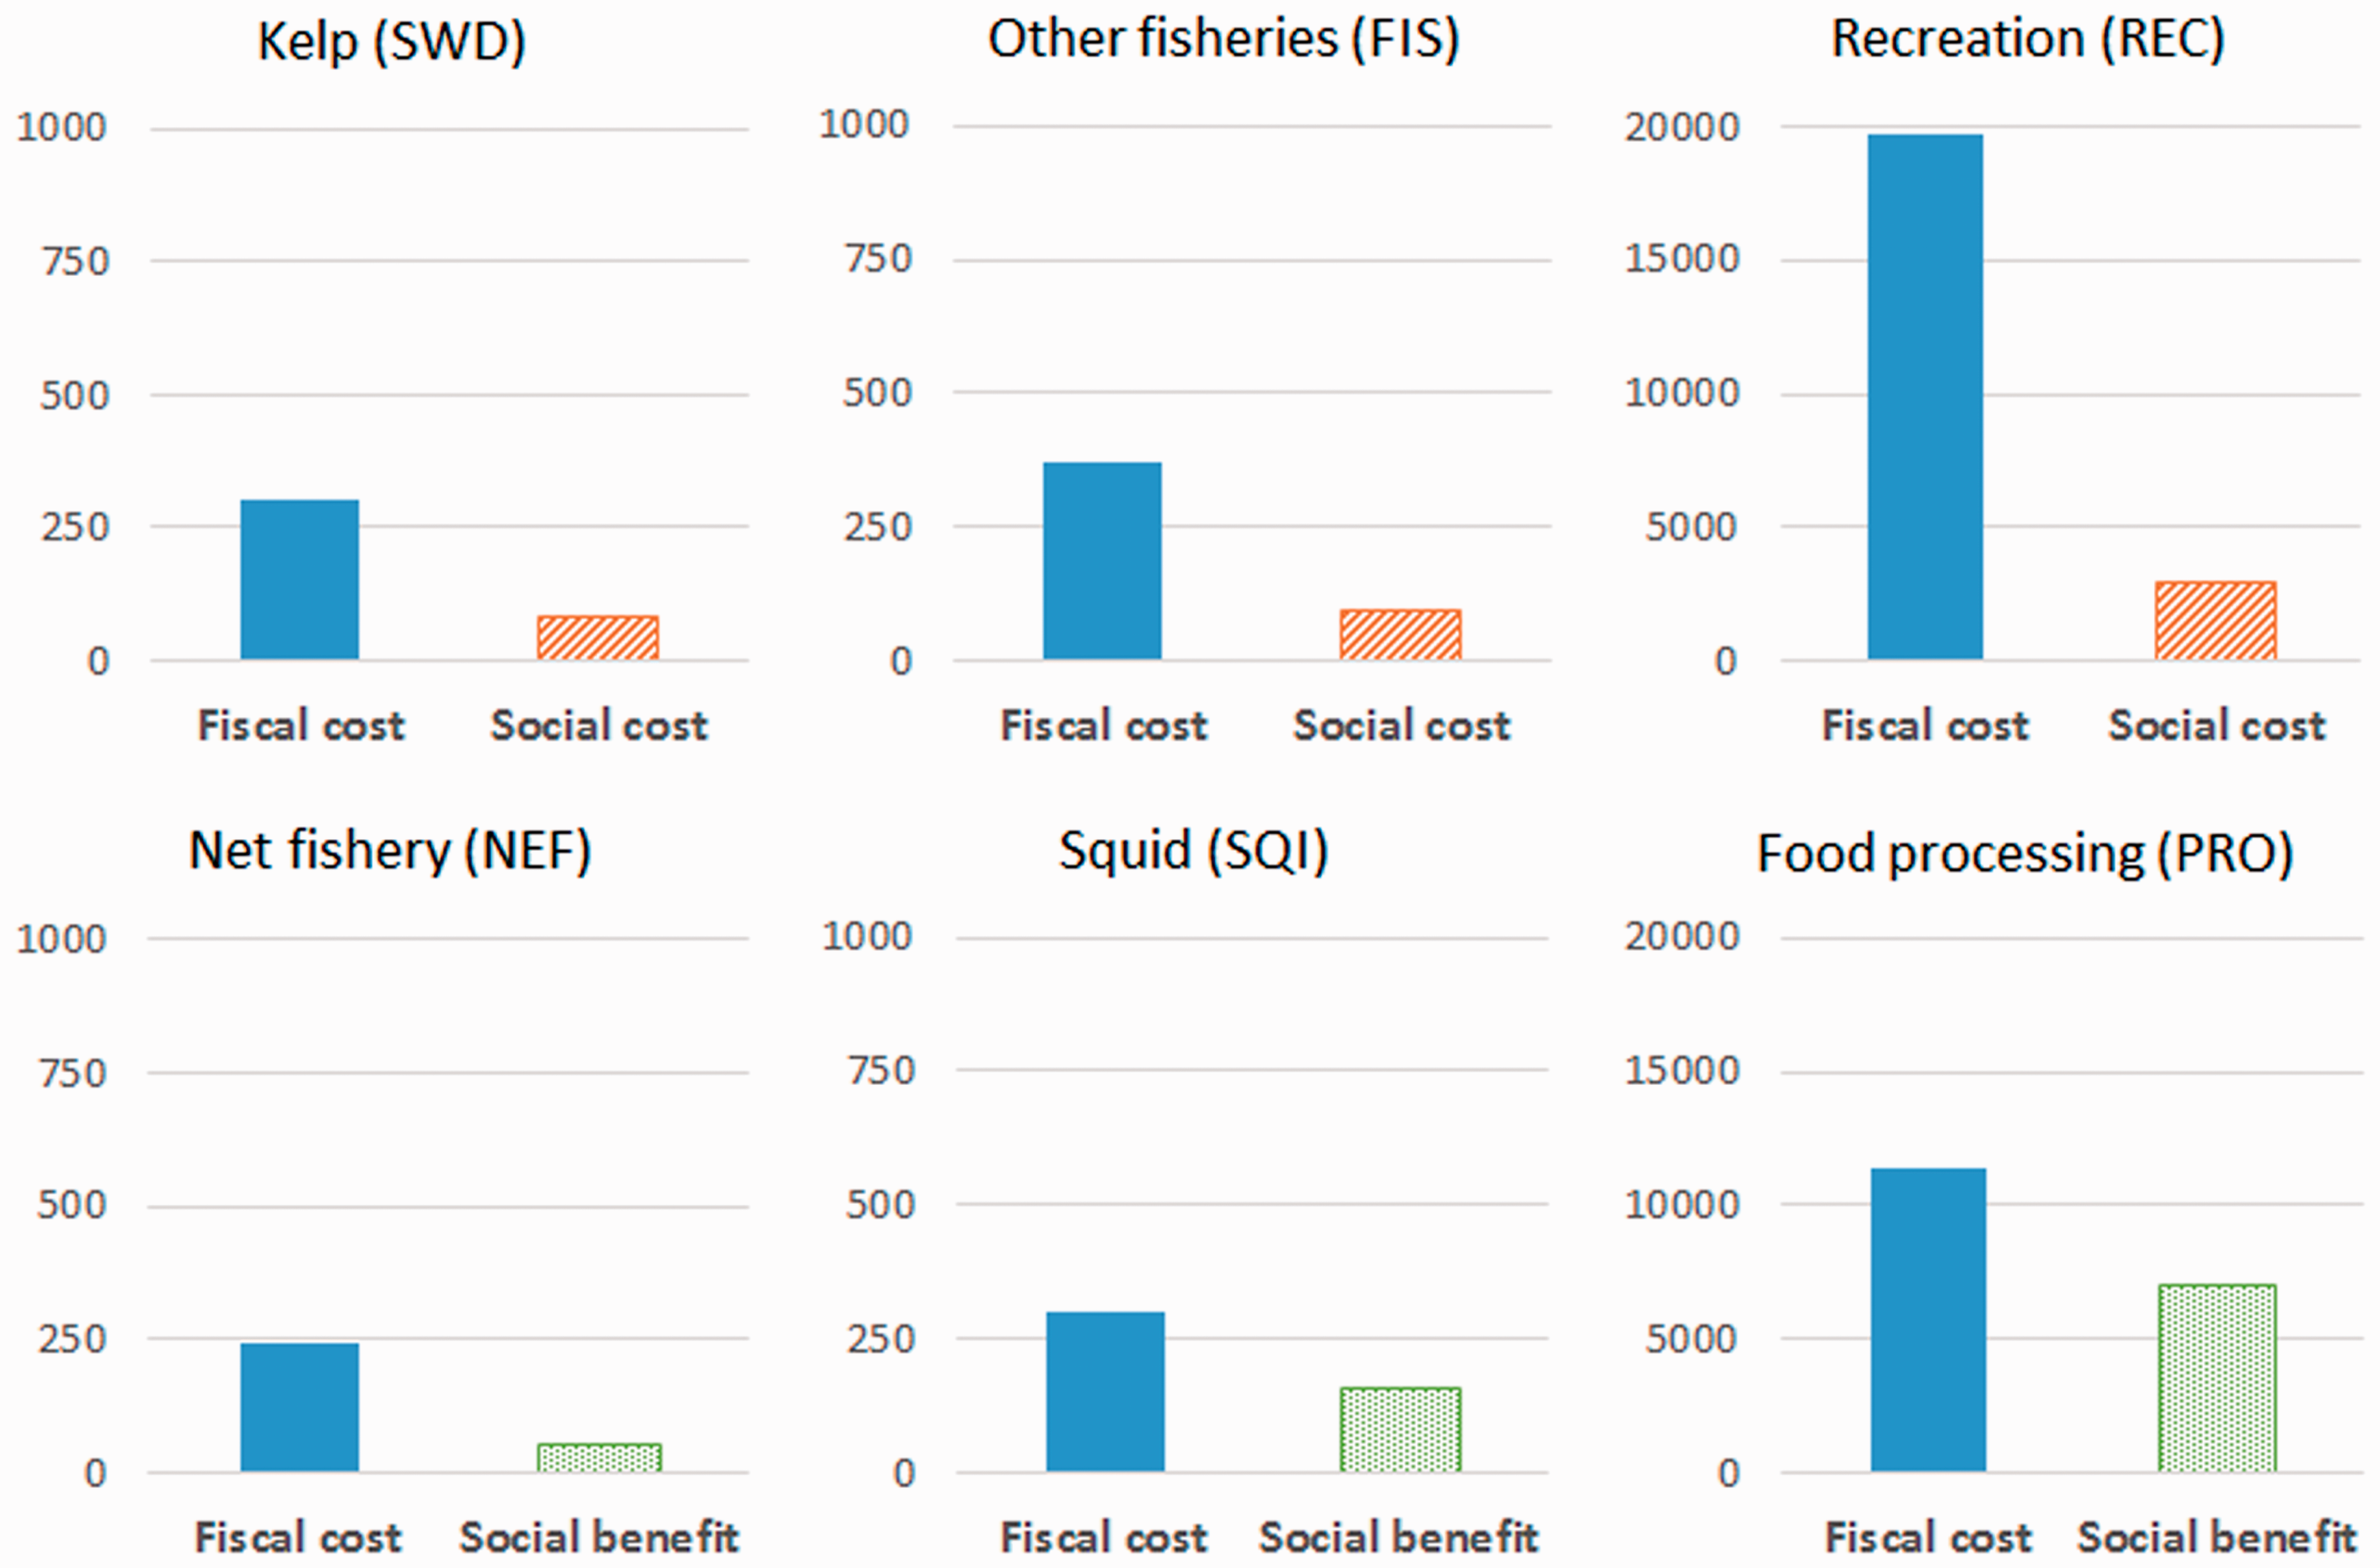
The annual fiscal cost and social costs/benefits (unit: million JPY).
The fiscal burden may also lead to a tax increase and eventually affect household resource allocation. However, based on the recovery path, recreation (REC) could recover quite rapidly without the policy because the sector also relies on the labor factor. As for food processing (PRO), the capital-use subsidy policy presents a vibrant recovery path and resilience for the industry under an annual cost of 10,000 million JPY.
Through welfare analysis, we found that the social costs generated by the recovery policy for the kelp (SWD) and other fisheries (FIS) sectors might be due to the less competitive post-tsunami damage output price. The reallocation of government resources could be less efficient. On the other hand, the social benefits generated in the net fishery (NEF) and squid (SQI) sectors could relate to their being easily consumed and processed within the region. Even though the aqua sectors’ economic scale is relatively small, considerable damage may require substantial input to resume their production.
The recovery policy is expected to generate the highest social welfare improvement for food processing (PRO), thanks to its greater interconnection in the economy structure. While the local aqua sector would be severely damaged by a tsunami, the food processing (PRO) sector could still operate in concert with less affected sectors, or even process goods imported from other regions. With the support of the recovery policy to reinforce its capacity, the food processing (PRO) sector shows a substantial increase in social benefits, indicating that recovery in this sector could accelerate other within-region sectors’ intermediate input for export to other regions.
Conclusion
Discussion
We used a recursive CGE model, together with GIS and the industry census, to visualize and quantify the disaster impact and its recovery path. The quantified results could provide insightful references for stakeholders and policymakers in their task of allocating resources for resilience investment, with implications for ex-ante disaster risk reduction (DRR) recommendations. It would be beyond the city government’s capacity to cope with such a large-scale tsunami disaster in terms of implementing and independently funding a recovery project. This study’s evidence-based quantitative approach provides stakeholders with the instruments they need to estimate an ex-ante preparedness budget.
Among Hakodate City’s ocean-related sectors, we found that the aqua sector––kelp (SWD), squid (SQI), net fishery (NEF), and other fisheries (FIS)––is extremely vulnerable and cannot recover within 10 years with the capital-use subsidy under the fiscal recovery policy within Hakodate City's financial capability. However, the recovery policy could ease the drastic output price changes, especially for other fisheries (FIS), squid (SQI), and food processing (PRO), indicating a certain level of policy effectiveness.
The consequences that are foreseeable in the simulation results suggest that resilience would require extraordinary measures or mechanisms to reduce disaster risk. According to the recovery experiences that were accumulated following the GEJE, the fishery sector in some port cities in Japan's northeast region, such as Kamaishi and Minami-Sanriku, could recover 70% of their fisheries within three years thanks to vassal donations from other regions of Japan. Such an emergent assistance framework could ensure the quick post-disaster resumption of the fishery sector’s production.
In addition, the simulation results showed that the food processing (PRO) sector requires tremendous support––10,000 million JPY annually––to recover by the 11th year, while generating notable social benefits. The high level of interdependence between many primary aqua sector industries and the food processing sector implies that latter could also fuel production in other sectors. In light of this, the disaster risk could be effectively reduced through building reinforcement or the pre-emptive relocation of the food processing sector’s tsunami-prone area as a comprehensive ex-ante countermeasure.
Research limitations and future perspectives
The research simulates Hakodate City’s most severe tsunami scenario. Sectoral recovery paths are an informative instrument for strengthening social-economy resilience using an evidence-based approach. The visualization of the disaster impact could also help the city government secure the necessary financial support from the central government. The simulation results only demonstrate the fiscal recovery policy, given the limitation with respect to acquiring more scenarios pertaining to DRR measures such as dyke construction or building reinforcement. In addition, the application of building data for analysis was based on rough assumptions of the proportions of wooden and non-wooden buildings. Nevertheless, the quantified impact assessment could provide holistic policy implications for disaster risk identification.
This risk assessment method, utilizing GIS and recursive CGE models, could be applied to various kinds of natural hazards such as typhoons, earthquakes, or bush fires. It is strongly recommended that more sophisticated hazard maps and industrial census data, including building types linked with GIS and IO tables, be made accessible to utilize the modeling instrument and allow for the quantification of awareness and DRR. Tsunami impact modeling highlights the necessity of resilience investment and contributes to city and regional betterment in the context of sustainable development.
Supplemental Material
sj-pdf-1-epb-10.1177_2399808320977865 - Supplemental material for Impact assessment and a fiscal recovery policy for tsunami risk: GIS and the general equilibrium approach in Hakodate city, Japan
Supplemental material, sj-pdf-1-epb-10.1177_2399808320977865 for Impact assessment and a fiscal recovery policy for tsunami risk: GIS and the general equilibrium approach in Hakodate city, Japan by Hajime Tanaka and Michael C Huang in Environment and Planning B: Urban Analytics and City Science
Footnotes
Declaration of conflicting interests
The author(s) declared no potential conflicts of interest with respect to the research, authorship, and/or publication of this article.
Funding
The author(s) received no financial support for the research, authorship, and/or publication of this article.
Supplemental material
Supplemental material for this article is available online.
References
Supplementary Material
Please find the following supplemental material available below.
For Open Access articles published under a Creative Commons License, all supplemental material carries the same license as the article it is associated with.
For non-Open Access articles published, all supplemental material carries a non-exclusive license, and permission requests for re-use of supplemental material or any part of supplemental material shall be sent directly to the copyright owner as specified in the copyright notice associated with the article.