
Abstract
The study set out to investigate how the experience of creating a map-based participatory system might help identify what is needed to support the production of relevant volunteered geographic information (VGI) about urban areas exposed to impacts of adverse weather events in Trondheim, Norway. This article details the systematic approach used to collect VGI, starting from the active engagement of end users during the design and development process of the CitizenSensing participatory system, through using the system in two VGI campaigns, up to the examination of the collected data. Although the VGI examination identified exposed areas in Trondheim, for instance, those that are likely to accumulate surface water from heavy rains or meltwater, the experience gained from the use of the CitizenSensing system helped to identify some critical points regarding the production of relevant VGI. Potential practical implications justify the need for VGI. For instance, in the case of Trondheim, relevant VGI may result in better planned municipal interventions regarding city infrastructure for pedestrians, cyclists and drivers, increased public awareness and access to local knowledge about areas exposed to inundation. The study also confirmed the need for adequate system components for VGI vetting and exploration in the post-collection stage to obtain a comprehensive insight into collected VGI.
Keywords
Introduction
Any study involving the collection and use of volunteered geographic information (VGI) requires reflection on the benefits of VGI over other geographic information. One substantial benefit raised by earlier studies is the elicitation of local people’s knowledge (Goodchild, 2007; Fazeli et al., 2015; Haklay, 2010). Such geographic information can ‘facilitate informed and inclusive participatory decision-making processes and support communication and community advocacy’ (Verplanke et al., 2016: 309). Using VGI to gain urban citizens’ local perspectives on adverse environmental conditions and thus, locations exposed to natural hazards or other threats, is a recognized application area where VGI has demonstrated clear advantages over the use of traditional authoritative systems of geographic knowledge production (Carton and Ache, 2017; Haworth, 2018).
The focus of this study is on the challenges and opportunities of the collection and usage of VGI to identify urban areas exposed to adverse weather events. More specifically, this study aims to critically examine how the experience of creating a map-based participatory system could help identify what might be needed to support the production of relevant VGI about adverse weather events in the city of Trondheim, Norway. Two practical objectives resulted from this aim: first, to design and develop the CitizenSensing participatory system to collect, store and visualize VGI, and second, to use this system to identify areas in Trondheim that are exposed to pluvial flooding and to elicit practical implications of such information.
Earlier studies have shown that participatory approaches allow citizen groups to map and provide local knowledge contexts that significantly advance the mapping of urban areas exposed to adverse environmental conditions such as heat, flood, noise and earthquakes (Carton and Ache, 2017). However, Fazeli et al. (2015) pointed out that since the characteristics of VGI are less rigorous than traditional scientific data collection, this could impact both feature content and attribution. Therefore, the reliability of VGI may restrict its use as a main source of information. A central motivation for this study is to provide a better understanding about what is needed for VGI to be relevant, for example, for decision-making processes at municipal level.
Background
Relevance of VGI
Transition from traditional ‘authoritative’ data sources towards bottom-up data collection approaches requires adequate solutions, drawing on advancements in participatory systems (Sieber, 2006). Such systems enable users to engage in various actions through participation in domain-specific tasks such as climate change adaptation in local governance (Opach et al., 2020) or community based flood monitoring (Wolff, 2021). Furthermore, participatory systems enable individuals to contribute to scientific research where place-specific knowledge is of primary importance to the data quality (Goodchild, 2007).
Although official data collection initiatives use census, remote sensing, extensive sensor networks or other sophisticated data collection techniques and thus, can be expensive and time consuming, VGI is collected profitlessly, voluntarily and often through easily accessible solutions such as low-cost hardware (Carton and Ache, 2017) and open-source or free software (Fast and Rinner, 2018). However, typically, VGI contributors are non-professionals with limited or no expertise in the domain to which the data collection process contributes. Furthermore, the collection of VGI is often performed without formal geographic training (Mooney et al., 2010). Therefore, VGI implies several challenges and features specific shortcomings related to both data collection processes as well as collected data and, as a result, may be treated as of low relevance to decision making processes, in which reliable information is of essential importance. Examples of challenges include the need for user-friendly data collection tools (Fast and Rinner, 2018), difficulties in engaging volunteered contributors (Goodchild, 2007), heterogeneity in data coverage between different places (Haklay, 2010), positional inaccuracy (Jackson et al., 2013), and uneven data distribution over time (Navarra et al., 2021).
Practical implications of VGI about hazardous natural events
Although VGI has shortcomings, it provides value to efforts in which local peoples’ knowledge and bottom-up approaches are used to investigate areas exposed to natural hazards. Therefore, one field in which VGI has been extensively used is disaster management, with numerous studies reporting on opportunities associated with increased citizen data and involvement in crisis response. In-situ observations and data collection are time-consuming and due to time lags, imply the risk of misleading results. Haworth (2018) notes that VGI has important implications for citizens and traditional authoritative systems of geographic knowledge production. First and foremost, the use of VGI provides decision makers and respective organisations with comprehensive information on environmental status from local eyewitnesses that supplement data from traditional authoritative systems of geographic knowledge production. This information can concern issues such as pluvial flooding (See, 2019), landslides (Kocaman and Gokceoglu, 2019) and road damage and inaccessibility after flood events (Schnebele et al., 2014). The use of VGI can also increase social cohesion due to the participatory nature of people collectively contributing to the generation of geographic knowledge (Haworth, 2018). Furthermore, according to Fazeli et al. (2015), by employing volunteers in a constructive way, a process model as well as a technical implementation can be developed to combine official maps and free geodata by crowdsourcing. Finally, the use of VGI can lead to undertaking specific adaptation actions such as preventing coastal erosion (McNamara and Westoby, 2011).
Several studies have pointed towards the practical implications of VGI, outlining its societal relevance and contribution. Collecting VGI, for instance, about urban areas exposed to adverse weather conditions aims not only to create a database on areas at risk but also to support actions to prevent or minimise damage caused by possible adverse weather events and to define and create policies to target resource allocation (Gouveia and Fonseca, 2008). One common solution concerns analysis of social media consisting of timely geo-tagged textual messages accompanied by images. For instance, geolocated Twitter data can be used to investigate flooding severity over time and to demarcate highly impacted disaster zones (Kankanamge et al., 2020). A good example was Hurricane Sandy, when many real-time images of damage and flooding were shared on Twitter (Pourebrahim et al., 2019). As a result, decision makers retrieved first-hand information that was used to help identify damages and plan relief efforts. Another example concerns the use of WhatsApp to send photos of the flood gauges daily to monitor water levels during flooding (Wolff et al., 2021).
Tools to collect and methods to analyse VGI
Although geolocated data acquired from social media can be used as VGI, the latter often requires customized, yet easy-to-use, participatory tools typically designed for smartphones and other location-aware portable devices (Kocaman and Gokceoglu, 2019). Several challenges arise at the data collection stage. Examples include the use of a single system for the collection of VGI in locations of different geographic characteristics and the need of tailoring systems for diverse users. Furthermore, willingness and engagement are challenging aspects, since ubiquitous data collection initiatives can lead to user reluctance and indifference in respect to participatory tools (Goodchild, 2007). Therefore, gamification has become a popular way to involve people and increase participation (Senaratne et al., 2017).
Volunteered geographic information tools generate an increasing amount of data that need to be stored, analysed and efficiently provided to target audiences, volunteer data contributors, as well as third parties. Moreover, the target audience not only needs to gain an overview of voluntarily reported information but also be equipped with adequate methods for VGI vetting and exploration (Seebacher et al., 2019). Therefore, to ensure data quality and relevance, the development of a comprehensive system demands active engagement of end users and the resulting system should include all essential stages to enable effective participation, from data collection, through data storage and easy access, to data exploration at the post-collection stage. The latter stage incorporates methods to handle VGI. To this end, common data processing tools such as spreadsheets and GIS software can be used to filter VGI and perform spatial analysis such as detecting and quantifying patterns and relationships between observations or measurements. For instance, Schnebele et al. (2014) used a flood damage assessment layer created with the use of VGI along with a high-resolution road network layer to identify roads, which might be severely damaged. However, the use of specific data handling methods implemented in customized tools is reported in the literature. Examples include the use of data mining methods (Senaratne et al., 2017) and visual analytics (Seebacher et al., 2019). In the latter, VGI from private weather station networks was explored to better analyse the emergence of urban heat islands to comprehend the influencing causes and their effects.
Methods
We employed different methods in various stages of the study. When designing the CitizenSensing participatory system, we applied a user-centred design approach (Baek et al., 2008; Skarlatidou and Otero, 2020) and geographic visualisation. In turn, when using the system to identify exposed areas and elicit practical implications of such information we conducted a case study with participatory mapping campaigns supplemented with two questionnaires. Finally, GIS was used to examine the collected VGI. Jointly, these methods enabled us to identify aspects required to support the production of relevant VGI about adverse weather events in Trondheim.
Designing the CitizenSensing participatory system
Although the utilisation of existing geo-tagged data from social media or freely available participatory software might be preferred over creating new tools, our project aimed to build a participatory system with its end users to meet the demands of specific conditions and contexts. We designed and developed the system iteratively and collaboratively, over the course of three years, taking into account stakeholders’ requirements. The development process was motivated by the following aspects: (1) The demand for a system to collect VGI in various geographical locations featuring different environmental conditions. (2) New data collection and insight into VGI already collected by users with an overview of local climate parameters. (3) A simplified layout adapted to be used on portable devices, yet providing rich functionality tailored to the tasks that the system aims to support. (4) Functionality accessible to users with diverse GIScience literacy and background knowledge, with a mechanism to trigger engagement.
Requirement identification with end users
Stakeholder interaction during the requirement identification stage focussed on the design of a data collection web application for the system and consisted of several meetings (Table S1 in the Supplemental Material) with municipal stakeholders in the CitizenSensing-project’s four pilot cities (Norrköping in Sweden, Porto in Portugal, Rotterdam in the Netherlands and Trondheim in Norway). The meetings aimed to outline the focus of the data to be collected, the functionality of the web application, and to identify the potential end-users of the system. The outcomes of the meetings were analysed and compiled to develop the first prototype of the web application and to outline the criteria for the system’s web portal to access collected VGI. The outcomes were also used to design the system architecture.
Municipal stakeholders at each pilot identified significant weather-related events for their city. Due to the cities’ different climatic conditions, the weather events and their impacts were diverse. The final list, which was decided upon to inform the content of the web application, comprised the generic categories from all pilots (Table S2 in the Supplemental Material): heavy rainfall, storm, storm surge, high and low temperature, drought, and heavy winds, and subsequent potential impacts, such as flooded areas, landslides, water levels, experienced level of comfort. In subsequent meetings, the two Nordic pilots in Norrköping and Trondheim also added snowfall. After additional consultations in the Norrköping pilot, the category ‘seasonal observations’ was added to include an option during shorter campaigns where none of the listed weather events would likely happen.
Stakeholder interaction further informed discussions on critical climate parameters and associated alerts, such as weather warnings sent out by national meteorological agencies, and to what extent existing sensor data and warnings could be integrated in the web application. However, no weather warnings were included in the prototype, since such functionality could have triggered users to expect immediate emergency response to any report made using the application. Instead, the project team compiled recommended adaptation measures of national agencies relevant for the weather events, which appeared on the prototype’s screen after each submission. During the interactions, stakeholders also suggested relevant end-user groups for reporting observations. These included high school or university students, elderly citizens, staff of day care centres for the elderly or disabled, municipal employees and people living in areas prone to adverse environmental conditions such as flooding and heat. Since there was a large variation in suggested end-users due to the pilots’ different priorities and socio-cultural contexts, the system was equipped with content and functionality comprehensible to a diverse group of lay users.
Stakeholders outlined specific suggestions and requests for the functionality of the web application. Arranged workshops were divided into the ‘initial discussion’ phase to identify generic requests on the data collection web application, and the ‘interaction’ phase, where the paper prototype of the application (Figure S1 in the Supplemental Material) was used to discuss required functionalities. Requirements suggested during the ‘initial discussion’ phase concerned common features such as a user-friendly, attractive and practical visual interface including icons and illustrations, when possible, instead of text. In turn, the ‘interaction’ stage, revealed several requirements regarding the functionality such as retrieving a device’s GPS coordinates, searching for already registered observations on a map and, on another map, examining current weather measurements in a given location.
In the Rotterdam pilot where multiple VGI initiatives already existed, such as the bicycle traverse meteorological measurements (Heusinkveld et al., 2014), municipal stakeholders suggested that the web application be linked to existing databases and apps. In Trondheim, stakeholders expressed concern that the system might raise unrealistic expectations among users that the municipality would immediately respond to submitted reports. Furthermore, stakeholders suggested information and statistics that could be included in the web application as background information about each pilot city, for example, statistics about extreme weather events. In the paper prototype, such background information was preliminarily included in the application’s ‘City profile’ panels. In some of the discussions, stakeholders suggested reward systems for reporting to create engagement and increase the number of submitted reports, for example, school classes could compete against each other, and rewards given for those with a high number of reports.
System components
We used the findings of the requirement identification stage to build the system as an integrated platform to support stakeholders, organisations and citizens in increasing their ability to make informed decisions related to climatic risks and increase urban resilience. The system consists of three key components (Figure 1): a web application, a server (with a database), and a web portal, to collect, maintain and visualise VGI, respectively. Collected VGI comprise geographical coordinates, date and time, weather event type, impact, personal level of comfort, photo (optional), as well as comment (optional). Additionally, to collect real-time weather measurements, such as precipitation and air temperature, pressure, and humidity, in the project’s pilot cities, the server retrieves data from two external weather station networks (Netatmo and Porto Digital) and from a number of the project’s experimental weather sensors established in Norrköping and Trondheim. The architecture of the CitizenSensing participatory system. Elements developed in the CitizenSensing project are presented in green.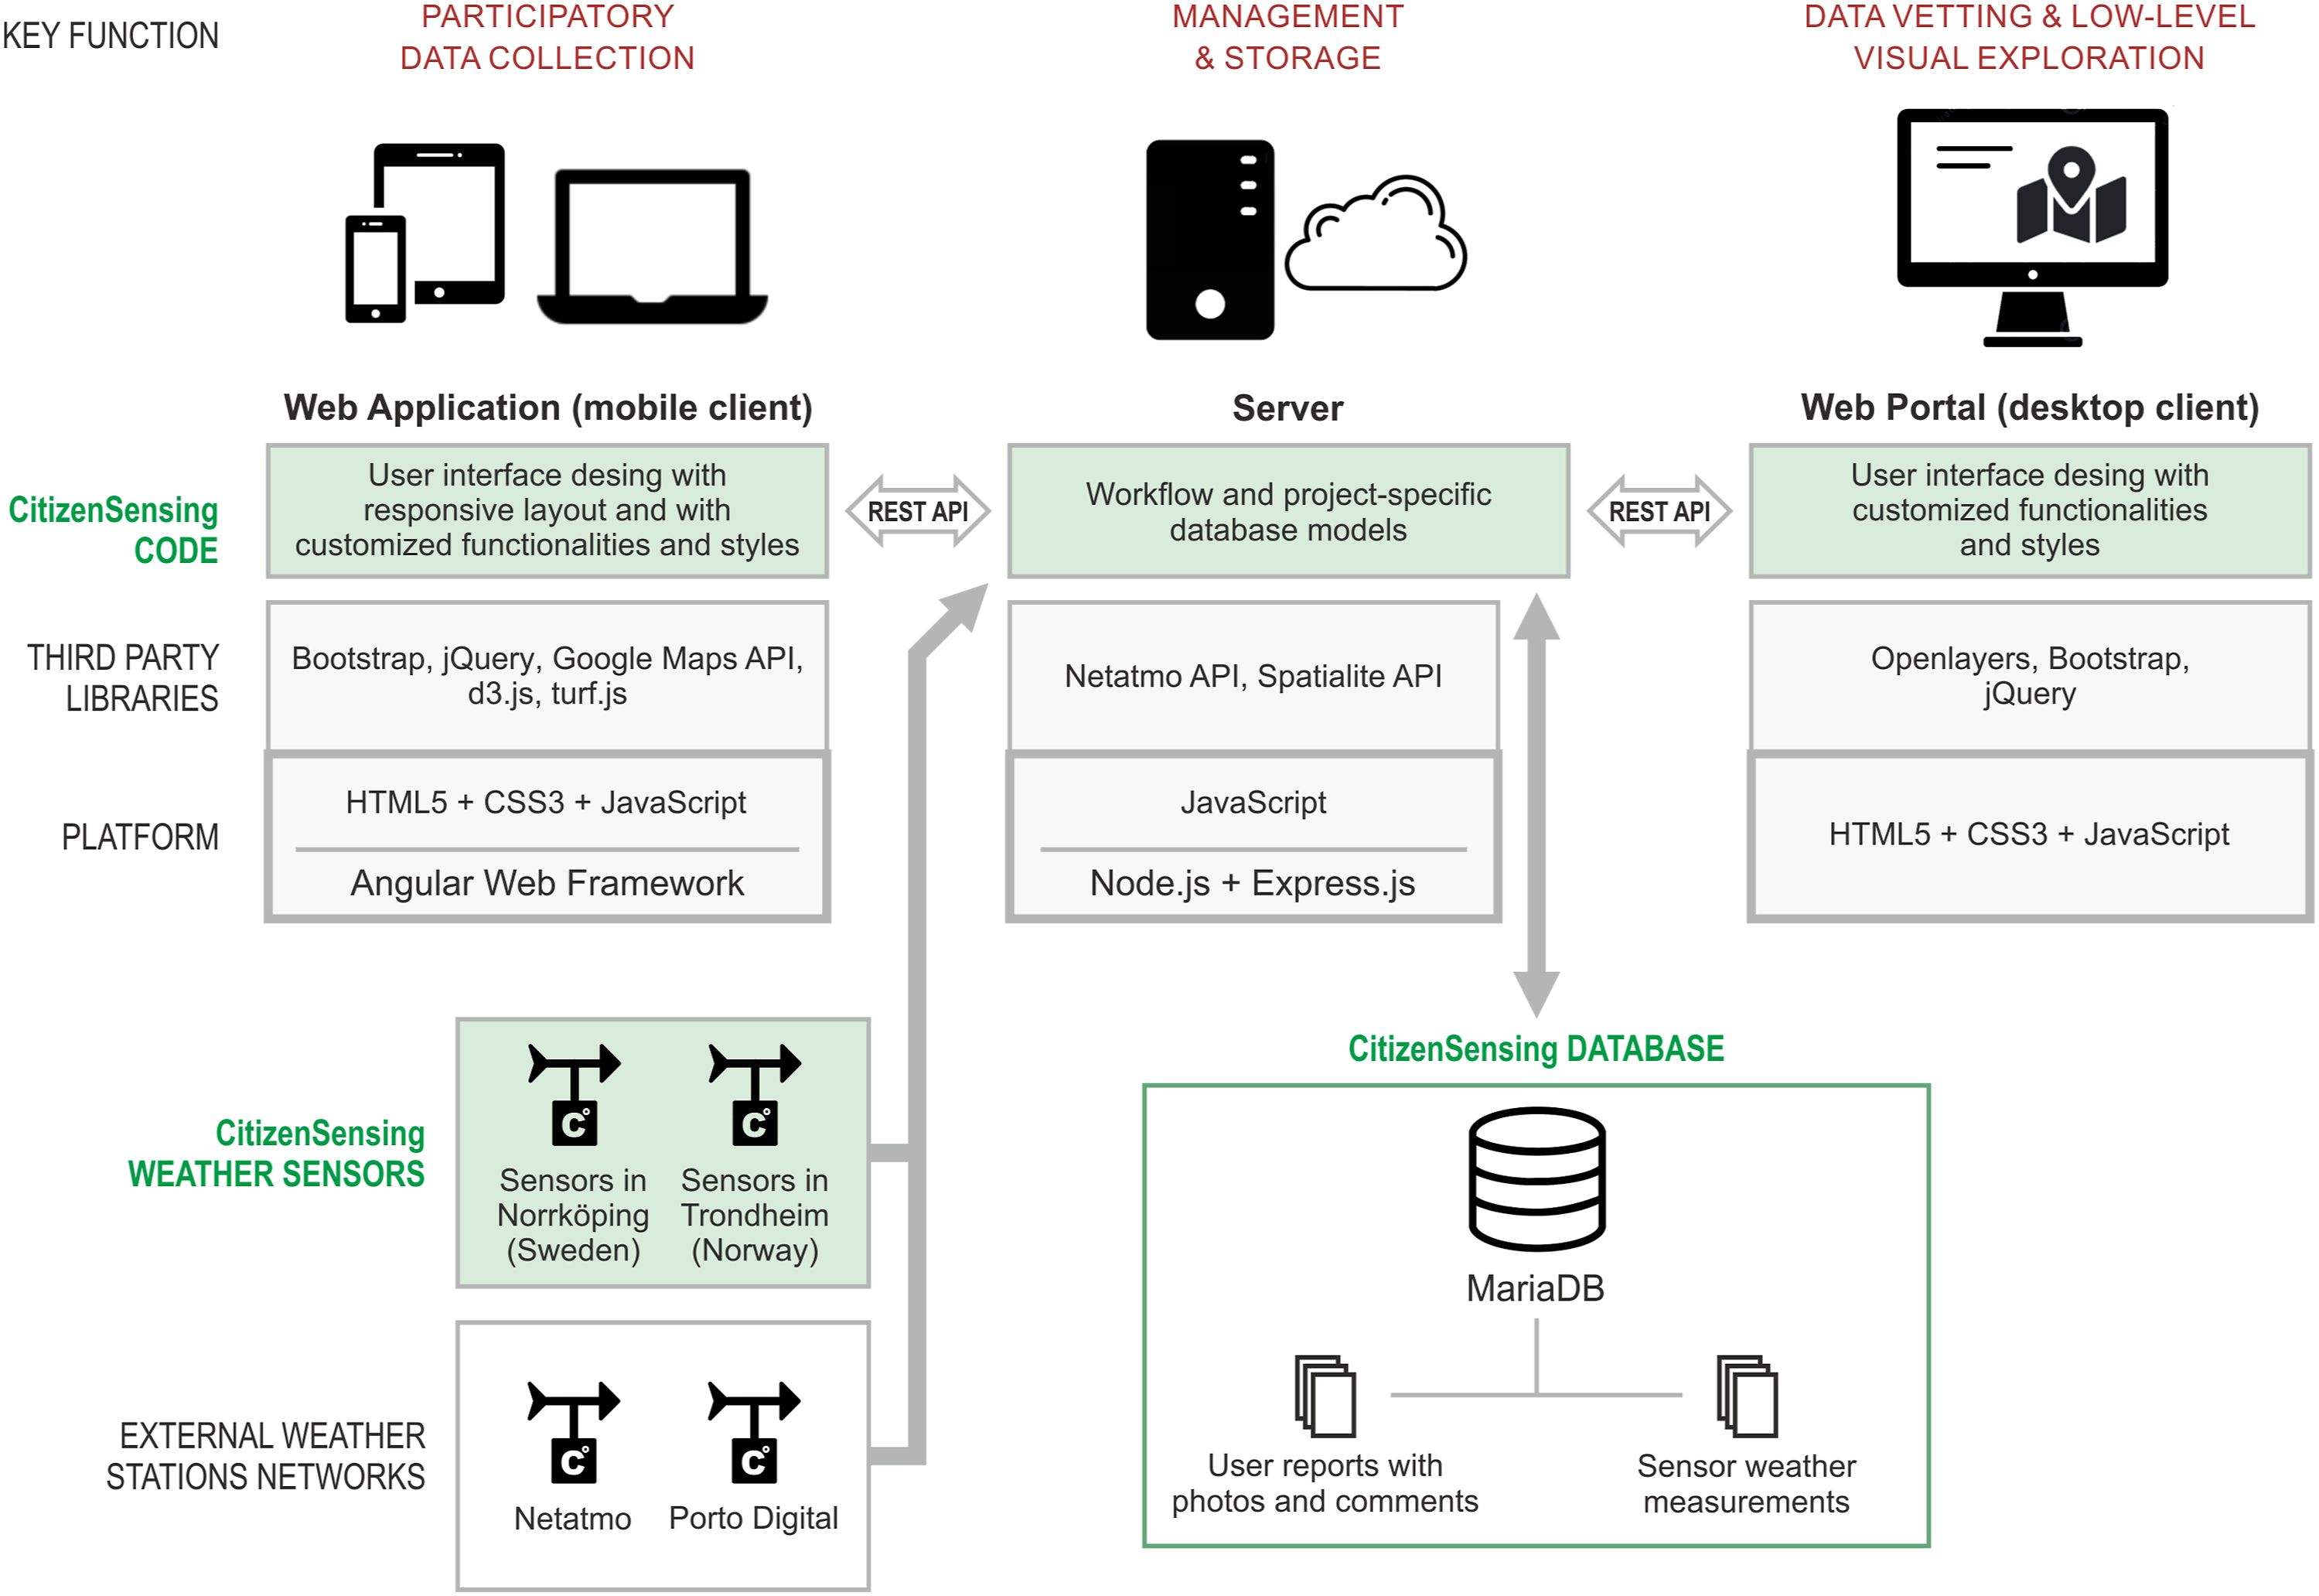
The web application was primarily designed for portable devices. It facilitates a high level of interactivity by engaging citizens, both as data providers and receivers. After getting the position of an event to be reported (Figure 2(a)), the application allows users to act as sensors by submitting place-specific reports on observed weather events and their impacts (Figure 2(b)). The application also provides recommendations of best-practice climate adaptation measures (Figure 2(c)) to specific weather events, based on information from municipal and public authorities. Moreover, the users can investigate: already submitted observations (Figure 2(d) and (e)), sensor weather measurements in the four pilot cities (Figure 2(d) and (f)), as well as the descriptions of the cities’ climate profiles (Figure 2(d), (g) and (h)). As encouragement mechanisms are usually required to motivate people to contribute (Senaratne et al., 2017), we used two solutions to involve contributors and raise awareness of quality reporting. Firstly, we provided users with previously submitted reports and local weather measurements. Secondly, we implemented a set of gamification mechanisms (Ahlqvist and Schlieder, 2018) that provide rewards in form of points for each uploaded report and a leader board to encourage competition. Selected views of the graphical user interface of the CitizenSensing web application (details in the text).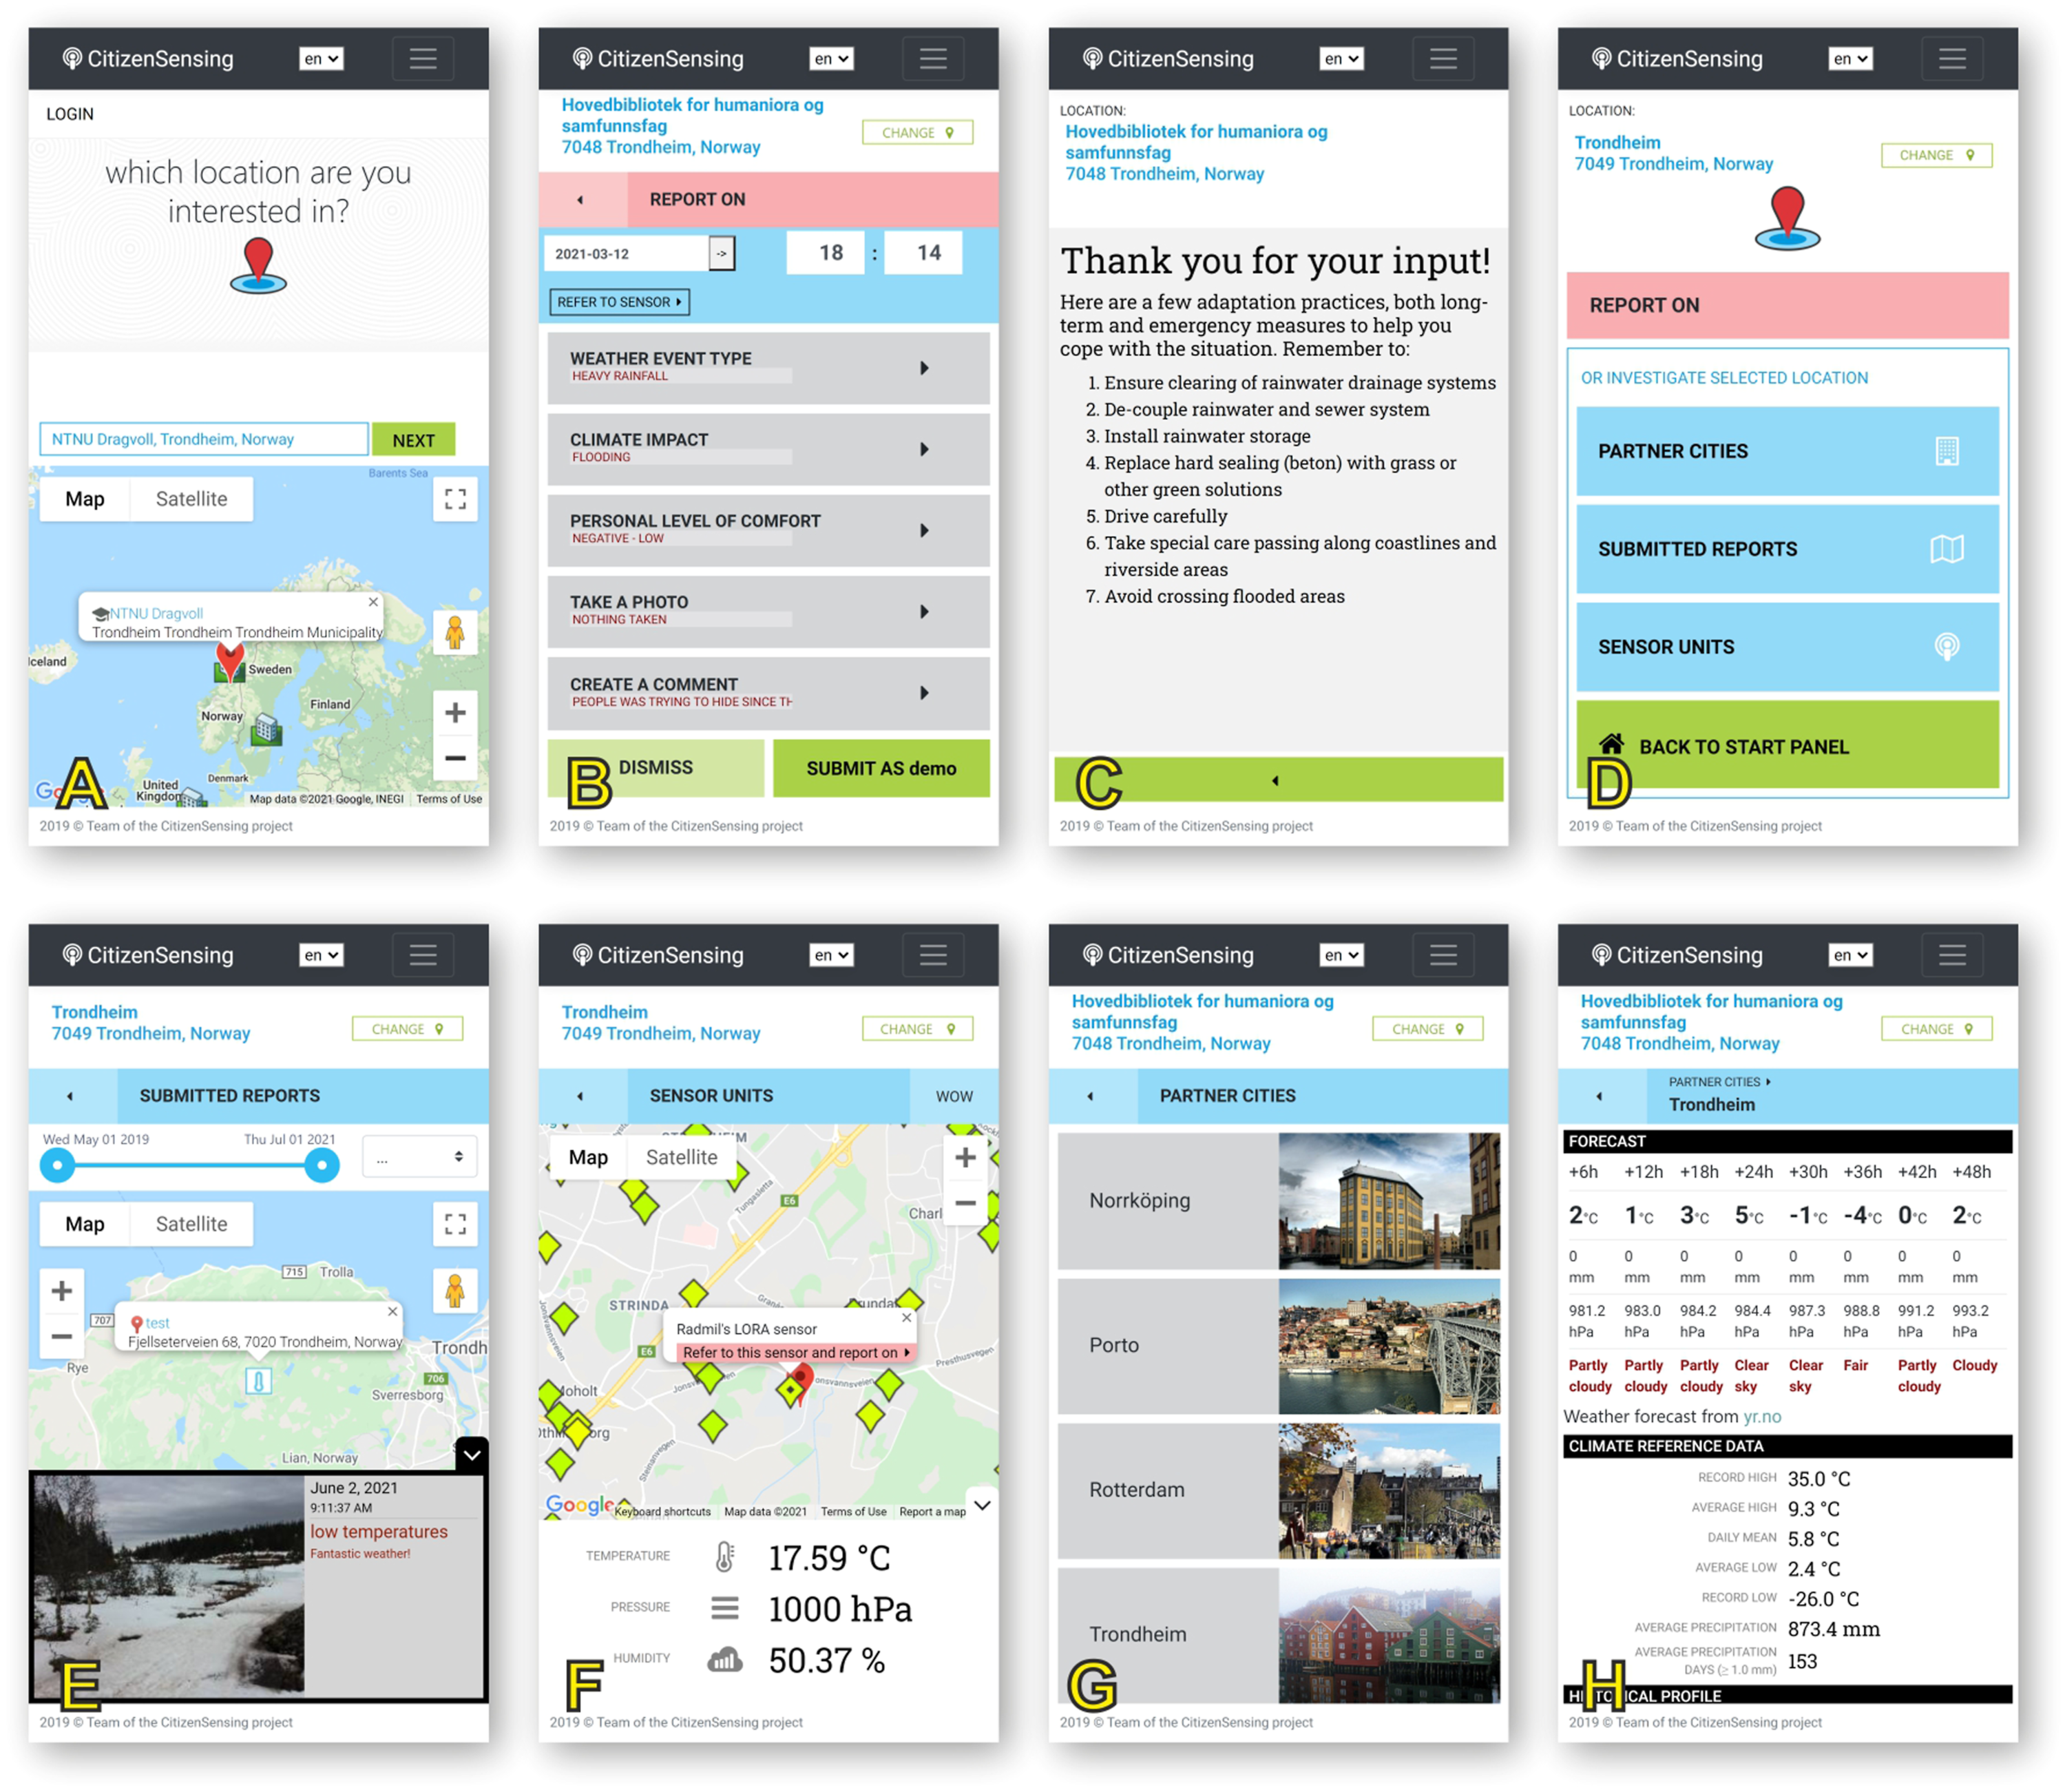
The web portal has been designed for desktop displays. It enables users to comprehend the spatial distribution of reports and gain an initial understanding of VGI. Thus, it enables contribution vetting and gaining overview of VGI with respect to its spatiotemporal characteristics as well as qualitative attributes such as weather event type and level of comfort. Since the portal enables a flexible overview of VGI to a wider audience, only basic interaction techniques and elementary data exploration methods such as manipulating the user’s viewpoint and highlighting portions of a data set is supported through simple geographic visualisation (Figure S2 in the Supplemental Material).
The portal displays reports on a map using weather event type symbols. It features tailored user interaction to support the initial assessment of the data filtered by time and space. Data can be further filtered by weather event type, users’ comfort level or username. Hence, a user can perform a low-level data exploration (Amar et al., 2005) in the map display context that encompasses basic tasks such as value retrieval or filtering. Apart from the map display, filtered reports are listed in a panel to the left of the map.
Case study: The application of the CitizenSensing participatory system to collect VGI about impacts of adverse weather events
Aim and procedure
The CitizenSensing system was used in Trondheim to obtain insight into the type of increased knowledge that could be gained from VGI about the impacts of adverse weather events and practical implications of such knowledge. The collection of VGI in Trondheim was carried out in 2019 and 2020 in two separate, yet related autumn campaigns. Participants were asked to observe the urban context and use the CitizenSensing web application to register weather-related events with their impacts such as debris or ice that blocked water flow through outlets. Subsequently, the research team used the CitizenSensing web portal to examine collected data.
Moreover, the 2019 campaign was supplemented with two questionnaires, the first completed by participants before using the application, and the second, in the post-data collection phase. The questionnaires were used to get a better understanding of the participants and their perspectives on the application and their reflections on the data collection process. The ‘before’ questionnaire contained seven questions (Questionnaire S1 in the Supplemental Material), and the ‘after’ questionnaire had 20 questions (Questionnaire S2 in the Supplemental Material).
Participants
A total of 105 participants (50 females and 55 males) engaged in the 2019 campaign, whereas a total of 98 participants (54 females and 44 males) engaged in the 2020 campaign. In both campaigns, all participants were first-year undergraduate students in Geography. During the 2019 campaign, we used the outcomes from the ‘before’ questionnaire to characterize the participants. The questionnaire was completed by 60 of 105 participants. In the first three questions, participants were asked about the information they gained from climate services and about the adaptation measures to be taken during weather events. The next four questions were about apps they used in their devices. Of information they gained from weather or climate services, the two most frequently selected questionnaire options were ‘extreme event warning’ (40 selections) and ‘recommendations on what precautions to take in case of extreme weather events’ (15). To obtain recommended measures to be taken before and during adverse weather events, the participants mostly used TV (35 selections), internet services (32) and social media (24). The participants placed highest trust in information from national and local authorities and TV, and lower trust from social media and Internet in general. On average, participants had 58 applications on their devices, most frequently, for social media, music, map and public transportation.
Since individuals of similar profile (first-year undergraduate students in Geography) participated in both campaigns, the above-described questionnaire outcomes from 2019 were likely to be similar for the participants of the 2020 campaign. Hence, we assumed that, in general, participants were well familiar with climate-related resources and apps available on the Internet, but they had limited trust in the information provided on the web. Given that the participants, on the one hand, were Geography students and hence presumably interested in environmental challenges and issues, and, on the other hand, were first-year students so not yet having a comprehensive knowledge in the domain of Geography, we considered the participants a suitable end-user group for the collection of VGI about adverse environmental conditions in Trondheim. They were able to make conscious use of the CitizenSening web application and to critically report on its functionality and content.
Results: Identifying impacts of adverse weather events in Trondheim through VGI
VGI collected using the CitizenSensing web application
A total of 2037 observations were registered in both campaigns and featured a relatively high level of detail, as only 9% lacked information about impacts, 3% – level of comfort, 6% – textual comments and 3% – photos. Sixty-four percent of the observations concerned heavy rainfall, whereas 22%, low temperature (Table S3 in the Supplemental Material). These two types of events, according to campaign participants, most greatly affected Trondheim during the autumn campaign periods, from September to November in 2019 and 2020. Heavy rainfall and low temperature events were reported in four similar areas (Figure S3 in the Supplemental Material): Trondheim downtown, Moholt and Voll student villages, Dragvoll campus, and Brundalen and Charlottenlund. However, heavy rainfall events were mostly reported in Trondheim downtown (Figure S3-A), whereas low temperatures, in Brundalen and Charlottenlund (Figure S3-B).
In the case of heavy rainfall, most participants rated their experienced level of comfort on the ‘negative’ part of the scale – ‘negative low’ (51%), ‘negative moderate’ (13%), or ‘negative high’ (2%). Similarly, during low temperature events, most participants rated their experienced level of comfort on the negative part of the scale, either as ‘negative high’ (56%) or ‘negative moderate’ (16%). The GIS-supported analysis revealed that regarding impacts, 54% of the observations concerned general flooding, flooding of roads or flooding of buildings, and were mostly reported in the areas where heavy rainfall was observed (Figure S3-A). In turn, icing was the second most registered impact (15%); it was mostly reported in the areas where low temperatures were observed (Figure S3-B). Registered comments mostly concerned surface water accumulation on sidewalks and streets, rainwater and melted snow, icing and clogged drain.
Regarding the timing of the reporting, as Figure S4 in the Supplemental Material presents, participants were active mostly on Wednesdays and Fridays. On these two days, 45% observations were registered, 415 and 506, respectively. Furthermore, a total of 315 observations were registered between 1 and 2 p.m., and 289 observations between 2 and 3 p.m. Fewest observations were registered on Saturdays and Sundays (99 and 176, respectively), and between 4 and 7 a.m. (no observations for this period).
A total of 1980 photos were registered. The effects of low temperatures were mostly photographed as snow cover, melted snow or frozen puddles. The effects of heavy rainfall were documented as puddles of various size and shape on sidewalks (Figure 3(a)), pedestrian crossings (Figure 3(b) and (c)) and bike paths (Figure 3(d) and (e)). Some photos showed melted snow on sidewalks and along pavement edges that impeded walking and biking (Figure 3(f)). Participants also registered photos showing puddles impeding traffic (Figure 3(g)) and, in particular, parking (Figure 3(h) and (i)). Hence, three user groups could likely benefit most from registered observations, that is, pedestrians, cyclists and drivers. Finally, part of the photos showed debris or ice blocking water flows through drainage outlets. Selected observations registered in the two Trondheim campaigns and their locations shown on the map of surface water accumulation: (a–c) – impacts that impede walking, (d–f) – impacts that impede biking, and (g–i) – impacts that impede driving and parking.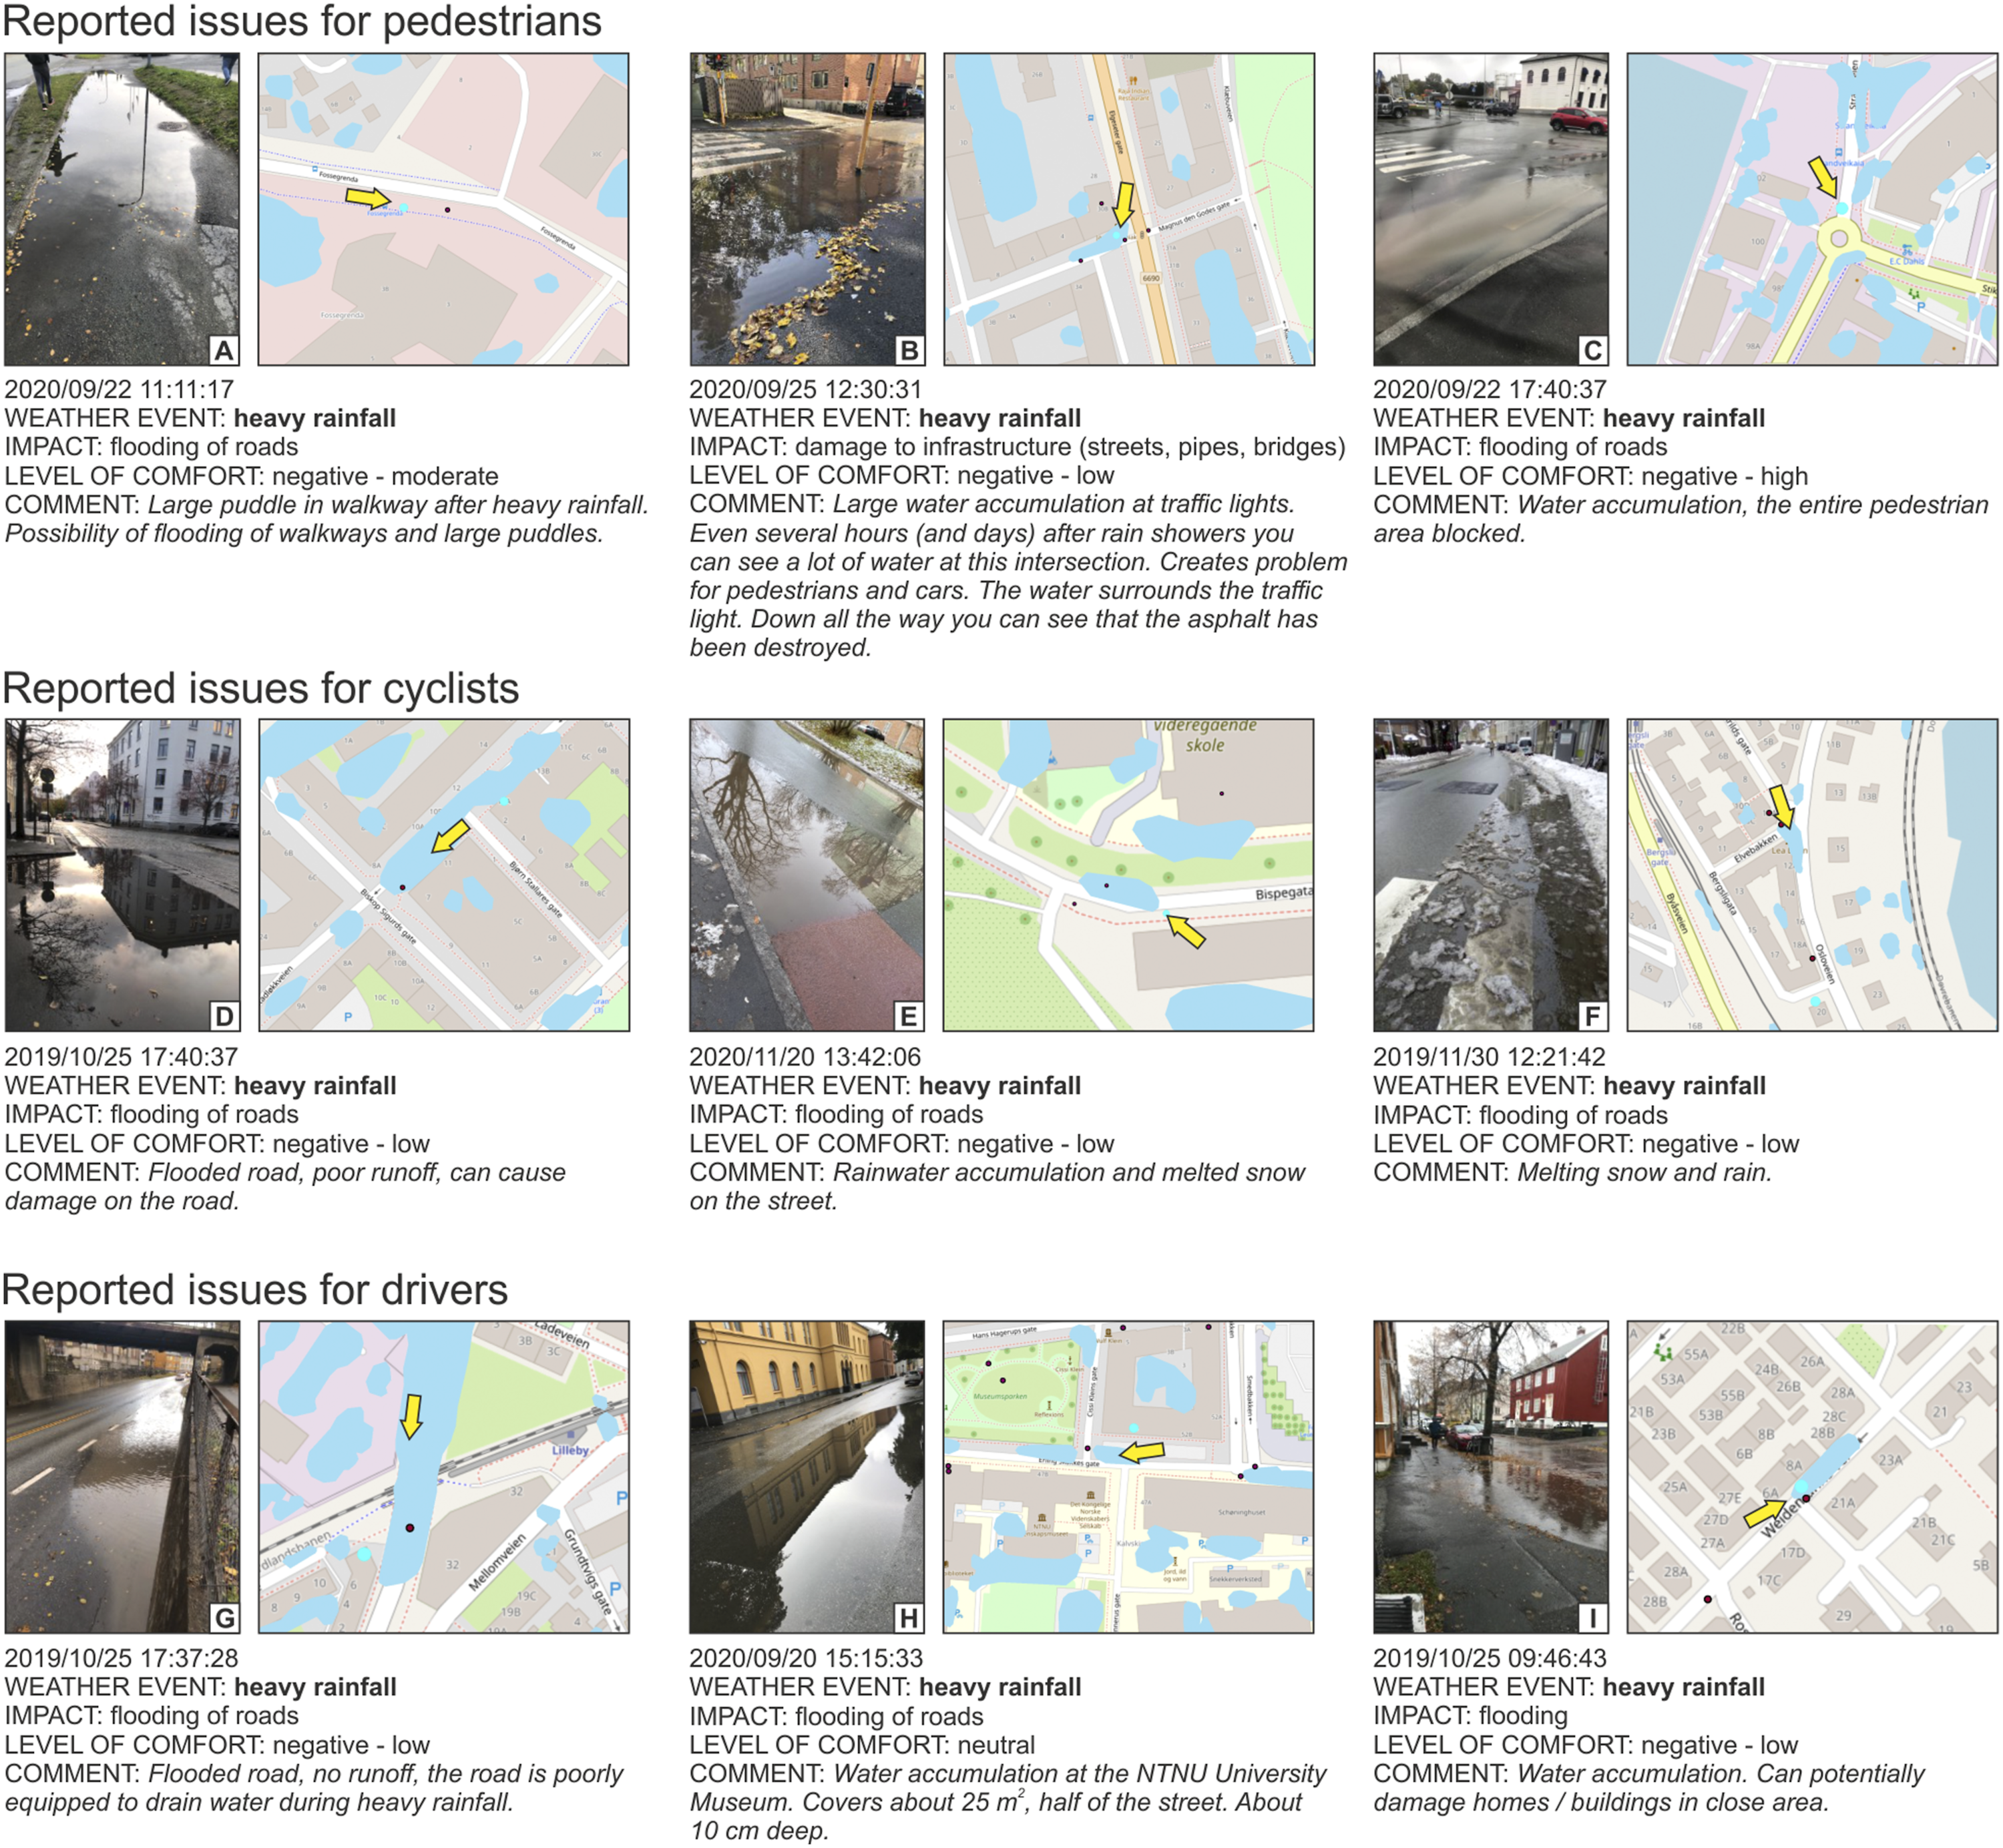
Some photos were taken at a certain distance from the impacts to provide a view of their context, such as photo B in Figure 3. Some observations were registered in incorrect locations (e.g. Figure 3(d), (f) and (g)) therefore, data vetting was needed.
Data vetting with the CitizenSensing web portal
We used the CitizenSensing web portal to search for quality-related issues. The three most common examples of decreased VGI quality include: (1) incorrect observation coordinates, (2) overrepresentation of specific spots with a ‘canyon effect’ and (3) subpar observations.
Figure S5-A in the Supplemental Material exemplifies the issue of incorrect coordinates as the observations were registered inside a shopping centre. Inspecting the observations’ attributes and photos on the portal, revealed they were registered by different users on different days and concerned the accumulation of surface water in front of the building. Thus, the incorrect geocoding probably occurred since the users registered observations a short time after taking the photos but likely forgot to ensure correct observation coordinates. Incorrectly geocoded observations were also observed in other indoor places such as within university buildings and student dormitories.
The web portal also facilitated detection of any overrepresentation of locations. Observations were found to be unequally distributed in the city, as participants likely registered numerous reports near their housing or university buildings (Figure S5-B in the Supplemental Material). Concentrations of VGI were found along certain paths, likely participants’ daily routes. This issue can be named ‘canyon effect’ (Figure S5-C in the Supplemental Material). The optimal coverage of VGI would be a high number of observations equally distributed around the clock across the city, of course, dependent on the occurrence of relevant weather events. However, the number and spatiotemporal distribution of the registered observations in our study was dependent on the set-up and context of the end-user campaigns, as in the study by Hung et al. (2016). The participants likely prioritised the neighbourhoods in which they lived and studied.
Several participants registered subpar observations, for example, excessive reports from exactly the same place without motivation, low-quality photos or inadequate comments. One participant of the 2020 campaign registered 341 observations (Figure S5-C in the Supplemental Material) of mostly low temperature (196 observations, mostly with photos of ordinary snow cover and the comment ‘slush’) and heavy rainfall (95 observations, mostly with photos of ordinary small puddles).
Participants’ perspectives on the participation and on the CitizenSensing web application
During the 2019 campaign, most respondents (41%) of the ‘after’ questionnaire were moderately aware of suitable climate adaptation measures to take before or during adverse weather events. Half of the respondents, after participating in the campaign, did not change their level of trust in information about weather events reported by ordinary citizens. Wearing a cap and gloves (95% of respondents) and driving/biking carefully (32%) were the most commonly registered actions during the campaigns. Moreover, during the campaign period, 50% of respondents reported that they talked to others about climate change adaptation. Half of the respondents claimed that submitting reports was not very demanding and 45% found it flexible when and how to submit reports. Seventy three percent of respondents found the web application to be useful for themselves and others; however, most of them selected, to a ‘moderate degree’. Furthermore, the application was used almost only to register observations and to a lesser degree to check the profiles of pilot cities and observations of fellow participants (23% in both cases). Of the experience of using the application, many respondents (45%) reported ‘learned something new’. However, for 27% of respondents, using the application was ‘just a task’ or a ‘waste of time’. The gamification mechanisms were found motivating by 59% of respondents; however, most in this group selected ‘to a small degree’. Similarly, 73% of respondents found getting points motivating. Only 14% of respondents considered their submissions useful for Trondheim municipality, whereas half responded, ‘I do not know’. Only one respondent found the submissions from fellow participants helpful, while 55% of respondents responded, ‘I do not know’. Thirty-six percent of respondents encountered some technical problems with the application. Two respondents commented that Trondheim was, during autumn 2019, unexpectedly calm and therefore there were few adverse weather events to report about.
Discussion
Based on the experience gained from designing and using the CitizenSensing system, a number of factors needed to support the production of relevant VGI about adverse weather events in Trondheim could be identified. First of all, practical implications of collected VGI justify the need for VGI. Our study indicated that VGI about impacts of adverse weather events could provide knowledge of value to municipal stakeholders and urban citizens, in particular by those who move across a city and use municipal infrastructure, that is, pedestrians, cyclists and drivers (Figure 3). Although citizens could benefit from VGI by improved awareness of possible adverse environmental conditions and areas exposed to those conditions, municipal stakeholders could use it more practically, to answer three essential questions: what (identify threats), where (localise threats since real data, not modelled data, are gained) and when (identify time periods). Hence, for citizens, VGI implies increased awareness of the effects of climate change that may affect Trondheim and potential measures for adaptation to climate impacts. For municipal stakeholders, the practical implications of local people’s knowledge retrieved from VGI could be better-planned and better-targeted municipal interventions into local infrastructure such as roads, sidewalks, bike paths, drainage systems and green spaces, implying effectively allocated resources during weather-related events considering their temporal and spatial variability. Volunteered geographic information contains observations about weather-related events and their impacts on citizens (self-declared level of comfort). Further, as the reports are geocoded and accompanied with photos and comments, they can be analysed spatially and temporally, and thus provide strategic evidence needed to undertake adequate interventions into urban infrastructure (e.g. improve sidewalks, clean outlets and construct new bus stop shelters).
Volunteered geographic information can also be used to verify results from modelled data. Pluvial flood maps, as those used as a background map in Figure 3, allow urban residents to see exactly where and how their neighbourhoods may be impacted by surface waters accumulated after heavy rain. Recent paradigms call for a participatory process in which different stakeholders are involved in assessing pluvial flood risk, for instance by using data retrieved from social media such as Twitter (Kankanamge et al., 2020; Pourebrahim et al., 2019). One way of involvement is to use VGI to validate surface water flood modelling (Yu et al., 2016) and to compare submitted observations with modelled data. After heavy rainfall in cities that have a high share of impermeable surfaces, pluvial flooding may appear if the water cannot drain quickly into the ground and the system cannot cope with the amount of water. The experiences gathered when applying the CitizenSensing system are promising as the system provides citizens with awareness of pluvial flood risk and a capability to monitor possible flood exposed areas that could impede walking, biking and driving (parking). Aware citizens might be more likely to take action, for instance, if they observe surface water accumulations (e.g. due to snow or debris blocking the water flow to an outlet) they may report the problem to local authorities, which could be valuable for local authorities to target and even customise interventions.
Our study also revealed that the production of relevant VGI requires data vetting that in turn needs adequate participatory tools created with the engagement of end users. The need for the engagement of end users was also raised by Wolff et al. (2021) who found it, together with the technology used, as key to the success of their participatory project concerning flood monitoring in urban informal settlements. In the case of the CitizenSensing system, the stakeholder co-design process guided the design of the system’s three main components (a web application, a data management and storage component, and a web portal) and determined the optimal content and functionalities. An overall positive assessment can be given to the system as to the completeness of collected data, as most of the submitted observations contained all required data attributes. However, participants primarily used the application to register observations and only to a limited degree to check observations of fellow participants or other information.
The web portal integrated in the system supported the monitoring of the progress in the data collection process. Furthermore, the portal facilitated post-collection data vetting as it enabled comprehension of the spatial distribution and an initial understanding of VGI. However, this was done manually in a somewhat cumbersome manner, without cues guiding the visual data examination. Collected VGI was explored by querying individual observations for details on demand in the map display or in the side panel of the portal, and by data filtering to inspect subsets containing specific attributes or occurring in specific time periods. This resulted in the need for advanced data examination that would allow for in-depth analysis of the collected data, for instance, by means of GIS software. Although we used GIS in the post-collection data exploration, in which more than one key-variable was analysed to reveal spatiotemporal patterns, customised visual analytics tools would be favourable to allow effective multidimensional data exploration (Navarra et al., 2021).
Besides clear benefits, VGI also features shortcomings and generates challenges. Our case study revealed three examples, that is, incorrect observation coordinates, overrepresentation of specific places with the canyon effect, and subpar observations. These shortcomings might have been partially avoided if the participants had followed instructions more closely and we had detected and followed up on these issues early in the campaigns to ensure the observations were registered according to a protocol. Our study confirms the findings by Navarra et al. (2021) that the specification level of instructions given to participants, as well as participants’ preconceptions of the task, influences the content and quality of the collected VGI. For instance, participants might be influenced by their pre-understanding of the events of heavy rainfall and low temperature. They reported these events most often, but their selected impacts might not adequately correspond to their perceived experience and therefore, might lead to an overrepresentation of these categories. However, also the ‘Pareto Principle’ might influence our outcomes. The principle says that 80% of effects comes from 20% of cases and as Rasmussen (2019) claims, especially in competition-like VGI campaigns, a small percentage of users are engaged and supply most of data, which in turn may result in decreased quality of the collected data. An example from this study, is one participant who registered 341 observations; however, mostly of low quality. We have also experienced uneven engagement in the VGI collection process. Although such irregularity throughout the project period has been also observed in other projects (Wolff et al., 2021), surprisingly the lower engagement of our participants were during weekends.
The decision to use campaigns instead of spontaneous contributions during longer periods was made to keep the same length and time period in both data collection years instead of waiting for spontaneous engagement of participants with the risk of lower numbers of registered observations. Additionally, we were aware that it is challenging to motivate participants to collect VGI, as previous studies have reported a reluctance of potential contributors (Goodchild, 2007). Therefore, organising campaigns helped us control the progress of the data collection process. Proper motivation for volunteer participation is an issue closely linked to the amount, type and quality of collected data (Baruch et al., 2016). Moreover, end-user fatigue is a common obstacle pointed out in VGI studies, and the gamification mechanisms included in our study, presented challenges related to data quality through excessive subpar observations but also positive effects on participation. Most participants found the gamification mechanisms motivating; however, only a few participants considered their submissions useful for the municipality of Trondheim and most of them were uncertain about the usefulness of collected VGI in general.
Conclusions
The experience of designing and using the CitizenSensing map-based participatory system helped us identify what is needed to support the production of relevant VGI about adverse weather events in the city of Trondheim, Norway. The need for geo-tagged information voluntarily created by citizens is the essential factor that justifies the relevance of VGI, especially in the case of adverse weather events, in which timely information accompanied by images help identify exposed areas and plan adaptation measures and is not easy to retrieve from other sources than participatory systems. In our study, two practical implications of the findings were revealed using citizens’ knowledge gained from the collected VGI about impacts of adverse weather events in Trondheim: contribution to better planned municipal interventions and increased citizen awareness of weather-related events and their impacts. Apart from these implications, our study confirms the need for comprehensive verification of collected VGI caused by data quality issues. Such verification can be facilitated by a participatory system equipped with components for VGI visual exploration such as a map-based portal as the one implemented in our system. Finally, an active engagement of system end users is required to develop a VGI system that fulfils user needs and facilitates the collection of relevant VGI.
Supplemental Material
Supplemental Material - Identifying relevant volunteered geographic information about adverse weather events in Trondheim using the CitizenSensing participatory system
Supplemental Material for Identifying relevant volunteered geographic information about adverse weather events in Trondheim using the CitizenSensing participatory system by Tomasz Opach, Jan Ketil Rød, Carlo Navarra, Tina-Simone Neset and Julie Wilk, Sara Santos Cruz, Almar Joling in Environment and Planning B: Urban Analytics and City Science
Footnotes
Declaration of conflicting interests
The author(s) declared no potential conflicts of interest with respect to the research, authorship, and/or publication of this article.
Funding
The author(s) disclosed receipt of the following financial support for the research, authorship, and/or publication of this article: This work was supported by the project ‘Citizen Sensing – Urban Climate Resilience through Participatory Risk Management Systems’ that is part of ERA4CS, an ERA-NET initiated by JPI Climate, and funded by FCT (Portugal, Grant ERA4CS/0001/2016), FORMAS (Sweden, Grant 2017-01719), NWO (The Netherlands, Grant 438.17.805) and RCN (Norway, Grant 274192) with co-funding by the European Union (Grant 690462); this research was also supported by the project ‘Participatory methods for climate change adaptation’ funded by RCN (Norway, Grant 321002).
Supplemental Material
Supplemental material for this article is available online.
References
Supplementary Material
Please find the following supplemental material available below.
For Open Access articles published under a Creative Commons License, all supplemental material carries the same license as the article it is associated with.
For non-Open Access articles published, all supplemental material carries a non-exclusive license, and permission requests for re-use of supplemental material or any part of supplemental material shall be sent directly to the copyright owner as specified in the copyright notice associated with the article.