
Abstract
This paper outlines the creation of the London Output Area Classification (LOAC) from the 2021 Census, set within the broader context of geodemographic classification systems in the United Kingdom. The LOAC 2021 was developed in collaboration with the Greater London Authority (GLA) and offers an enhanced, statistically robust typology adept at capturing the unique spatial, socio-economic and built characteristics of London’s residential neighbourhoods. The paper asserts the critical importance of nuanced, area-specific geodemographic classifications for urban areas with unique geography relative to the national extent.
Introduction
Geodemographic classifications provide succinct yet comprehensive summaries of the characteristics of small area zonal geography. Categorical descriptions are typically created for national extents and are used to compare outcomes of circumstances or behaviours of those residents according to their neighbourhood. The logic of geodemographic classification follows that residential geography is an outcome of social sorting, where people will often live in areas where other residents share similar characteristics to themselves. Influences on residential location choice are often governed by life stage, household structure and income. A young adult leaving home for the first time is more likely to live in a small city centre apartment block than a large suburban house in a residential suburb. Furthermore, a neighbourhood’s prevailing characteristics can further reinforce outcomes and behaviours of residents, which is a process often referred to as ‘neighbourhood effects’. For example, in an area where there is a high level of community engagement and social cohesion, this might positively influence new residents of these areas to behave similarly, following geographically situated prevailing social norms. The process of social sorting through collective residential choice and ensuing neighbourhood effects are key drivers of the utility of geodemographic classifications.
Geodemographic classifications have been developed in the UK over the past 50 years (Harris et al., 2005; Webber and Burrows, 2018), with the first model being created for the city of Liverpool in the 1970s from newly digitised census records (Webber, 1975). This model was then later expanded to the national extent (Webber, 1977; Webber and Craig, 1978), and subsequently other census-based geodemographic classifications have been created after each decennial census of the population, in 1981 (Charlton et al., 1985), 1991 (Brown and Batey, 1994), 2001 (Vickers and Rees, 2006, 2007), 2011 (Gale et al., 2016), and most recently 2021 (Wyszomierski et al., 2023). These are all general purpose classifications, but more specialised variants have been developed for particular policy domains, such as higher education (Singleton and Longley, 2009) and the adoption of new information and communications technology (Longley et al., 2008; Singleton et al., 2016a), As such, geodemographics are frequently seen as part of evolving digital infrastructure for modelling and policy analysis (Longley and Harris, 1999).
Since the 1980s several different commercial classifications have been developed, which often supplement or replace census data with additional commercial or open source data (Webber and Burrows, 2018). These have been used to profile social surveys in public sector applications (e.g. Ashby et al., 2007). Prior to 2001, access to census data was provisioned only through several official brokers and under licences that placed restrictions on the dissemination of derivative products. However, since 2001, small area (Output Area) Census data have been released under an Open Government License, which designated them as open data, and enabled the development of the Output Area Classification (OAC) geodemographics from outputs of the Census in 2001–2021. These were disseminated with open licences and are fully reproducible through a framework of Open Geographic Information Science (Singleton et al., 2016b). In other instances, however, geodemographic classifications have been built for public good using mixtures of Open data and resources licenced to the academic or public sectors through multilateral data licencing agreements (Longley et al., 2024).
While an array of approaches can be employed in the development of a geodemographic classification, a common characteristic is the implementation of clustering algorithms. These are applied to a dataset comprising standardized attributes, to create groupings of zones that share the most similar characteristics. Geodemographics posit the comparability of small areas across all regions, which inherently presupposes the absence of macro-level geographic structures.
There are two important shortcomings to this approach, discussed in detail in Petersen et al. (2011). First, some clusters may predominate within regions that exhibit distinctive characteristics. This skewing effect challenges the integrity of the classification. Second, if some attributes have extreme distributions, this can adversely affect the efficacy of the clustering process and can compromise the quality of the geodemographic classification. The OACs for 2001–2021 (Gale et al., 2016; Vickers and Rees, 2007; Wyszomierski et al., 2023) all applied a single model to every small area across the study area, to the detriment of representing the widely acknowledged distinctiveness of Greater London, which is represented using a narrow range of clusters as a consequence. As discussed elsewhere (Singleton and Longley, 2015), such issues are linked to the uniqueness of London relative to the rest of the UK.
In response to this issue, for the 2011 census, a London Output Area Classification (LOAC) was created in partnership with the Greater London Authority (GLA). The objective being to better represent the unique residential geography of the greater London area and create a typology that would be of greater utility than using a subset of the 2021 England and Wales classification. The LOAC methodology mirrored 2011 OAC, applied only to the areas that make up Greater London, with the output typology comprising a statistically more robust and improved representation relative to the national classification. In this paper we describe the process by which the 2021 London Output Area Classification was created, in partnership with the Greater London Authority.
Methodology
The methodology employed for the creation of the LOAC 2021 closely aligns with the established framework used in the development of the national 2021 Output Area Classification (OAC), developed in partnership with the Office for National Statistics (ONS) (Wyszomierski et al., 2023). LOAC was developed through a partnership with the Greater London Authority (GLA) and supported by the insightful contributions of the LOAC 2021 Advisory Group. The Group, convened by the GLA, included representatives of the anticipated end users of the classification. This inclusive approach ensured that the classification accurately reflected a broad spectrum of perspectives and needs, thereby enhancing its utility and relevance across various applications. All analyses and visualisation were completed within the R statistical programming language, with the exception of the later presented Clustergrams which required Python.
Data and input preparation
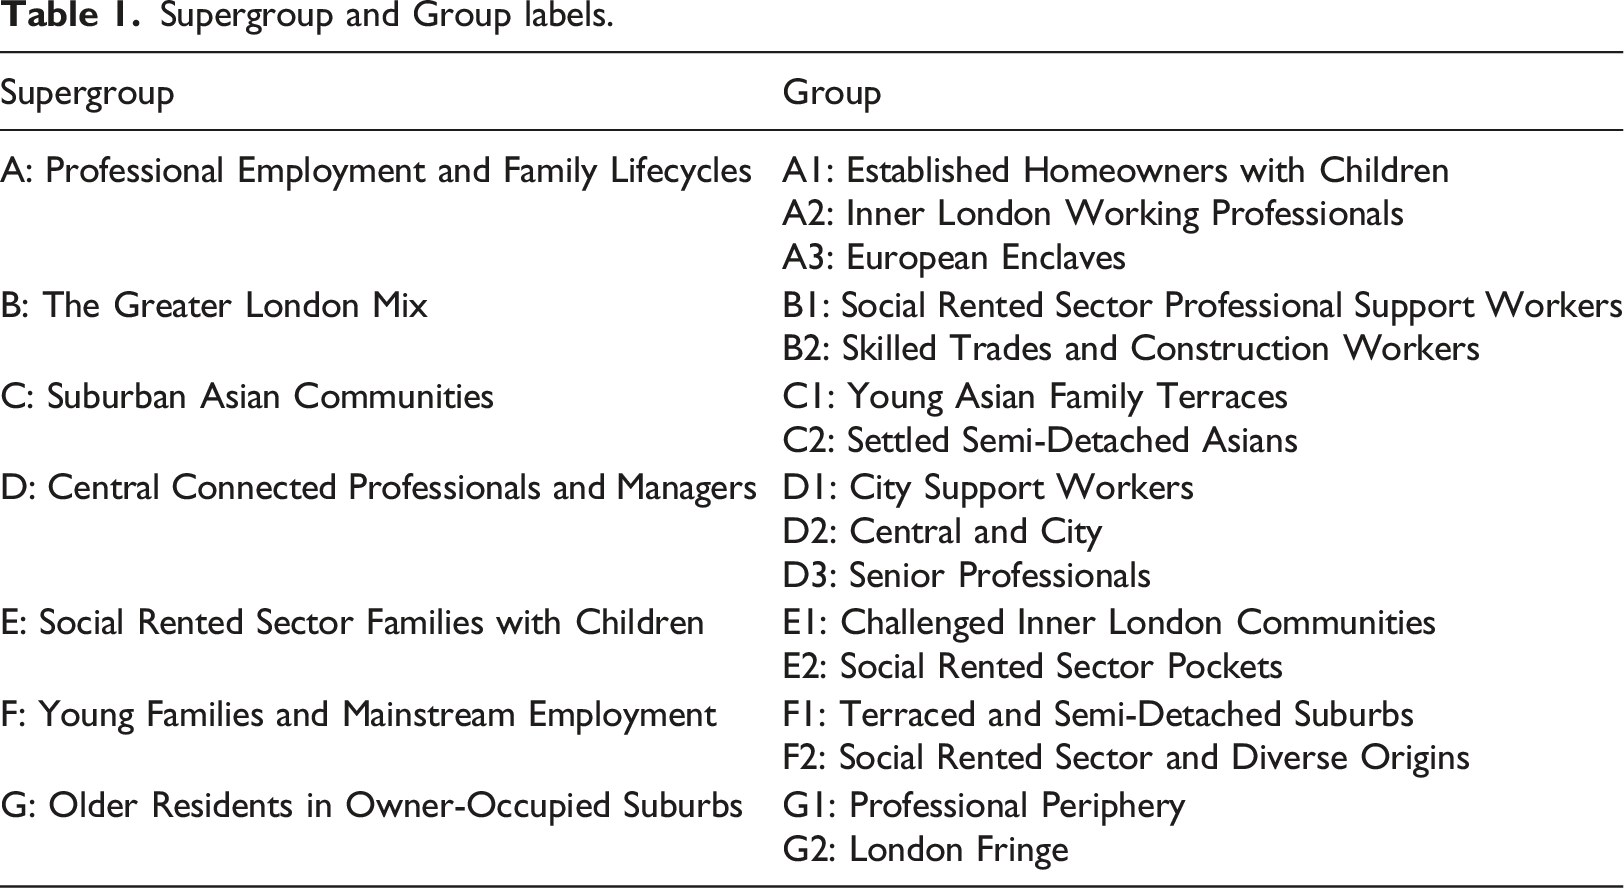
Supergroup and Group labels.
While mirroring variables utilised in the national classification, industry variables (V61–V68) were incorporated as additional LOAC 2021 inputs after consultation with the GLA, to depict London’s distinctive employment structure. Most input measures were derived as proportions, with notable exceptions being V01, calculated as usual residents per square kilometre, and V42, an age-standardized disability ratio. To address the normality of the raw input data, an inverse hyperbolic sine transformation was employed. Range standardization then ensured comparability through uniformity of measurement across all variables. Although following 2021 OAC, these choices were also in line with those methods utilized in both the 2011 LOAC and the 2011 OAC, ensuring consistency with previous frameworks.
Cluster analysis
Following assembly and transformation of the input measures, the next stage applied cluster analysis to identify groupings of Output Areas sharing the greatest similarity. Clustering results are sensitive to positioning of initial seeds, and so following Singleton and Longley (2009) we ran 10,000 iterations of the cluster analyses to ensure the stability of our chosen clustering solutions. LOAC 2021 was created as a two-tier nested classification, in which 2021 Output Areas were organised into larger and more aggregate Supergroups and then split into nested and more detailed Groups. In this instance the classification was created from the ‘top-down’, that is, the most aggregate Supergroups were created first, followed by the nested Groups. This analysis was performed using a k-means clustering algorithm, which is a standard approach used to create geodemographic classifications. Following the development of the Supergroups, to cluster the groups, the OAs belonging to the each were then clustered separately – that is, six separate k means were run to identify the groups. One feature of k-means clustering is that the number of clusters used at Supergroup and Group levels must be pre-specified. There are many ways to identify an ideal number of clusters: for this application, we developed a Clustergram (Figure 1: Fleischmann, 2023). This is a visualisation technique that plots the weighted first component of a principal components analysis by cluster, for a series of different cluster solutions: in this instance, from two to fourteen clusters. Line widths are scaled by the number of Output Areas that are assigned to the clusters as the number of clusters increases. It is desirable that the line widths be broadly similar, consistent with a balanced assignment of Output Areas between clusters, and similarly spaced on the y-axis, indicating that each cluster is distinctive. Parsimony requires that the number of clusters represent the non-reducible complexity of the underlying data while providing a convenient number of clusters for ease of use in policy. Clustergrams are therefore interpreted by looking for a cluster value that offers a good separation of the cluster means (indicated by red dots) on the y-axis. Other diagnostic tests conducted followed those reported in Wyszomierski et al. (2023). In this instance, following detailed consultation with the Advisory Group, a seven-cluster Supergroup solution was selected. The dataset was then split by these clusters, and further Clustergrams (not shown) were used to select the cluster frequencies for the Groups within each Supergroup. Supergroups were each split into either two or three clusters, making a total of 16 Groups. A Clustergram showing the weighted first principal component score for each potential Supergroup cluster solution.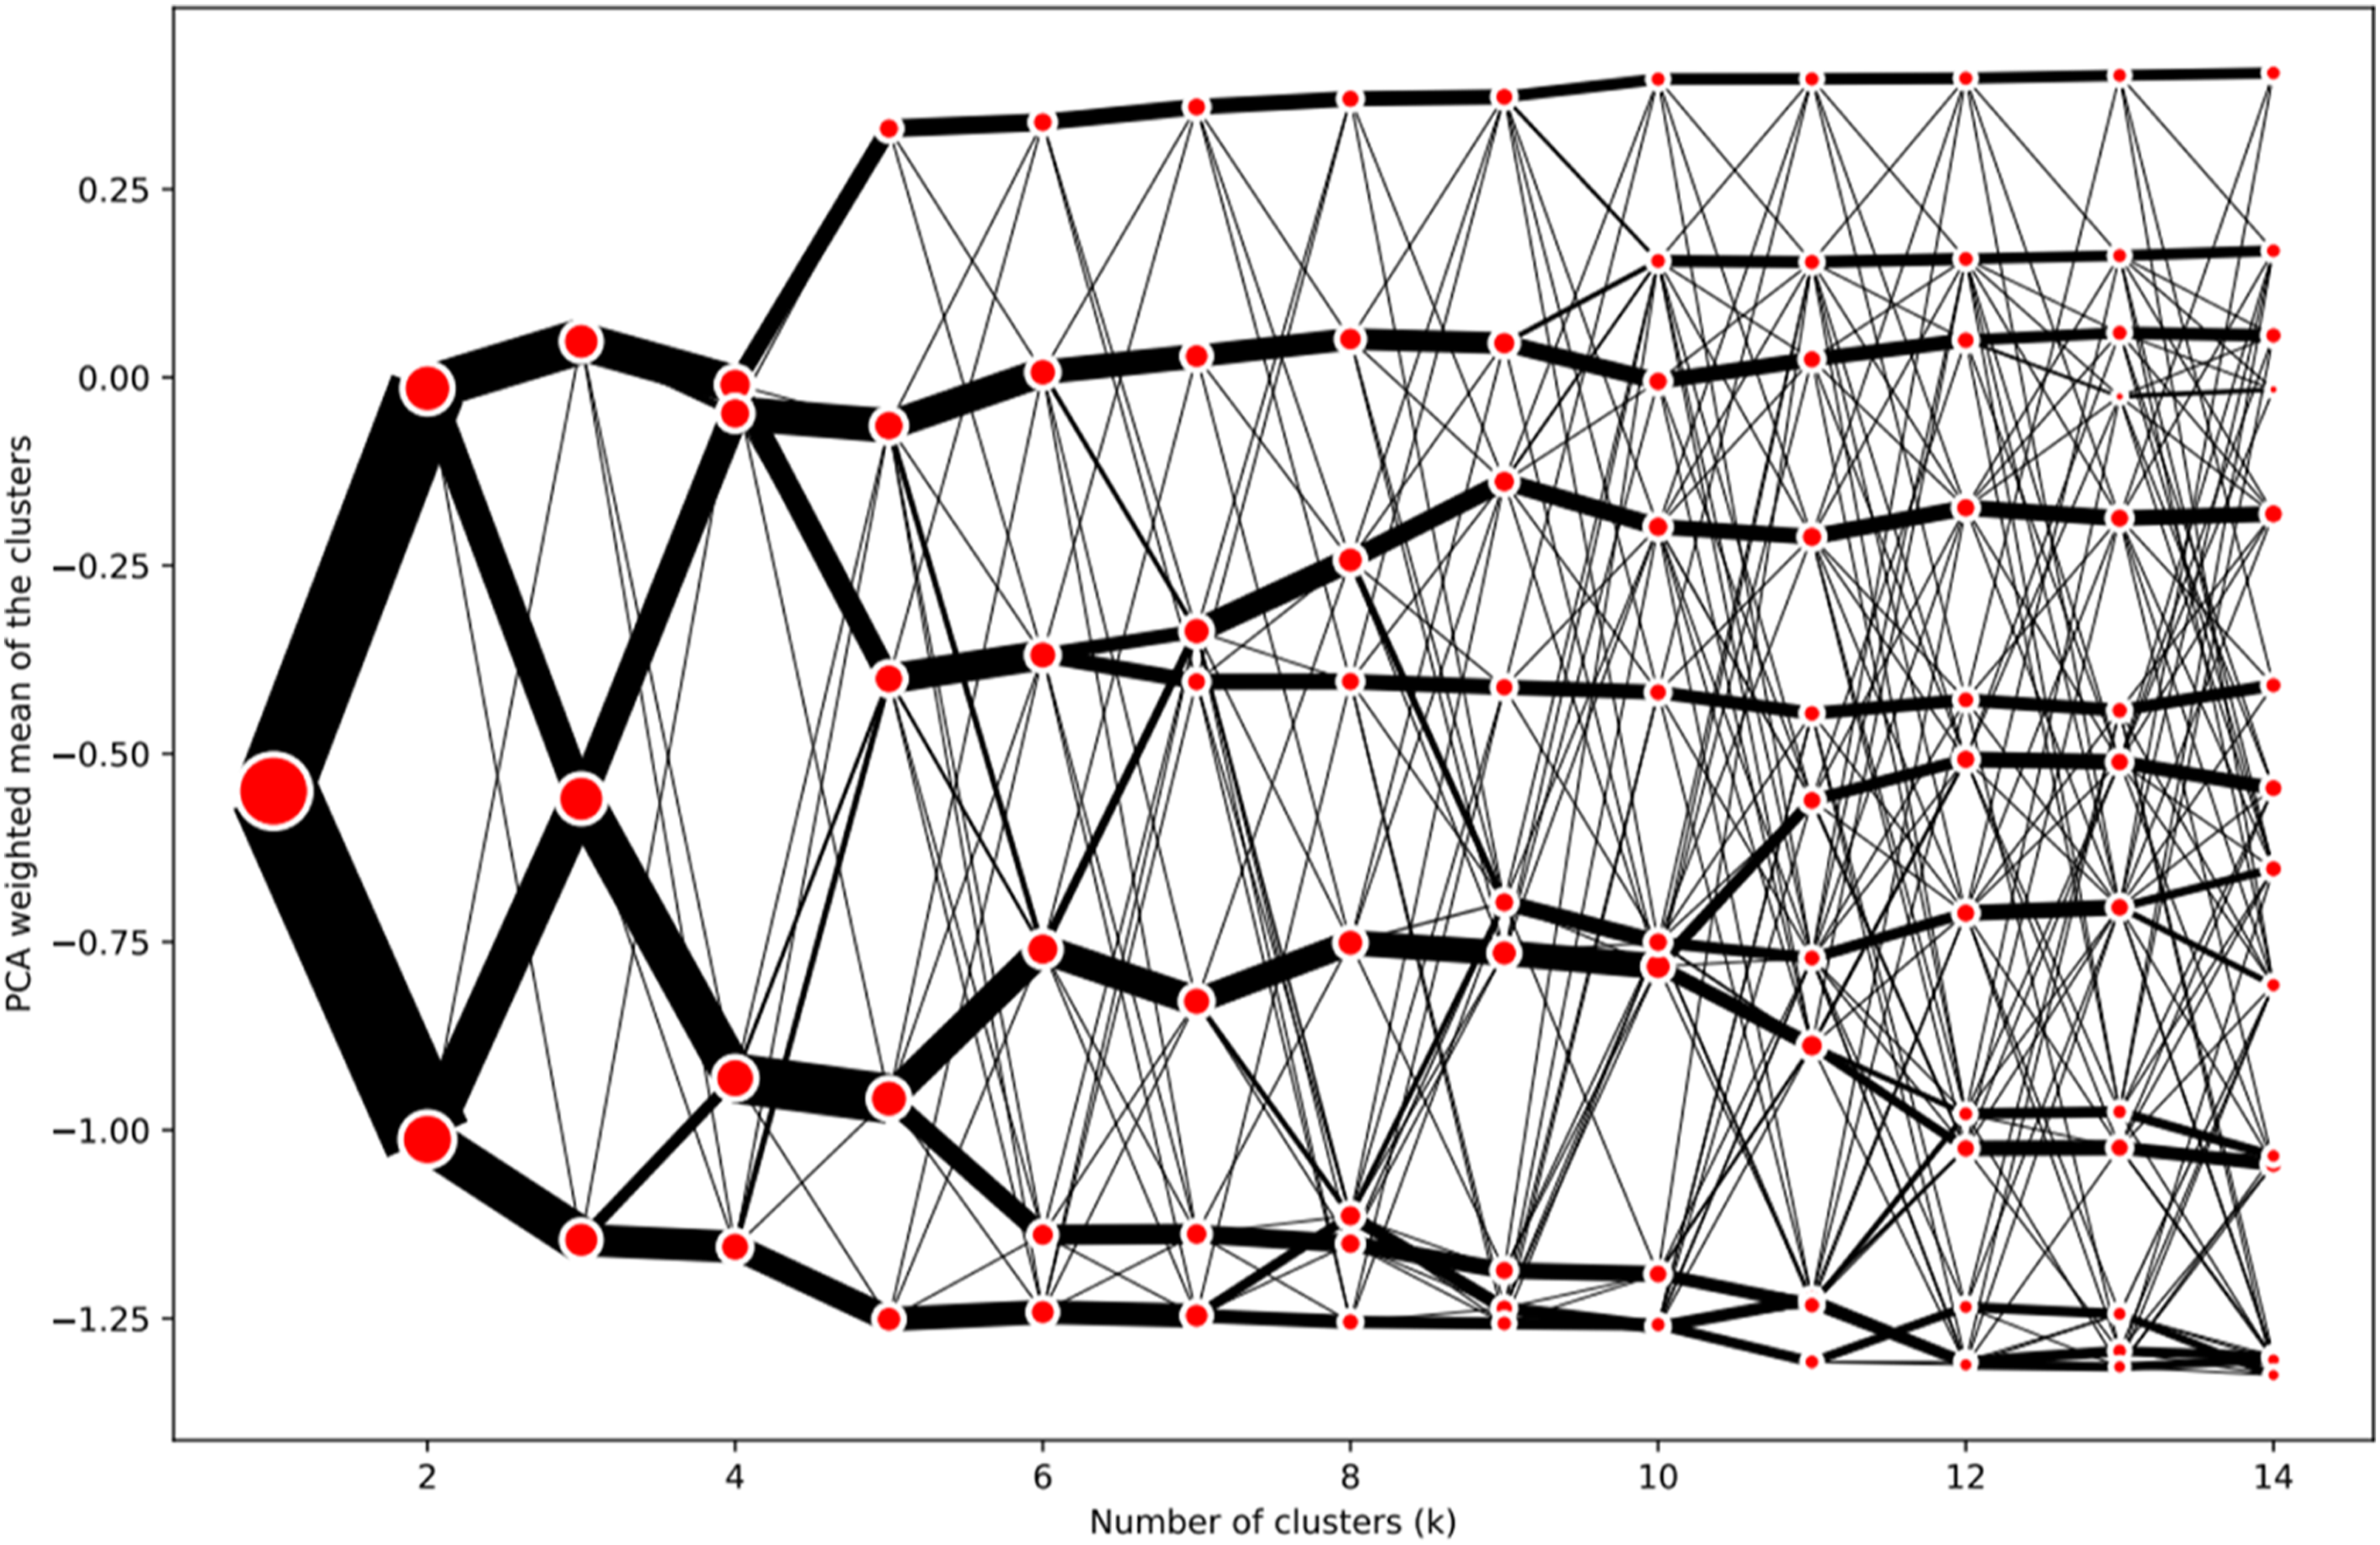
Cluster descriptions
A standard way to describe a geodemographic is to create a ‘grand index’ for each variable in the classification. These show whether each variable is over or underrepresented within any cluster and can be used in labelling clusters and providing descriptions of them. The colour coding of cells in Figure 2 is indexed to a baseline score of 100, which indicates that the score of a variable in a cluster is equal to the Greater London average. A score of 200 indicates that the score is double this average, a score of 50 is half the average, and so forth. These scores are colour coded for ease of interpretation, with the Supergroup plot shown in Figure 2 and the Group plot in supplementary material (Figure 5). Supergroup descriptions are created to represent the main differentiating features within clusters relative to the Greater London average. Group descriptions focus on variables that vary markedly within the Group relative to the Supergroup average. This aims to avoid repetition of what is covered in the Supergroup description, bringing focus to the Group’s distinctive features. Supergroup index scores for LOAC 2021.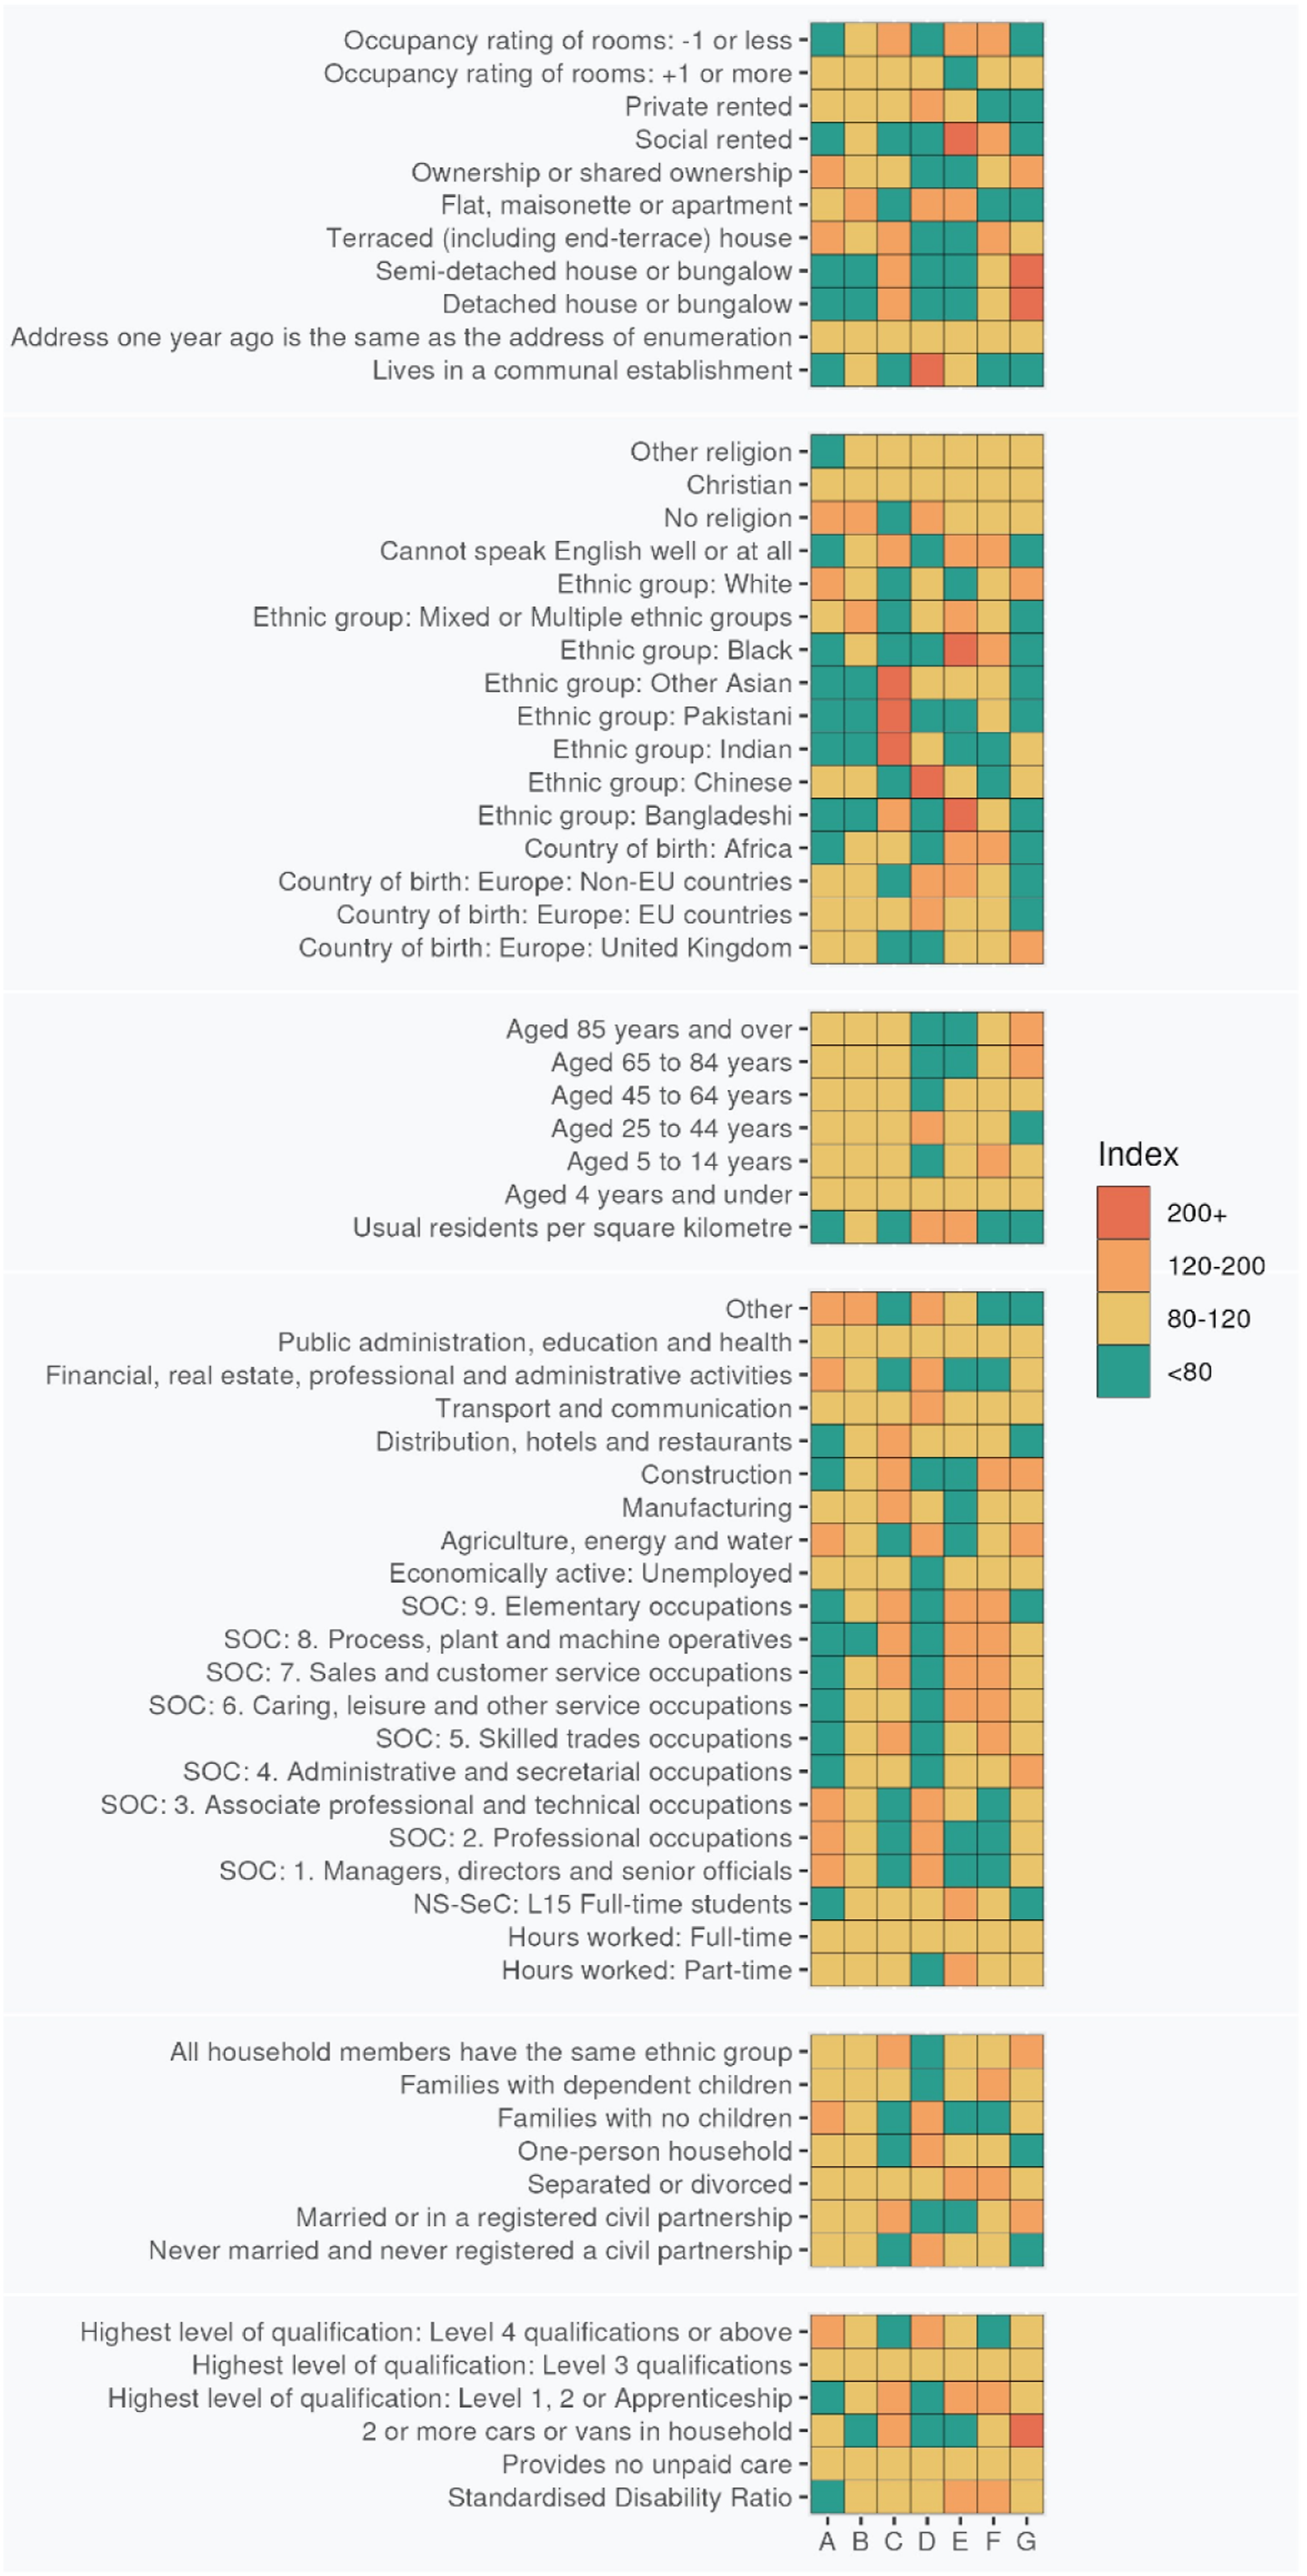
As described in the next section, the LOAC 2021 Advisory Group was convened to agree the descriptions, following both the Supergroup and Group clustering.
End user consultation
During the creation of LOAC 2021, two consultation meetings were held with the Advisory Group. 1 The initial meeting presented an overview of the LOAC 2021 methodology, informed by the process being implemented in the national classification. The meeting also agreed pre-circulated amendments to the OAC 2021 variable specification, specifically for London. This meeting also presented a pilot set of Supergroup clusters and associated maps and descriptions. The methods were approved, and the Supergroup clusters were explored in depth during the meeting. Further feedback was sought after the meeting by email and collated by the GLA. Finally, the meeting also presented suggested splits for the Supergroups by looking at the Clustergrams, which would be used to derive the Groups.
After amendments to the Supergroups were made in response to the feedback, Group-level partitions were created alongside draft descriptions and labels. These were circulated alongside a written response to the first meeting feedback. The purpose of the second meeting was to present the amended Supergroups and the draft Groups, again seeking feedback. A second discussion also solicited the types of supporting materials that would be most useful to end users, and further discussion considered those ways in which the Economic and Social Research Council (ESRC) Consumer Data Research Centre could support LOAC 2021. A final set of Supergroup and Group labels and descriptions was circulated for approval by the GLA.
Results
The results from the cluster naming are presented in Table 2. These names were all agreed in partnership with the GLA, and for each name, a set of written descriptions were also created and agreed.
As an illustration, the following is a description for Supergroup ‘D: Central Connected Professionals and Managers’:
These Central London neighbourhoods are home for a blend of young, educated professionals from diverse backgrounds. Residents are of prime working age and typically live in privately rented flats, some of them crowded. Adult residents of these neighbourhoods are typically aged 25 to 44, working full-time in professional, managerial or associate professional occupations. There are few families with dependent children. The predominantly Inner London neighbourhoods have an international character, including many residents born elsewhere in Europe alongside high numbers of individuals identifying as of Chinese ethnicity. Many individuals are never married, childless and/or living alone. Above average numbers of individuals, likely to be full-time students, live in communal establishments. Elsewhere, privately rented flats are the dominant housing type. Residents of these areas are well-qualified, with a significant number holding Level 4 or above qualifications. There is a correspondingly high level of individuals employed full-time in professional, managerial and associated professional or technical occupations. Employing industries are financial, real estate, professional, administration and, to a lesser degree, transport and communications. Unemployment is uncommon.
An interactive map was created to visualise the Supergroups and Groups as part of the CDRC Mapmaker service (Figure 3). This enables zoom and panning, in addition to provisioning features such as generating a pdf of the area visible to the user and download links. London Output Area Classification interactive map (https://mapmaker.cdrc.ac.uk/#/london-oac).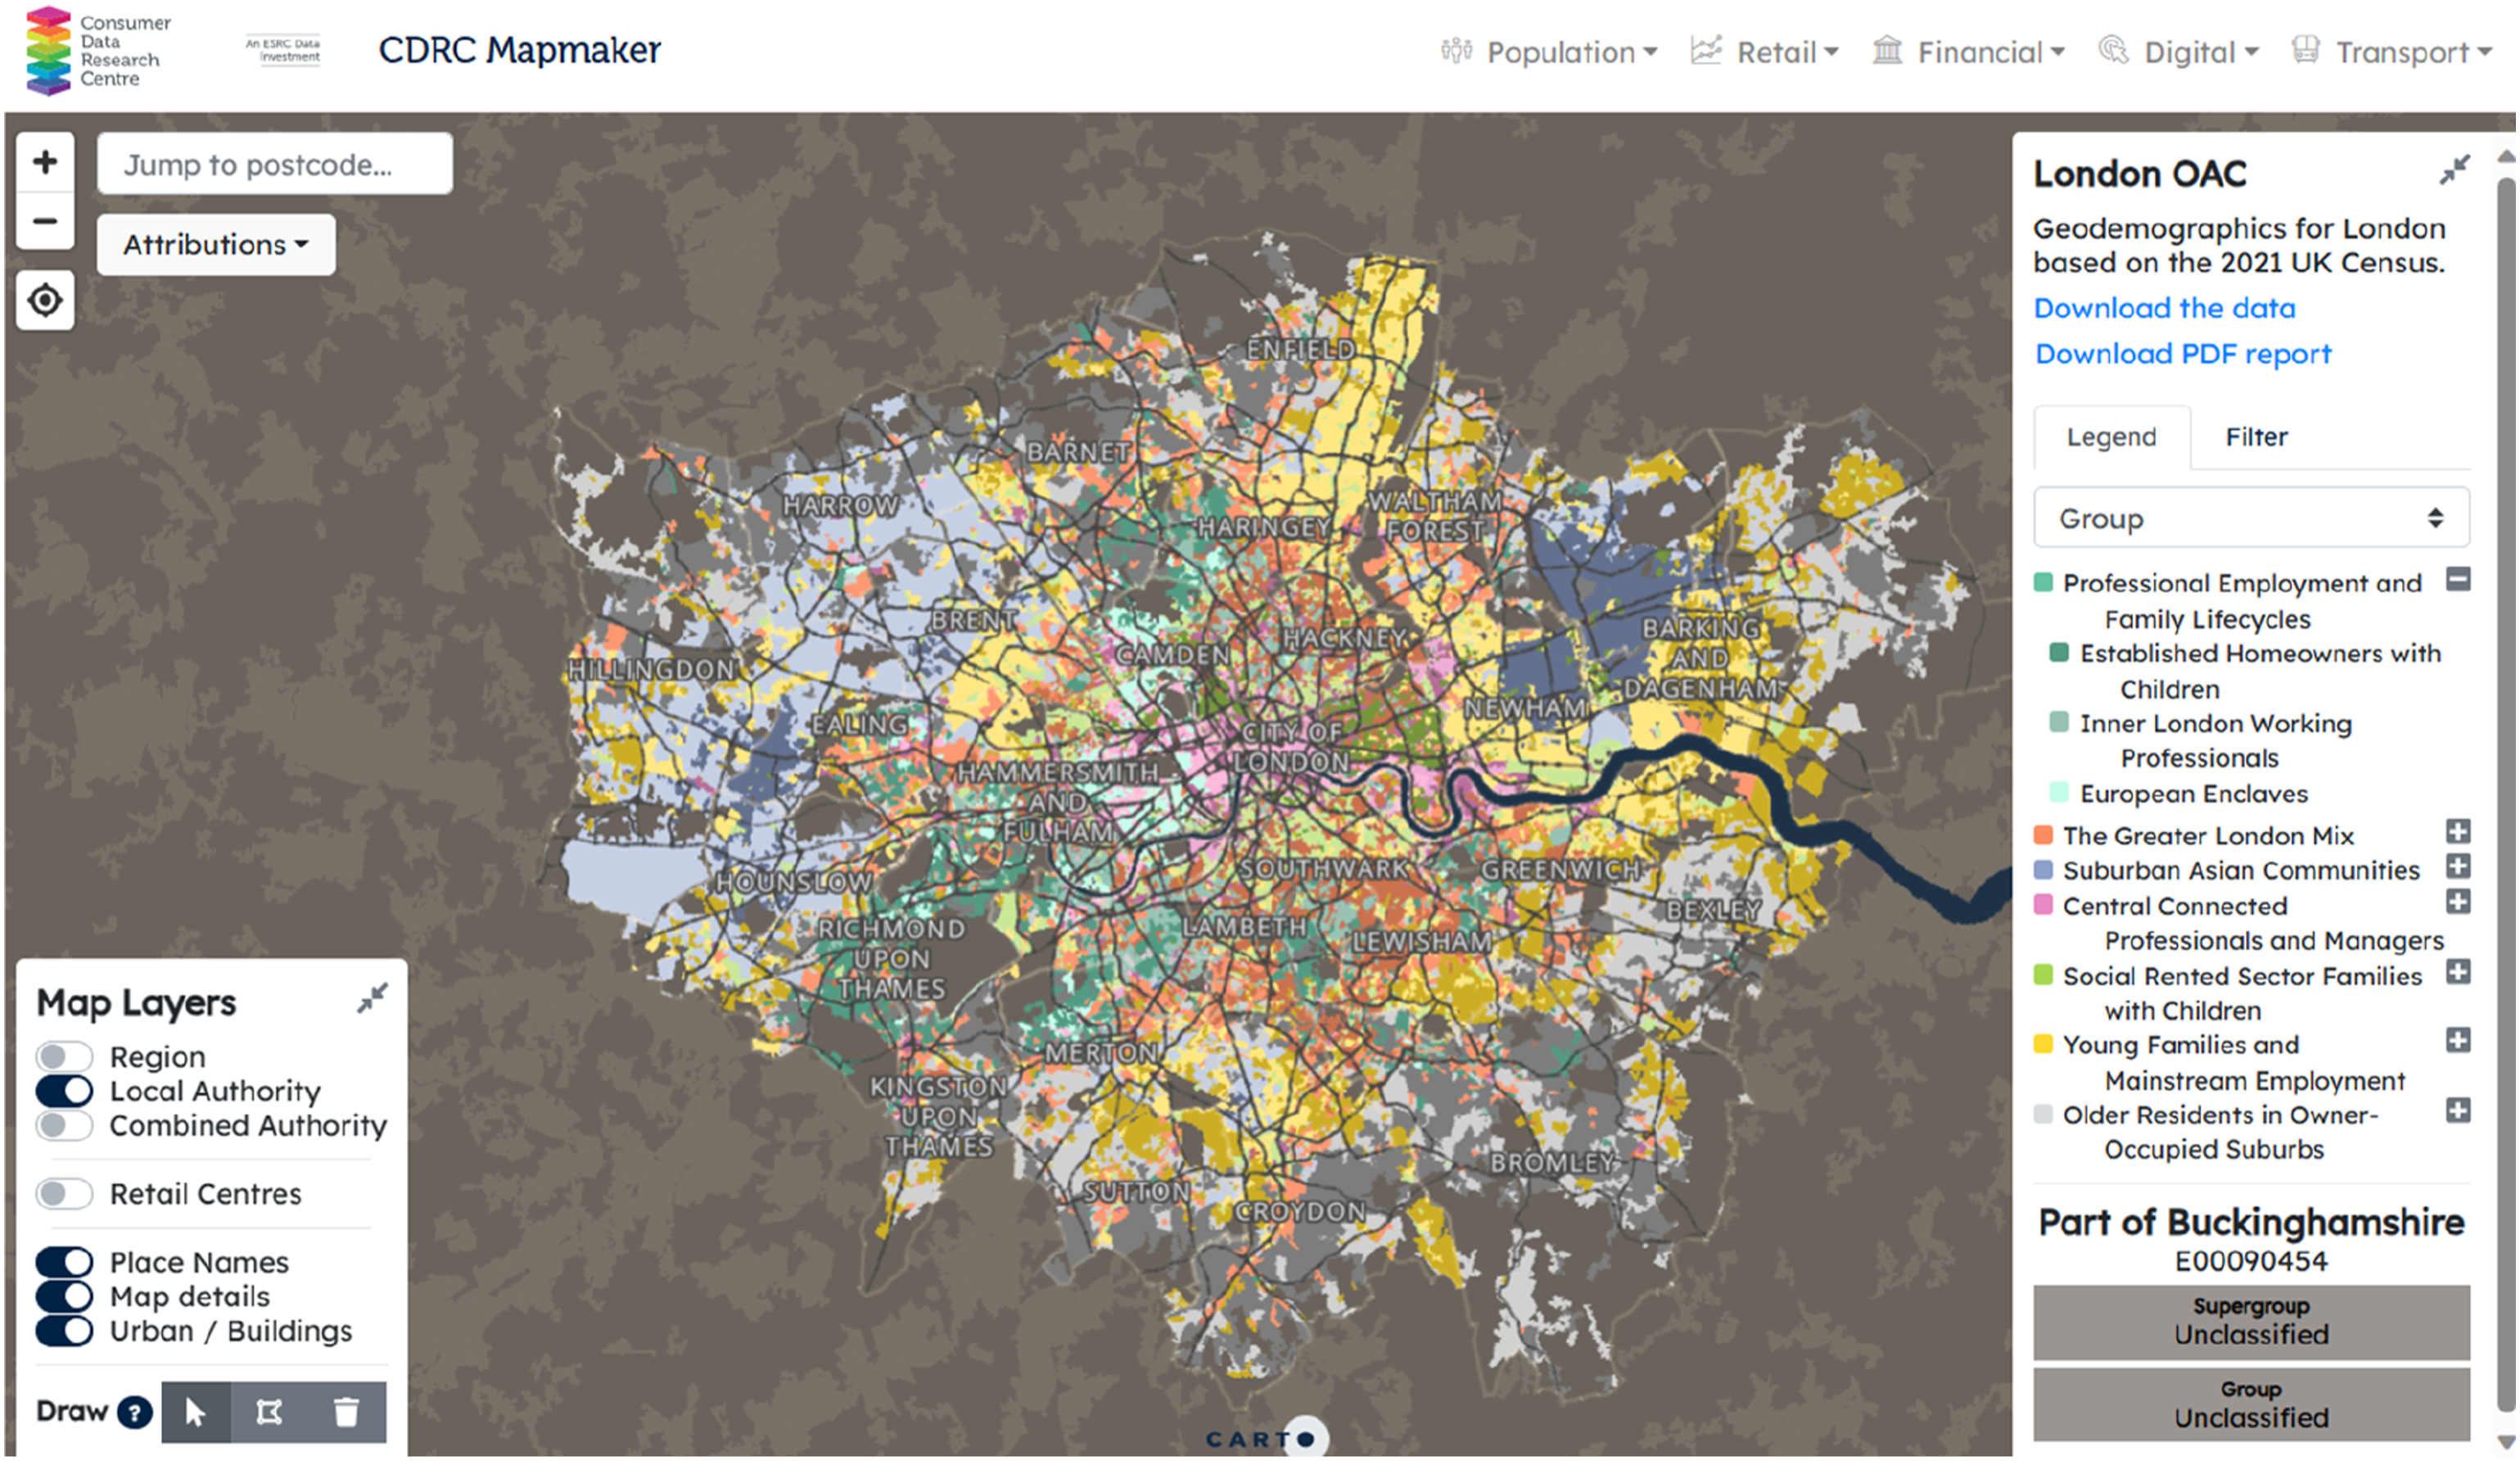
To illustrate local differences within London, two maps are shown in Figure 4 for Hounslow, an outer London Borough to the West of the city, and Camden, an inner London Borough. Their contrasting residential geographies are manifest, with Camden featuring many neighbourhoods not only within Supergroups ‘A: Professional Employment and Family Lifecycles’ and ‘D: Central Connected Professionals and Managers’ but also ‘E: Social Rented Sector Families with Children’. Such diverse neighbourhoods likely offer starkly different life chances. These Supergroups and their constituent Groups are far less prevalent in Hounslow, with most neighbourhoods in this Borough classified as within ‘C: Suburban Asian Communities’. LOAC 2021 Group geography within (a) Camden and (b) Hounslow.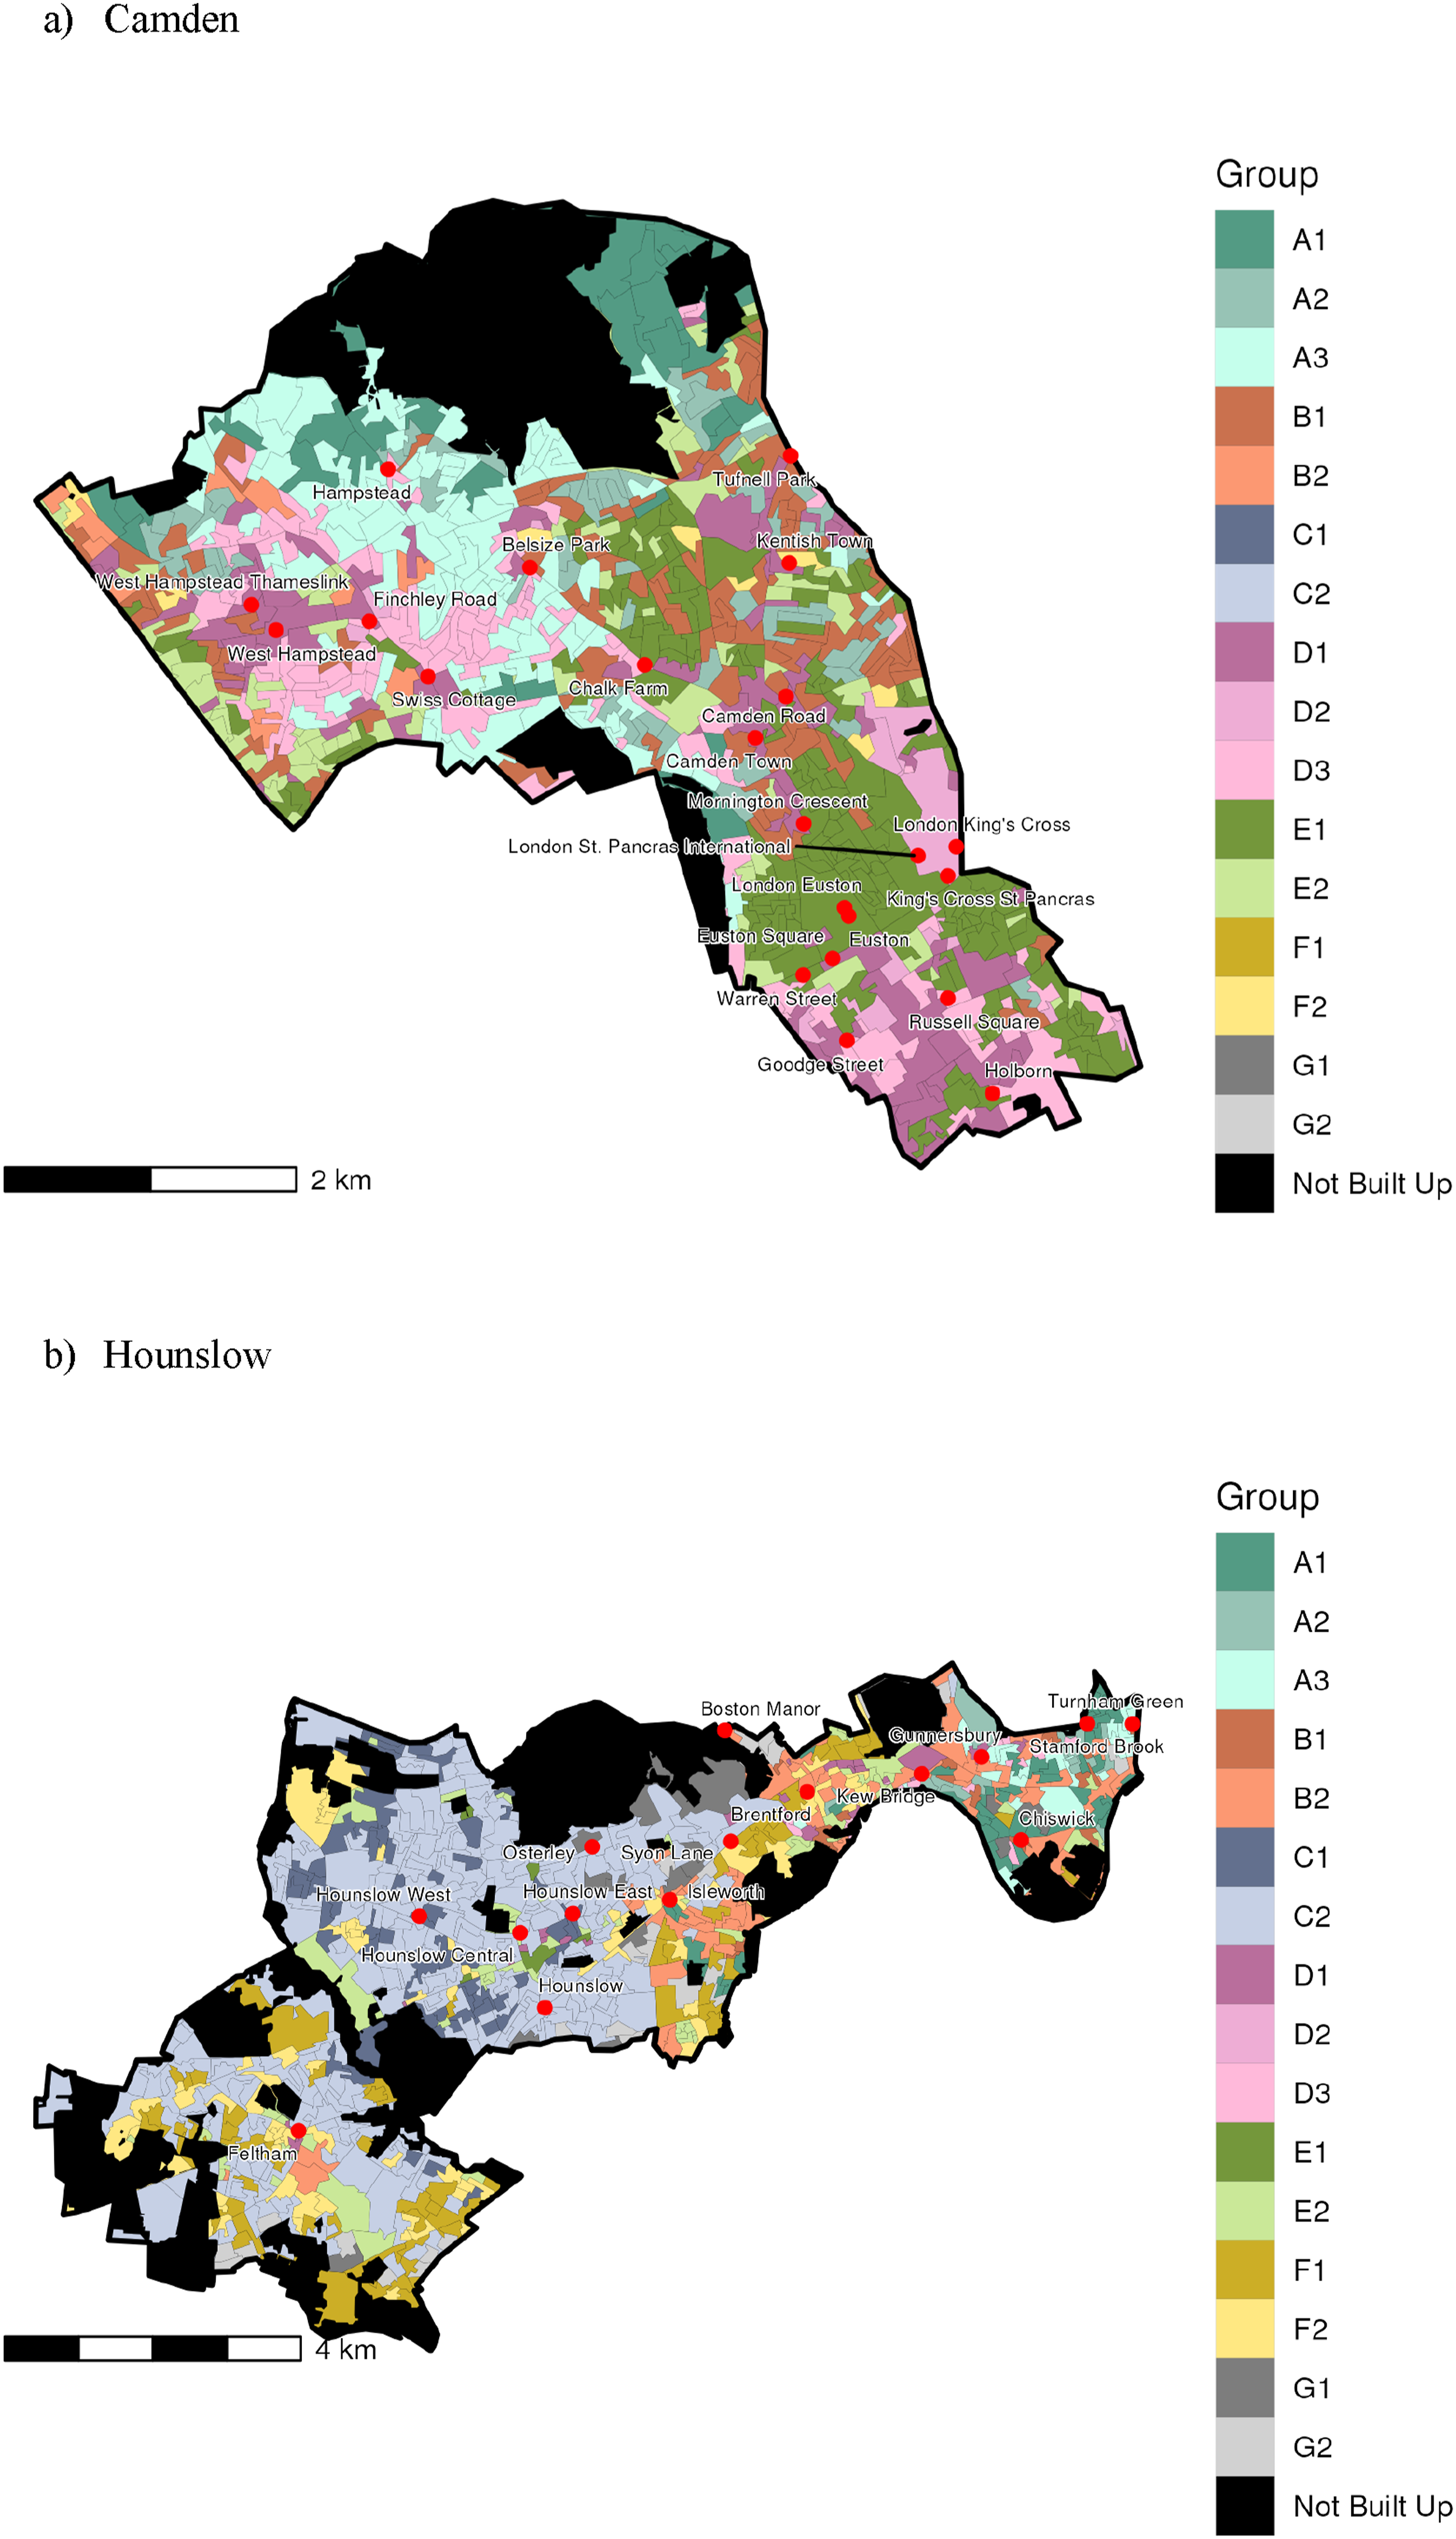
Conclusion
This paper outlines the development of the 2021 London Output Area Classification, a geodemographic classification designed to capture the unique residential characteristics of Greater London’s diverse communities. Building on the established methodology of the England and Wales 2021 Output Area Classification and in partnership with the Greater London Authority (GLA), this project utilized 2021 Census data to categorise small area geographies in London.
The LOAC 2021 inputs encompass variables across multiple domains such as demographics, ethnicity, living arrangements, health, education, and employment. Data normalization and cluster analysis were central to the methodology, designed to identify groupings of Output Areas with similar characteristics.
A two-tier nested classification system was created, comprising broader Supergroups and more detailed Groups. The cluster analysis was visualized through Clustergrams, aiding the selection of cluster numbers for both levels. Each cluster was then described using a ‘grand index’ of input variables, highlighting patterns of over- or under-representation compared to the Greater London average. Extensive consultation with the LOAC 2021 Advisory Group, comprising a diverse range of stakeholders, ensured that the classification reflected varied perspectives and needs. The final output included comprehensive labels and descriptions for each Supergroup and Group.
We may anticipate wide use of the 2021 LOAC given the success of its predecessor that was based upon 2011 Census data. The GLA used the 2011 LOAC to provide up-to-date and improved estimates of small population groups and small area estimates and to improve its knowledge of population migration and churn. This also helped the GLA identify areas experiencing rapid residential densification (leading to potential impacts on public service resource and provision) and informed the Mayoral plan for public services. 2011 LOAC also benefitted GLA school roll forecasting for Boroughs to support school place planning and provided the evidence base for other community services. Without these data, GLA would either have been over dependent upon conventional statistics, which are not updated with sufficient frequency, or would have been reliant solely upon administrative sources which have some weaknesses and biases. The 2011 LOAC also underpinned the Transport for London (TfL) Transport Classification of Londoners; supplementing the 2011 LOAC with information from surveys that captured travel demand, behaviours and preferences (2012–15), TfL developed a segmentation tool that categorised Londoners on the basis of the travel choices they make and the motivations for making those decisions. The tool enabled better planning and informed the Mayor’s Transport Strategy 2017–41.
The core motivation for this paper is that the unique characteristics of the Greater London administrative area merit a separate classification. As such, the study area is bounded by its administrative geography. In principle, future classifications might be organised around functional geographies such as regional commuting areas or more local educational facility catchments (e.g. Singleton et al., 2011).
Supplemental Material
Supplemental Material - Classifying and mapping residential structure through the London Output Area Classification
Supplemental Material for Classifying and mapping residential structure through the London Output Area Classification by Alex D Singleton and Paul A Longley in Environment and Planning B: Urban Analytics and City Science.
Footnotes
Declaration of conflicting interests
The author(s) declared no potential conflicts of interest with respect to the research, authorship, and/or publication of this article.
Funding
The author(s) disclosed receipt of the following financial support for the research, authorship, and/or publication of this article: This work was supported by the Economic and Social Research Council (ES/L011840/1).
Data availability statement
The LOAC 2021 data product can be viewed on the mapmaker website here https://mapmaker.cdrc.ac.uk/#/london-oac; and is available to download from the CDRC data store here: https://data.cdrc.ac.uk/dataset/london-oac. All codes used to create the classification can be found on GitHub ![]() .
.
Supplemental Material
Supplemental material for this article is available online.
Note
References
Supplementary Material
Please find the following supplemental material available below.
For Open Access articles published under a Creative Commons License, all supplemental material carries the same license as the article it is associated with.
For non-Open Access articles published, all supplemental material carries a non-exclusive license, and permission requests for re-use of supplemental material or any part of supplemental material shall be sent directly to the copyright owner as specified in the copyright notice associated with the article.