
Abstract
Background & aims
Individuals with non- or minimally verbal autism (nvASD) are primarily characterized by a severe speech production deficit, with speech limited to no or only a few words by school age. Significant unclarity remains over variability in language profiles across the lifespan, the nature of the language impairment seen, and (dis-) associations between linguistic and nonverbal cognitive measures.
Methods
To address these questions, we recruited both a school-age and an adult group with nvASD (total N = 49) and investigated relations between expressive and receptive language, and between these and nonverbal intelligence quotient (NVIQ) and sense-making capacities (the ComFor test).
Results
Results revealed limited variation across this sample in receptive language, which in turn predicted expressive language levels. Importantly, an upward trend in verbal mental age (VMA) across increasing chronological age was seen in the youngsters (only). A radical dissociation between NVIQ and both expressive and receptive language transpired as well, and a subset of individuals with normal NVIQ were comparable in terms of any other cognitive aspect. Sense-making reached symbolic levels in 62.2% of the sample and loaded on both verbal and nonverbal factors.
Conclusions
These patterns inform theories of nvASD by revealing an impairment that is not conceptualizable as one of expressive language only, sharply limits learning opportunities across the lifespan, and cannot be compensated for by nonverbal cognition.
Implications
These findings stress the need to seize developmental opportunities that may disappear when youngsters turn into adults, via therapies that specifically target language as a central cognitive system comprising both production and comprehension.
Introduction
Non- or minimally verbal individuals with autism (nvASD) are clinically defined by a core expressive language deficit that limits their spoken language acquisition at and after school onset to no or, at most, a handful of single words or simple fixed phrases. Initial explorations of the neural underpinnings of nvASD have shown an alteration of white matter tracts related to speech-motor processing, effectively pointing to an aberrant rather than delayed language profile (Wan et al., 2012). The hypothesis of a primary speech-motor impairment (Chenausky et al., 2018), however, cannot fully account for the extent of nvASD language deficits, in particular a lack of compensation of vocal expressive deficits through sign or written language, or prosthetic devices (Gernsbacher, 2004), nor for deficits in language comprehension. Such deficits, though widely acknowledged, are generally left out from the conceptualization of nvASD, in line with the commonly expressed view that language comprehension can vary greatly in this group, just as it does more generally in autism with intellectual disability (ASD + ID) (DiStefano et al., 2016; Plesa Skwerer et al., 2016; Kasari et al., 2013; Helen Tager-Flusberg & Kasari, 2013). The extent and nature of this variation, however, have not been directly addressed in research, which we attempted here.
Previous formal studies of receptive language in nvASD using standardized but also non-standardized tests have shown it to be severely affected (Maljaars et al., 2011; DiStefano et al., 2016; Chenausky et al., 2019; Garrido et al., 2015; Plesa Skwerer et al., 2019). Plesa Skwerer et al. specifically report word comprehension raw scores on the Peabody Picture Vocabulary test (PPVT) to be 1.5 to 4 SD below the neurotypical population average. 1 However, a more precise interpretation of language comprehension patterns in nvASD is currently still confounded by varying recruitment criteria, such as (a) sampling children below 6 years of age, thus including some children that might more appropriately be classified as ‘pre-verbal’ (DiStefano & Kasari, 2016); and (b) sampling from a broader low-functioning ASD population without distinguishing expressive language levels. Moreover, unclarity remains over the relation between expressive and receptive capacities in nvASD, though there is limited evidence pointing to a correlation Hartley et al. (2017) (see also Pickles et al., 2014; but see Chenausky et al., 2018, for mixed evidence).
A further problem is that research in nvASD has been almost exclusively focused on children and adolescents. According to Pickles et al. (2014), beyond 6 years of age, the rate of language development in ASD in general, enters a steady stage, exhibiting small variation across years and within different language outcome groups. However, in this study, even children with very low initial language levels progressed in their receptive and expressive language development over the 17-year period, though they did so slowly, reaching between 2-year-old and 5-year-old language equivalents at 19 years of age. Similarly, a previous review of the literature on late speech acquisition of first words or phrases during school years in ASD attested gains in productive language after 5 years of age in a minority of 0.1% of children with nvASD (Pickett et al., 2009). Insights into such variation as a result of developing skills in adults, however, are virtually absent. Among the rare exceptions are studies that have recruited only young adults in a mixed group with adolescents (Bal et al., 2020; La Valle et al., 2020; Schwartz et al., 2020). To our knowledge, no study so far has recruited an ample adult-only group and assessed their cognitive profile alongside and in comparison to that of nvASD youngsters. This is practically important in order to be able to form expectations on what changes as youngsters turn into adults.
A systematic coupling between expressive and receptive language in nvASD would inform theories of the language impairment seen in nvASD and its cognitive basis. A critical additional question, however, is the role of nonverbal cognition. In pre-school children with minimal language, nonverbal IQ (NVIQ) is one of the major predictors of later language gains for those children that acquire some language before age 5 (Thurm et al., 2007, 2015; Weismer & Kover, 2015; Wodka et al., 2013). Despite general intellectual disability, a minority of nvASD children shows close-to-average IQ (16% in Bal et al., 2016). Higher or normal NVIQ in nvASD, however, does not seem to predict concurrent verbal mental age (VMA), while slightly more words in production do (Bal et al., 2016). In typical development (TD) and idiopathic ID, by contrast, nonverbal MA and language are intertwined (Maljaars et al., 2012a, 2012b).
Beyond NVIQ, there are broader questions, too, about how cognition develops under conditions of minimal language. The ‘ComFor’ test (Noens et al., 2006) is one standardized test specifically adapted to populations with very low verbal profiles, designed to assess their levels of non-linguistic ‘sense-making’. Using this test, a study by Maljaars et al. (2012a, 2012b) explored levels of sense-making in NVIQ-matched TD, ID and ASD + ID populations. The latter of these turned out to have significantly lower levels of sense-making, while those at non-symbolic levels of sense-making had more severe symptomatology in social interaction, communication, and imagination domains (Autism Diagnostic Observation Schedule, Second Edition, ADOS-2). The ComFor provides an important first inroad into the still largely uncharted territory of object conceptualization and categorization in a minimally verbal person and was therefore included in our scheme here.
Present study
In sum, we aimed to contribute to three areas of research in nvASD, where insights have remained scarce: (a) variability in language profiles as seen at all points of the lifespan, including the possibility of language growth in the adolescent and even adult years (Pickles et al., 2014); (b) the exact relation between expressive and receptive language abilities; (c) and the relation between verbal and non-verbal cognitive abilities. Our specific research questions were:
What variability can be seen in expressively minimally verbal individuals with ASD, with regard to their receptive language, NVIQ, and sense-making scores, both across the lifespan and when comparing youngsters with adults as groups? Do receptive language abilities co-vary with and predict expressive language levels? What association is there between NVIQ and both expressive and receptive language measures? Which cognitive factors predict sense-making capacities (ComFor)?
Answers to these questions would significantly inform current theories and therapies of nvASD and autism at large, as well as expectations for lifelong development. Predictive relations between receptive and expressive language, in particular, would indicate global language deficit not reducible to a speech-motor problem; and variability in NVIQ together an absence of relations between NVIQ and language would point to a relative independence of linguistic cognition, impairments in which cannot be compensated for by non-linguistic cognition (Hinzen et al., 2019). Based on both previous studies and clinical experience, we predicted both a correlation between receptive and expressive language and a failure of NVIQ to predict language capacities in nvASD.
Methods
Sample
The sample consisted of 49 nvASD participants above 6 years of age (DiStefano & Kasari, 2016) (Table 1), who were recruited from several special schools and daily centers across Spain (Barcelona, Vitoria, and Seville) for the purpose of two different studies sharing procedures of cognitive profiling. The recruitment criteria were 2 : (a) a parent- or center-reported ASD diagnosis, (b) absence of phrase level-functional speech (according to a formal ASD classification) with a speech profile consisting of no words, single words or fixed phrases as determined by parental, school, or center reports, and (c) evidence of absence of speech in other modalities (written, sign) or contexts (home, etc.) (Hinzen et al., 2019). The speech status and diagnosis of all participants were re-evaluated after recruitment over the course of the study assessments with specific reference to Module 1 of The Autism Diagnostic Observation Schedule (ADOS) and, in case of the school-aged subsample, additionally The Autism Diagnostic Interview-Revised (ADI-R).
Participant demographics (N = 49).

There was one participant with a comorbid genetic disorder diagnosis (22q11.2 deletion syndrome), which, by not representing a divergent trend in the results, was kept in the analyses. School-aged participants (i.e., youngsters) have participated and/or were currently part of early intervention programs (such as ABA or Denver) to boost their communicative abilities. Older adults, however, were not generally part of early intervention programs. However, each day center adults are currently enrolled in, put into place life-long educational programs and activities. Nevertheless, this may have introduced a bias in the present study comparison analyses. A total of 82% of the participants lived in a bilingual environment (i.e., Spanish-Catalan and Spanish-Basque). The standardized tests, insofar as they involved minimal verbal instructions, were administered in the language participants heard at home. This was Spanish for most subjects, although Catalan was also applied. In case of three participants, the subjects’ native languages partially used at home were other than the above, but two of these were excluded for reasons specified below. A total of 10 additional participants were recruited but excluded during assessment based on: uncooperative behavior (N = 1), ADOS or ADI-R did not confirm ASD diagnosis (N = 5), mutism (N = 1), possible use of another language in vocalizations during the ADOS (N = 2), some flexible phrase speech (N = 1). To ensure comparability to previous research on receptive language in children and adolescents, the sample was divided along a cut-off of 19.0 years for the purposes of some analyses (Table 1).
Measures
ASD diagnosis
ADOS. The Autism Diagnostic Observation Schedule, 2nd edition (ADOS-2; Lord et al., 2012) and The Adapted Autism Diagnostic Observation Schedule (A-ADOS; Bal et al., 2020) are comprehensive semi-structured ASD diagnostic observation instruments. Participants were administered Module 1 Pre-Verbal/Single Words for individuals with 30 + months (ADOS-2) and 13 + years (A-ADOS).
ADI-R. The Autism Diagnostic Interview-Revised (ADI-R; Le Couteur et al., 2003) is a semi-structured diagnostic interview conducted with a primary caregiver. Individuals that do not produce flexible three-word phrases are considered minimally verbal.
Expressive language
Functional speech was determined according to Item A1 (General level of non-echolalic language) on the ADOS insofar as it represents spontaneous speech production with a communicative intent. Speech levels were subclassified as in Bal et al. (2020; 2016), into two groups: (a) ‘FNW’ (‘few-to-no-words’): subjects with no or less than five different words or approximations to words produced during the ADOS session; (2) ‘SW’ (‘some-words’): subjects with more than 5 different words or simple fixed phrases produced during the ADOS session. While the number of different words taps into lexical semantic ability, it has been shown to correlate with more complex syntax and morphology measures in children with phrase speech (Tager-Flusberg et al., 2009).
Receptive language
PPVT-III. The Peabody Picture Vocabulary Test–III (PPVT-III; Dunn and Dunn, 1997; Dunn et al., 2010) is a standardized receptive vocabulary test that does not require a verbal response and yields a measure of VMA. This test was selected to ensure comparability to previous studies reporting receptive language levels in children. The PPVT is recommended as one of the language measures most suited to this population (Kasari et al., 2013); and it correlates with other vocabulary comprehension measures (parent reports, eye-tracker and touch screen measures), though some variability is also noted (Plesa Skwerer et al., 2016). In administering the test trials, hand-over-hand guidance was used during test trials if necessary (adapted from Tsatsanis et al., 2003). Subjects were provided with a small cube to place it onto a picture sheet to deal with absence of pointing or touch. All participants started the task at the lowest starting age point corresponding to 2.6 years.
A further language assessment was envisioned via Child Early Language Fundamentals (CELF; Wiig et al., 2004); however, due to the fact that only a few individuals met a criterion of 3 years of VMA on PPVT to be administered the test, we had to exclude it from the study.
Nonverbal IQ
LEITER-R. The Leiter International Performance Test-Revised (Leiter-R; Roid et al., 2013) is a standardized test used to assess nonverbal IQ with minimal need for instructions and for motor skills to respond. We followed recommendations for administration in low-functioning autism described in Tsatsanis et al. (2003).
Sense-making
COMFOR. The ComFor (Noens et al., 2006) is a clinical assessment tool primarily targeted for individuals with ASD + ID to obtain an individualized indication of a most suitable means of augmentative communicative interventions at a precise level of sense-making. Sense-making—classified into levels of ‘sensation’, ‘presentation’, and ‘representation’—is assessed through largely perceptual discrimination and generalization tasks. Along the sense-making levels, the subject’s interaction with the outside world is described as guided by sensory experiences (sensation), the situational context (presentation), or symbolic conceptualization (representation). Since the ComFor is a perceptual sorting-and-matching categorization task of non-transient and frequent daily-use objects and images that represent them, it can only directly determine a selected number of the cognitive aspects of the different sense-making levels. In particular, it does not assess the referential meaning of words or gestures, displacement of referents outside of here-and-now, object categorization by other means than matching, or even categorization of non-daily use objects.
In this test, the level of ‘sensation’ is attributed when sorting of identical non-functional objects is achieved only with support of a box with an object-shaped hole. The ‘presentation’ level consists of the sorting of identical objects (presentation A) or images of them (presentation B) into open baskets according to concrete and directly perceptible visual features. The level of ‘representation’ proceeds with the sorting of non-identical kinds of objects or pictures, which goes beyond identical perceptible features and includes primary and functional meaning. An intermediate level of ‘developing representation’ involves minimal sorting of non-identical objects.
Procedure
The caregiver’s informed consent was received for all subjects. The standardized tests were administered by a trained psychologist (AR) specifically chosen for her extensive expertise in diagnosis and intervention programs targeted at the nvASD population, and independent with respect to the formulation of research questions, analyses, and writing. In case of some participants, PPVT-III, ComFor, and ADI-R were administered by trained examiners and revised by AR. Participants were individually tested at their respective schools or centres over the course of three videotaped sessions interspaced on different days that lasted between 45 and 75 min. Finally, caregivers were administered the diagnostic interview ADI-R.
Analyses
First, sample composition on the neuropsychological measures (i.e., VMA, expressive language level, NVIQ, and sense-making) was examined. Group differences between youngsters and adults in receptive language and expressive language were assessed via a bootstrapped independent sample t-test and a χ2 test of homogeneity, respectively. Additionally, CA modulation of VMA was explored in both groups to further explore findings in adolescents as in Pickles et al. (2014). Second, receptive and productive language abilities were assessed in relation to each other and to other cognitive predictors across the lifespan. CA was entered as a covariate in analyses, although it was excluded in analyses concerning NVIQ, as NVIQ is itself estimated according to CA. Specifically, a rank analysis of covariance was conducted to identify differences in VMA between the FNW and the SW expressive language level (less or more than five words in production, respectively) while controlling for CA, followed by a binomial logistic regression to ascertain the predictive effects of VMA on the likelihood of having FNW or SW. Subsequently, the associations between NVIQ and expressive language levels were explored through an independent sample t-test, while VMA and NVIQ failed to show a linear relationship.
Finally, the association between the ComFor and expressive language was explored via a rank-biserial correlation, while two Kendall’s Tau b correlations assessed its relationship to both NVIQ and VMA (with CA as a covariate). Kendall’s Tau b was selected as it is more robust against tied ranks than Spearman’s correlations (Howell, 1997). Lastly, a cumulative odds ordinal regression with proportional odds was run to explore NVIQ and VMA as predictors of the ComFor. Expressive language level had to be excluded from the model as it was shown to be associated to VMA.
In case of a non-normal distribution, which was inspected visually and via a Shapiro–Wilk test (p values were <.002), bias-corrected and accelerated (BCa) bootstrapped parametric statistical analysis based on 10,000 samples was reported, since non-parametric analyses yielded identical findings. Correlational analyses were conducted only when the data followed linearity and/or monotonicity. Comparison analyses were checked for homogeneity of variances via Levene’s Test for Equality of Variances. Effect sizes are reported in r-values.
Analyses were conducted in IBM SPSS Statistics (version 26) and in R (R Core Team, 2014) and figures were produced using the package ggplot2 in R (Wickham, 2009).
Results
Neuropsychological measures across the sample
Table 2 shows summary statistics of neuropsychological measures of the entire sample (N = 49) and its youngster and adult subgroups, with bias corrected and accelerated 95% confidence intervals and standard errors. On the VMA measure, the PPVT-III, all participants (N = 49) scored 2 SDs below the population average. Figure 1 shows the relative distributions of VMA and CA. Five participants did not reach a basal score (VMA = 0;0). However, they were kept in the subsequent analyses. Different comprehension measures correlate between each other in nvASD as reported in Plesa Skwerer et al. (2016); thus such a score is not likely to be attributable to the test characteristics or administration bias. Although VMA scores ranged between 0.0 and 5.0, the interquartile variability was limited to IQR = 1.1–2.6. Figure 1 shows the distribution of VMA with higher probability values clustered around the Median = 1.7, BCa 95% CI (1.4, 1.7).
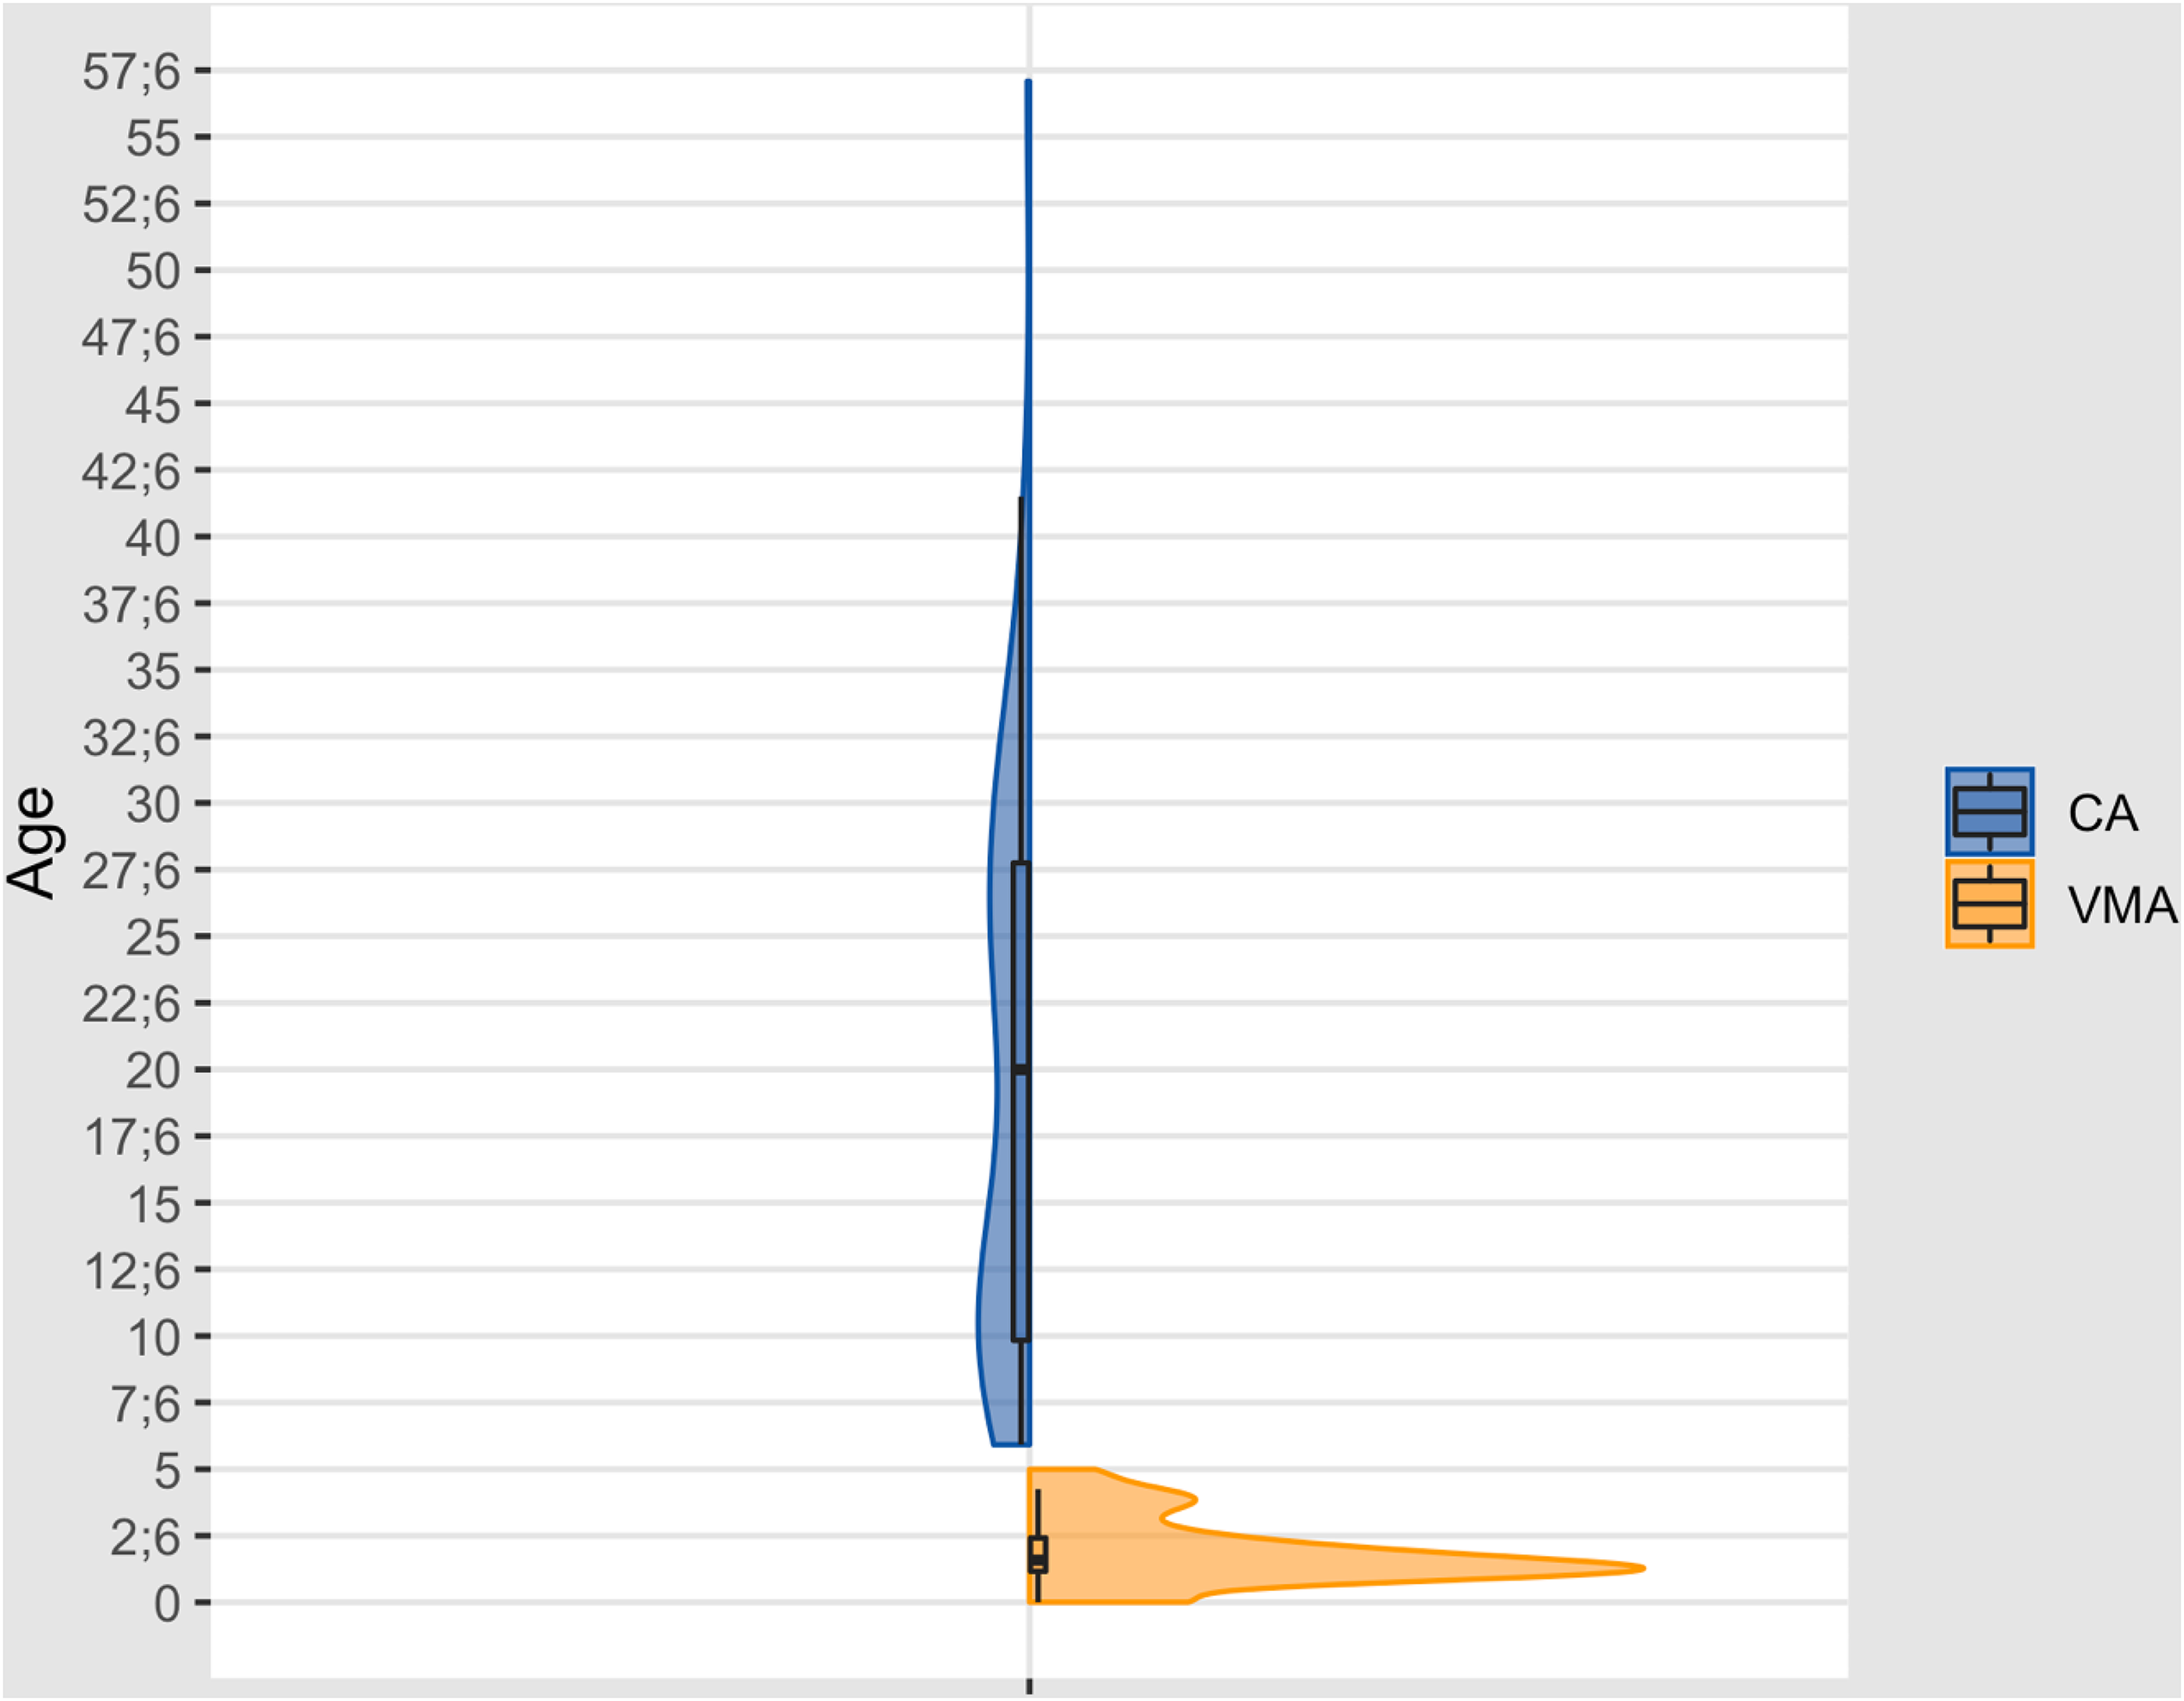
Relative distributions of CA and verbal mental age (VMA) across the lifespan.
Neuropsychological measures. Summary statistics.
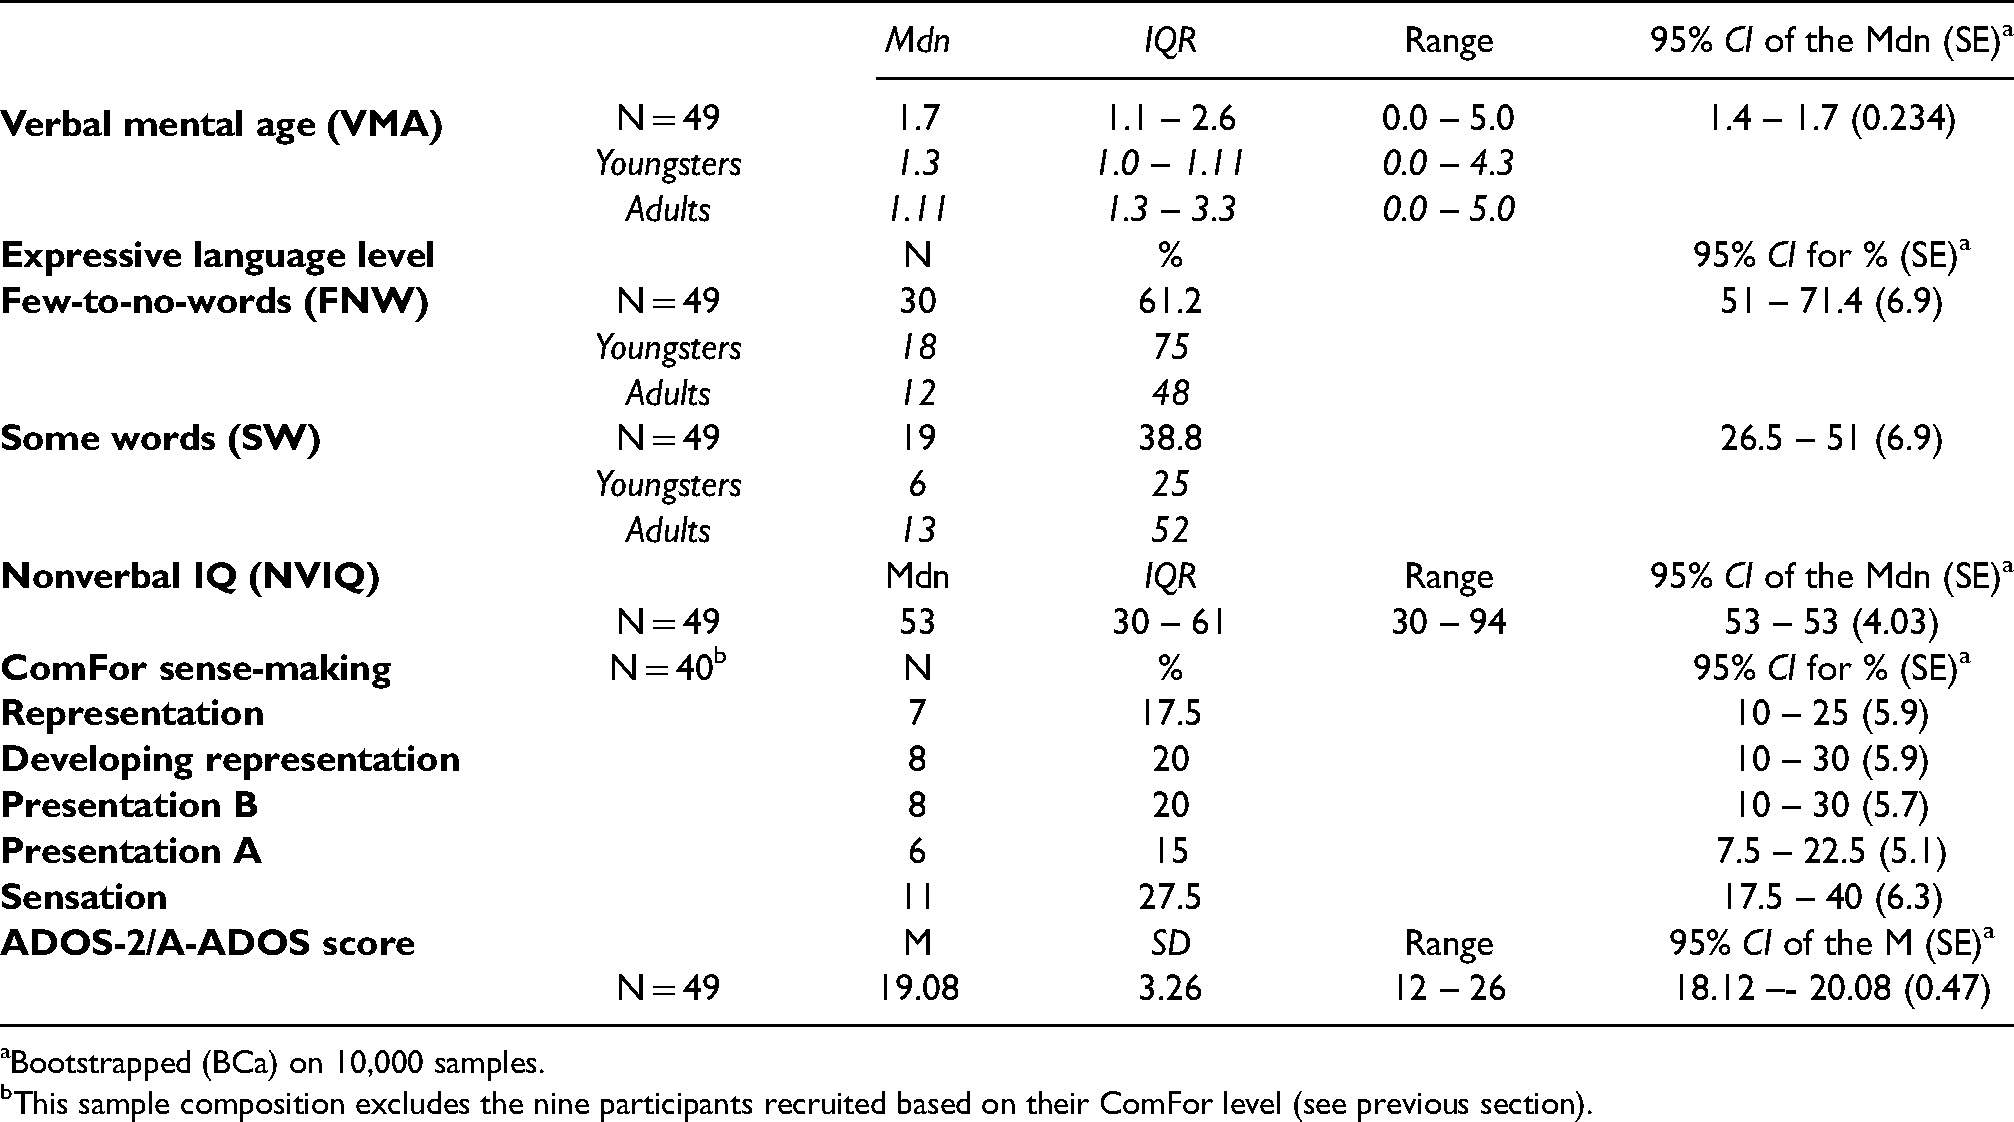
Bootstrapped (BCa) on 10,000 samples.
This sample composition excludes the nine participants recruited based on their ComFor level (see previous section).
Importantly, NVIQ was above the intellectual disability limit (NVIQ > 70) in a small proportion of the sample (N = 5, 10.2%), all of whom belonged to the Youngsters group. However, the NVIQ distribution peaked dramatically at the lowest NVIQ score (Mode = 30, N = 14, 28.6%).
Finally, according to the ComFor, while 62.2% of the sample (N = 28) reached sense-making levels that imply correct categorization of pictures, the remaining 37.8% (N = 17) persisted at manipulation of tridimensional objects, among which were also those participants that did not reach a basal score in PPVT-III (VMA = 0.0). Out of the participants able to categorize pictures, 67.9% (N = 19) were able to match a picture to its referent and 35.7% (N = 10) were able to match non-identically looking instances of the same picture.
Group differences on the neuropsychological measures between youngsters and adults
Group differences in receptive and expressive language between youngsters (N = 24) and adults (N = 25) were computed to explore differences between nvASD adults and youngsters (Figure 2). Adults had a higher mean VMA on average (M = 26.08, SE = 3.43; in months) than youngsters (M = 18.92, SE = 2.61; in months), but this difference was not significant t(47) = −1.65, BCa 95% CI (−16, 1.97), p = .109. Secondly, differences in the binomial proportions of the expressive language levels (FNW and SW) were explored. The difference between the two binomial proportions of .25 was not statistically significant, although it was at the borderline (p = .052).

Group differences in receptive and expressive language between youngsters (N = 24) and adults (N = 25).
Figure 3 explores associations between CA and VMA in youngsters and adults. While the adult subgroup did not show a linear or monotonic relationship, in youngsters CA and VMA followed a monotonic trend. Importantly, however, the data in youngsters formed two clusters with the majority of subjects situated under 2 years of VMA, and three data points—constituting outliers—at 3.10 years of VMA and higher. Thus, a Kendall’s Tau b correlation was run between CA and VMA in youngsters both with and without including the outliers. There was a moderate correlation between VMA and CA that was significant both with outliers (N = 24), τb = .449, BCa 95% CIs (.13, .72), p = .003, and without outliers (N = 21), τb = .328, BCa 95% CIs (−.06, .68), p = .049. Despite this, the BCa 95% CIs of Kendall’s Tau b correlation without outliers intersected with zero, implicating the point-estimate correlation was not statistically significant.

Association between CA and verbal mental age (VMA) in youngsters and adults.
Associations between linguistic and neuropsychological measures
A rank analysis of covariance was run to investigate differences in VMA (PPVT-III) between binarized expressive language levels (i.e., less or more than five words in production during the ADOS session) after controlling for CA. Distributions of CA at each level were similar, as assessed by visual inspection. Participants who produced >five words (SW, N = 19) had higher Median VMA (Mdn = 30; in months) than those who produced <five or no words (FNW, N = 30, Mdn = 15; in months). After adjustment for CA, the difference in VMA between these expressive language subgroups was significant, F(1, 47) = 17.968, p < .0005, r = 0.3.
Subsequently, to estimate the predictive effects of VMA and CA on the likelihood of falling into the FNW or SW subgroups, a binomial logistic regression was conducted. VMA and CA were found to be linearly related to the logit of expressive language level as assessed via the Box–Tidwell procedure (p = .638 and p = .440, respectively). There were two standardized residuals with a value of −2.622 and 2.504 standard deviations, which were kept in the analysis. The area under the ROC curve was .825, 95% CI (.67 to .95), which is an excellent level of discrimination. The logistic regression model was statistically significant, χ2(2) = 19.019, p < .001, and explained 43.7% (Nagelkerke R2) of the variance in expressive language levels while correctly classifying 85.7% of the sample. Sensitivity was 73.7%, specificity was 93.3%, positive predictive value (having >5 words) was 87.5% and negative predictive value (having <5 words) was 84.8%. While increasing VMA was associated with an increased likelihood of having >five words in production, with an odds ratio of 1.0, 95% CI (1.04, 1.18), χ2(1) = 10.08, p = .002, increasing CA did not significantly predict expressive language level, χ2(1) = .71, p = .399.
There was no linear and/or monotonic association between NVIQ and VMA. Similarly, there was no statistically significant difference in NVIQ, −5.17, BCa 95% CI (−15.05, 4.42), between FNW and SW expressive language levels t(47) = −1.03, p = .303, r = 0.149. BCa 95% CIs intersected with zero, which underlines a statistically non-significant effect.
ComFor/sense-making was strongly correlated with expressive language level; on the one hand, rrb = .586, BCa 95% CIs (.35, .68), p < .001; and VMA/receptive language; on the other hand, τb = .661, BCa 95% CIs (.41, .72), p < .0005, after controlling for CA. Furthermore, there was a significant moderate correlation between the ComFor and NVIQ, τb = .330, BCa 95% CIs (.11, .53), p = .003 (see Table 3 for summary). To estimate the joint predictive effect of VMA and NVIQ on the ComFor sense-making, a cumulative odds ordinal regression was run. Both the deviance goodness-of-fit test and the Pearson goodness-of-fit test indicated that the model was a good fit to the observed data, χ2(166) = 88.92, p = 1, χ2(166) = 105.81, p = 1, respectively, but 77.7% of cells were sparse with zero frequencies . However, the final model statistically significantly predicted the ComFor sense-making over and above the intercept-only model, χ2(2) = 50.32, p < .001. An increase in VMA (expressed in months) was associated with an increase in the odds of reaching a higher ComFor sense-making level, with an odds ratio of 1.187, 95% CI (1.1, 1.28), χ2(1) = 20.99, p < .001. An increase in NVIQ was also associated with an increase in the odds of reaching a higher ComFor sense-making level, with an odds ratio of 1.065, 95% CI (1.02, 1.11), χ2(1) = 9.18, p = .002.
Summary of the effect sizes and p values of the statistical tests.

Note: VMA = verbal mental age; NVIQ =#nonverbal intelligence quotient.
Table 3 summarizes the findings of this section. Visualizations of relative associations between the cognitive measures assessed here can be found in supplementary information (Fig. S1).
Discussion
Our first question concerned variability in receptive language in minimally verbal individuals with ASD, across the lifespan. In this regard, in our sample, receptive language scores as assessed by PPVT fell 2 SDs below the normative sample average, mirroring finding in children and adolescents reported in Plesa Skwerer et al. (2016). It is also telling that the CELF, which was originally planned to be used for receptive language assessment, proved to be applicable in our sample only in three subjects, and was therefore discarded from analyses. While a certain degree of spread in VMA as assessed by PPVT was observed, it was restricted to floor level up to 5.0 years, with the central tendency ranging between 1.1 and 2.6 across the sample.
We also confirmed previous findings (Bal et al., 2016) that a small subgroup of people with nvASD has NVIQ outside of the range of intellectual disability. Significant variability was also seen in the ComFor, a measure of ‘sense-making’ or visual conceptualization, where more than a half of the sample proved to have the capacity to categorize pictures of objects, while the rest remained at the level 3D object categorization. A total of 10 participants of the entire sample were able to categorize non-identically looking kinds of objects and pictures.
Binarized grouping of the sample into youngsters, which corresponded to a chronological age range frequently sampled in previous studies of nvASD, and adults, also proved revealing. The distribution of VMA scores in youngsters was consistent with a longitudinal report by Pickles et al. (2014) on maximum language scores reached in 19-years-old participants with marked language delay as well as other studies in nvASD children and adolescents (DiStefano et al., 2016; Plesa Skwerer et al., 2016; among others), and young adults (Bal et al., 2020). Compared to the youngsters, the adult group showed no significant differences in either receptive or expressive language, possibly suggesting a developmental glass ceiling. Thus, VMA scores seen against CA show a striking recession when viewed from a lifespan perspective. However, again consistent with Pickles et al., who reported a gradual, though slow, growth in language abilities across adolescence, youngsters in the present study showed a positive trend in the relation between VMA and CA, while, interestingly, adults failed to show any trend at all. Importantly, while most youngsters have participated in targeted early intervention programs, older adults in our sample have not. It is tempting to see early intervention programs as driving this discrepancy between adults and youngsters, but future studies need to target this issue formally. Still, no consistent effects of intervention on language capacities were identified in a meta-analysis conducted by Spreckley and Boyd (2009).Thus, any gradual gains youngsters might have accumulated over the childhood and adolescent years do not amount to a significant difference with respect to the sample without interventions, that is, adults. Future studies will have to determine whether the attested gradual growth across adolescence will continue further into adulthood. Conversely, a lack of a trend in adult might indicate a “lack of maintenance” as they have limited exposure to early intervention, although they have continued to participate in life-long educational programs and activities as part of their daily center infrastructure.
Our second question was the relation between expressive and receptive language abilities. In this regard, we found speech production to be correlated with, and predicted by, receptive language across the lifespan, regardless of CA. Specifically, VMA as based on receptive language scores alone explained more than 40% of the variance in expressive language level as represented by the cut-off of having either > or no/< five words in production. More than 80% of the sample was accurately classified as having either < or > five words, based on VMA. This pattern is strong evidence that it would be deficient to see nvASD as a problem residing in motor-speech aspects of language only, and that therapies should not be focused on this aspect alone. Comprehension, though harder to assess and clinically less obvious, is key. Our findings on correlations between expressive and receptive language extend conclusions from Bal et al. (2016), Hartley et al. (2017), and Pickles et al. (2014) to a large nvASD-only group of all ages beyond 6 years, but they contrast with Chenausky et al. (2018). Arguably, a small sample size and floor level number of words in production might have contributed to a lack of effect in that latter study, as might relating total number of words in production to receptive language as calculated by PPVT, that is, according to developmental stages, not total words understood. Here, we instead chose a clinically and behaviourally relevant cut-off point of > or < five words in production, following Bal et al. (2016).
Importantly, the PPVT as a measure of VMA and receptive language is not free of biases, as it is based solely on single-word comprehension as assessed through word-picture matching. As such it is not commensurate to comprehension of words as parts of grammatical structures or verbal instructions in nvASD. In typical uses of words, the referent of the word obviously need not be present visually. In line with this, Garrido et al. (2015) found that grammatical comprehension in nvASD is not at a level expected from PPVT-based vocabulary scores. Moreover, in assessment, the PPVT requires an understanding of pictures, which our ComFor results demonstrate is by no means a given in nvASD; and as Preissler (2008) shows, grasp of associative relations between words and pictures by no means shows language-like symbolic understanding of such words. For these reasons the PPVT is limited as an estimate of real receptive language capacities. That said, our results do suggest that the PPVT reflects vocabulary abilities, given that its results mapped onto observed productive language capacities. The exact nature of word comprehension and production in nvASD remains an important open question for future research.
Our third question concerned the relation between nonverbal cognitive capacities and language measures. In this regard, the relative lack of variation we found in receptive language stands in a stark contrast with variation seen in nonverbal cognition, with absence of intellectual disability in a substantial minority, despite a most frequently attested minimal NVIQ score (NVIQ = 30, 28.6%), which has been a robust classifier of children that remain minimally verbal after 5 years of age before (Weismer & Kover, 2015). This contrast and a fundamental lack of association between NVIQ and language across the lifespan suggest a fundamental divergence between verbal and nonverbal cognition in this population, with linguistic cognition being its more defining feature, since cognitive measures other than NVIQ did not show a different profile in those with normal NVIQ. Interestingly, while Bal et al. (2016) found differences in NVIQ between expressive language levels identified as in our study, our findings are more in line with Chenausky et al. (2019), who reported no predictive effect of NVIQ for expressive language.
It would not be true to conclude, however, that nonverbal cognition makes no difference: ComFor scores were distributed across all ComFor sense-making levels, thus showing significant variation, which moreover was significantly explained by NVIQ and language measures alike. Crucially, the ‘representation’ level of this test requires a more global integration of information when sorting objects according to their kind. To what extent a sorting capacity of this nature truly relies on referential and symbolic understanding, however, and hence reflects capacities also constitutive for language, is unclear. Thus, ‘representational’ capacities as assessed in the ComFor do not comply with two criteria at the heart of symbolic understanding (Bates, 1979), namely separability (the symbolic item and its referent are not the same thing) and substitutability (use of the symbolic item instead of the referent). Furthermore, the ComFor also only incorporates highly familiar daily-use objects (such as forks, bottles, and balls) and pictures which are often part of the structured learning environments adapted to people with ASD + ID. For these reasons, the result that ComFor scores loaded on both linguistic and non-linguistic factors makes sense: it is a hybrid cognitive measure. Future studies are critically needed that would assess object conceptualization capacities in nvASD and their relation to the kind of categorization abilities found even in very young, pre-productively verbal neurotypical infants (Vouloumanos & Waxman, 2014). It is worth noting that the primary target and utility of the ComFor lie in determining suitable alternative means of communication in individuals that do not communicate verbally. It is therefore interesting that such abilities may, in fact, still load on a verbal factor, despite directly assessing nonverbal categorization and communication abilities.
Conclusion
NvASD remains one of the fundamental challenges of autism research today, at the most severe as well as neglected end of the spectrum. This study shows that, as youngsters with nvASD turn into adults, they are not likely to become different in their cognitive profiles. While further longitudinal studies and differential cognitive explorations are needed, this study has been the first to provide a lifetime perspective on the development and stability of the cognitive profile of nvASD. It supports directing our research focus on language as a central cognitive system, which as such encompasses both receptive and expressive language, and is not compensated for by non-verbal capacities in this condition. It also shows that even a slight difference in verbal capacities can make an important cognitive difference, while stressing the need to seize developmental opportunities that may otherwise disappear when youngsters turn into adults.
Supplemental Material
sj-docx-1-dli-10.1177_23969415211053264 - Supplemental material for Relations between language, non-verbal cognition, and conceptualization in non- or minimally verbal individuals with ASD across the lifespan
Supplemental material, sj-docx-1-dli-10.1177_23969415211053264 for Relations between language, non-verbal cognition, and conceptualization in non- or minimally verbal individuals with ASD across the lifespan by Dominika Slušná, Andrea Rodríguez, Berta Salvadó, Agustín Vicente and Wolfram Hinzen in Autism & Developmental Language Impairments
Footnotes
We would like to thank the participants and their families for their participation in our study. The authors are grateful to special schools’ (Taiga, Sants Innocents, Tramuntana, and Guru) and daily centres’ (Autismo Sevilla) members for their cordial reception and collaboration, and, specially, to the educators in Landaberde daily center in Vitoria-Gasteiz (Itziar Albina, Zahira García Ríos, Oiane Musitu, and Oscar Fernández de Gamarra) for their help in conducting neuropsychological testing. We are also grateful to Joana Rosselló for her immense help in recruitment.
Declaration of conflicting interests
The authors declared no potential conflicts of interest with respect to the research, authorship, and/or publication of this article.
Funding
The authors disclosed receipt of the following financial support for the research, authorship, and/or publication of this article.
This research was supported by a predoctoral research grant from Generalitat de Catalunya (AGAUR) & European Social Found (2018FI_B_00860, author DS), by an ‘advanced research group’ grant to the Grammar and Cognition Lab (2017 SGR 1265, author WH), and Ministerio de Economía y Competitividad (MINECO, Spanish Government), grants FFI2013-40526P and PID2019-105241GB-I00 (author WH). The funders had no role in the study design, data collection and analysis, decision to publish, or preparation of the manuscript.
Supplemental material
Supplemental material for this article is available online.
Notes
References
Supplementary Material
Please find the following supplemental material available below.
For Open Access articles published under a Creative Commons License, all supplemental material carries the same license as the article it is associated with.
For non-Open Access articles published, all supplemental material carries a non-exclusive license, and permission requests for re-use of supplemental material or any part of supplemental material shall be sent directly to the copyright owner as specified in the copyright notice associated with the article.