
Abstract
Highlights
This systematic review found that few studies of probability trend data compared similar formats or used comparable outcome measures.
The only strong piece of evidence was that graphing probabilities over longer time periods such that the distance between curves widens will tend to increase the perceived difference between the curves.
Weak evidence suggests that survival curves (versus mortality curves) may make it easier to identify the option with the highest overall survival.
Weak evidence suggests that graphing probabilities over longer (rather than shorter) time periods may increase the ability to distinguish between small survival differences.
Evidence was insufficient to determine whether any format influenced behaviors or behavioral intentions.
Keywords
Information about how probabilities change over time may be helpful for patients or members of the public making health-related decisions. For example, the probability of cancer recurrence after treatment changes over time, and the shape of the trend may differ by treatment modality. The risk-reducing effect of interventions such as statins accumulates over time. So does the cumulative chance of pregnancy with various forms of contraception. Although it can be useful to communicate probability over fixed time intervals (e.g., a 5-y risk of breast cancer or a 10-y chance of remaining seizure free), communicating the full time-trend pattern of these possible risks or benefits (versus a single probability) may help patients make better decisions about their health and medical care.
The motivation for the Making Numbers Meaningful project, of which this article is a part, is the growing body of evidence showing that how the numbers are shown—their format—can affect comprehension and other outcomes. As part of this project, we conducted a broad systematic literature review on how to communicate health-related numbers across different types of data and types of data presentation formats.1,2 We assumed a simple communication model in which a reader performs cognitive tasks to make sense of a stimulus, experiencing cognitive, affective, perceptual, or behavioral responses captured by researchers with outcome measures.1,2 Our focus was on the effects of stimulus formats on these outcomes.
However, given the wide variety of types of stimuli and outcome measures employed in studies of numerical communication, to make sense of the evidence we segmented the research in several ways. First, we divided the research by whether it studied the communication of probabilities (such as chance of disease) or quantities (such as lab results).
Second, we categorized research findings by the task required of the reader or research participant. A trend task (the focus of this article) is one in which the reader must use a stimulus that shows multiple probabilities simultaneously (such as a graph or a list of numbers) to evaluate a pattern of probability over time. Other tasks, covered in other Making Numbers Meaningful articles, include point tasks (examining a stimulus for information about single probabilities), difference tasks (using the stimulus to evaluate the difference between probabilities, such as the effect of a therapy upon chance of recovery), and synthesis tasks (examining the stimulus to integrate information about a set of probabilities such as the risks and benefits of a new medication). A single stimulus can potentially support more than one type of task.
Third, we further classified the research by the outcome measures employed in the studies so that we could determine whether a format had different effects on different outcomes. These cognitive, emotional, or behavioral outcomes are listed in Table A and defined in greater detail in our methods overview. 1 In brief, the outcomes were informed by behavioral and risk communication theory (behavior or behavioral intention, effectiveness perceptions or feelings, recall) or empirically on the basis of what was frequently measured by the research we found in our review (trust, preference for a format), particularly measures used to measure comprehension (identification, contrast, computation, categorization, discrimination). Although we categorized the outcomes in this way, it is important to recognize that the actual measures used in the different studies varied and that not all outcomes were present in the available data for each type of task.
Current Article’s Scope within the Making Numbers Meaningful Systematic Review
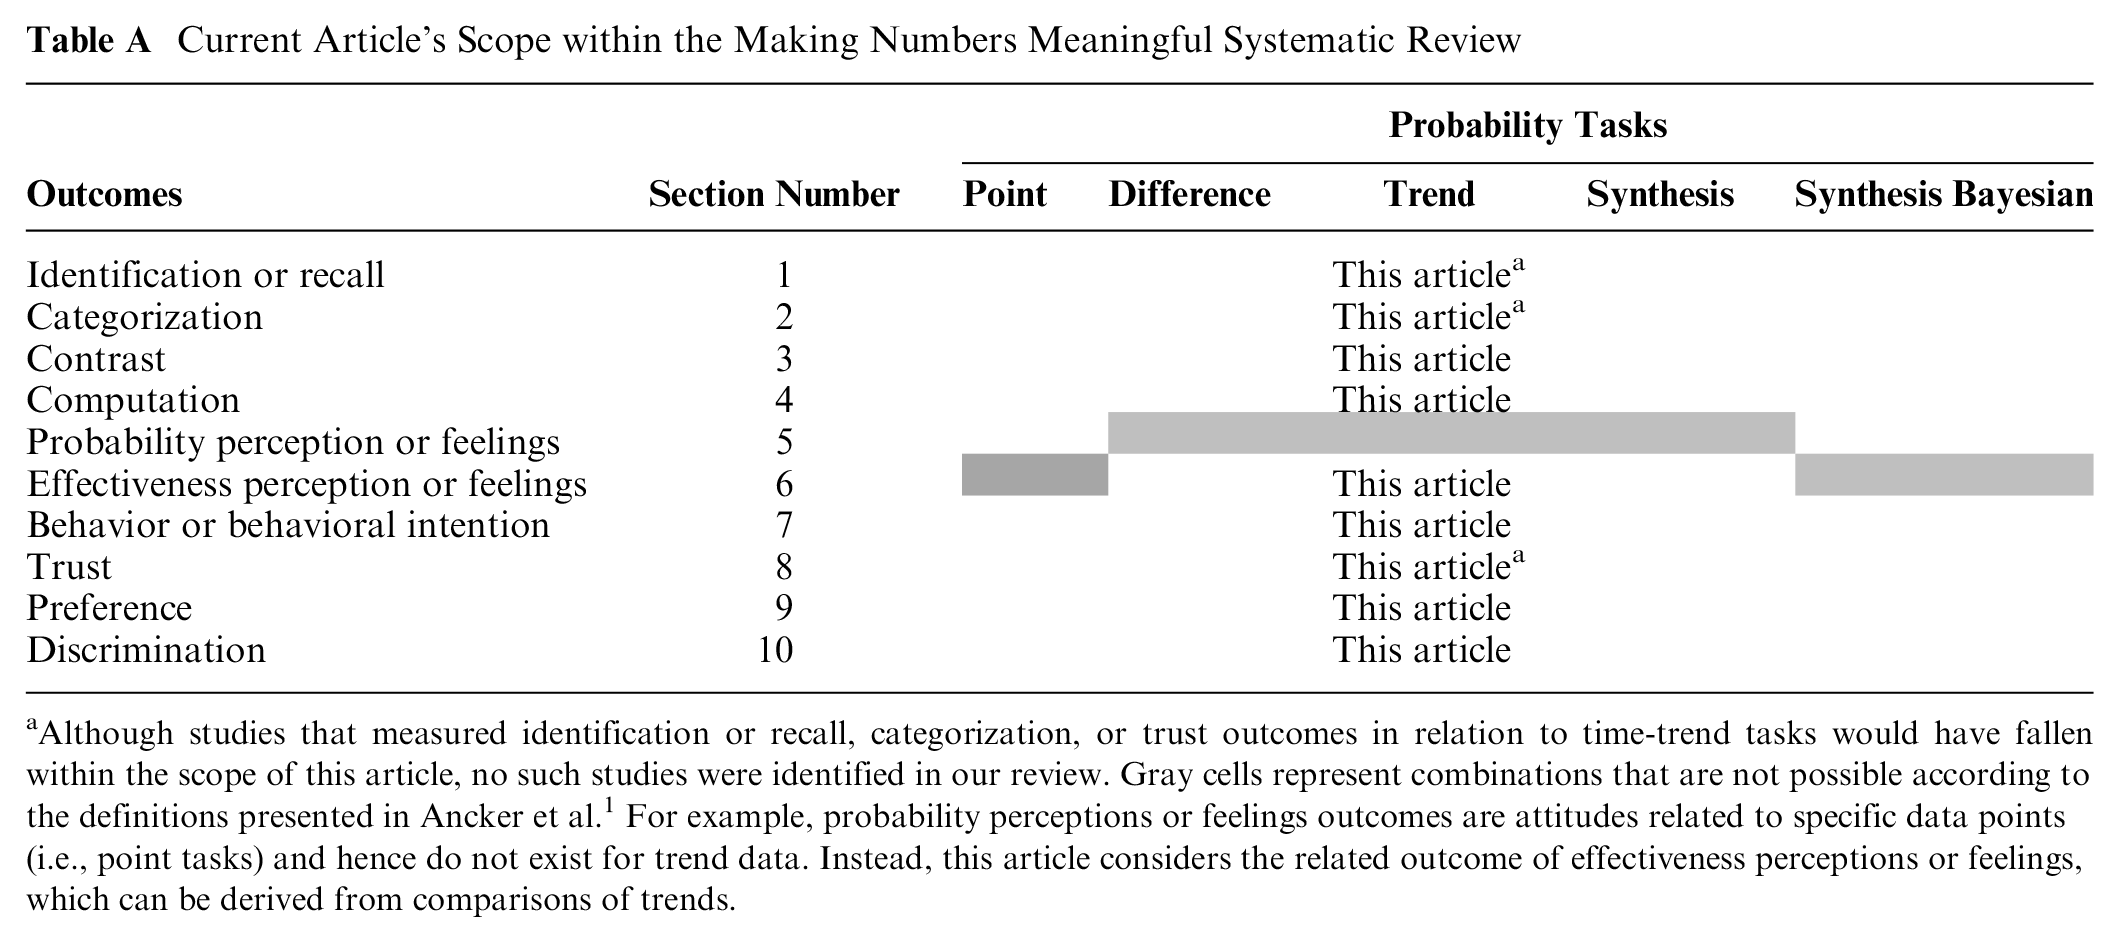

Although studies that measured identification or recall, categorization, or trust outcomes in relation to time-trend tasks would have fallen within the scope of this article, no such studies were identified in our review. Gray cells represent combinations that are not possible according to the definitions presented in Ancker et al. 1 For example, probability perceptions or feelings outcomes are attitudes related to specific data points (i.e., point tasks) and hence do not exist for trend data. Instead, this article considers the related outcome of effectiveness perceptions or feelings, which can be derived from comparisons of trends.
This article focuses specifically on research that presented direct comparative evidence on the effects of format on probability time-trend tasks. While we considered all possible outcomes, we were able to identify only research studies that measured 6 specific outcomes. These are contrast (the ability to select the higher or lower quantity, such as identifying the treatment with the lowest chance of side effects from a group of treatments), computation (the ability to perform calculations such as doubling or halving a risk), effectiveness perceptions (perceptions of difference between 2 time trends, such as the chance of cancer recurrence with and without a particular therapy), behavioral intentions (such as intention to change behavior or choice of a particular therapy), preference for the data format (i.e., whether the participant liked bar charts or icon arrays better), and discrimination (sensitivity to variations in the probability trend). These results are presented below.
Methods
As reported elsewhere 1 in detail, our systematic literature review (Prospero No. CRD42018086270) identified research from multiple disciplines that compared 2 or more ways of presenting numbers to lay audiences with the goal of estimating the effect of format on outcomes. The search was conducted in MEDLINE, Embase, CINAHL, the Cochrane Library, PsycINFO, ERIC, and ACM Digital Library, and we conducted hand searches of tables of contents of Medical Decision Making, Patient Education and Counseling, Risk Analysis, and Journal of Health Communication. Our methods article 1 describes the literature search, screening via Covidence, risk-of-bias evaluation, data extraction, assessment of study risk of bias, assessment of finding credibility, and organization into evidence tables. Instruments from the review, including the search strategy, the study risk-of-bias (S-ROB) instrument, and the data extraction instrument, are available in the methodology folder of the Making Numbers Meaningful Project at OSF (https://osf.io/rvxf2/).
We identified 316 articles, of which 6 involved trend tasks with stimuli showing probability data. From each study, we extracted information about task, stimulus (data and data presentation format), and outcome. Substudies were extracted as separate records. Each study (or substudy, if present) was assessed for S-ROB using a rubric adapted for this project that considered sample representativeness, randomization, protocol deviations, presence/absence of demographic and covariate information, missing data, and other potential biases. The rubric (together with other instruments used in this project) is available in the Making Numbers Meaningful Project at OSF (https://osf.io/rvxf2/).
Each study could involve multiple tasks, format comparisons, and outcomes. In the data extraction, we called each unique combination of task, format comparison, and outcome a finding. For example, imagine a study in which readers were randomized to see survival or mortality curves illustrating the results of some therapy and then asked to complete a questionnaire instrument about the information. This study might produce a trend task finding comparing survival and mortality curves in their effects on the participant’s ability to contrast (identify the overall higher or lower probability trend) and a second trend task finding about their intended choice of therapy (behavioral intention). Note, however, that if the participant was also asked to identify a specific point on the graph rather than evaluate the graph holistically, this would result in a point task finding rather than a trend task finding. Point task findings do not appear in this article but are collected in other Making Numbers Meaningful articles.
Each finding was rated for credibility by 2 expert reviewers (primarily J.S.A. and B.J.Z.-F., with N.C.B. substituting in cases of conflict of interest). The reviewers assigned credibility holistically on the basis of their judgment of the appropriateness of the sample size and statistical methods, face validity and comparability of the stimuli being compared, face or criterion validity of the outcome measures and covariates, and S-ROB for the study from which the finding was derived. Ratings were allowed to vary across reviewers, but reviewers discussed any cases in which ratings differed by more than 1 point to ensure consistency in their understanding of the study; the final credibility score was the average of the 2 reviewer scores. Credibility of multiple findings from a single study might vary. For example, the primary outcome might result in a high-credibility finding, but secondary outcomes not subjected to hypothesis testing or subset analyses with small sample size might produce low-credibility findings.
Findings were grouped by task and outcome and synthesized into guidance statements. Our standard rubric for evidence strength was as follows:
Consistency was considered high if all findings were significant in the same direction or if a large majority were significant in one direction with a few lacking in significance, moderate if findings showed a small majority of significant effects in one direction with the remainder lacking significance, and low if the findings showed significant effects in different directions. Findings with high credibility (7 or higher on a scale of 1 to 10) and moderate credibility (4.5–6.5) are discussed below. Findings with lower credibility (4 or lower) are mentioned below and counted but do not contribute to the evidence summaries or the statements in the evidence tables.
Results
Very few studies of probability time-trend tasks were similar in terms of both formats compared and outcomes assessed. As a result, only small numbers could be compared directly with each other (Table B). With regard to outcomes, no studies assessed identification or recall, categorization, effectiveness feelings, or trust outcomes. With regard to format comparisons, no studies compared numbers with numbers, numbers with verbal probabilities, manipulations of uncertainty representations, context manipulations, denominator manipulations, or animations.
Section Headings for Each Subset of Outcome Evidence Included in This Article and the Number of Included Findings a

indicates n = 0.
This standardized numbering system, reflected here and in Table A, has been used for results subheadings across all Making Numbers Meaningful (MNM) results articles. The standard numbers ensure that, for example, studies on the effects of gain-loss framing on behavior are always placed in a subhead labeled section 7F (whether or not there are sections 1–6 or 7A–7E in that particular article). Our goal is to ensure that readers can use this subhead system to more easily locate similar sections across articles. The full list of section headers is available in the Methodology Files folder at the MNN Project at https://osf.io/rvxf2/.
The full spreadsheet of probability time-trend task findings cited in the current article is available at the Making Numbers Meaningful Project at OSF (https://osf.io/rvxf2/) in the Probability Findings folder.
Effects of Different Probability Trend Formats on Ability to Identify Largest or Smallest of a Set of Numbers (Contrast Outcome—Section 2)
Asking participants to select the time trends representing the highest or lowest overall probabilities or to rank the trends in order of size, sometimes considered a measure of comprehension, was classified as a contrast outcome. Within this outcome, the only format comparison data available concerned comparisons of frames and of shorter versus longer time periods.
Comparison of frames (gain, loss, and/or combination) on ability to contrast probability trends (section 2F)
One high-credibility finding by Zikmund-Fisher et al. 3 suggested that ability to recognize which of 2 time trends had the highest overall survival was better when the data were shown as survival curves than as mortality curves.
Evidence-Based Guidance for Comparison of Frames on Ability to Contrast Probability Trends

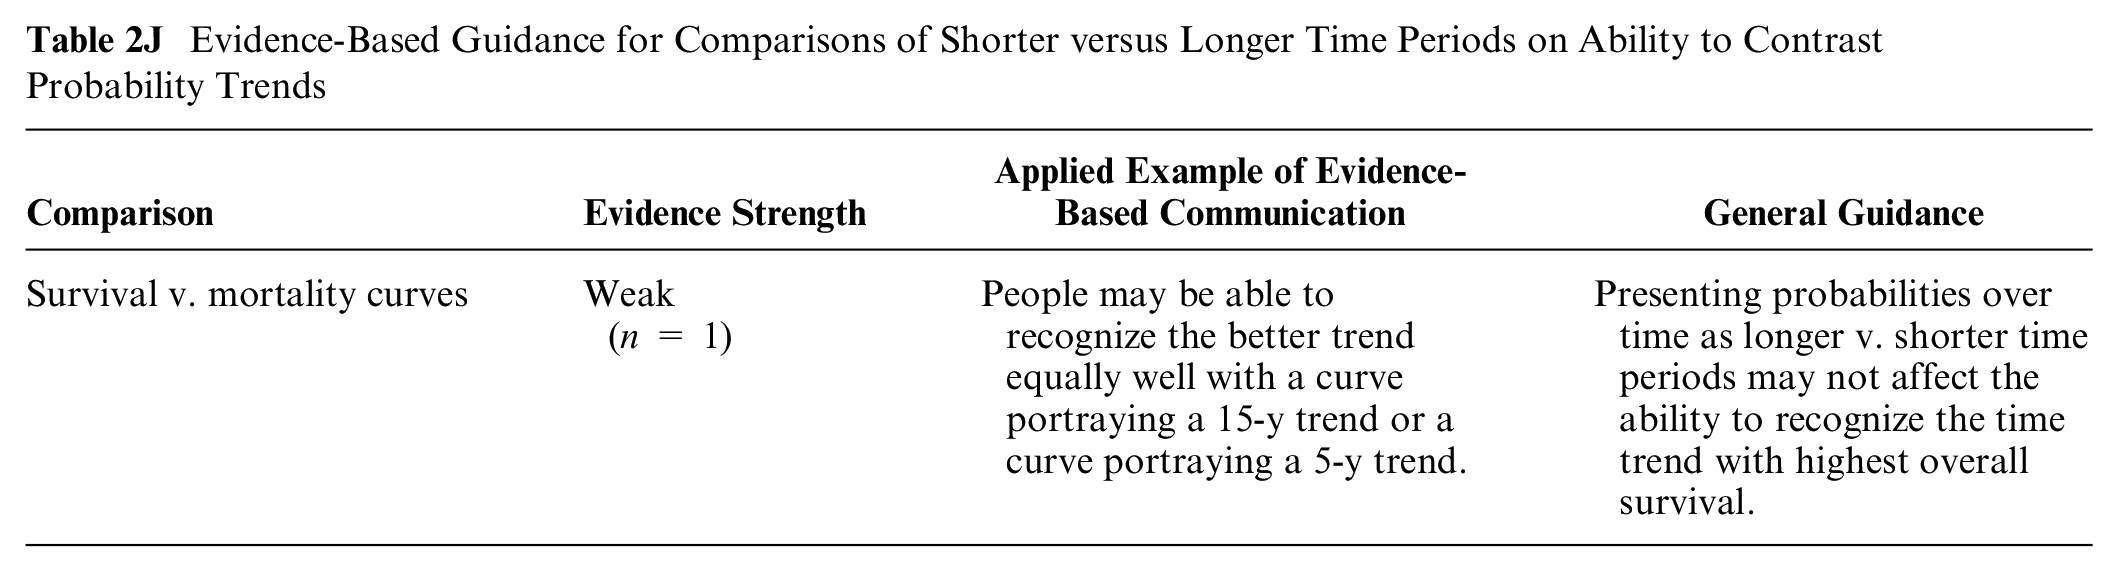
Comparisons of shorter versus longer time periods on ability to contrast probability trends (section 2J)
Zikmund-Fisher et al. 3 in a high-credibility finding showed that ability to select the time trend with the highest overall survival (for curves in which probability changed a consistent amount each year) was not affected by the time period shown (5 v. 15 y of data).
Evidence-Based Guidance for Comparisons of Shorter versus Longer Time Periods on Ability to Contrast Probability Trends
Effects of Different Probability Trend Formats on Ability to Perform Computations (Section 4)
Any outcome measure that required calculating an answer was considered a computation outcome. These included relatively simple computations such as transforming a percentage into a number per hundred as well as more complex computations such as calculating the difference between numbers of people affected at different time points.
Within this outcome, the only studies identified involved comparisons between frames (survival versus mortality).
Comparison of frames (gain, loss, and/or combination) for probability trend data on ability to perform computations on probabilities (section 4F)
One high-credibility finding from Zikmund-Fisher et al. 3 suggested that the ability to answer questions that involved computations over several time points (such as the number of people expected to die between 2 time points) was not affected by whether the data were shown as survival curves or as mortality curves.
Evidence-Based Guidance for Comparisons of Frames on Ability to Perform Computations

Effects of Different Probability Trend Formats on Perceptions of Effectiveness (Section 6)
We here focus on the perception of the effect of some variable on the probability of an outcome, in other words, the perceived difference between probabilities (e.g., the probabilities of the health event with and without a treatment). Researchers sometimes measured responses on a scale of size (e.g., how large the effect appeared on a scale of 1 to 10) and sometimes on an affective scale (e.g., how concerned the respondent felt). We considered the first of these as effectiveness perceptions and the second as effectiveness feelings. In the time-trend task literature, only effectiveness perceptions were measured, and the only format comparisons considered involved frames (survival versus mortality) and shorter versus longer time periods.
Comparison of frames (gain, loss, and/or combination) for probability trend data on perceived effectiveness (section 6F)
One high-credibility finding by Zikmund-Fisher et al. 3 demonstrated that perceived effectiveness of a drug did not differ by whether the data were graphed as pairs of survival curves or as pairs of mortality curves.
Evidence-Based Guidance for comparisons of frames on perceived effectiveness

Comparisons of shorter versus longer time periods for probability trend data on perceived effectiveness (section 6J)
One high-credibility and 1 moderate-credibility finding from different studies by Zikmund-Fisher et al.3,4 suggested that effectiveness of a drug portrayed as a pair of survival curves (in which probability changed by the same proportion each year) was in many cases perceived as smaller when only the first 5 y of data were graphed than when a full 15 y of data were graphed, and thus, the visual distance between curves grew larger. The same effect was found with mortality curves. 3 However, in one of these studies, increasing the time period failed to alter the perceived effectiveness of either drug individually (i.e., the difference between drug-treated and -untreated patients), even though it increased the perceived difference between drugs. 4 There was an interaction with framing such that the effect of the time period manipulation was smaller with mortality curves.
Evidence-Based Guidance for Comparisons of Shorter versus Longer Time Periods on Perceived Effectiveness

Effects of Different Probability Trend Formats on Health Behaviors or Behavioral Intentions (Section 7)
Relatively few probability communication studies assessed actual health behavior outcomes, so we grouped these studies with those that assessed behavioral intention. In the time-trend task literature, only behavioral intentions were assessed. The only 2 manipulations studied were numbers compared with graphics and gain-loss framing.
Comparison between numbers and graphics for probability trend data in their effects on health behaviors or intentions (section 7C)
A moderate-credibility finding by Mazur and Hickam 5 showed that intention to choose options with higher long-term survival (but lower short-term survival) was stronger when the survival probabilities were presented as pairs of survival curves rather than as series of percentages over time.
Evidence-Based Guidance for Effects of Numbers versus Graphics for Probability Trend Data on Health Behavior or Intention

Comparison of frames (gain, loss, and/or combination) for probability trend data on health behaviors or intentions (section 7F)
Armstrong et al. 6 in a moderate-credibility finding showed greater intention to choose the higher survival (and more invasive) option when the data were presented in survival curves or survival curves plus mortality curves rather than in mortality curves alone.
Evidence-Based Guidance for Comparisons of Frames for Probability Trend Data on Health Behaviors or Intentions

Effects of Different Probability Trend Formats on Preferences (Preference Outcome—Section 9)
When participants were asked to rank their preferred formats or to rate the attractiveness or helpfulness of a format, these outcomes were considered preference outcomes. In the probability time-trend literature, the only format comparison tested involved different forms of graphic displays.
Participant preference for different graphic formats for probability trend data (section 9B)
Hamstra et al., 7 in a moderate-credibility finding, found that for portraying probabilities over time, participants preferred sets of bar charts (either numerator only or part to whole) to sets of pie charts, sets of pie charts to line graphs, and line graphs to sets of icon arrays.
Evidence-Based Guidance for Participant Preference for Different Graphic Formats for Probability Trend Data
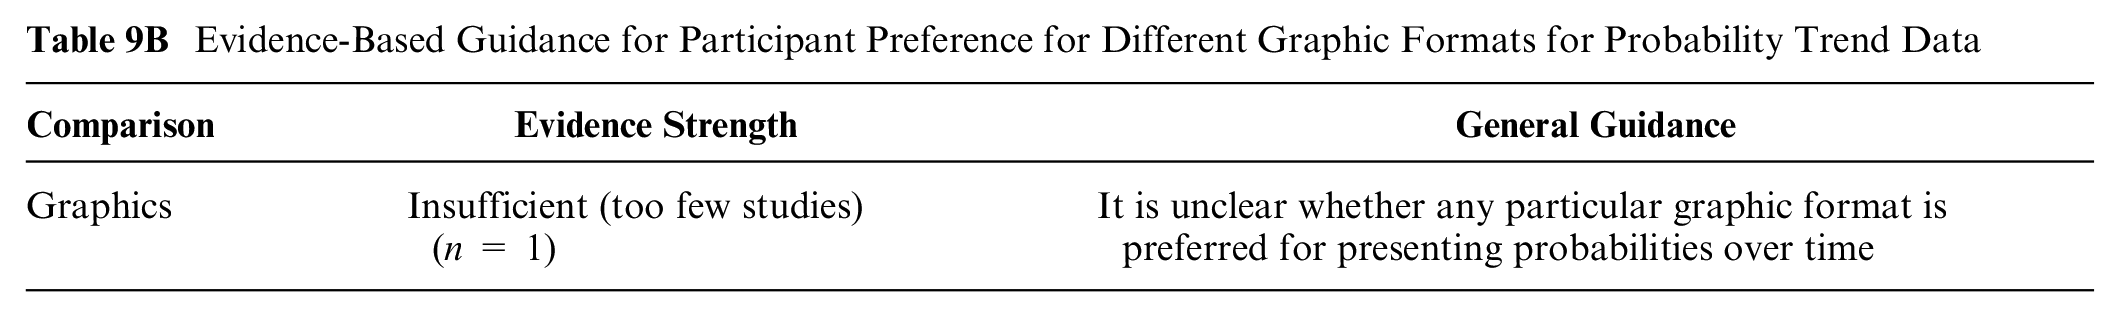
A lower-credibility finding by Hoesseini et al. 8 is not summarized due to lack of hypothesis testing and small sample size.
Effects of Different Probability Trend Formats on Ability to Distinguish between Quantities (Discrimination Outcome—Section 10)
Measures that that assessed how much people adjusted their perceptions to variations in those magnitudes were considered measures of discrimination. This measure may help determine the degree to which a format helps people derive meaningful information from probability trend data. Within this outcome, identified studies compared only presenting data over shorter versus longer time periods.
Comparisons of shorter versus longer time periods for probability trend data on discrimination (section 10J)
One moderate-credibility finding from Zikmund-Fisher et al. 4 examined the effect of graphing survival in 2 treatment groups and an untreated group over 5 y or over 15 y. The longer time period did not improve discrimination for either treatment (i.e., ability to distinguish between treated and untreated groups), but it did increase the perceived difference between treatments (ability to distinguish between them).
Evidence-Based Guidance for Comparisons of Shorter versus Longer Time Periods for Probability Trend Data on Discrimination

Summary of Evidence
The choice of using a survival or a mortality curve may not affect a) perceived differences between curves (section 6F: perceived effectiveness outcome, gain-loss framing) or b) ability to perform computations (section 4F: computation outcome, gain-loss framing).
Survival curves may make it easier to identify the curve with the highest overall survival (section 2F: contrast outcome, gain-loss framing).
Graphing probability curves over longer (rather than shorter) time durations may not affect ability to identify the curve with the highest survival (section 2J: contrast outcome, time period manipulations).
Discussion
The chance of a health event may differ over different time periods. That means providing patients with a fixed-time risk (such as the 5-y chance of cancer recurrence) may give them only part of the information that might be relevant. More granular detail can be provided in sets of numbers, tables, or graphs to illustrate the changes in chances of a positive or a negative health event over time. Such information, although complex to process, might help people make more informed decisions.
Despite the importance of this information, the Making Numbers Meaningful review identified only a few studies that directly contrasted different approaches to portraying probability data over time, and very few of these were comparable in terms of both the formats studied and the outcomes measured.
As a result, only one piece of strong evidence is available: graphing survival curves over longer periods of time—such that the visual distance between curves grows larger—will increase the perceived difference between them. For example, the advantage of one effective treatment over another less effective one will appear larger when the groups are followed over a longer time period to allow the curves to diverge. However, interestingly, a weak piece of evidence suggests that changing a graph’s time scale in this way may not help viewers determine which alternative has the highest survival.
All the remaining evidence, which is weak, pertains to switching between survival and mortality curves, a framing manipulation. It suggests that framing may not affect the perceived difference between alternatives or affect viewers’ ability to perform basic computations on the information. But choosing a survival curve (rather than a mortality curve) may make it easier for viewers to determine which therapy has the highest overall survival. Nevertheless, the weakness of these pieces of evidence suggests a certain degree of caution in relying on them to guide communication practice.
A specific limitation of the probability time-trend task evidence presented here is that most studies included focused on a particular type of trend graphic: survival or mortality curves. Other ways of describing or visualizing this information might be more effective for certain outcomes, but any novel approaches should be directly compared with survival/mortality curves before conclusions are drawn about their utility. It also may be possible to derive greater insights about optimal communication of trend data by examining the research on communicating trends in nonprobability data, such as laboratory findings, environmental exposures, or patient-reported outcomes. The validity of such analyses, however, will depend on carefully matching both the characteristics of the data presentation format and the specific outcome measured.
It is also unclear to what degree there are benefits or harms to presenting patients or other lay audiences with probability trend data (which details the chances of a specific outcome at multiple different points in time) versus summarizing the cumulative risk over a time period using a single probability (thereby only requiring patients to perform point tasks). According to our classification approach, because point tasks were cognitively different from trend tasks, they are summarized in our companion articles that cover point tasks. Also, while trend data by definition provide a higher level of detail, research by Mazur and Hickam 9 has shown that people tend to be insensitive to variations in the probabilities shown in the middle of trend lines, attending primarily to the probability level at the final time point unless additional explanation is provided. This suggests that the additional detail in the time trend may not be equally valuable to readers. It is worth noting here that because our inclusion criteria required studies to present exactly the same information in different formats, this study was excluded, as was some other time-trend literature that assessed participant responses to survival curves of high-risk therapies versus low-risk therapies (for example, half of the comparisons made in this Zikmund-Fisher study 4 were excluded from our review for this reason).
Limitations of the Making Numbers Meaningful review as a whole include the possibility of overlooked studies, reliance on a small expert group to evaluate risk of bias and credibility, and a granular data extraction process that produced narrowly segmented evidence. We did not additionally segment by variables such as numeracy or culture because of the small numbers of studies for each of these variables and because of the heterogeneity in the way they were measured. Although we searched for studies across countries and in other languages, most studies were from the United States, which may have limited generalizability.
In summary, there is limited evidence on how to present information to support time-trend tasks such as judging the pattern of change of probability over time. Few studies have compared different formats for this task, and of these, very few use comparable outcome measures. As a result, the only strong piece of evidence is that graphing curves over longer time periods will increase the perceived differences between curves. Given the importance of time-trend data to patient decision making, it is evident that much more research is needed to strengthen the evidence base.
Footnotes
Acknowledgements
We thank the Numeracy Expert Panel for contributions to conceptualizing the Making Numbers Meaningful project (Cynthia Baur, Sara Cjaza, Angela Fagerlin, Carolyn Petersen, Rima Rudd, Michael Wolf, and Steven Woloshin). We are grateful to Marianne Sharko, MD, MS, Andrew Z. Liu, MPH, and Lisa Grossman Liu, MD, PhD, for contributions to article screening and risk-of-bias assessment. We also thank Jordan Brutus for assisting with data management.
The authors declared no potential conflicts of interest with respect to the research, authorship, and/or publication of this article. The authors disclosed receipt of the following financial support for the research, authorship, and/or publication of this article: Financial support for this study was provided entirely by a grant from the National Library of Medicine (R01 LM012964, Ancker PI). The funding agreement ensured the authors’ independence in designing the study, interpreting the data, writing, and publishing the reports.
Availability of Research Resources
All research resources are available at the Making Numbers Meaningful Project at OSF (![]() ). This project includes a Methodology Files folder (containing the search strategy, the data extraction instrument, and the study risk-of-bias [S-ROB] rubric), the list of each included article mapped to the Making Numbers Meaningful review article that covers it, and a Probability Findings folder displaying the extracted findings for each of the Making Numbers Meaningful review articles.
). This project includes a Methodology Files folder (containing the search strategy, the data extraction instrument, and the study risk-of-bias [S-ROB] rubric), the list of each included article mapped to the Making Numbers Meaningful review article that covers it, and a Probability Findings folder displaying the extracted findings for each of the Making Numbers Meaningful review articles.