
Abstract
Highlights
This study found a moderate number of studies assessing strategies for evaluating sets of probabilities conveying information such as risks and benefits.
Evidence is moderate that although presenting sets of probabilities in table versus sentences may not affect behavioral intentions, people may prefer tables.
Contrary to previous studies about probability feelings, moderate evidence suggested that narratives may not affect effectiveness feelings.
Evidence was insufficient to draw conclusions regarding contrast, identification, and trust outcomes, and no studies assessed recall, categorization, computation, or discrimination outcomes.
Keywords
Many health-related decisions require considering not just 1 or 2 probabilities but sets of probabilities. For example, a recently approved Alzheimer disease drug carries a chance of benefit (modest slowing of cognitive decline) as well as a chance of serious adverse effects (brain edema or bleeding, death). 1 To make an informed decision, patients need information about both the benefits and the harms so that they can make a holistic judgment about whether to start this medication. Patient decisions become even more complicated when a patient needs to examine harms and benefits for multiple treatment options instead of just one. Patients require clear and easy-to-understand information about their options and the benefits and harms of each to make informed decisions. 2 Information about the options often includes probabilities of benefit and the probabilities of harm.
A growing body of research evidence shows that the format used to present these sets of probabilities can substantially affect perceptions and decisions. As one example, loss framing the chance of side effects as a 24% chance can make a treatment option seem less attractive than gain framing the same likelihood as 76% chance of not experiencing side effects. 1 Therefore, to develop evidence-based guidance on the effects of format for this type of quantitative information as well as other quantitative information relevant to health, the Making Numbers Meaningful project conducted a broad systematic literature review on how to communicate health-related numbers across types of data and types of data presentation formats. 3 We assumed a basic communication model in which a reader performs cognitive tasks to make sense of a stimulus, experiencing cognitive, affective, perceptual, or behavioral responses captured by researchers with outcome measures. Our focus was on the effects of stimulus formats on these outcomes.
To make sense of the evidence given the wide variety of types of stimuli and outcome measures used in studies of numerical communication, we segmented the research in several ways, using concepts from our previously published numbers communication taxonomy. 4 First, we divided the research by whether it studied the communication of probabilities (such as chance of disease) or quantities (such as lab results).
Another categorization was by the task required of the reader or research participant. A synthesis task (such as the tasks covered in the current article) is one in which the reader must use a stimulus to synthesize information about multiple features that have the same valence or different valences. Synthesis tasks can involve assessing features of a single option or assessing features of multiple options. Examples include reviewing a list of probabilities of several side effects associated with a medication, examining a table of probabilities of risks and benefits for 2 medications, and using a decision aid that presents chances of benefits and harms across several options. Other tasks, covered in other Making Numbers Meaningful articles, include point tasks (examining a stimulus for information about individual probabilities), difference tasks (using the stimulus to evaluate the difference between probabilities, such as the effect of a therapy on the chance of recovery), and trend tasks (examining the stimulus to assess a pattern of probability over time).
Within this article, we further classify the research by the outcome measures used in the studies, which helps demonstrate whether a format has different effects on different outcomes. In this article, we cover the outcomes that we found in the literature on synthesis tasks: 1) identifying and restating a probability difference presented in the stimulus (termed identification) or recalling it (termed recall); 2) identifying the largest or smallest of a set of probability differences (termed contrast); 3) perception of the size of a probability difference measured on a scale of sizes (effectiveness perception) or an affective scale about worry, concern, or another feeling (effectiveness feeling); 4) intended, selected, or planned behavior (behavioral intentions) or actual health-related actions (behavior); 5) perceived credibility of the information as presented (trust); and 6) perceived helpfulness, attractiveness, or usefulness of the data presentation format (preference). Although the first 2 of these outcomes (identification and recall) would appear to be different, we grouped them as described below because of a frequent lack of clarity in the research about which was being measured. Similarly, we grouped behavioral intention with behavior because these 2 constructs are theoretically related and very few research studies in this domain measured actual behavior.
Throughout, we cover evidence on all data presentation formats: numbers, graphics, and verbal probabilities.
As a result of this approach, the systematic review produced a series of results papers (Table A).
Current Article’s Scope within the Making Numbers Meaningful Systematic Review


This standardized numbering system has been used for results subheadings in this article and across all Making Numbers Meaningful results articles to ensure that readers can find comparable information in all articles. Gray cells represent combinations that are not possible according to the definitions presented in Ancker et al. 4
Our objective in the current results article is to present evidence about the effects of format for probability synthesis tasks. As shown in Table A and listed above, 9 outcomes were possible, but in fact, the review found only 6: identification or recall, contrast, effectiveness perceptions and feelings, behavioral intention or behavior, trust, and preference. We include evidence on all data presentation formats, including numbers, graphics, and verbal probabilities.
Methods
The Making Numbers Meaningful systematic literature review (Prospero number CRD42018086270) sought to estimate the effect of format on perceptual, affective, cognitive, or behavioral outcomes by identifying research from multiple disciplines that compared 2 or more ways of presenting health-related numbers to lay or nonmedically trained audiences. The current article is limited to health probabilities, although other articles focus on other types of information. In brief, we searched MEDLINE, Embase, CINAHL, the Cochrane Library, PsycINFO, ERIC, and ACM Digital Library and checked the tables of contents of Medical Decision Making, Patient Education and Counseling, Risk Analysis, and Journal of Health Communication. Our methods article describes the literature search, screening, risk-of-bias evaluation, data extraction, assessment of study risk of bias (S-ROB), assessment of finding credibility, and organization into evidence tables. 3 Instruments from the review, including the search strategy, the S-ROB instrument, and the data extraction instrument, are available in the methodology folder of the Making Numbers Meaningful Project at OSF (https://osf.io/rvxf2/).
We identified 316 articles for the entire project, of which 42 involved synthesis tasks with stimuli showing probability data and are covered in the current article. From each study, we extracted information about task, stimulus (data and data presentation format), and outcome. Substudies (i.e., independent research studies published in the same article) were extracted as separate records. Each study/substudy was assessed for S-ROB using a rubric adapted for this project and available at OSF (https://osf.io/rvxf2/). 3
Each study could include 1 or more tasks, format comparisons, and outcomes. In the data extraction, we called each unique combination of task, format comparison, and outcome a finding. For example, imagine a study in which readers were randomized to see probability information about medication risks and benefits in tables of either percentages or frequencies per 1,000 (which we term rates per 10n) and then asked to complete a questionnaire instrument about the information. This study might produce a synthesis task finding comparing tables of percentages versus tables of rates per 10n in their effects on the participant’s intended choice of medication (behavioral intention) and a second synthesis task finding about the participant’s preferences between formats. (If the participant was also asked to identify a specific risk or benefit probability in the table rather than evaluate the table holistically, this would result in a point task finding; point task findings do not appear in this article but would appear in another Making Numbers Meaningful article.)
Each finding was rated for credibility by 2 expert reviewers (primarily J.S.A. and B.J.Z.-F., with N.C.B. substituting in cases of conflict of interest). Reviewers assigned credibility scores holistically by considering sample size, statistical methods, face validity and comparability of the stimuli being compared, validity of the outcome measures and covariates, and S-ROB for the study from which the finding was extracted. Credibility was assigned holistically on a sale from 1 to 10 on the basis of the expert team’s evaluation of these factors, rather than according to a quantitative rubric. Credibility of findings from a study often varied. For example, the primary outcome might result in a high-credibility finding, but secondary outcomes not subjected to hypothesis testing or subset analyses with small sample size might produce low-credibility findings.
Findings were grouped by task and outcome and synthesized into guidance statements. We applied a standard rubric to grade the strength of evidence according to finding risk of bias, finding credibility, and consistency of findings. Consistency was considered high if all findings were significant in the same direction or if a large majority were significant in one direction with a few lacking in significance. Consistency was considered moderate if findings showed a small majority of significant effects in one direction with the remainder lacking significance, while consistency was considered low if the findings showed significant effects in different directions. Our standard rubric for evidence strength was:
Findings with high credibility (7 or higher on a scale of 1 to 10) and moderate credibility (4.5–6.5) are discussed below. Findings with lower credibility (4 or lower) are mentioned below and counted in Table B but do not contribute to the evidence summaries or the statements in the evidence tables.
Section Headings for Each Subset of Outcome Evidence Included in This Article and the Number of Included Findings a

—, n = 0.
There were no relevant findings for the following comparisons: larger or smaller denominators (row H) or longer or shorter time periods (row J). There were no relevant findings for the following outcomes: categorization (section 3), computation (section 4), or discrimination (section 10). (Probability Perceptions, section 5, is not possible for synthesis tasks.) The standardized numbering system in Table B has been used for the subheadings of all Making Numbers Meaningful results articles. The numbers ensure that, for example, studies of the effects of number formats on trust are always placed in a subhead labeled subsection 8A (whether or not that article contains sections 1 through 7). Our goal is to ensure that readers can use this subhead system to locate similar sections across articles.
Results
The review identified 42 articles that evaluated the effect of format on synthesis tasks. Table B shows the counts of findings for each outcome (column) and format comparison (row). Each section in the Results presents findings for 1 outcome; the sections begin with a description of the outcome, summarize the relevant high- and moderate-credibility findings in text form, and present a table of the evidence generated from the findings. As mentioned in the methods, low-credibility findings are mentioned in the text summaries but do not contribute to the evidence.
As shown in Table B, most studies on synthesis tasks focused on the outcomes of behavioral intentions (such as intention to take a medication or to choose between therapies) or preferences for format (such as whether participants found a particular format more attractive or informative than other formats).
With regard to outcomes, no studies assessed categorization, computation, or discrimination outcomes. However, these particular outcomes are not impossible. Participants could have been asked to sum the probabilities of a list of side effects (compute) or to determine whether a therapy with a list of side effects met some prespecified definition of a high-risk therapy (categorize). Participants could have been asked to make judgments about risk-benefit tradeoffs as the size of the risk or the size of the benefit was systematically varied to determine the smallest increment in probability that produced different decisions (discrimination). Regarding format comparisons, no studies examined denominator manipulations or time period variations.
The full spreadsheet of synthesis task findings cited in the current article is available at the Making Numbers Meaningful Project at OSF (https://osf.io/rvxf2/) in the Probability Findings folder.
Effects of Different Formats on Ability to Identify or Recall Information for Synthesis Tasks (Identification Outcome): Section 1
When researchers asked participants to view a stimulus and identify or restate the numbers in it, we considered that outcome to be identification. If the stimulus was removed before the participant answered the question, we considered the outcome to be recall.
Comparisons between numerical formats on the ability to identify or recall numbers (subsection 1A)
A finding by Brick et al. 5 involving a single identification question was reported only as part of a 12-item comprehension measure; it was not summarized.
Effects of Different Formats on Ability to Identify Largest or Smallest Number for Synthesis Tasks (Contrast Outcome): Section 2
A number of studies assessed comprehension in part by asking respondents to compare probabilities and identify the larger (or smaller) one. For example, one study asked participants whether the chance of benefits was larger than the chance of harms. We termed this outcome contrast.
Comparisons between numerical formats on the ability to identify largest or smallest number (subsection 2A)
PERCENTAGES VS. RATES PER 10n: A moderate-credibility finding from Waters et al. 6 showed that ability to determine which option had the lowest overall cancer risk (combining multiple risks and benefits) was higher when information was presented as percentages (such as 3%) than as rates per 10n (such as 3 in 100).
Evidence-Based Guidance for Effects of Numerical Formats on Ability to Identify Largest or Smallest Number in Synthesis Tasks.

ORDER EFFECTS: A moderate-credibility finding by Fraenkel et al. 7 found higher ability to recognize that the chance of benefits was larger than the chance of risks when benefits were presented before risks versus the reverse order.
Comparisons between graphical formats’ effect on ability to identify largest or smallest number (subsection 2B)
A moderate-credibility finding by Waters et al. 8 showed that in a description of a drug that reduced the chance of one cancer and increased the chance of another, ability to recognize that the drug reduced total probability of disease was similar with part-to-whole icon arrays (graphical displays showing a matrix of icons to represent both the numerator and denominator of a percentage) or bar charts.
Evidence-Based Guidance for Effects of Graphical Formats on Ability to Identify Largest or Smallest Number in Synthesis Tasks

Comparisons between numerical and graphical formats’ effect on the ability to identify largest or smallest sets of numbers (subsection 2C)
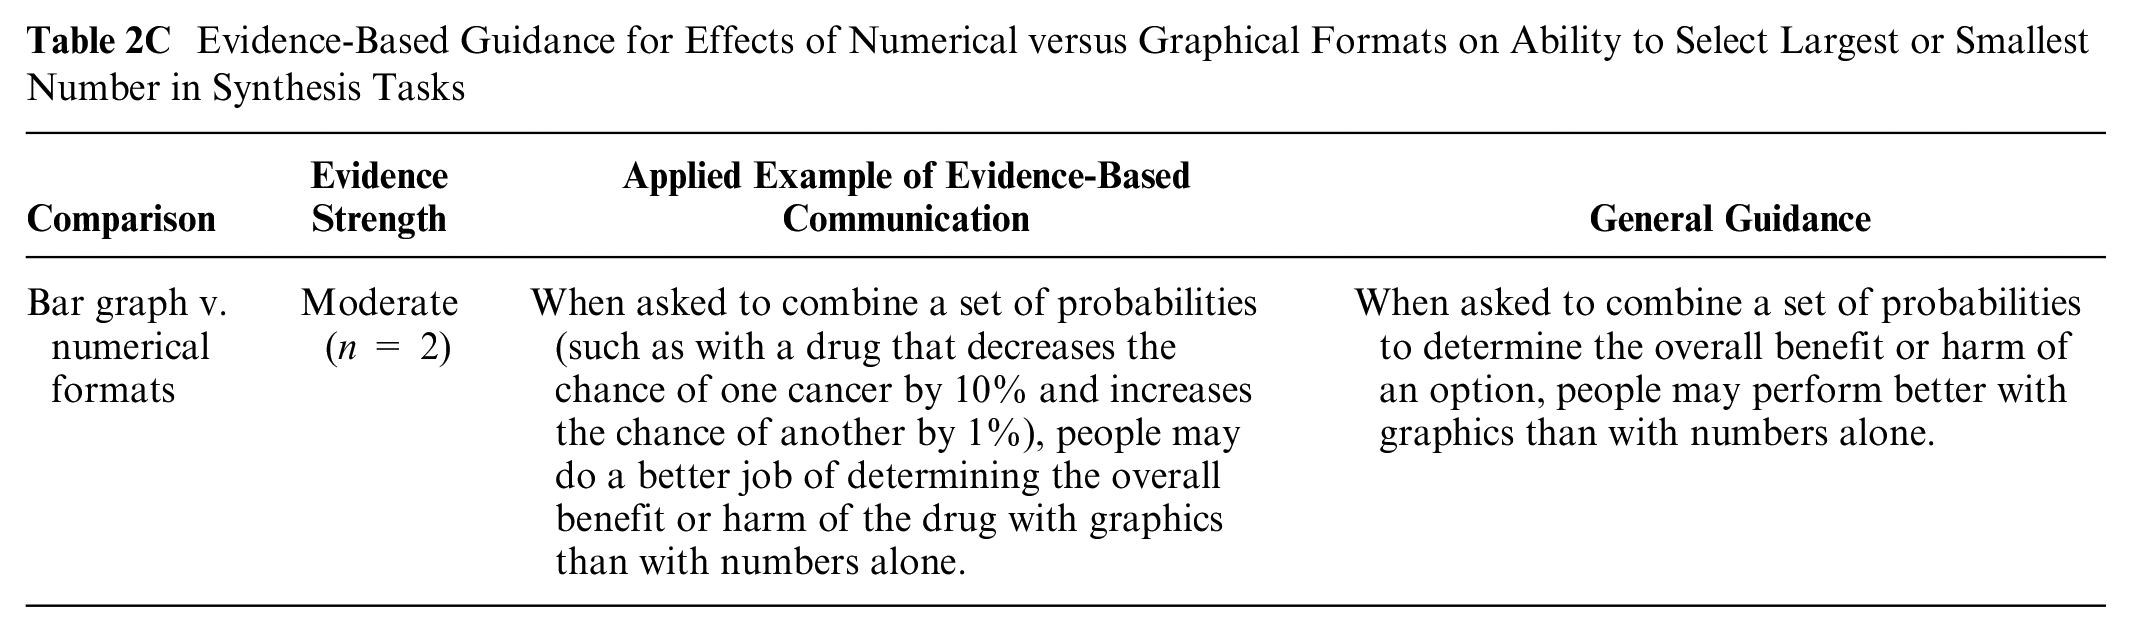
In a moderate-credibility finding, Waters et al. 6 showed that ability to determine which option had the lowest overall cancer risk (combining multiple risks and benefits) was higher when presented in a vertical bar graph than in numerical formats (either rates per 10n or percentages; moderate-credibility finding). A moderate-credibility finding from another study by Waters et al. 8 showed that in a description of a drug that reduced the chance of one cancer and increased the chance of another, ability to recognize that the drug reduced the total probability of disease was better with icon arrays than with percentages alone.
Evidence-Based Guidance for Effects of Numerical versus Graphical Formats on Ability to Select Largest or Smallest Number in Synthesis Tasks
Effects of Different Formats on Effectiveness Perceptions and Effectiveness Feelings: Section 6
When participants were asked their perception of how large or small an effect was on a quantitative scale indicating size (for example, a scale anchored at “very small” and “very large”), we considered that an effectiveness perception. If the perception was measured on a scale with affective words such as worry or concern, we considered it effectiveness feelings.
Comparisons between number formats on effectiveness perceptions and effectiveness feelings (subsection 6A)
ABSOLUTE DIFFERENCES IN RATES PER 10n WITH OR WITHOUT PERCENTAGES: Blalock et al. 9 assessed whether format affected perceptions of whether overall benefits of an intervention outweighed its risks (high-credibility finding). Benefit was formatted as either a probability difference (how many fewer people would experience the event out of 100,000) or a pair of percentages, and chances of side effects were presented as a list of rates per 100,000. No format differences were significant.
Evidence-Based Guidance for Effects of Numerical Formats on Effectiveness Perceptions and Effectiveness Feelings for Synthesis Tasks

ORDER EFFECTS: A moderate-credibility finding by Bergus et al. 10 was that perceived favorability of a low-risk–low-benefit option was higher when risks were presented before benefits (v. the reverse order), although the lack of effect in other conditions in this study somewhat reduces confidence in this finding. 10
Comparisons between numerical and verbal probabilities on effectiveness perceptions and effectiveness feelings (subsection 6D)
A moderate-credibility finding 11 found no differences in perceived relative magnitude of benefits and harms of different screening tests when presented verbally versus with common denominator rates per 10n.
Evidence-Based Guidance on Effects of Numerical versus Verbal Formats on Effectiveness Perceptions and Effectiveness Feelings in Synthesis Tasks

Effect of adding elements for context on effectiveness perceptions and effectiveness feelings (subsection 6E)
PERSONAL NARRATIVES: Both a high-credibility finding 12 and a moderate-credibility finding 11 found no difference in perceptions of benefits (risk reduction) and/or harms when statistical information was or was not accompanied by narratives.
Evidence-Based Guidance on Effects of Contextual Information on Effectiveness Perceptions and Effectiveness Feelings in Synthesis Tasks

Effects of Framing on Effectiveness Perceptions and Effectiveness Feelings (Subsection 6F)
A moderate-credibility finding 11 found no differences in perceived relative magnitude of benefits and harms of different screening tests when presented in a gain versus loss frame.
Evidence-Based Guidance on Effects of Gain-Loss Framing on Effectiveness Perceptions and Effectiveness Feelings in Synthesis Tasks

Effects of Different Formats on Behavior or Behavioral Intention: Section 7
Activities such as getting a mammogram were considered health behaviors. Intentions such as expressing an intention to get a mammogram were considered behavioral intentions. As behaviors were rarely measured in these studies, and because behavioral intention is both empirically and theoretically linked to behavior, we grouped studies of behavioral intention with the studies of behavior throughout the MNM project. In this particular summary of findings about synthesis tasks, all findings pertained to behavioral intention.
Comparisons between number formats in their effect on behavior or behavioral intention (subsection 7A)
NUMBERS IN TEXT VERSUS TABLES: Two high-credibility findings from 2 different studies by Tait et al.13,14 and a moderate-credibility finding by Brick et al. 5 all found no impact on behavioral intentions when risk and benefit probabilities (percentages or rates per 10n) were provided in sentence text or in table formats. However, 2 moderate-credibility studies (Schwartz et al. 15 substudies 1 and 2) found a higher intention to choose the lowest risk drug when risk and benefit information was presented in a drug facts box table format using both percentages and rates per 10n versus with percentages only embedded in small print text and tables. However, large differences between versions makes it possible that these effects may be due to other types of formatting differences beyond the text versus table comparison.
Evidence-Based Guidance on Effects of Numerical Formats on Behavior or Behavioral Intentions in Synthesis Tasks
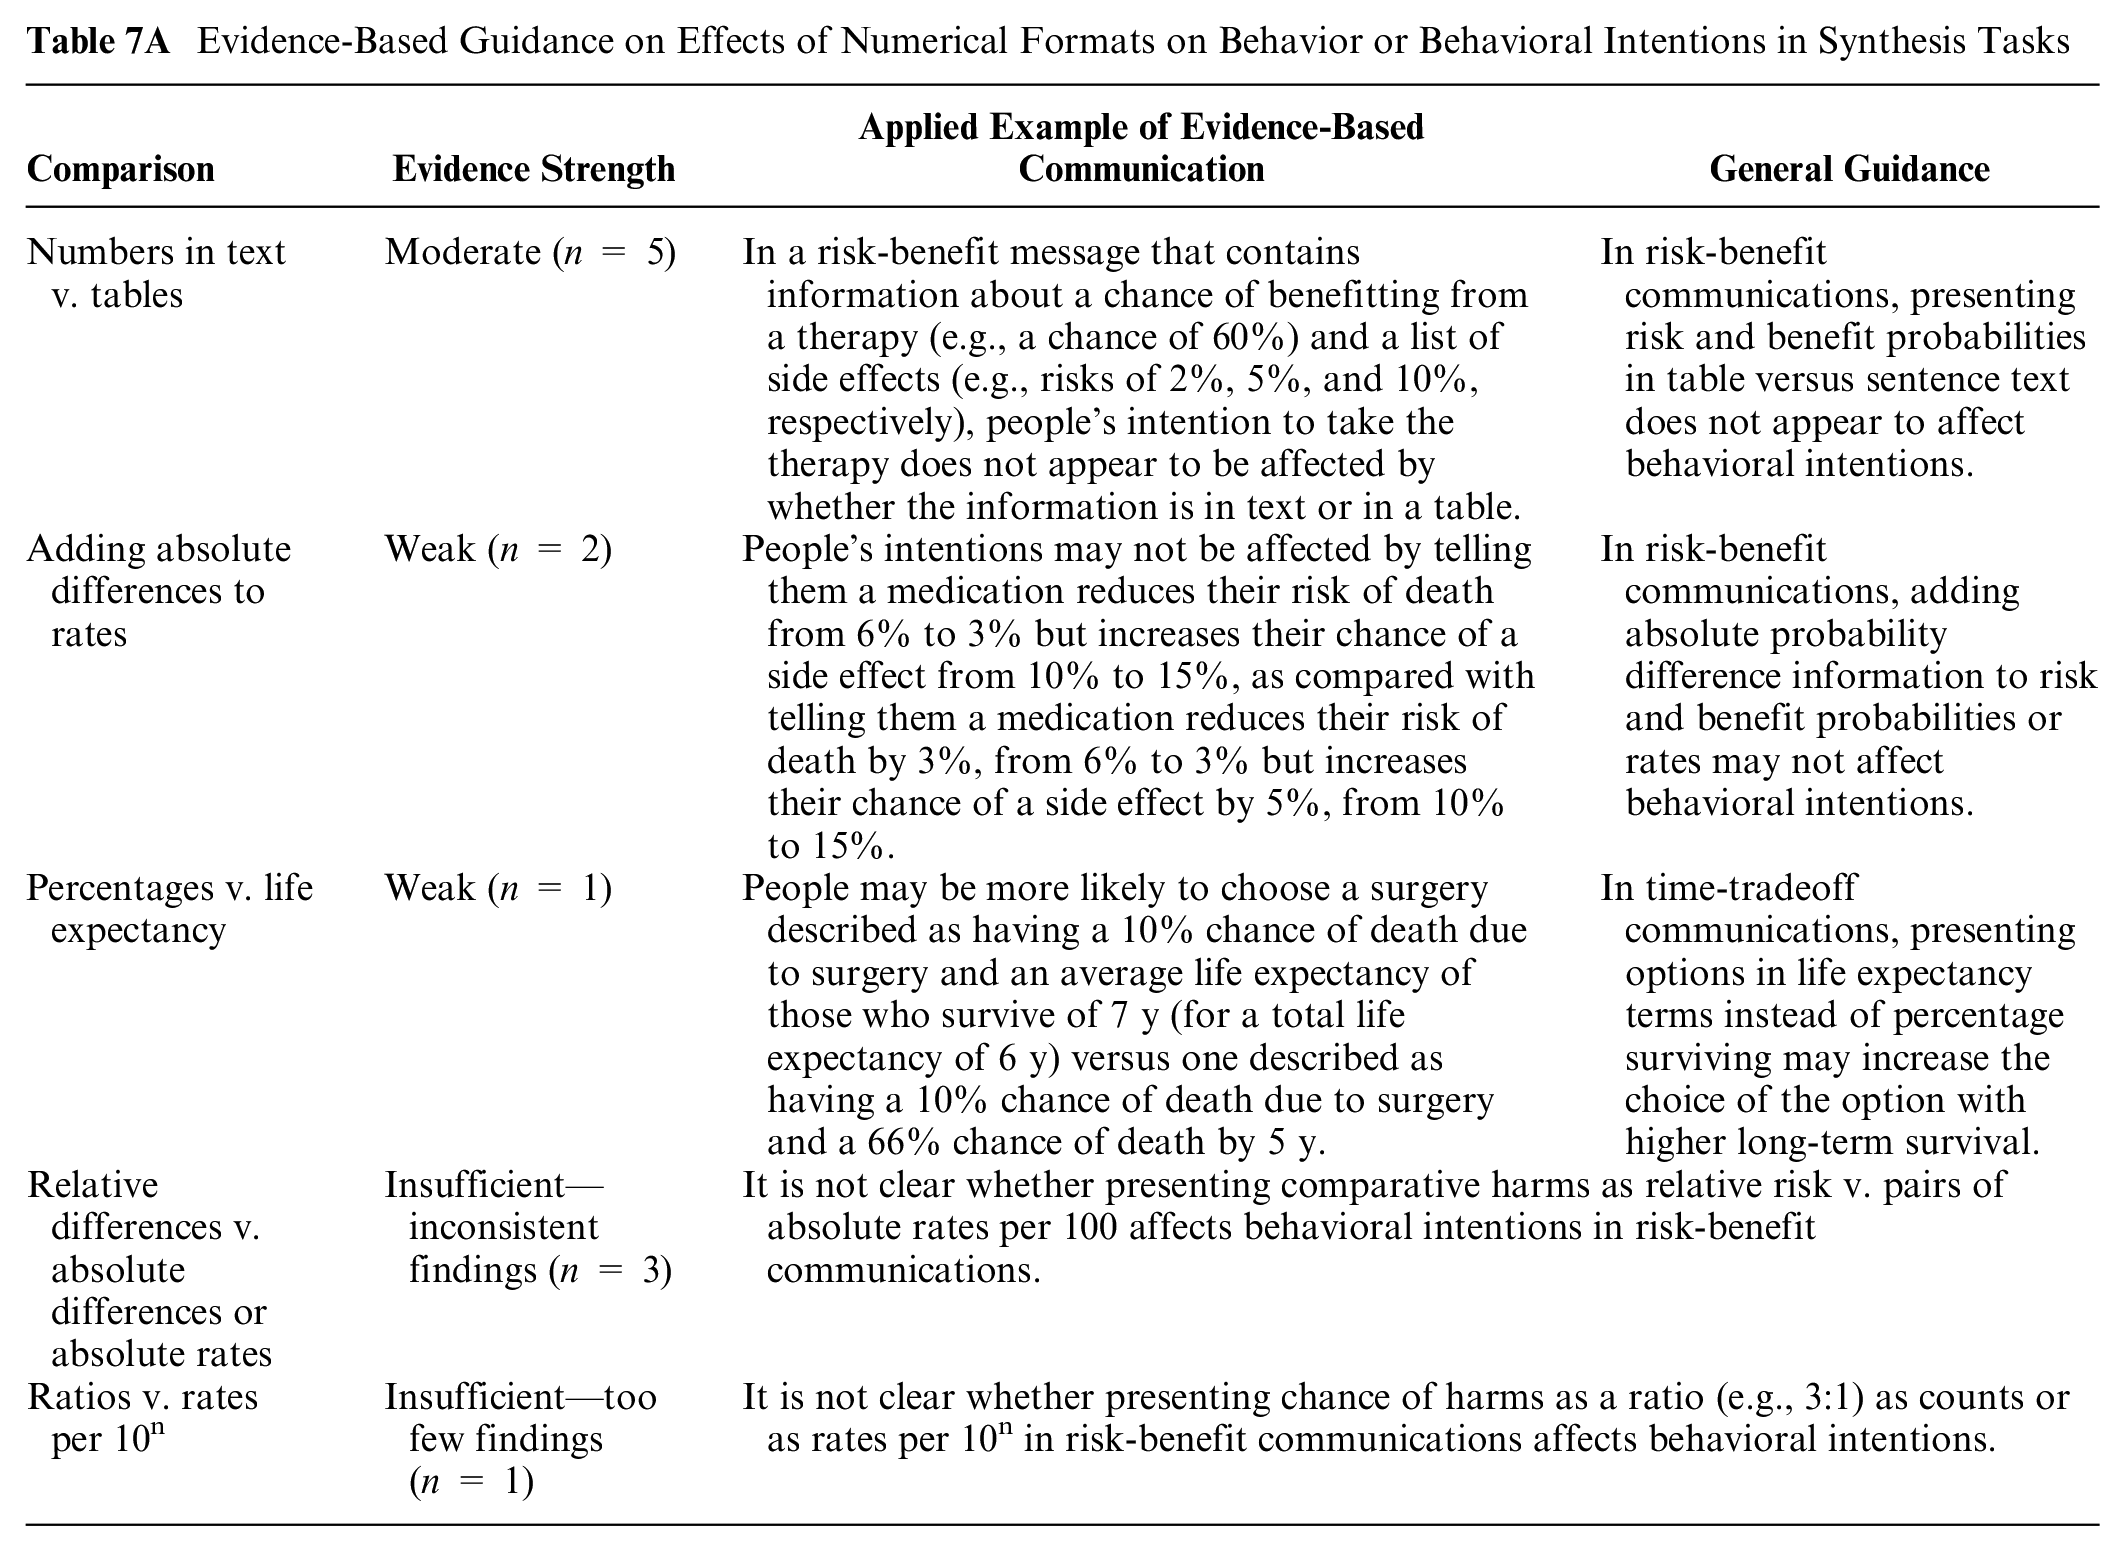
RELATIVE DIFFERENCES VERSUS ABSOLUTE DIFFERENCES OR ABSOLUTE RATES: Three findings contrasted relative versus absolute differences but used different formats for both the relative difference and the absolute rates. A moderate-credibility finding 16 found higher intention to take a risk-reducing medication when its harms were presented in rates per 10n plus icon array format instead of relative risk reduction as a percentage (e.g., reduce risk by 40%). However, the format used to present benefits did not appear to affect behavioral intentions, and the confounding of number format with the use of graphics makes interpretation of this finding difficult. Another moderate-credibility finding by Hembroff et al. 17 found higher intention to recommend a medication when risks were presented as pairs of 1-in-X versus relative risk reduction, but again, the format of benefit information did not appear to affect behavioral intentions. A third moderate-credibility finding by Miller and Holdaway 18 found that when women were given the relative risk of 2 options (e.g., cesarean birth has a mortality rate 2.5 times higher than vaginal), they were more likely to choose the riskier option than when given the absolute rate per 10n for both options (e.g., a 0.01 per 100 mortality chance for cesarean birth vs. 0.004 per 100 mortality chance for vaginal birth).
ADDING ABSOLUTE DIFFERENCES TO RATES: Two moderate-credibility findings9,19 found no effects on behavioral intentions comparing absolute rates alone versus absolute probability differences (either alone or with absolute rates).
PERCENTAGES VERSUS LIFE EXPECTANCY: In a high-credibility finding, McNeil et al. 20 studied time-tradeoff decisions and found that intent to choose the option with higher long-term survival (and lower short-term survival) was higher with a life expectancy format instead of percentage surviving.
RATIOS VERSUS RATES PER 10n: In a moderate-credibility finding communicating the chance of overdiagnosis from screening, Waller et al. 21 found lower intentions to screen when the overdiagnosis risk was presented as a ratio of overdiagnoses to lives saved (e.g., 3:1) versus as counts of number of overdiagnoses or as common-denominator rates.
Two findings were considered lower credibility and not summarized (poor reporting of details in Wegwarth et al. 22 and inconsistencies across scenarios in Bergus et al. 10 ).
Comparisons between graphic formats in effect on behavior or behavioral intention (subsection 7B)
MULTIOUTCOME VERSUS SINGLE-OUTCOME ICON ARRAYS: Two high-credibility findings (from Zikmund-Fisher et al. 23 2010 substudies 1 and 2) found higher behavioral intentions to take cancer treatment medications when part-to-whole icon arrays of survival benefits highlighted total and incremental survival outcomes than when icon arrays highlighted multiple survival and mortality outcomes. However, 2 moderate-credibility findings (from McDowell et al. 24 substudies 1 and 2) found no difference in prostate cancer screening behavioral intentions when risks and benefit tables used integrated multioutcome icon arrays versus separate single-outcome arrays.
Evidence-Based Guidance on Effects of Graphical Formats on Behavior or Behavioral Intentions in Synthesis Tasks

GROUPED VERSUS RANDOM ICON ARRAYS: A high-credibility finding 25 showed higher behavioral intention to choose a lower-risk treatment with static grouped icon arrays than with random arrays (static or animated).
GRAPHIC TYPE: In a high-credibility finding, Waters et al. 8 showed higher intention to take a cancer risk–reducing drug when benefits were presented using multioutcome part-to-whole icon arrays than as stacked bar charts. However, a moderate-credibility finding 26 found no differences in medication behavioral intentions between multiple bar chart formats, multiple pie chart formats, and part-to-whole icon arrays.
Two low-credibility findings were not summarized due to small sample sizes and competing stimuli 27 or lack of reporting details (Weinstein et al. 28 substudy 2).
Comparisons between numerical and graphical formats in effect on behavior or behavioral intention (subsection 7C)
RATES PER 10n VERSUS ICON ARRAYS: Eight findings contrasted icon array graphics and rates per 10n, with mixed results. Two high-credibility findings8,13 found increased intentions to take a risk-reducing medication when probabilities of benefits and harms were presented in icon array format. However, no differences between icon arrays and rates were found in 2 additional high-credibility findings14,26 and 4 moderate-credibility findings (Fraenkel et al., 29 Cozmuta et al., 30 McDowell et al. 24 substudies 1 and 2).
Evidence-Based Guidance on Effects of Numerical versus Graphical Formats on Behavior or Behavioral Intentions in Synthesis Tasks

RATES PER 10n VERSUS OTHER GRAPHICS: The high-credibility Hawley et al. 26 finding also showed no differences in behavioral intentions between rates per 10n and several bar chart– and pie chart–based graphical formats. Waters et al. 8 also found no differences between stacked bar charts and numbers.
1-IN-X VERSUS ICON ARRAY: In a simple high-credibility finding, 31 intention to take an influenza vaccine was higher when the chance of adverse effects was presented as a set of dots (simple icon array) than in 1-in-X frequencies (e.g., “1 in 1,000”).
PERCENTAGES VERSUS ICON ARRAYS: A complicated moderate-credibility finding 32 found higher behavioral intentions when benefits were presented as pairs of percentages and risks were presented using a verbal list without probability information, and when risks and benefits were presented in multioutcome icon arrays (without numbers) versus a flow chart graphic that included natural frequency numbers. The major differences between these formats, however, decrease confidence in both the equivalence of percentages and icon arrays and the comparisons with the flow chart format. In addition, a moderate-credibility discrete choice experiment 33 found no differences in choices when probabilities were presented as percentages alone or as percentages plus part-to-whole icon arrays.
RELATIVE RISK PERCENTAGES VERSSU ICON ARRAYS: A moderate-credibility finding 16 found higher intention to take a risk-reducing medication when its harms were presented in icon array format instead of relative risk reduction as a percentage. However, the format used to present benefits did not appear to affect behavioral intentions.
Comparisons between numerical and verbal probabilities in effect on behavior or behavioral intention (subsection 7D)
One moderate-credibility finding 11 found no difference in screening behavioral intentions when risks and benefits were presented using rates per 10n or verbal probability terms. Another moderate-credibility study suggests that in communicating the chance of false-positive/false-negative screening test results, the intention to get screened did not differ when the chance was described in 1-in-X rates or in verbal terms only. 34 Although both findings were moderate credibility, the stimuli used in the studies were quite different, suggesting only moderate consistency.
Evidence-Based Guidance on Effects of Numerical versus Verbal Probability Formats on Behavior or Behavioral Intentions in Synthesis Tasks

Effect of adding elements for context on behavior or behavioral intention (subsection 7E)
AVERAGE RISK: In communication about a risk-reducing drug that had a set of benefits (reduced chance of breast cancer) as well as side effects, a high-credibility finding showed higher intent to take the therapy when people were told that their personal risk was higher than average than when they were told it was lower than average. 35
Evidence-Based Guidance on Effects of Contextual Information on Behavior or Behavioral Intentions in Synthesis Tasks

ANECDOTES/NARRATIVES: Two moderate-credibility findings11,12 found no difference in behavioral intentions when statistical information was or was not accompanied by narratives. Similarly, a moderate credibility finding (Steinhardt and Shapiro 36 substudy 3) found no effect on time-tradeoff choices of embedding statistical information into a narrative.
ADDING QUALITATIVE DESCRIPTIVE LABELS: In a moderate-credibility finding, Sullivan et al. 19 found that intentions to take a medication were not affected by whether a table of probabilities was accompanied by labels describing which option had the higher risk for each outcome.
ADDITIONAL EXPLANATION OF TRADEOFFS: A moderate-credibility finding 30 found higher intentions to take a drug when risk information was accompanied by balance beam graphics conceptually illustrating the risk-benefit tradeoff but confounding with other elements in this study reduces confidence in this guidance.
SOCIAL NORM MANIPULATION: A moderate-credibility finding by Schwartz et al. 37 found a similar intention to screen for cancer when screening was or was not described as the default social norm.
Effects of gain-loss framing on behavior or behavioral intentions (subsection 7F)
GAIN FRAMING VERSUS LOSS FRAMING AT 1 TIME POINT: Three findings directly examined whether framing risks and benefits at a single point in time in gain frame (chance of surviving) or loss frame (chance of dying) affected behavioral intentions. Two moderate-credibility findings in 2 separate articles by Cormier O’Connor 38 and O’Connor 39 found that in communications about the chances of benefit and harm from 2 treatments, choosing the treatment with better survival (but greater toxicity) was more likely when mortality information was survival framed than when it was mortality framed. For communications of the potential benefits and harms of cancer screening, a moderate-credibility finding by Sheridan et al. 11 showed no effects of framing the chances of harm.
Evidence-Based Guidance on Effects of Gain-Loss Framing on Behavior or Behavioral Intentions in Synthesis Tasks

GAIN FRAMING VERSUS LOSS FRAMING OF SHORT- AND LONG-TERM OUTCOMES: Two findings examined framing effects in time-tradeoffs (short-term outcomes v. long-term outcomes). A high-credibility finding 20 found higher intention to choose the lower short-term survival/higher long-term survival with gain framing (percentage who live). A moderate-credibility finding (Steinhardt and Shapiro 36 substudy 3) with a similar design did not find a significant effect of framing treatment effects, but a nonsignificant trend was consistent with higher behavioral intention to avoid short-term risks when framed as percentage who die versus percentage who live.
GAIN FRAMING VERSUS COMBINATION FRAMING: Two moderate-credibility findings found higher risk-reducing behavioral intentions with gain-framed icon arrays (highlighting survival chances) than with combination-framed icon arrays (highlighting both chances of survival and chances of mortality from multiple causes); however, confounding of the framing manipulation with the multioutcome manipulation makes it less clear that the effect was solely due to framing (Zikmund-Fisher et al. 23 substudies 1 and 2). Two moderate-credibility findings in 2 separate articles by Cormier O’Connor 38 and O’Connor 39 found no effect on behavioral intentions whether survival/mortality information was gain framed or combination framed.
MIXING FRAMES: In addition, a high-credibility finding (Peng et al. 40 substudy 4) found that when gain/loss frames were combined in the same statement such that one adverse event was gain framed and the other loss framed, respondents tended to choose the option that showed better outcomes for the negatively framed event. This is consistent with an avoidance of negative-framed adverse events and greater acceptance of positive-framed adverse events.
A low-credibility finding by Llewellyn-Thomas et al. 41 is not summarized due to a very small sample.
Effect of stating or illustrating numerical uncertainty on behavior or behavioral intentions (subsection 7G)
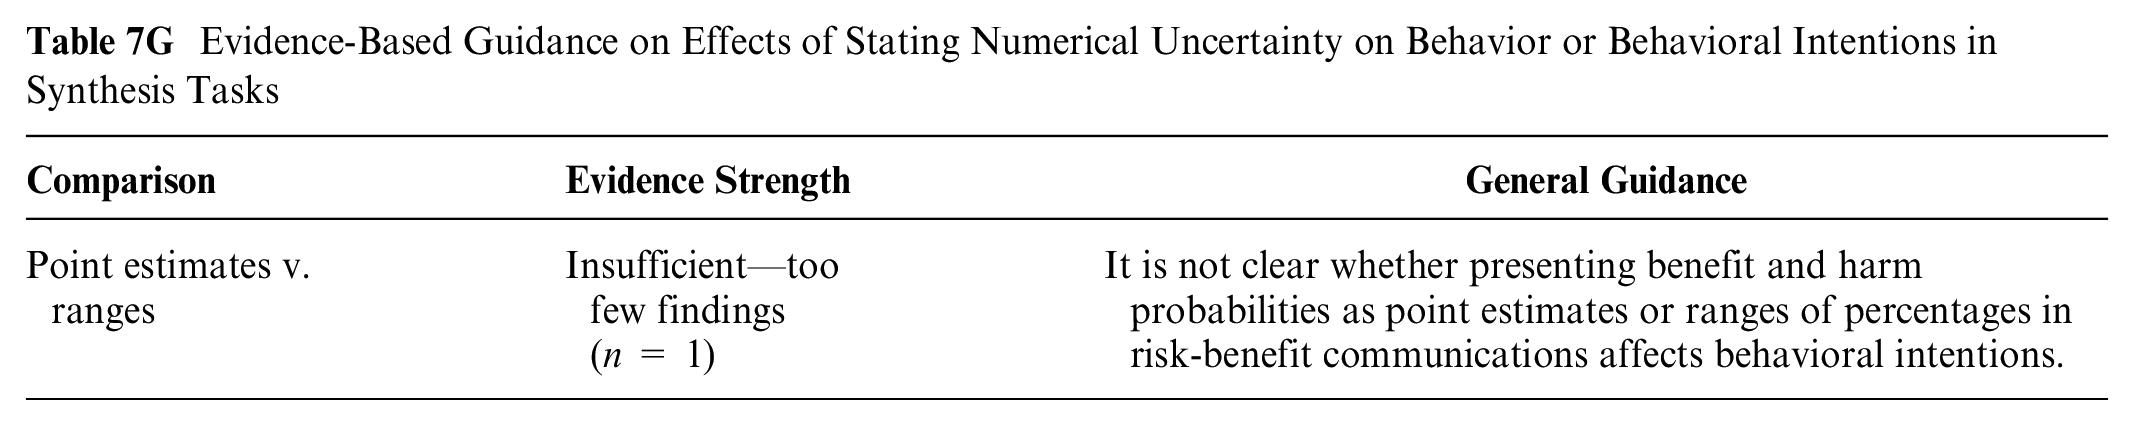
A moderate-credibility finding 42 found no effect on intent to take a medication when benefits and harms were presented as point estimate percentages or as a range of percentages.
Evidence-Based Guidance on Effects of Stating Numerical Uncertainty on Behavior or Behavioral Intentions in Synthesis Tasks
Effect of animation or interactivity on behavior or behavioral intentions (subsection 7I)
A high-credibility finding 25 found stronger intention to choose the options with lower side effect rates when people viewed static grouped icon arrays than when they saw a variety of animated displays. However, a moderate-credibility finding by Fraenkel et al. 29 found no effect on intention to screen by whether information was in a static icon array or a slideshow animation.
Evidence-Based Guidance on Effects of Animation or Interactivity on Behavior or Behavioral Intentions in Synthesis Tasks

An additional finding (Weinstein et al. 28 substudy 2) examined effects of interactivity on behavior in tradeoff situations but could not be synthesized due to lack of reporting details.
Effects of Different Formats on Trust in the Information: Section 8
Comparisons between numerical formats on trust in sets of numbers (subsection 8A)
A low-credibility finding 5 is not summarized solely because inconsistencies between the reported means and submeans, possibly due to typographic errors, made it difficult to confirm the presence or size of the effect.
Preferences for Formats (Preference Outcome): Section 9
Whenever participants were asked which format they preferred, we recorded a preference outcome. Related concepts such as perceived usefulness of a format is also included as preference.
Preferences for different number formats (subsection 9A)
NUMBERS IN TEXT VERSUS TABLES: Three high-credibility findings examined presenting benefit and harm probabilities in table formats versus in sentence text. Two5,13 found some degree of preference for table formats over numbers in sentence text, while a finding from a different Tait et al. 14 study found no difference.
Evidence-Based Guidance on Preferences for Numerical Formats in Synthesis Tasks

PERCENTAGES AND/OR RATES PER 10n: A high-credibility finding 43 found no variations in preference among tables that included percentages only, rates per 10n only (with either fixed or variable denominators), or percentages and rates per 10n.
Preferences for different graphic formats (subsection 9B)
SINGLE-OUTCOME VERSUS MULTIPLE-OUTCOME ICON ARRAYS: Two moderate-credibility findings (Zikmund-Fisher et al. 23 substudies 1 and 2) found preference for simpler icon arrays showing survival/mortality rather than more complex ones portraying several potential outcomes (e.g., cancer-specific survival/mortality as well as all-cause survival/mortality). Both types also showed incremental benefit.
Evidence-Based Guidance on Preferences for Graphical Formats in Synthesis Tasks

GROUPED VERSUS SCATTERED ICON ARRAYS: A high-credibility finding 25 found preference for grouped icon arrays (static or animated to group) versus random icon arrays (static or animated).
ICONICITY: In a moderate-credibility finding, Gaissmaier et al. 44 found no preference difference between icon array displays that varied in degree of iconicity (i.e., their abstractness v. concreteness).
COMPARING GRAPHICAL FORMATS: In a moderate-credibility finding that compared different graphic formats, Tait et al. 45 found both icon arrays and bar charts preferred to pie charts or number tables.
Preferences for numerical versus graphical formats (subsection 9C)
Evidence about preference for numbers versus graphics in showing risk tradeoffs is limited both by the few studies specifically looking at risk tradeoffs and by the fact that the studies in this category often evaluated different sorts of graphics and numbers. Mixed findings are probably because of important differences in the types of graphics used, as well as in what kind of meaning people needed to take away from the communication.
Evidence-Based Guidance on preferences for Numerical versus Graphical Formats in Synthesis Tasks

In a high-credibility finding, Veldwijk et al. 46 found that participants in a discrete choice experiment preferred presentations of choice options using numbers (percentages or 1 in X) over numbers plus icon arrays. Also, a high-credibility finding by Tait et al. 13 found a preference for numbers in tables over icon arrays.
However, a very similar high-credibility finding from the same team 14 found the reverse: a preference for icon arrays over tables or numbers in sentence text. In addition, a moderate-credibility finding in another Tait et al. 45 study found that icon arrays or bar charts were preferred over pie charts or numbers (percentages plus rates per 10n). A final moderate-credibility finding by Gaissmaier et al. 44 found no preference differences between rates per 10n and icon arrays that varied in their degree of iconicity (i.e., abstractness v. concreteness).
Preferences for gain-loss framing (subsection 9F)
Two large-sample, moderate-credibility findings (Zikmund-Fisher et al. 23 substudies 1 and 2) found that women preferred simpler gain-framed (survival only) icon arrays over more complex combination framed (survival + mortality) icon arrays in showing effect of treatment. However, the fact that the combination-framed displays included more types of information raises questions about whether the framing caused this effect.
Evidence-Based Guidance on Preferences for Framing in Synthesis Tasks

Preferences for animation or interactivity (subsection 9I)
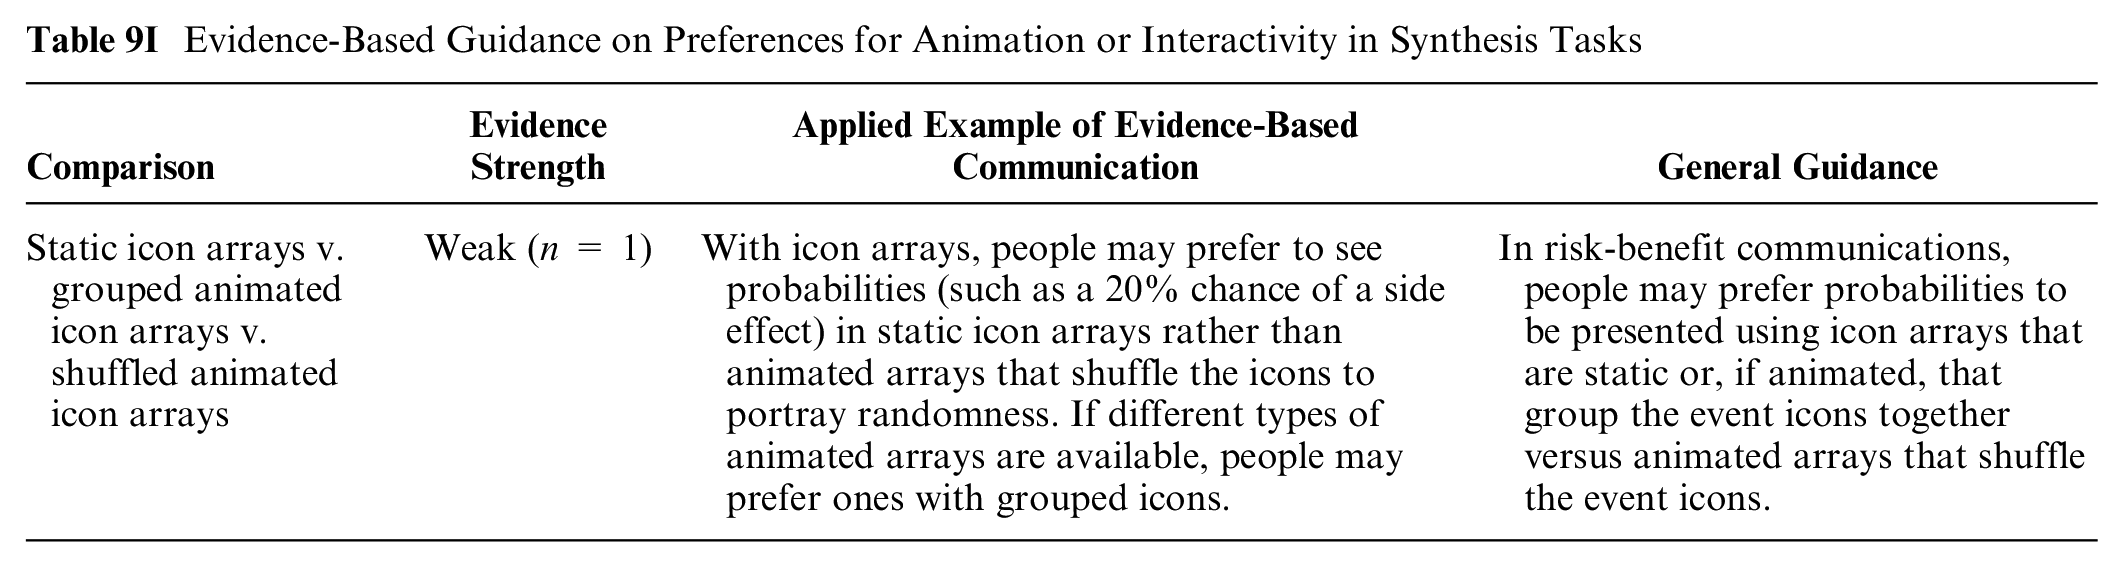
A high-credibility finding from Zikmund-Fisher et al. 25 found preference for static grouped arrays or animated arrays that group icons over animated displays that shuffle icons (either automatically or on demand).
Evidence-Based Guidance on Preferences for Animation or Interactivity in Synthesis Tasks
Summary of Evidence
This synthesis task review found no strong evidence but uncovered multiple pieces of moderate evidence as well as many weak evidence findings.
Moderate evidence for risk-benefit synthesis communications includes the following:
Presenting sets of risk and benefit probabilities in tables versus sentences does not seem to affect behavioral intentions (section 7A). However, people seem to prefer numbers in table format as opposed to in a sentence (section 9A).
Effectiveness feelings do not seem to be affected by whether or not narratives (e.g., personal experiences) are provided (section 6E).
Weak evidence regarding behavioral intentions for risk-benefit synthesis communications suggests the following:
Presenting benefits as a single-outcome icon arrays instead of a multioutcome icon array may increase behavioral intentions (section 7B).
Presenting adverse events as an icon array instead of 1-in-X numbers may increase behavioral intentions (section 7C).
In time-tradeoff communications, presenting options in life expectancy terms instead of percentage surviving may increase the choice of the option with higher long-term survival, while gain framing instead of loss framing may lead people to choose options with lower short-term survival but higher long-term survival (section 7F).
Framing benefits of interventions using gain frame only rather than loss frame or combination (gain plus loss) framing only may increase intentions to choose the intervention, while using mixed frames to describe harms of interventions may tend to lead people to choose the option that has the lowest chance of the negatively framed (loss-framed) outcome (section 7F).
Presenting treatment options in grouped icon arrays as opposed to random may increase intentions to select lower-risk treatment options (section 7B).
Providing average risk information showing someone is above-average risk may increase intentions to engage in risk-reducing behaviors (section 7E).
Behavioral intentions may not be affected by 1) adding absolute probability to risk/benefit rates (section 7A), 2) presenting tradeoffs in bar charts versus pie charts (Section 7B), or 3) including narratives or anecdotes (section 7F)
Weak evidence on other outcomes related to synthesis tasks:
In risk-benefit synthesis communications, people may tend to prefer gain-framed versus combination-framed icon arrays (sections 9B and 9F).
People may prefer grouped (static or animated) versus random (static or animated) icon arrays (sections 9B and 9I).
There may not be preference differences between risk-benefit synthesis communications using percentages or common-denominator rates per 10n (section 9A).
Adding pairs of percentages (i.e., chance of outcome with and without treatment) to an absolute difference as a rate per 10n as part of risk-benefit synthesis communications may not affect effectiveness feelings (section 6A).
Discussion
This article summarizes the available research involving probability synthesis tasks, in which readers evaluate and make decisions about sets of probabilities, such as the risks and benefits of a medical intervention or the set of side effects for a medication. Synthesis tasks are inherently more complex than point tasks (which focus on single probabilities) and difference tasks are (involving pairs of probabilities or differences between probabilities), because readers must consider probability across multiple features, which may also differ in severity (for harms) or benefit (for benefits). The available synthesis task studies focused heavily on behavioral intention outcomes (61 findings) with a smaller number evaluating format preferences (17 findings), both of which involve holistic evaluation of the set of probability information. Only a few findings assessed effectiveness perceptions and/or feelings (6 findings), here measuring overall perceptions across multiple risks/benefits rather than a single pairwise comparison. We are only able to present insufficient findings regarding contrast, identification, and trust outcomes, and no studies evaluated recall, categorization, computation, or discrimination outcomes.
A plurality of findings compared 2 or more numerical formats (24 findings) with a relatively balanced numbers of findings comparing numbers and graphics (21 findings), graphics alone (15 findings), effects of gain-loss framing (14 findings), and impact of providing context (7 findings). There were fewer findings related to comparisons of numeric and verbal probabilities, representations of uncertainty, and the effect of animation or interactivity.
The available evidence for synthesis tasks provides little in the way of clear guidance for practice. People appear to prefer tabular presentations over data presented in sentences when performing synthesis tasks, and doing so does not appear to affect behavioral intentions, so there may be little reason not to prioritize tabular approaches. Conversely, while narratives did not affect overall effectiveness perceptions and may not affect behavioral intentions in the synthesis task evidence we reviewed here, our review of evidence related to difference tasks 47 did find that narratives can strongly influence behavioral intentions for those sorts of tasks. As a result, communicators will need to consider carefully what tasks their patients or readers need to do in order to decide how to balance these differing conclusions. Many of the weak evidence findings listed here derive from either small numbers of studies or single high-credibility studies, and future research may either strengthen or contradict these conclusions.
Like other articles in the Making Numbers Meaningful review, we are limited by the possibility of missing studies, using a small group of experts to determine risk of bias and credibility, and a very granular data extraction process that results in specific and yet narrow evidence. Although our approach focuses on ensuring that studies are compared only with very similar studies, it also separates research findings across different tasks and outcomes, and these tasks and outcomes may all be relevant in evaluating the pros and cons of different number formats. We were also unable to evaluate the effect of differences in presentation formats based on variables such as numeracy or culture due to small numbers of studies for each of these variables and because of inconsistencies in how they were measured.
In conclusion, most evidence regarding synthesis tasks pertained to behavioral intention and preference outcomes, which makes sense given that these outcomes are holistic evaluations of the full set of information provided, not just 1 or 2 numbers. It is notable, however, that we did not derive any strong evidence (only moderate or weak), and the moderate evidence suggested a lack of effect of tabular presentations and narratives on behavioral intentions. Such evidence of noneffects is important, as many decision aids seek to help patients determine the best treatment option for themselves, not to persuade toward a particular course (e.g., induce intention or feelings of effectiveness). We also found moderate and weak evidence regarding format preferences, but as in other articles in this review, we urge caution in making presentation format decisions based solely on preference, as it may be confounded with other measures that allow people to objectively evaluate information (e.g., contrast, categorization).
It is important to note that data presentations that can be used for synthesis tasks (such as tables of risk and benefit probabilities) can also be used for point and difference tasks (such as recall of single probabilities, contrasts of 2 probabilities, or effectiveness perceptions based on a pair of probabilities). Designers of such communications, therefore, need to consider not only the evidence presented here but also the evidence regarding the effects of different communication formats on point and difference tasks.47–50 Such integrative analyses are a natural extension of the present research, and we strongly encourage the development of such multilevel guidance for communications practitioners.
Footnotes
Acknowledgements
We thank the Numeracy Expert Panel for contributions to conceptualizing the MNM project (Cynthia Baur, Sara Cjaza, Angela Fagerlin, Carolyn Petersen, Rima Rudd, Michael Wolf, and Steven Woloshin). We are grateful to Marianne Sharko, MD, MS, Andrew Z. Liu, MPH, and Lisa Grossman Liu, MD, PhD, for contributions to article screening and risk of bias assessment. We also thank Jordan Brutus for assisting with data management.
The authors declared no potential conflicts of interest with respect to the research, authorship, and/or publication of this article. The authors disclosed receipt of the following financial support for the research, authorship, and/or publication of this article: Financial support for this study was provided entirely by a grant from the National Library of Medicine (R01 LM012964, Ancker PI). The funding agreement ensured the authors’ independence in designing the study, interpreting the data, writing, and publishing the reports.
Availability of Research Resources
All research resources are available at the Making Numbers Meaningful Project at OSF (![]() ). This project includes a Methodology Files folder (containing the search strategy, the data extraction instrument, and the study risk of bias [S-ROB] rubric), the list of each included article mapped to the Making Numbers Meaningful review article that covers it, and a Probability Findings folder displaying the extracted findings for each of the Making Numbers Meaningful review articles.
). This project includes a Methodology Files folder (containing the search strategy, the data extraction instrument, and the study risk of bias [S-ROB] rubric), the list of each included article mapped to the Making Numbers Meaningful review article that covers it, and a Probability Findings folder displaying the extracted findings for each of the Making Numbers Meaningful review articles.