
Abstract
We discuss a decision-theoretic approach to building a panel-based, preemptive genotyping program. The method is based on findings that a large percentage of patients are prescribed medications that are known to have pharmacogenetic associations, and over time, a substantial proportion are prescribed additional such medication. Preemptive genotyping facilitates genotype-guided therapy at the time medications are prescribed; panel-based testing allows providers to reuse previously collected genetic data when a new indication arises. Because it is cost-prohibitive to conduct panel-based genotyping on all patients, we describe a three-step approach to identify patients with the highest anticipated benefit. First, we construct prediction models to estimate the risk of being prescribed one of the target medications using readily available clinical data. Second, we use literature-based estimates of adverse event rates, variant allele frequencies, secular death rates, and costs to construct a discrete event simulation that estimates the expected benefit of having an individual’s genetic data in the electronic health record after an indication has occurred. Finally, we combine medication prescription risk with expected benefit of genotyping once a medication is indicated to calculate the expected benefit of preemptive genotyping. For each patient-clinic visit, we calculate this expected benefit across a range of medications and select patients with the highest expected benefit overall. We build a proof of concept implementation using a cohort of patients from a single academic medical center observed from July 2010 through December 2012. We then apply the results of our modeling strategy to show the extent to which we can improve clinical and economic outcomes in a cohort observed from January 2013 through December 2015.
Keywords
It is well known that genetic variation can influence patients’ responsiveness to medications and risk for toxicity, 1 and more than 250 genetic variants have accumulated within Food and Drug Administration (FDA) medication label inserts. 2 Over the past 10 years, the popularity of acquiring pharmacogenomic (PGx) data to guide prescribing has increased significantly, driven by dramatic reductions in the cost of the technology and accumulating evidence for clinical utility. Many insurers, institutions, and organizations are developing programs to preemptively test their populations for genetic variants, expecting that clinical value and return on investment will be accrued as the information is used for delivering care. Previously, we estimated that over a 5-year timeframe (2005–2010), in a medical home population at our institution approximately 65% of patients were prescribed at least one medication with an FDA label insert and 23% of patients were prescribed at least three such medications.3,4 Preemptive genotyping allows physicians to proactively apply genetic data at the time of prescribing, and multiplexing (with a panel that contains hundreds to thousands of relevant genetic variants) permits cost efficiencies when genetic data are reused, that is, for the second, third, and so on, PGx-guided therapy. 4
Given the large and growing number of PGx opportunities, strategies to identify and test populations to maximize the potential value of genomic testing are needed. As of now, it is cost-prohibitive to genotype all patients in a population of a health system, regardless of clinical need. We recently described an approach to identify patients for panel-based, preemptive genotyping that was founded on the clinical risk of developing an indication for one of the targeted medications. 5 Briefly, we identified eligible patients by estimating risk of being prescribed any of three medications with known PGx effects (statin, warfarin, or an antiplatelet) within 3 years of patients’“medical home” date. 5 We constructed a single risk prediction model, and we made genotyping decisions based on whether or not the risk estimate exceeded a predefined cutoff value. This decision approach was then implemented within the Pharmacogenomic Resource for Enhanced Decisions in Care and Treatment (PREDICT) program, a clinical quality improvement initiative at Vanderbilt University Medical Center (VUMC). 6 The program incorporated genetic information into the electronic health record (EHR) and, when appropriate, permitted genotype-guided prescribing.6–8 Thus far, almost 15,000 patients have been genotyped since 2010 as a part of routine care.
In this article, we extend this previous work to formalize a value-based approach that incorporates the magnitude, severity, and cost of the adverse drug reaction averted by pharmacogenetics. Specifically, we detail 1) predictive modeling approaches using readily available clinical data from an EHR to capture patient-level risk of being prescribed each PGx medication separately; 2) a discrete event simulation that uses literature-based estimates of variant allele frequencies, adverse event rates, and secular death rates to estimate the cost and quality-adjusted life year (QALY) benefit of genotype-guided therapy after an indication occurs; and 3) a decision-theoretic approach to combine points (1) and (2) to develop genotyping rules that optimizes preemptive genotyping value based on user defined utility functions.
Methods
The data for this value-based, preemptive genotyping program proof of concept were derived from EHRs from VUMC.
Predicting PGx Medication Prescriptions
In the next several subsections, we detail an approach to using readily available clinical data from the VUMC EHR to estimate risk of being prescribed an antiplatelet medication following a percutaneous coronary intervention (PCI), a statin, and warfarin, and to validate the models. We focus on antiplatelet medication following a PCI (e.g., a coronary stent) due to the availability of compelling evidence of genetic testing efficacy as compared to other indications for antiplatelets where the benefit is less clear.9,10
Study Cohorts
We included patients with records in the Vanderbilt Synthetic Derivative (SD) 11 and with VUMC established as their “medical home” (MH). We considered patients to have a VUMC MH when we observed, for the first time, the third distinct visit within a 2-year timeframe to primary care and specialty medical and surgical clinics delivering non-acute care. Patients were required to be 18 years old on the MH date, and for each medication considered, they must have had no observed history of receiving the medication (medication naïve on the MH date). Those who satisfy MH criteria for the first time between July 2010 and December 2012 comprise the training cohort, and those who satisfy the criteria between January 2013 and December 2015 comprise the validation cohort. For the purpose of modeling, baseline characteristics were established on the MH date and were updated longitudinally on each patient as clinical data accumulated.
Data Preparation
For the purpose of modeling, we included independent variables that were readily available in the EHR including patient demographics (age, sex, race, body mass index), vitals (diastolic and systolic blood pressure), history of chronic medical conditions defined based on ICD-9 codes (hypertension, type 2 diabetes, coronary artery disease, atrial fibrillation, atherosclerosis, congestive heart failure, dialysis, and cerebrovascular disease), other medication history (e.g., if modeling statin prescriptions, then include history of antiplatelet and warfarin prescriptions), history of acute cardiovascular events (acute coronary syndrome, coronary catheterization with revascularization, or coronary artery bypass grafting), number of clinic visits in the past 6 months (number of cardiology clinic and non-cardiology clinic visits), and laboratory data (low-density lipoprotein, high-density lipoprotein, triglycerides, HgbA1C, and creatinine).
Since physician-based prescribing decisions rely on patient observation and what is available in the EHR, we used the most recently observed weight and lab data at each visit when not observed at the current visit. When, according to the EHR, lab values (e.g., HgbA1C) had yet to be observed in an individual, we assigned a value within the normal range reflecting our belief that if no lab test was ordered, the physician was effectively assuming a normal value or was not concerned about its value. In addition to observed or imputed lab values, we included indicators (yes/no) of whether the lab test was performed. As the goal of our preemptive genotyping program was to focus on outpatient visit opportunities to identify patients suitable for preemptive genotyping, we updated patient data, at most, once every 6 months.
Modeling Strategy
Since patients were observed for variable amounts of time and were administratively censored due to the timing of data acquisition, we used survival analysis approaches to model, separately, time to antiplatelet therapy following placement of a coronary stent, statin drug initiation, and warfarin prescription. Because we had multiple measurements per subject and we sought to predict future prescriptions from the time of each clinic visit, we employed a partly conditional survival model 12 for longitudinal data and we used a residual survival time scale outcome.12,13 For estimation we implemented time-varying, Cox proportional hazard models 14 with robust, sandwich standard error estimates 15 and random survival forests. 16
Cox proportional hazard model
We developed time-dependent Cox proportional hazard models12,15 using two strategies: one that does and one that does not include independent variable interactions. First, we built a Cox model with all 28 predictors described previously. For all continuous variables, we used restricted cubic splines with 5 knots specified at the 5th, 25th, 50th, 75th, and 95th percentiles to allow for nonlinear associations. In total, this modeling approach estimated 53 parameters for each of the three outcome models. Next, we sought to add two-way interactions. Since it is difficult to detect interactions between correlated variables and with very rare variables, we added interactions with the following approach. First, we conducted a hierarchical cluster analysis17,18 to identify uncorrelated clusters of variables after excluding binary variables with prevalence less than 0.05. We then performed principle component analysis, computed the first principle component for each cluster, and added all pairwise interactions among the principle components to the Cox models.19–21 For the antiplatelet, statin, and warfarin models we estimated 182, 166, and 124 parameters, respectively, across all main effects and interactions. The difference in the number of parameters estimated for each outcome is due to the difference in the patients included in the analyses. Subjects included in each medication model were required to be naïve to the medication at the MH date, and so sample sizes for the three models differed (though there is much overlap). In total, for the 2010 to 2012 training cohort, 74,607, 45,532, and 75,795 unique patients contributed longitudinal data to the antiplatelet, statin, and warfarin models, respectively. For the 2013 to 2015 validation cohort, 52,588, 34,373, and 54,495 patients contributed data.
Random survival forests
Random survival forests (RSF) 16 are a popular, ensemble-based, machine-learning algorithm for variable selection and risk prediction that naturally includes high dimensional interactions, and that reduces model overfitting and prediction bias by averaging across a number of individual trees. When constructing our final models, we conducted a thorough grid search for all common tuning parameters, and in Appendix I, we show the extent to which predictive model summaries depend on the tuning parameters: number of trees in the forest (ntree) and the average number of observations in terminal nodes (nodesize). Based on a grid search, we found that tuning parameters, number of candidate predictors randomly selected at each split (mtry) of a tree, and the maximum number of splits for continuous variables (nsplit) had a smaller impact on predictive model performance. We set mtry = 5 (i.e., approximately equal to the commonly used square root of the number of independent variables) and nsplit = 10. In Appendix I (Tables A1.1 and A1.2), we show C-Indices for the training data, the out-of-bag samples, and the validation data, and in Figure A1.1, we include calibration curves based on applying the RSFs constructed with the training data but applied to the validation data. When evaluating the performance of RSFs we chose ntree = 500 for all medications, and nodesize = 5 for statins and nodesize = 25 for antiplatelets and warfarin, respectively. When making these decisions, we balanced model calibration, the standard deviation of the predictive distribution (with larger values being better), and the C-Index.
Model Evaluation
We constructed the Cox models and RSFs using nonparametric bootstrap samples from the 2010–2012 cohort. We then evaluated each of the models using the out of bag samples from the 2010–2012 cohort and the independent 2013–2015 cohort. In this article, we focus exclusively on evaluation of performance on the 2013–2015 cohort. We examined model calibration and predictive distributions graphically and captured discrimination with the C-index 21 at 2 years following each clinic visit. All analyses were performed using the R programming language 3.3.0 (R Foundation for Statistical Computing, Vienna, Austria) with rms, 22 randomForestSRC,16,23,24 and survivalROC 25 libraries.
Calculating the Value of Genotyping Using Discrete Event Simulation
To estimate the incremental value of genotype tailored therapy over standard prescribing, we defined four distinct utility functions that represent different approaches to summarizing adverse outcomes, costs of treatment for adverse outcomes, and costs of testing. Let
To calculate expected benefits for each utility function by medication combination, we appeal to discrete event simulation (DES) methods.27–30 As described in detail in previously published work 31 and using parameters shown in Appendix II, the underlying DES jointly models the prescription incidence, health, and mortality outcomes among patients prescribed antiplatelet therapy, a statin, or warfarin. The demographic profile of the simulated patient population was matched to the VUMC MH population based on age and gender. The model assumes the health sector perspective and incorporates medical costs, pharmaceutical costs, and clinical outcomes based on prior randomized trials and on previous cost-effectiveness studies of antiplatelet therapy, simvastatin, and warfarin. The DES compared a base case scenario under which no genetic testing is used to guide therapeutic decisions to a genotype-tailored scenario under which a genetic test is ordered and acted upon when appropriate. For our DES model outcomes, we consider a 1-year timeframe after medication prescriptions, as the differential impact of genotype-tailored therapy versus standard therapy on AEs is concentrated within the year after initiating therapy.
Decision Analysis for Genotyping
The benefits of genotyping differ according to medications and indications, with genotype-tailored therapy for certain “high-yield” drug-gene pairs shown to have a higher net monetary benefit as compared with other drug-gene pairs. 31 Thus, a naïve approach to the preemptive genotyping decision (i.e., whom to genotype) that simply averages predicted risks across PGx medications into a single summary risk score will assign equal weight to higher and lower value PGx scenarios and will weigh the overall risk score toward the drug with the largest indication frequency in the sample. Ideally, a summary risk score used to make clinical decisions to preemptively genotype would be based on a value-weighted combination of predicted risks for each drug type. That is, a preemptive genotyping decision should ideally combine 1) medication prescription risk with 2) the estimated benefit of genotype tailored therapy once the indication occurs.
Let
A decision rule that optimizes expected benefit for panel-based, preemptive genotyping genotypes patients with the highest total value across all available medications:
Results
Patient data used to calculate medication prescription risk are summarized in Table 1. We study 85,837 patients (534,962 clinic visits) in the 2010–2012 training cohort, and 59,953 patients (194,187 clinic visits) in the 2013–2015 validation cohort. The training cohort tended to be older (median age 58 v. 55), to have higher rate of type 2 diabetes (21% v. 13.8%), hypertension (60.1% v. 46.1%), congestive heart failure (9.7% v. 6.8%), and atherosclerosis (24.7% v. 18.8%) than the validation cohort. However, it had a lower prevalence of cardiac clinic visits (22.6% v. 25.1%). Figure 1 displays medication-free, Kaplan-Meier curves 14 using the longitudinal training and validation data for the three medications. Compared with the validation cohort, the training cohort had a somewhat higher rate of being prescribed the medications at 2 years. The 2-year risk estimates [95% confidence intervals] for the training and validation cohorts were, respectively, 0.022 [0.021, 0.023] and 0.018 [0.017, 0.019] for stent-indicated antiplatelet prescriptions, 0.146 [0.145, 0.148] and 0.126 [0.123, 0.129] for statin prescriptions, and 0.042 [0.041, 0.043] and 0.035 [0.034, 0.036] for warfarin prescriptions.
Patient Demographics, Vitals, Labs, Medical History, Chronic Medical Conditions, and 2-Year Prescription Event Rates for the 2010–2012 (Training) and 2013–2015 (Validation) Cohorts a
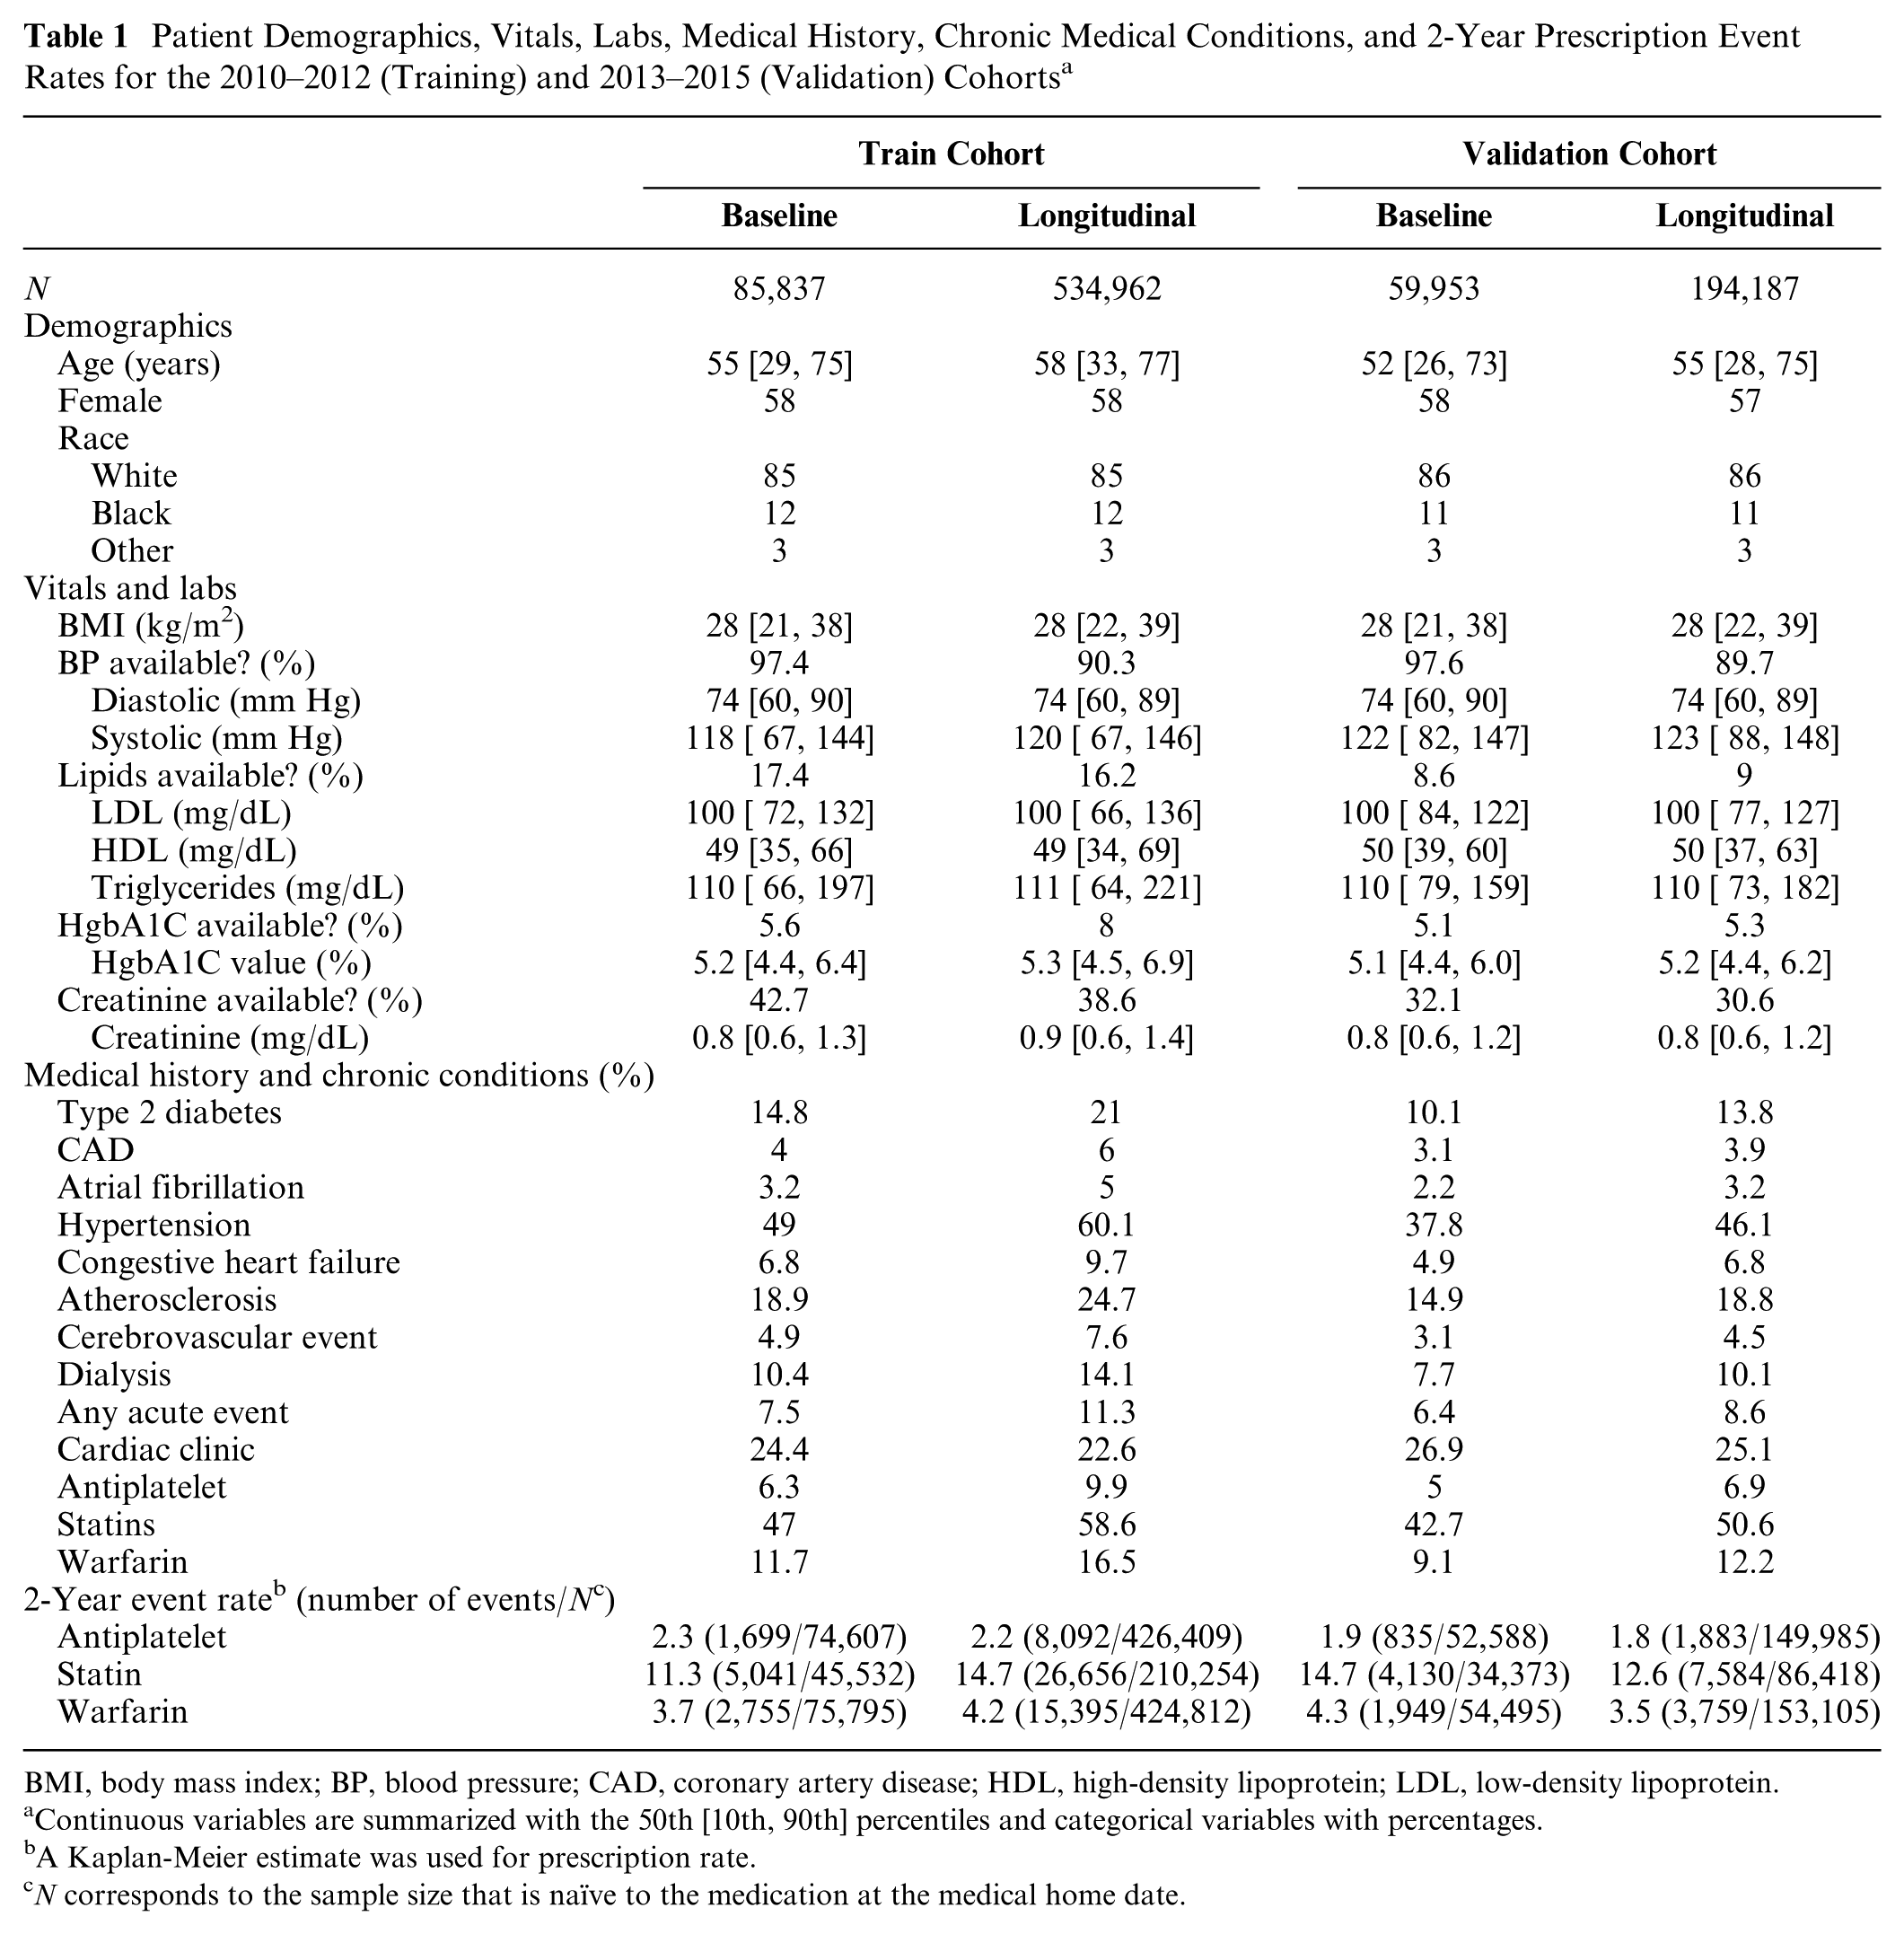
BMI, body mass index; BP, blood pressure; CAD, coronary artery disease; HDL, high-density lipoprotein; LDL, low-density lipoprotein.
Continuous variables are summarized with the 50th [10th, 90th] percentiles and categorical variables with percentages.
A Kaplan-Meier estimate was used for prescription rate.
N corresponds to the sample size that is naïve to the medication at the medical home date.
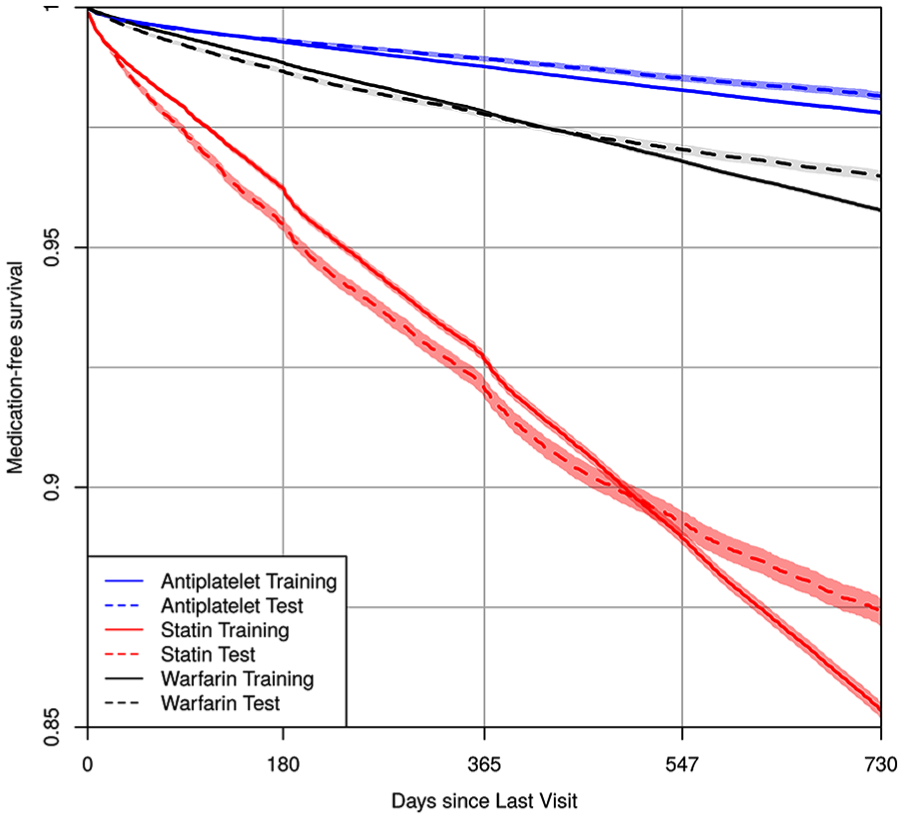
Kaplan-Meier estimates of medication-free survival probability using the longitudinal train and validation cohort data for antiplatelet, statin, and warfarin. The x-axis is the time since last clinic visit using the residual time scale.
Medication Prescription Risk Modeling
Figure 2 displays calibration curves, predictive distribution summaries, and C-Indices for 2-year risks when applying models developed using the training cohort data (2010–2012) to the validation cohort data (2013–2015). We display summaries for the three medications and the three modeling approaches (Cox without interactions, Cox with interactions, and RSF). None of the modeling approaches clearly outperformed the others across the three medications. The models were quite well calibrated for the statin and antiplatelet models although all models, and particularly the Cox without interaction model, appeared to overestimate warfarin risk at the upper tail of the distribution. All modeling approaches also yielded quite similar C-Indices (0.80–0.81 for antiplatelets, 0.69–0.70 for statins, and 0.69 for warfarin). In online appendices, we display parameter estimates, confidence intervals, and nomograms using the Cox without interactions model to enhance readers’ understanding of independent variable contributions to the risk estimates (see Appendix I, Figures A1.2–A1.7).

Calibration and distribution for predicted 2-year risks. Risk estimates were calculated by applying Cox main effect model, Cox interaction model, and RSF to the validation cohort dataset. Each dot stands for the average risk over 300, 173, and 306 observations, which provides 500 dots (bins) for antiplatelet, statin, and warfarin. The “syringe” plot or extended boxplot shows the 1st, 10th, 25th, 50th, 75th, 90th, 99th percentiles, and the standard deviation of the predicted risk distribution is displayed numerically. The smooth lines and the 95% confidence band were calculated using the locally estimated scatterplot smoothing.
Discrete Event Simulation
For each medication, we conducted a DES using literature-based values for secular death rates, variant allele frequencies, AE rates, and costs to estimate the expected benefit of genotyping in the 1 year following each medication prescription. We calculated
Table 2 shows the results of the discrete event simulation for combinations of the utility function, 2-year medication prescription risks, and race. When using SEAs and quality-adjusted life day utilities, the expected benefit of genotype-tailored therapy is far greater for those prescribed antiplatelets than those prescribed statins or warfarin. For example, while with antiplatelet therapy, we estimated avoiding 2.6 (white), 3.2 (black), and 5.1 (other race) SEAs per 1,000 patients genotyped (see ΔUmed column), with statin and warfarin therapy, we estimate avoiding less than 0.15 SEAs in all subgroups. In contrast, if considering all AEs together, including nonsevere events, we estimate that genotype-tailored therapy avoids far more statin-related AEs in white and other races (e.g., compare 19.7 statin-related AEs avoided in the other race compared to 4.8 and 3.0 antiplatelet-related and warfarin-related AEs). Table 2 also shows the 95th, 97.5th, and 99th percentiles of 2-year medication prescription risk (
Discrete Event Simulation a
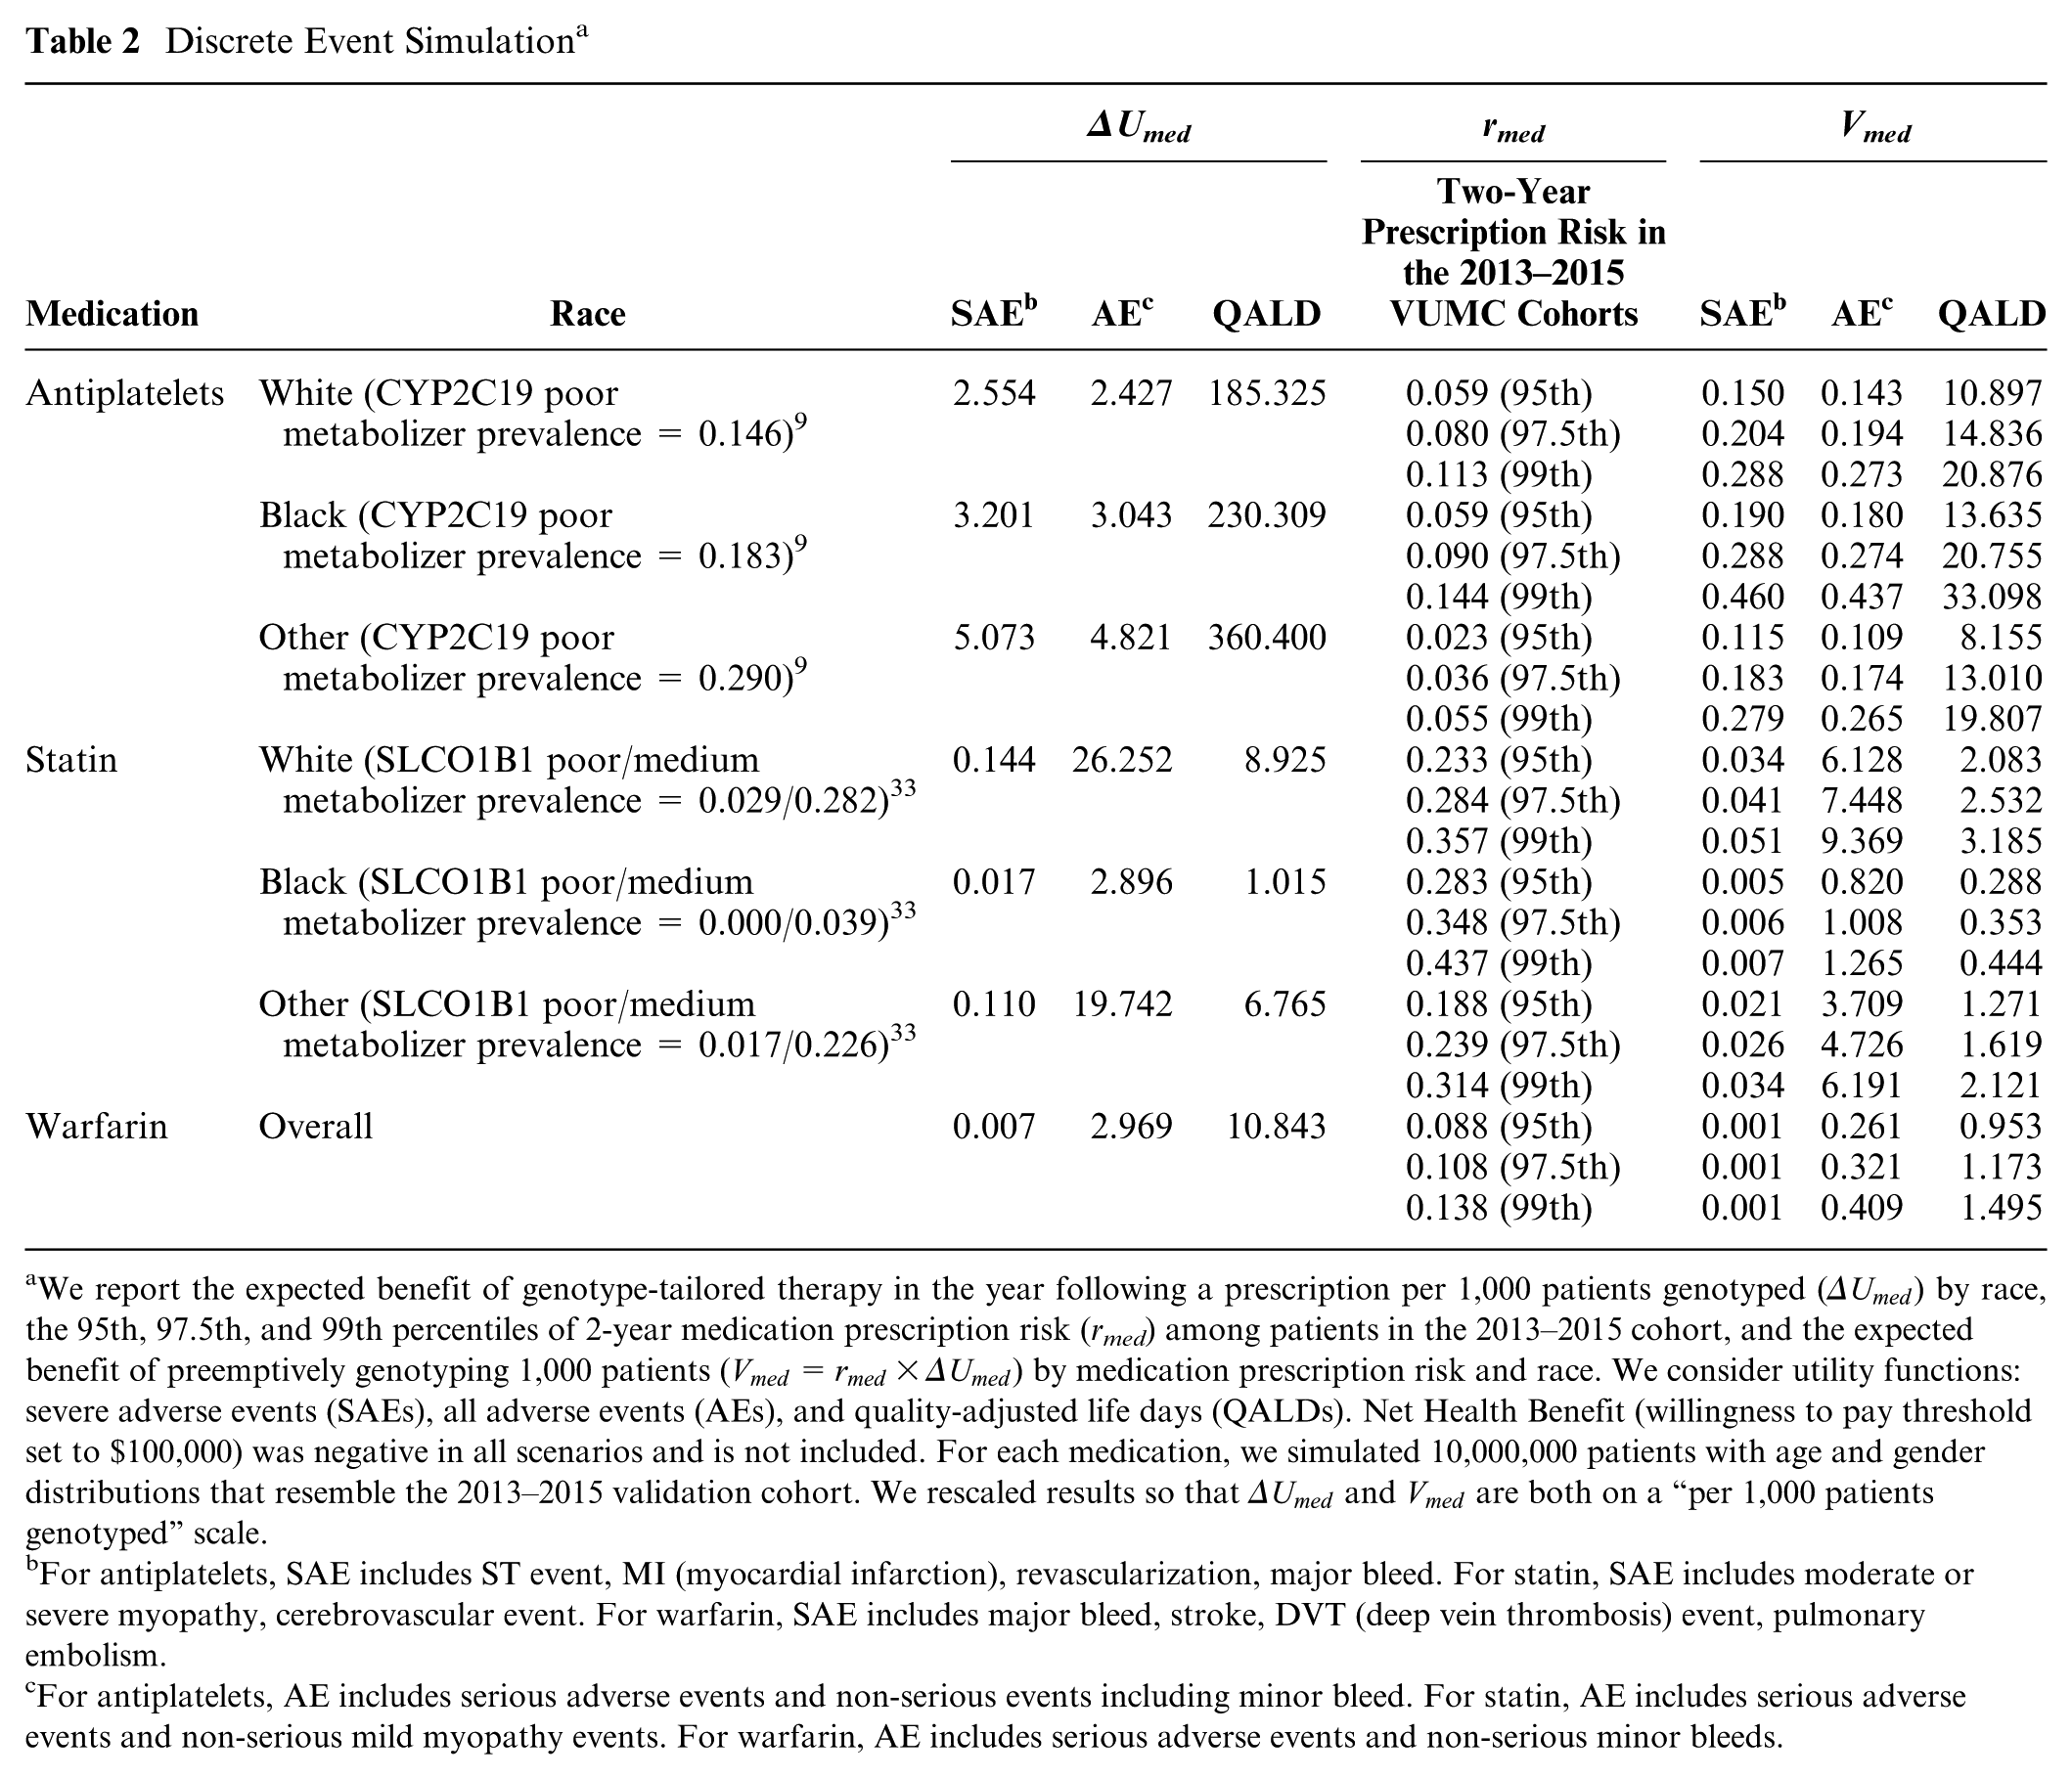
We report the expected benefit of genotype-tailored therapy in the year following a prescription per 1,000 patients genotyped (
For antiplatelets, SAE includes ST event, MI (myocardial infarction), revascularization, major bleed. For statin, SAE includes moderate or severe myopathy, cerebrovascular event. For warfarin, SAE includes major bleed, stroke, DVT (deep vein thrombosis) event, pulmonary embolism.
For antiplatelets, AE includes serious adverse events and non-serious events including minor bleed. For statin, AE includes serious adverse events and non-serious mild myopathy events. For warfarin, AE includes serious adverse events and non-serious minor bleeds.
Application of the Decision Rule to Identify Patients to Genotype
Since genotyping is still too expensive to perform on all patients, for this demonstration, we assume we can only genotype the 1,500 patients in each scenario, and Table 3 shows the extent to which this preemptive genotyping program could be used to improve outcomes if applied in the validation cohort. Examining the quality-adjusted life day utility function, we can see that with the decision rule to genotype when
Extent of Enrichment of the Genotyped Cohorts Using Rules That Genotype When the Total Expected Benefit of Preemptive Genotyping,

AE, all adverse event derived genotyping rule; QALD, quality adjusted life day derived genotyping rule; SAE, serious adverse event based genotyping rule.
We chose the thresholds for this demonstration project in a manner that genotypes 1,500 patients. For each med,
Figure 3 displays cumulative incidence of being prescribed each medication among the subset of 1,500 participants genotyped under each decision rule. By comparing these values to the cumulative incidence under a random sampling design, we observe the extent to which the pool of genotyped patients was enriched with those who were prescribed medications within 2 years of each clinic visit. The figure highlights the tradeoffs that are made when choosing a utility function. Genotyping rules that seek to minimize SAEs and increase the number of QALYs both enrich the sample with those prescribed antiplatelets (top left panel). In contrast, genotyping rules that seek to reduce all AEs enrich the genotyped pool primarily with those prescribed statins (top right panel).
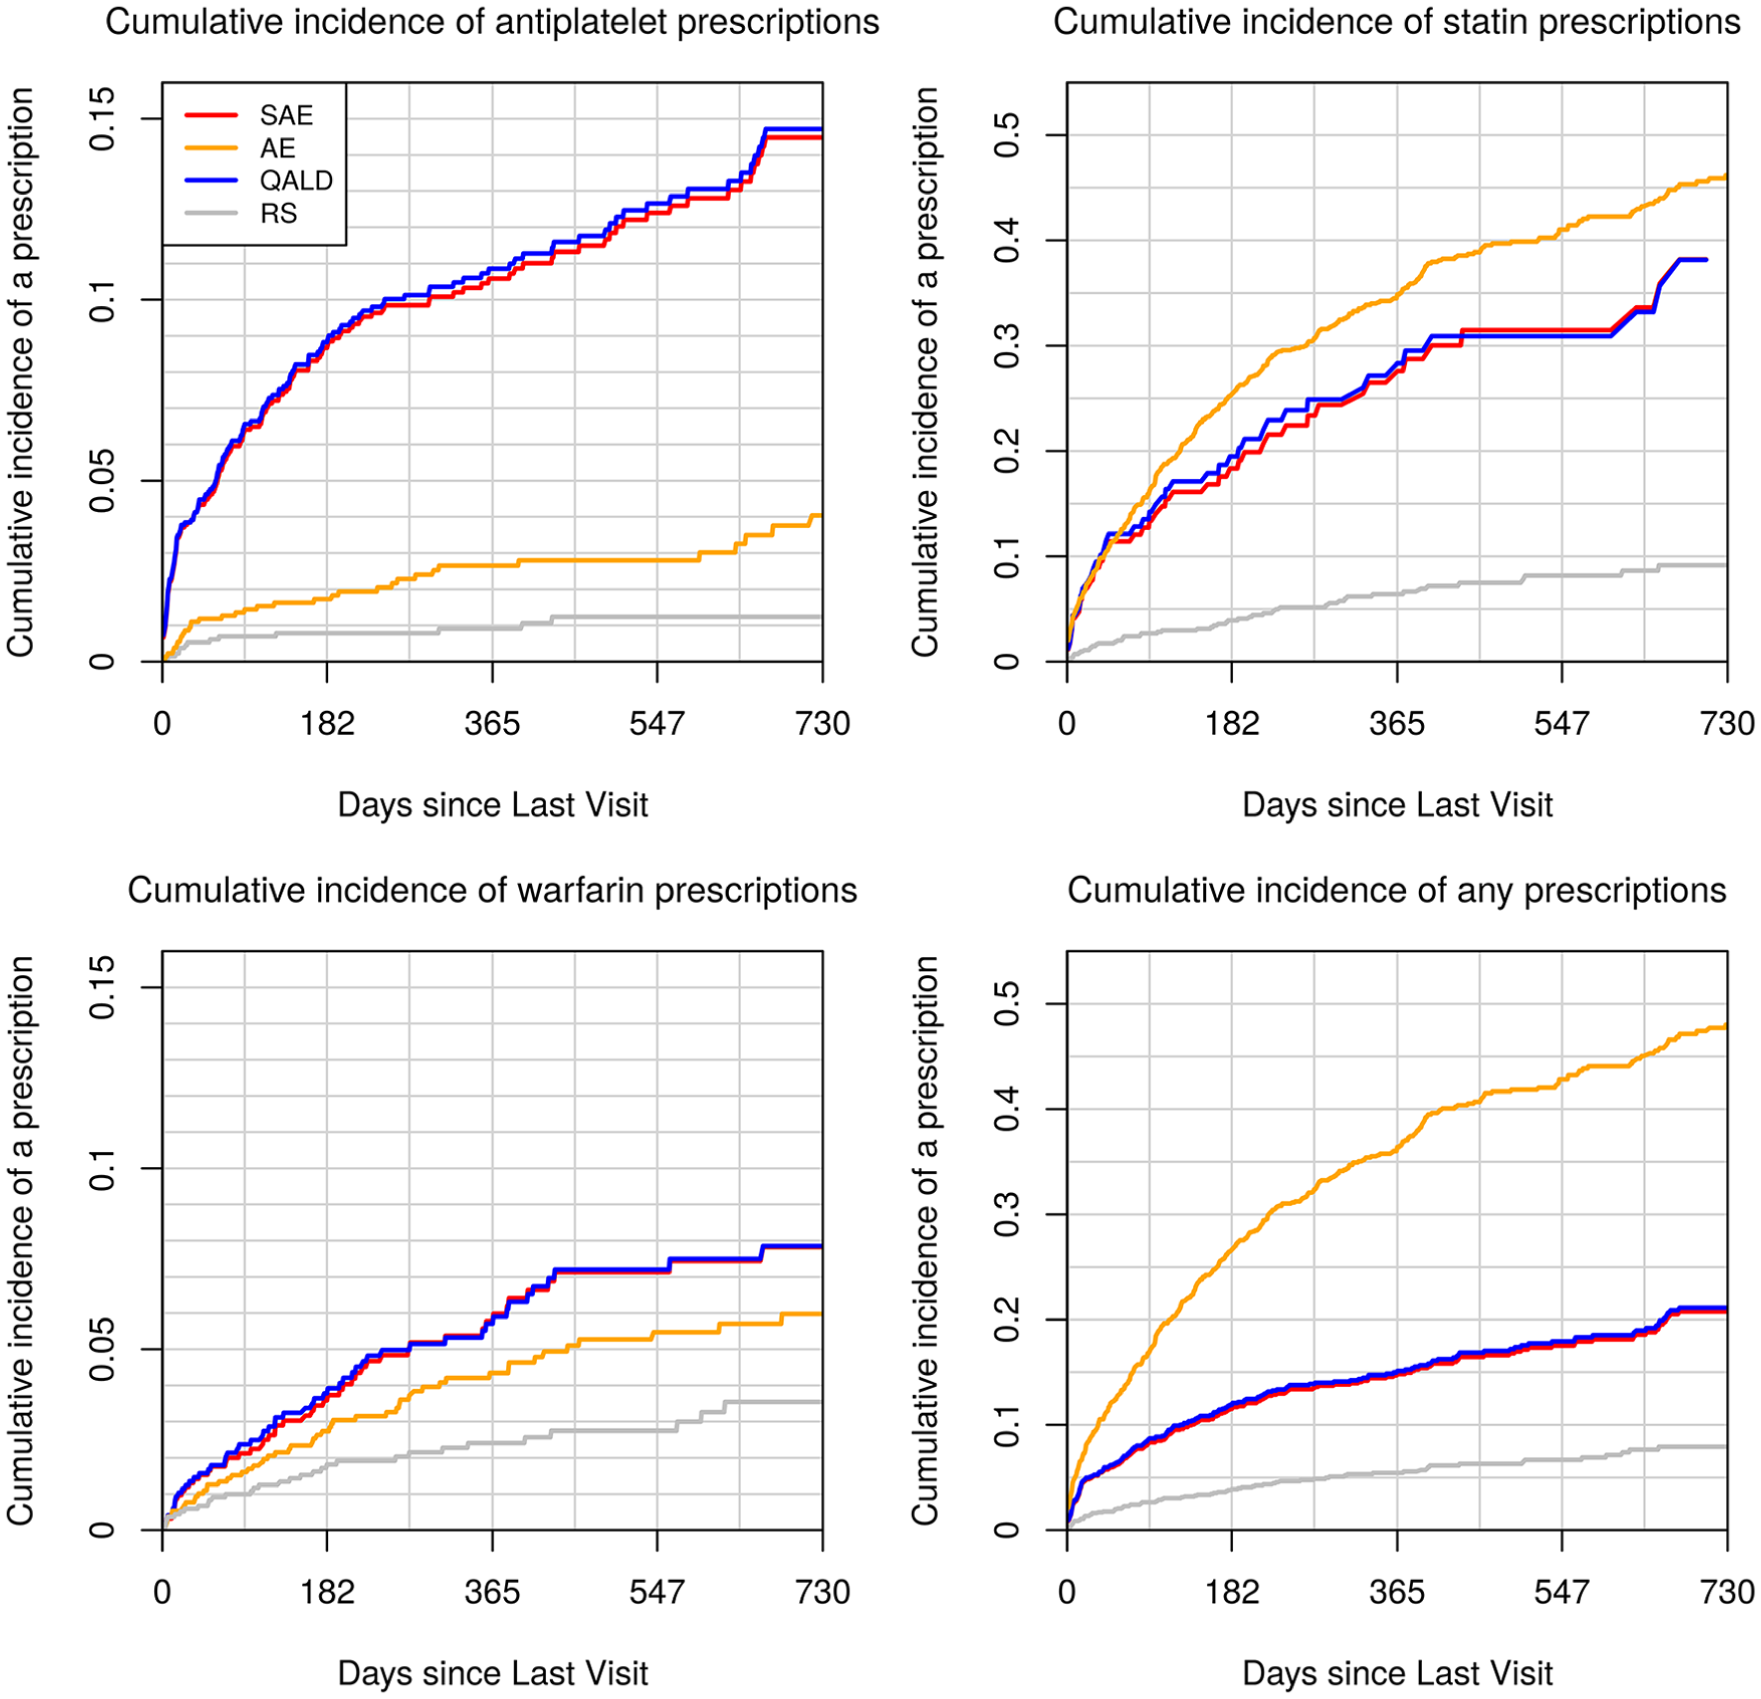
Cumulative incidence of medication prescriptions under four genotyping rules. We selected for genotyping the 1,500 patients in the 2013–2015 dataset who crossed the genotyping threshold for
Discussion
This article provides a framework for institutions and health systems to develop a preemptive genotyping program that maximizes societal and institutional value by integrating the advantages of genotype-tailored therapy with selection of a health care population that is most likely to benefit from testing. The framework is applied retrospectively using data from a single institution to demonstrate the feasibility and potential utility of the method. As a three-step process, the framework is more complex than what is currently implemented at several institutions including our own.34–39 However, if implemented, it could potentially balance the investment in testing with the downstream value of improving prescription-related outcomes.
We evaluated two different predictive modeling strategies—a Cox survival model and a machine learning–based RSF—and performance was comparable. This is consistent with a lack of high-order interaction terms that are naturally captured with RSFs and can be explained by noting that medication prescriptions represent a clinician-made decision. Thus, the predictive models can only be as complex as clinicians’ ability to assimilate patients’ clinical profiles. In addition, we implemented a discrete event simulation to estimate the expected benefit of genotype-tailored therapy once medications are prescribed, and we combined the prescription risk estimates with the expected benefit after prescriptions to derive expected benefit associated with preemptive genotyping. Under this program, for a chosen utility function, patients with the highest expected benefit across all medications should be genotyped.
In this demonstration, improvements may be perceived as modest. Observed results will improve with a larger number of medications with PGx effects, with a greater focus on high-yield indications for which genotype-tailored therapy has been shown to be beneficial, with increased targeting of those at highest risk of medication prescriptions, with longer follow-up times (both for prescribing and for observing downstream events), and with a more focused targeting of subgroups of patients known to have relatively high rates of risk conferring alleles. Notably, the strategy we propose is highly adaptable and can be easily modified as new evidence emerges (i.e., medications and medication indications can be added and removed from all calculations). Whether health systems can justify implementing preemptive, panel-based pharmacogenomic testing, or payors agree to fund such testing, may depend on the use of both predictive modeling and careful consideration of the economic and clinical benefits of tailored prescribing.
Supplemental Material
Appendix_online_supp – Supplemental material for A Decision-Theoretic Approach to Panel-Based, Preemptive Genotyping
Supplemental material, Appendix_online_supp for A Decision-Theoretic Approach to Panel-Based, Preemptive Genotyping by Yaping Shi, John A. Graves, Shawn P. Garbett, Zilu Zhou, Ramya Marathi, Xiaoming Wang, Frank E. Harrell, Thomas A. Lasko, Joshua C. Denny, Dan M. Roden, Josh F. Peterson and Jonathan S. Schildcrout in MDM Policy & Practice
Footnotes
References
Supplementary Material
Please find the following supplemental material available below.
For Open Access articles published under a Creative Commons License, all supplemental material carries the same license as the article it is associated with.
For non-Open Access articles published, all supplemental material carries a non-exclusive license, and permission requests for re-use of supplemental material or any part of supplemental material shall be sent directly to the copyright owner as specified in the copyright notice associated with the article.