
Abstract
“Knowledge infrastructures” are critical to producing research and spurring action on policy issues. We argue that the existing infrastructure of knowledge on housing problems in the United States is ill-suited for understanding issues of housing quality and deterioration. Specifically, we argue that the principal national database for understanding housing quality, the American Housing Survey, is seriously flawed. After identifying specific blind spots, we develop an alternative approach—one that is community-driven and pragmatic—for better apprehending this problem. Our results highlight findings otherwise not producible through existing national data sources. Drawing from a city-wide survey of older homeowners in St. Louis, we highlight the city’s most pressing repair needs, how they are spatially and demographically distributed, and the aggregate cost of fixing them, which exceeds $300 million. We also utilize data from an evaluation survey of households that received home repairs and follow-up in-depth interviews to reveal the many costs of housing deterioration that transcend the costs of repairing the physical structure. Ultimately, this article points to the need to support and amplify local knowledge-making capacities, which we believe can help to bring needed public attention and action to the serious problem of housing deterioration.
Aging, deteriorated homes are America’s silent housing crisis. As of 2022, about 35 percent of all homes in the United States had unmet repair needs, with an average repair cost of $3,359 (Divringi 2023:2). Housing deterioration especially affects older homeowners, those with lower incomes, and people of color (Bartram 2022, 2023; Divringi et al. 2019; Joint Center for Housing Studies 2018, 2023; Martin, Swanstrom, and Harrison 2024; Neal, Zinn, and Zhu 2020). This problem powerfully affects people’s quality of life—their physical and mental well-being, housing stability, social connections, and financial security. But this suffering has prompted little action. Observers may not see problems inside the home: the child sickened by black mold caused by excessive moisture or the elderly couple with heat stroke due to inadequate air conditioning. Others may notice repair issues—a collapsing porch, a broken window, a roof with missing shingles—only when they become an eyesore or seem out of place. Whether interior or exterior, housing deterioration gets relatively little attention from policymakers and the wider public, even compared to other housing issues that impact disadvantaged populations, such as affordability, evictions, gentrification, and neighborhood effects.
This article contends that this inaction can be attributed in part to lacking data on the problem of housing deterioration. It documents an effort to leverage research to boost public awareness and spur policy action on this problem. Drawing on the idea of “knowledge infrastructure” (Hirschman 2021), we conclude that the way we collect information on housing in the United States renders housing deterioration out of focus and therefore unactionable. To address this knowledge infrastructure gap, we advocate a community-driven approach that mobilizes local capacities to produce data and findings. We discuss our mixed-methods study of home deterioration among older adults in St. Louis. We believe such an approach can help to bring this serious problem into focus and public view.
The article proceeds in four parts. First, we lay out the idea of a knowledge infrastructure and what it looks like in the area of housing, highlighting the blind spots concerning the problem of deterioration. In particular, we argue that large national data sets overlook critical repair problems—such as nonfunctioning air conditioning units—and lack data on repair cost estimates, which are often locally specific. Second, we outline our community-driven—and pragmatic—approach to filling in these blind spots. This approach includes working with nonprofit home repair providers to generate locally specific data on common repair problems and devise locally specific cost estimates for repairing them. Third, we highlight some distinct empirical contributions generated through this study. Finally, we conclude with recommendations on reforms and future directions.
Housing Knowledge Infrastructure: Focal Points and Blind Spots
The concept of knowledge infrastructures highlights how society becomes aware of social problems that require public attention. As Hirschman (2021) explains, researchers normally do not produce data and findings on their own. They must rely on an existing knowledge infrastructure. This includes networks of people and institutions that “collect, process, and distribute data and, in so doing, facilitate specific forms of knowledge production” (Hirschman 2021:742).
Such knowledge infrastructures enable researchers to monitor trends and identify “stylized facts, empirical regularities that substitute for phenomena” (Hirschman 2021:742). Often, they cohere around large data sets created for specific purposes. Powerful actors with significant resources—such as government agencies and private foundations—are typically those empowered to decide what data get collected and how they are processed. Infrastructures also help distribute data and findings throughout the public sphere. They guide resources and attention toward answering some kinds of questions while rendering others unanswerable. Their design, in turn, affects which findings get produced and which problems become knowable. In this way, “knowledge infrastructures produce ignorance as well as knowledge” (Hirschman 2021:747).
Because knowledge infrastructures require power and resources, few actors can just build their own from scratch. Rather, those looking to produce data and findings on an issue generally must pursue one of two options. First, they can use existing data sets, which have specific blind spots and perpetuate specific “ignorance loops.” Or second, they can attempt to adapt or revise existing data sets to serve other purposes. Later in this article, we examine an effort by researchers to adapt an existing database, the American Housing Survey (AHS), to measure home repair needs. As we demonstrate, this option is inherently limited because it is highly constrained by already-made choices baked into existing data sets.
A good example of option one—using the existing infrastructure—is the “cost burden” measure. This is the foremost measure for measuring housing affordability. It defines affordability as based on housing costs not exceeding 30 percent of a household’s income. If a household spends more than that, it is assumed that they will lack funds to pay for groceries, transportation, and other necessities (i.e., the household is “cost-burdened”). The cost burden measure is highly accessible and has helped to bring the issue of housing affordability to the public’s attention. It includes two widely available forms of data: housing cost (i.e., rent or mortgage payment) and income data. Both variables are available through the American Community Survey (ACS). In both variables, the underlying phenomena is already quantified and denominated in common units (i.e., dollars). The data are also available for different geographic scales, down to the census-tract level. These factors enable wide circulation of findings on cost burdens throughout the public sphere. Hence, the existing housing knowledge infrastructure—with a few main data sets at its center—“facilitates knowledge claims by lending legitimacy, cultivating familiarity, and thus increasing the ‘doability’ of research that builds on [its] capacities” (Hirschman 2021:744).
Findings generated via this measure have become popular stylized facts. Countless media, government, and think tank reports use these facts as evidence of an urgent nationwide affordable housing crisis. Similarly, the existing housing knowledge infrastructure has also enabled researchers and advocates to keep up public pressure on other problems: evictions (based on data sets compiled by the Eviction Lab), place effects (based on tract-level ACS data and IRS records compiled by the Opportunity Insights project), and mortgage access (based on Home Mortgage Disclosure Act data). Although the existing infrastructure casts light on important issues, it leaves others out of focus. For example, researchers have long criticized the 30 percent cost burden measure for being a one-size-fits-all standard that misses important variations in household and context. It underestimates the housing cost burden for households with children and low incomes, who are not in a position to spend even 30 percent of their income on housing costs (see Stone 1993).
This article highlights a critical blind spot in the existing housing knowledge infrastructure: the problem of housing deterioration. For various reasons, existing data sets are not well set up to “collect, process, and distribute” information on this problem. Prior to the advent of big data sets, 20th-century reformers delegated research on this problem to local governments, under the umbrella of “code enforcement.” That dynamic continues to this day. Codes set standards for what is considered “good quality” housing. If housing is not “up to code,” officials conclude that it fails to meet minimum quality standards. The designation has been relatively vague, encompassing deficiencies that ranged from lacking essentials, such as running hot and cold water, to wear and tear, such as a hole in the roof or exposed wiring. The housing code enforcement process does not generate standardized data that would enable us to track housing deterioration.
In measuring housing deterioration, local governments face fundamental challenges that still bedevil large data collection efforts today. First, the underlying phenomena is inherently difficult to standardize, document, and measure. Unlike housing costs and household income, housing deterioration is not easily captured in standard units that can be compared across time and space. Second, as a result, identifying housing deterioration is highly technical, labor-intensive, and costly. The best way to accurately measure housing deterioration is to send skilled inspectors into homes to identify defects. Few cities can afford such expenses. Some cities conduct drive-by window inspections of the exteriors of homes, but these are labor-intensive and expensive and produce little information on problems inside the home.
Over time, the United States has come to rely more on national-level data collection efforts to document housing conditions, in particular, the ACS and the AHS. The ACS is a survey of population or households, whereas the AHS follows a sample of housing units over time. The ACS does collect information about the housing unit from survey respondents, such as information on dwelling features (e.g., number of units in structure, number of rooms, occupants per room, etc.). However, it collects little information on housing quality. For example, it only asks whether a unit has plumbing or kitchen facilities and asks no questions about the extent of deterioration.
The other main national data source is the AHS. It is the only national-level data set with extensive, publicly available information on housing quality and deterioration. It is designed to assess the condition of housing units, not population. It has a large sample of housing units that it follows over time, gradually adding new units to the sample so it can be representative of the growing housing stock. Conducted by the Census Bureau under the direction of the U.S. Department of Housing and Urban Development (HUD), the AHS asks the occupants of each housing unit questions about the home, its condition, and its quality. The AHS has become the go-to data set for a wide range of housing-related issues, but it is a flawed instrument for tracking housing quality.
First, the AHS underestimates the housing deterioration problem. AHS publishes a composite measure of housing quality that classifies housing units based on their level of “adequacy.” A unit is classified as “severely inadequate” if it has one of a series of serious problems, such as no electricity or dangerous electricity (identified by the reporting of exposed wiring, lack of electrical outlets in every room, plus fuses that have blown more than twice), or it has at least five other conditions out of six listed (inside leaks, outside leaks, holes in floor, open cracks in walls or ceiling, large peeling paint, and seeing rats recently). A unit is classified as physically “inadequate” if it has three or four of the conditions in that list. Otherwise, it is deemed “adequate.” According to the most recent AHS, only 1.4 percent of American households live in units that are severely inadequate, and 3.8 percent live in units that are inadequate. Overall, 3.4 percent of homeowners lived in either severely inadequate or inadequate housing; the figure was 8.4 percent for renters (U.S. Census Bureau 2021-a). Since 2001, the share of renter and homeowner households living in inadequate housing declined by 2.5 percent and 0.7 percent, respectively (cited in Martin et al. 2024).
Many researchers argue that the AHS seriously understates the extent of housing deterioration, especially “given how serious problems must be in order to trigger a classification of inadequate” (Wallace et al. 2019:1; see also Eggers and Moumen 2013; Emrath and Taylor 2012). Researchers have also “questioned whether its criteria meaningfully reflect an underlying housing quality construct” (Wallace et al. 2019:1; citing Eggers and Moumen 2013; Newman and Garboden 2013). One study conducted a hedonic regression and found that AHS indicators of housing inadequacy are not correlated with lower rents or housing prices, as would be expected by market theory. They conclude that AHS significantly undercounts the number of units that are moderately or severely inadequate (Emrath and Taylor 2012).
A major flaw in the AHS is that it does not address the need for cooling. Although the AHS requires a functioning heating system for a unit to be deemed adequate, it does not require a functioning cooling system. This might have made sense when the AHS first started in 1973, but over a half a century later, it makes no sense in light of growing evidence that rising temperatures from global warming and urban heat island effects have far-reaching consequences for morbidity and other negative outcomes—especially for older adults during heat waves (Klinenberg 2002; O’Lenick et al. 2020). Housing deterioration has been linked with uncomfortable temperatures that can be hazardous to health or even fatal (Kilbourne 1999; Thomson et al. 2013).
Increasingly, cities are updating their housing codes to require owners to keep people cool in the summer, just as they have always been responsible for keeping people warm in the winter (Aronoff 2024; Howard 2024) According to the AHS itself, 7.6 percent of American households lack any air conditioning. Although there is undoubtedly overlap with housing units deemed inadequate, the lack of air conditioning would significantly increase the percentage of American households deemed as living in inadequate housing. Moreover, as we discuss later, having functioning air conditioning does not guarantee safe temperature when a unit has air leakage and inadequate weatherization.
The AHS is also flawed because it collects and processes data in ways that do not enable researchers to identify specific problems or needed repairs (and their costs). The AHS does not generate standardized data on the full dimensions of housing deterioration that can be used to measure and compare trends across time and different geographies. The AHS sampling methodology is also a weakness. The AHS provides national-level estimates and data for some metropolitan areas, but the sample size is not large enough to provide results for individual cities, and it cannot generate small-area estimates at the neighborhood level. This is a critical flaw because housing deterioration varies significantly within metropolitan areas. As one study puts it, “housing condition problems tend to be more localized than cost burden problems, so that measures are needed at neighborhood level geographies” (O’Dell, Smith, and White 2004:29; see also, Krieger and Higgins 2002). The lack of local data hinders our understanding of the problem and identification of better targeted policies to address the problem. The need for locally specific data on housing deterioration motivated the research presented in this article.
As a result of the flaws noted here, the AHS has fueled the prevailing narrative that the United States has largely solved the problem of housing quality and that the dominant issue is housing affordability. According to the AHS, housing quality has greatly improved over time. This is mostly because twentieth-century improvements reduced how many homes lack flush toilets, electricity, or other modern necessities. In 1940, for example, 45.3 percent of housing units lacked complete plumbing (defined as hot and cold piped water, a bathtub or shower, and a flush toilet); in 1990, only 1.1 percent lacked complete plumbing (U. S. Census Bureau 2021-b). The AHS has contributed to the conventional wisdom that housing affordability, not quality, is the dominant problem. As prominent HUD official put it in 2023, “It is because of the AHS that we know the state of the housing crisis. Housing inadequacy has decreased over time, but housing affordability problems have not” (Carter 2023:3). If we acknowledge the flaws in the AHS, however, and focus on the extent of housing deterioration, especially for lower income Americans, the conventional wisdom becomes shaky.
The implication of the conventional narrative is that housing quality and housing affordability are separate issues. In fact, they are “two sides of the same coin” (Emrath and Taylor 2012:123). Most “affordable” housing in the United States is not publicly subsidized but is privately owned housing that has filtered down to lower income households. For it to be “affordable,” it must have deteriorated or be located in disinvested neighborhoods with low market values. If a family pays less than 30 percent of their income on housing but the unit is unsafe and unhealthy, that hardly qualifies as affordable housing. According to a 2001 study, if housing costs included the cost of paying for repairs to make the unit safe and secure, the number of households with excessive cost burdens would increase by 34 percent (Listokin and Listokin 2001:41). “Without attention to routine dilapidation,” Bartram (2023:267) argues, “we underestimate the affordable housing crisis.”
Building a Local Housing Knowledge Infrastructure : Measuring the Many Costs of Home Deterioration
The knowledge infrastructure blind spots described here hinder us from identifying empirical regularities and producing stylized facts that bring the problem of housing deterioration into focus. This section documents an effort to produce data and information on housing deterioration despite absence of a national knowledge infrastructure for doing so. From this case, we outline a locally driven approach to knowledge production—one potentially useful for generating information on other problems in other settings.
Our case began in January 2020 in St. Louis, Missouri, with a local group called the Vacancy Prevention Working Group of the St. Louis Vacancy Collaborative. 1 The group wanted to amplify awareness around and draw more resources into locals’ struggles against housing vacancy and abandonment in disinvested neighborhoods.
Toward that end, the group approached researchers at the Community Innovation and Action Center at the University of Missouri-St. Louis for research help. They came with three initial questions: (1) What is the extent of housing deterioration in the city? (2) How much would it cost to make those repairs? and (3) Is housing deterioration fueling vacancies and abandonment? From this point, our research team formed and branched off from the Vacancy Prevention Working Group to work with local nonprofits that specialized in providing home repair services to lower income households (more detail in the following).
The community-driven and pragmatic approach and findings presented in this article grew out of an effort to help the group answer its initial set of questions. We came to focus especially on Questions 1 and 2. In doing so, we immediately confronted the two long-standing challenges to producing data and information on housing deterioration: (1) There is no format for standardizing, quantifying, or comparing home repair needs and costs, and (2) in part because of that, measuring housing deterioration remains a prohibitively cost- and labor-intensive endeavor, undertaken mainly by local governments for the limited purposes of code enforcement. We determined that the AHS—the main pillar of the existing knowledge infrastructure—would not suffice for the reasons outlined previously: It did not collect data on specific problems and repairs, did not report cost estimates, and did not disaggregate data into smaller geographies (cities and neighborhoods).
We needed to improvise knowledge production and looked to build on another such effort, a 2017 study conducted by the Philadelphia Federal Reserve and PolicyMap (referred to hereafter as the PFRPM study). This study is the first national estimate of the need for and cost of home repairs (Divringi et al. 2019). To create this estimate, researchers utilized the approach we discussed earlier, adapting an existing knowledge infrastructure, the AHS, to answer new questions. PFRPM utilized AHS survey responses to identify 99 “repair scenarios”—common housing quality problems and associated repairs. The study then estimated costs for each scenario using the RSMeans 2018 Contractor’s Pricing Database, a national proprietary database on construction costs (Wallace et al. 2019). The PFRPM study’s main finding generated some media coverage (Sisson 2023). The cost of the nation’s repair needs stood at $126.9 billion in 2018, updated to $149.3 billion for 2022 (Divringi 2023). And much of that burden—more than a third of it—falls on lower income household. 2 By constructing “repair scenarios” the study created a format to standardize and measure home problems and estimate repairs. By putting a dollar figure on problems and repairs and highlighting their links to race, class, age, and other factors, the study produced powerful new stylized facts to channel public attention.
We set out to adapt the PFRPM approach of constructing repair scenarios to standardize repair needs and costs for our study based in St. Louis. But the limits of doing so soon became clear. In particular, the PFRPM study had produced national estimates but was unable to document the problem or produce cost estimates for smaller geographies (cities and neighborhoods). That was because it still relied on the AHS sample data. We explored the possibility of sending qualified inspectors into homes to determine what repairs were needed to bring the home up to code, but we concluded this approach was too costly and intrusive.
Facing this issue, we devised our own research design to counter limits in the existing knowledge infrastructure. As further explained in the followin, our study included a main component (a city-wide survey of homeowners) and two supplementary components (a smaller evaluation survey and follow-up qualitative interviews). 3 All components were meant to realize the study’s aim of mobilizing local capacities to produce knowledge that could measure and cast attention on the problem of housing deterioration.
First, we created our own locally specific survey instrument (detailed further in the following), administering it to a representative sample of older homeowners in St. Louis—the main component of the study. 4 Although this article highlights the legacy of housing deterioration for residents of owner-occupied homes, it should be noted that renters in single-family and multifamily dwellings have faced similar and equally catastrophic problems in both actual home disrepair and adequately measuring it (Korver-Glenn et al. 2023). We identified 25,993 unique addresses of single-family homes or duplexes that had at least one registered voter age 60 or over with an ownership interest in the unit. 5 The choice to limit our sample to older adults reflects our interest in broader public and scholarly conversations on the challenges of “aging in place” (Coleman, Kearns and Wiles 2016; Fausset et al. 2011). It is unclear whether older lower income households are more likely than younger ones to reside in homes with repair problems, and one notable limitation of our approach is it cannot answer that question. But the aging in place conversation suggests older adults are likely less able to relocate; our approach aims to elucidate this distinct intersection of problems and populations. Additionally, although limiting the sample to registered voters may have led to undersampling of low-income households, we took steps to ensure that we did not (see Appendix F in the supplemental material). 6
In late 2021, we mailed out 2,500 surveys, about 10 percent of the total population; a few weeks later, we sent them a reminder postcard. We guaranteed confidentiality to respondents. We got back 583 completed surveys, a return rate of 24 percent. We then linked the responses to our survey to specific repair scenarios and estimated costs (explained further in the following). This enabled us to identify the frequency of repair needs, distributions across populations and geographies, and estimated costs to fix them. Our survey enabled us to document St. Louis’s distinct home repair needs and costs down to the census-tract level. 7
Crucially, we enlisted the help of local partners to create a research instrument that included locally specific questions and cost repair estimates. We began by identifying local home repair providers—two nonprofits and one city agency—who could advise us on our methodology. 8 Our local partners possessed valuable local knowledge and expertise on home repair problems, costs, and affected households. Specifically, they helped us adapt the PFPRM survey questionnaire and repair scenarios to our purposes. To avoid an overly long and burdensome questionnaire, we pared down the PFRPM’s 99 scenarios to a more manageable 43. Our local partners leveraged their local data to help us to identify 43 repair scenarios that cover all the most important repair issues in St. Louis. With the help of local partners, we also revised the PFRPM’s questions to more clearly indicate specific repair scenarios and costs. 9 We also added new questions and repair scenarios based on advice from local partners—for example, those pertaining to conditions of and repairs to external structures, such as trees, garages, carports, patios, walkways, porches, stairways, ramps, and so on. Such external conditions, we found, often pose serious safety issues and raise concern for many homeowners. It was our local partners who keyed us into the need to include air conditioning as a necessary characteristic of adequate housing. To identify the magnitude and cost of some scenarios, we connected our survey responses with the city assessor’s database on such variables as square footage and number of stories. If responses indicated that the roof needed to be replaced, for example, we adjusted the cost estimate based on roof size, which we estimated, in turn, using the square footage of the home divided by the number of stories. Like the PFRPM, we estimated costs for each scenario using the RS Means database, but we relied on our local partners’ guidance to amend these estimates to better align with documented, locally specific costs.
Third, our local partners also helped us better assess the deeper costs of housing deterioration for the people who live in these homes. Documenting only the physical condition of homes does not do justice to the true toll of housing deterioration. The latter goes beyond sterile listings of frequent needed repairs and dollar estimates. To produce data on homeowners’ lived experiences and outcomes, we might have conducted a quasi-experiment that systematically compared groups with and without repairs. But that option would have been too costly and was therefore infeasible. Instead, our study attempts to provide an empirical window into housing deterioration’s deeper costs by including two paired supplemental components: an evaluation survey of those who received home repairs coupled with follow-up qualitative interviews.
With the help of our local partners, we obtained a list of homeowners who had received home repair services. In consultation with local partners, we developed a questionnaire that asked respondents about their lives prior to and after the repairs, attending closely to changes. 10 Once completed, we mailed out surveys to 202 households and received back 83 completed surveys, for a response rate of 41 percent. Our survey respondents were overwhelmingly Black (85 percent), female (83 percent), and low income (78 percent earned less than $25,000 a year). We then asked the survey respondents if they would be willing to participate in a follow-up interview, offering them a $25 gift certificate for their time. Surprisingly, 79 out of 83 survey respondents volunteered to be interviewed.
We interviewed 31, making every effort to select households from different parts of the city. Guiding our choice to limit interviews to 31 were three main considerations. First, the interviews were meant to supplement other components of the research design—specifically, to strengthen validity of survey results, provide more context for them, and uncover details of homeowners’ experiences the surveys might have missed. Second, we followed prevailing methodological guidance to collect interview data on the basis of “saturation”—the point at which data seem to generate consistent answers to questions—rather than to reach a high enough N-count (Small 2009). And third, our resources and staff were overextended and limited, which meant lowering the threshold for saturation within the parameters of our multimethod design. That said, we took care to maximize variation of respondents across different race/class neighborhood profiles. Of the 31 homeowners interviewed, 23 were women, and 25 were African American; they were spread out across 14 different ZIP codes.
The interviews were semistructured. 11 The questions were designed to flesh out evaluation survey answers, delving into the physical conditions of homes, residents’ experiences of specific problems, their emotional responses, and so on. 12 Interviews were analyzed through open (versus focused) coding based on broad similarities and differences in responses to prompts across our main thematic categories (Charmaz 2006). Responses were grouped into several broad themes relating to their descriptions of the events leading up to the repair, their overall experience of it, effects on their home life, effects on physical health and well-being, effects on financial security and well-being, effects on their mood and feeling, and effects on their long-term outlooks as homeowners. These data revealed the profound effects of housing deterioration on people’s quality of life. It showed some harms—such as mental stress or pride in place—are difficult or impossible to capture with quantitative survey data.
Seeing the Problem Anew: Putting Housing Deterioration into Focus with New Data and Findings
Our study charts a locally advised, pragmatic approach to research on housing deterioration. We mobilized local capacities to standardize measurement, lower the costs of knowledge production, and make it more feasible. This approach enabled us to produce data and findings adjacent to the existing knowledge infrastructure—but better suited to our own questions—and generate new empirical findings.
Like the AHS, our study produced data and findings on the most common repair problems that older homeowners must navigate. Table 1 shows the most common repair scenarios for older homeowners in St. Louis. Many have been linked to specific health and safety issues. The need to install electrical plugs or outlets, for example, was the most common overall. According to regulatory standards, no point along a wall should be more than six feet from an outlet, and in general, no outlet should be used for more than two devices. Over 81 percent of our respondents reported that they had at least one room where an electrical outlet was used for more than two devices. Overloaded electrical outlets are a fire risk. Nationally, fire departments responded to an average of 46,700 home fires involving electrical failure or malfunction each year from 2015 to 2019, causing 390 civilian deaths and $1.5 billion in property damage annually (Campbell 2021).
The 10 Most Common Repairs.

Other common problems included lack of weatherization, such as caulking windows and sealing doors, and various issues related to excessive dampness (compromised foundations, faulty piping, basement leaks, etc.). Excessive dampness in homes causes mold. 13 Over one-quarter of our respondents reported having mold larger than an 8½ by 11-inch sheet of paper. Many studies have documented the connection between dampness, mold, and serious health problems, such as asthma (Fisk, Lei-Gomez, and Mendell 2007; Rauh, Chew, and Garfinkel 2002). 14 Studies show that repairs significantly reduce the problem and improve health outcomes (Burr et al. 2007; Fisk et al. 2007). 15
Following the PFRPM’s advances, our study put a dollar figure on fixing the city’s repair problems for older homeowners in St. Louis. But unlike either the AHS or the PFRPM, we were able to do so for smaller geographies—cities and neighborhoods. At the city level, we found that, in 2021, older homeowners in St. Louis faced an average backlog of $13,023 in needed repairs. This finding itself demonstrates the importance of locally specific estimates; by contrast, according to the updated PFRPM, the average cost of needed repairs in the nation in 2022 national was $3,359 (Divringi 2023:2). 16 For older homeowners who cannot afford to pay for preventive maintenance, deterioration can accelerate over time. If we take the average cost of repairs per home and project that to all older homeowners in St. Louis, the total cost of all needed repairs would be $302.3 million. Researchers may not typically pursue this kind of finding. But our local partners considered it a critical stylized fact to draw public attention to the problem of housing deterioration.
Additionally, although home repair needs are widespread, we found they are distributed unevenly across the city’s population. Mirroring the PFRPM’s results, our findings show that housing deterioration was far more prevalent and repair costs much higher in lower income and Black households (Figure 1). The average cost of needed repairs for those earning less than $17,904 was almost 4 times that of those earning more than $69,651. And Black homeowners needed repairs averaging $17,904, whereas White homeowners reported less than half that amount ($7,832).

Average cost of needed repairs by income range.
Our study also revealed how home deterioration problems and costs were unevenly distributed across neighborhoods. St. Louis is commonly divided into three districts: North St. Louis is heavily African American, and the Central Corridor and South St. Louis are mostly White, with some areas more racially diverse (Figure 2). Average repair costs were highest in predominantly Black and lower income parts of the city. North St. Louis had average repair costs about twice that of the other parts of the city further south (Figure 3). The same patterns held at the census-tract level. In tracts where the population is over 80 percent Black, the average cost of needed repairs was $17,919, compared to only $7,962 in census tracts that were less than 20 percent Black.

Map of city districts by Black population.
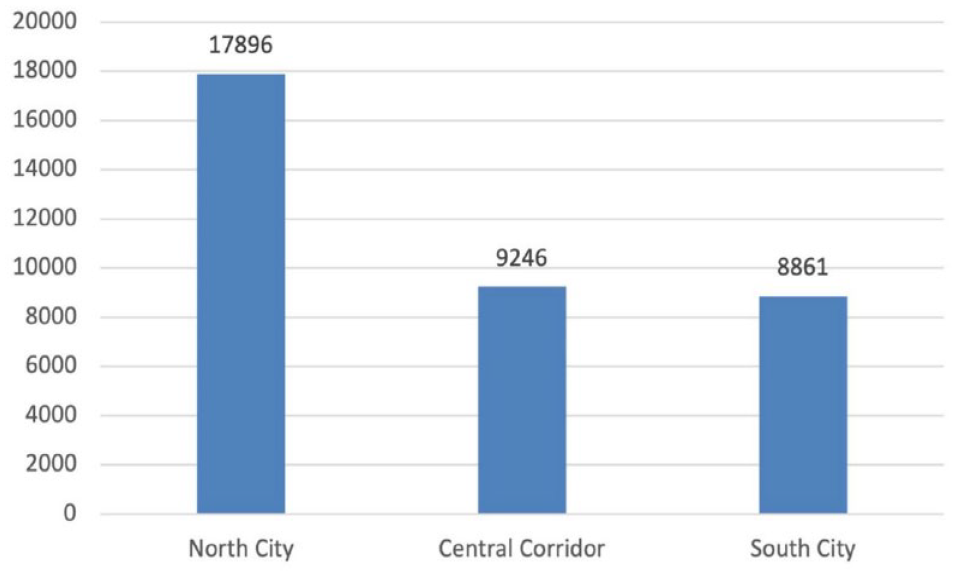
Average needed repair cost by city district.
By documenting neighborhood-level patterns, our findings move beyond the AHS and PFRPM to demonstrate how housing deterioration is linked to a legacy of place-based inequality and environmental injustice (Bartram 2023). Black areas suffer high home repair costs due to historical factors that have segregated and stratified neighborhoods along race and class lines, including housing and labor discrimination (Gordon 2008; Gordon and Bruch 2020), racialized public policies (Rothstein 2014), and unequal home appraisal and value appreciation (Howell and Korver-Glenn 2018).
Besides producing data on smaller geographies, our study design also highlighted critical problems overlooked by the AHS and PFRPM. Most notably, based on the advice of our local partners, we added inadequate or nonfunctional air conditioning as a “repair” issue. In a place like St. Louis, air conditioning has become a necessity. 17 Overall, 19 percent of our respondents reported that their central air conditioning failed for six or more consecutive hours, and over 28 percent reported feeling uncomfortably warm even when the air conditioning was on. Additionally, 15 percent of our respondents lacked central air conditioning in the first place. The city’s Black and lower income households were hardest hit. Fully 22 percent of respondents in the lowest income category (less than $17,400) reported that their air conditioner failed for six or more hours, whereas only 2 percent reported this in the highest income category (those making over $69,651). And less than 8 percent of White respondents lacked central air conditioning, compared to 22 percent for Black respondents. Additionally, a far higher percentage of Black respondents reported being uncomfortably warm or cold with the heating or air conditioning on (Figure 4).

Temperature discomfort levels and access to central air conditioning by race.
Finally, beyond producing data and findings adjacent to the AHS and PFRPM, our study also generated new research inputs and outputs. By leveraging the capacities of our local partners, we were able to add supplementary components: an evaluation survey and follow-up qualitative interviews. These inputs helped provide a very different empirical angle on housing deterioration, revealing facets of the problem otherwise not well captured by housing condition surveys and costs that go beyond the dollars that would be needed make the needed physical repairs.
Although electrical problems were the most common issue, for example, that fact understates the impact on peoples’ lives. Through interviews, we found that such problems can be debilitating. They can strike fear into residents doing ordinary household tasks, such as cooking. One older homeowner spoke to us after the repair workers fixed hazards in his kitchen, replacing “all the plugs around the appliances and the backsplash and so forth.” As he further explained, it was a “safety factor. I guess it’s a circuit breaker where it shuts off the ones in the kitchen. They put [in] all those plugs, so I don’t have to worry about, you know, being shocked or whatever. I don’t want to get shocked. I’m on my fourth pacemaker.” Studies find that electrical hazards can cause intense mental stress (Evans, Wells, and Moch 2003).
The same goes for another common problem: dampness and mold. One homeowner recounted her harrowing experience with mold from her home’s structural weaknesses: “It turned out that all my spools and my gutters had backed out and the water was going behind a wall. The water was coming down through that wall. It rotted part of the wood, which caused some of my flooring to fall down.” She recalled how sick she got from breathing in the moldy air. “I got real sick. I got so sick. I was bending over to the hospital. . . . All the symptoms had left from the time I left my house to finally get to the hospital. So, my stepson said you gotta have mold in your house.”
Our supplemental data went beyond the AHS and PFRPM to demonstrate the all-encompassing impact of housing deterioration if left unfixed. At the same time, it also showed the potential impact of fixing the problem, albeit within limited parameters. For example, unlike the AHS and PFRPM, our study included safety and accessibility modifications (installing grab bars, ramps, etc) as a repair need. Our respondents picked accessibility modifications as having the greatest impact on their quality of life (Community Innovation and Action Center [CIAC] 2023:26). Almost one-third (32.9 percent) reported that the repairs made them “a lot less likely” to fall (CIAC 2023:24). One study found that the benefits of such modifications, primarily due to reduced emergency room visits, hospitalizations, and deaths, averaged $5,870 per household (Nielson et al. 2021:17), yet the cost of installing a grab bar is quite modest, ranging from $89 to $600. 18
Our respondents also communicated other valuable impacts of repairs. Half of those who had gotten repairs reported feeling “a lot more positive” about their mental health and emotional well-being. Over half reported finding it easier to do households tasks, such as cooking or showering. About the same percentage reported feeling more pride in their homes and being more likely to invite over family and friends (CIAC 2023:25–26).
Some of our study’s most important findings along these lines pertained to the economic and financial aspects of homeownership. Almost three-quarters (72 percent) of respondents felt their home was more valuable after the repair. A little over 70 percent reported they were more likely after the repairs to stay in their homes (CIAC 2023:26). As one interviewee put it: “You know, people want to stay in a house, but when you have it falling down and you don’t have the money to fix it up, [and] you on a fixed income, [it] is very, very hard.” And studies have shown that most older Americans prefer to age in place and that being able to remain in their homes has many benefits (Binette and Vasold 2018; Feldman et al. 2004). Additionally, 61 percent reported that they were more likely to pass their home on to a descendant. And about 32 percent reported that the repairs had reduced their bills, making their homes more affordable (CIAC 2023:25–26).
These findings matter because on the one hand, homeowners in Black and lower income areas generally have far less access to home repair aid. They have the lowest home values—in our case, often averaging less than $75,000—leaving them with little equity to tap for financing repairs. 19 And they are disproportionately denied home improvement loans due to sagging home values (Davis et al. 2023; see also Carlin and Divringi 2018; Conklin, Gerardi, and Lambi-Hanson 2022; Ryker, Pol, and Guy 1984). As one of our interviewees from the Penrose neighborhood in North City said: “[I]t’s hard to get lending in so many North City neighborhoods. [I]f you even have the credit and the income to renovate a home in some North City neighborhoods, the banks still won’t lend to you just because of what all the other homes are like.” Such disparities fuel the racial wealth gap (Moss et al. 2020). Many older homeowners count on the equity in their homes to help them through retirement. Many are still making payments on mortgages (Joint Center for Housing Studies 2023). Even very low-income homeowners have substantial equity in their homes. According to Harvard’s Joint Center for Housing Studies, in 2016, older adults with incomes below $15,000 had on average $80,000 in home equity, compared to only $9,000 in nonhousing wealth (Joint Center for Housing Studies 2018:6). 20 Home equity is severely threatened when home repair problems are not addressed.
Home repair aid by itself cannot reverse the legacy of home equity deficits stemming from redlining and disinvestment. And more research is needed to understand the conditions under which repairs might translate into equity gains. But our findings suggest that repair aid can potentially be leveraged—alongside more far-reaching solutions, such as overhaul of appraisal practices (Howell and Korver-Glenn 2018)—as a pragmatic countermeasure to protect equity for homeowners in vulnerable, disinvested communities. Indeed, 72 percent of our respondents reported that their home, after repair, was now “a lot more valuable” or “somewhat more valuable” as a financial asset to them and their family (CIAC 2023:25).
Conclusion: Building a Local Housing Knowedge Infrastructure to Focus on Housing Deterioration
Housing deterioration needs more public attention and resources. A recent comprehensive report on housing deterioration concluded that home repair programs for low-income households are “uniformly under-resourced” (Martin et al. 2024:ii). Funding for home repairs in St. Louis—and most other cities—do not come close to meeting the need. 21 The wait for the city’s main home repair program is two years or more. Our local partners told us that they usually only have enough funds to address the most dangerous problems, leaving most repair needs untouched.
In this article, we argue that housing deterioration attracts relatively little attention from policymakers and the public in part because of the lack of data and full understanding of its impact on people’s lives. The main national database on housing quality, the AHS, is deeply flawed. To address these flaws, we advocate research designs that improvise local knowledge production—that is, research designs that leverage the knowledge-making power of local communities and standardize measurements to track the phenomena, eliciting new data inputs, revealing hidden facets of problems, generating actionable findings, and gauging the impact of solutions.
By pursuing a community-driven approach, our study offers new perspective on housing deterioration as a problem that requires public attention . First, it provides a more accurate view of housing deterioration’s grave toll. Older and lower income homeowners, many of them people of color, confront a daunting backlog of repair problems and costs. But our findings show that the costs of housing deterioration go beyond just the dollar amounts it would cost to correct the physical problems. Housing deterioration poses a serious threat to the social, financial, physical, and mental health threat of residents and communities. Our study makes clear that the costs of not fixing this problem are inescapable. Society pays for these harms, whether in the form of additional expenditures by Medicare and Medicaid, reduced neighborhood home values, or reduced tax revenues for city governments and schools.
Our research documents housing deterioration down to the neighborhood level, showing how it is a legacy of place-based disadvantage. As we documented, the costs of housing deterioration are widespread but unequally distributed across neighborhoods. Housing deterioration is a case of environmental injustice organized along lines of race and class (Bartram 2023). Therefore, the task of fixing this problem cannot be separated from the broader aim of dismantling spatial and environmental inequities.
Our findings also suggest that housing deterioration is not just an effect of poverty but also a cause of poverty. Figure 5 shows the feedback effects of housing deterioration that undermine the economic health of households. 22 Many homeowners cannot pay for routine maintenance, creating a cascade of more expensive problems. 23 Failure to fix a small hole in the roof can lead to water damage that will eventually require the replacement of the entire whole roof or more, draining household wealth. Although poverty is the major cause of housing deterioration, it has its own effects on economic well-being and needs to be addressed in its own right by dedicated programs and policies.

Feedback effects of housing deterioration.
Our research has brought more visibility to the issue of housing deterioration in St. Louis and has helped to expand and reform the local home repair ecosystem. Our research helped to jumpstart the Home Repair Network (HRN), a coalition of 13 home repair providers working to spread best practices, reform the fragmented home repair system, and advocate for more funding. 24 HRN has since received start-up grants from local foundations to hire staff and provide free legal advice to homeowners receiving home repairs to clear title and make it easier for them to pass on household wealth to future generations. HRN focuses on owner-occupied housing. Another group in St. Louis, Transforming Tenants for Greater St. Louis, has emerged to address deterioration in multifamily rental housing. In 2022, it conducted a study of the extent and distribution of repair needs in rental housing. 25 They have helped to pass ordinance in the City of St. Louis that requires landlords to have at least one room in every unit that does not exceed 85 degrees. 26 An ordinance has also been introduced to address mold.
Clearly, it would help if there was a national public data set on housing deterioration. The AHS could add a series of questions, like our survey, using people’s experience of their home to identify specific repair scenarios. This is highly unlikely. First, it would be very expensive and time-consuming for the Census Bureau to construct and implement such a survey, as argued previously. It would add considerable length to the already long AHS questionnaire. More importantly, any national survey would have serious weaknesses. Unless the sample was very large, it could not document the problem down to the city or neighborhood level, which we argue is essential for local understanding and advocacy. Moreover, as we have shown, housing deterioration varies across and within metropolitan areas, and important dimensions of the problem cannot be addressed by closed-ended survey questions.
In place of a national data set on housing deterioration, local knowledge infrastructures need to be constructed to document the problem with all its local variation and qualitative richness. Clearly, housing deterioration lacks the knowledge infrastructure that has grown up around other problems. One example of the latter is the Opportunity Insights Project at Harvard, which has compile an anonymized IRS data set on 20 million Americans that can isolate place effects on important life outcomes. 27 Another example is the Princeton Eviction Lab, which has amassed a data set on evictions in every county in the United States between 2000 and 2018. 28 In the latter case, considerable variation across cities in eviction procedures required the researchers to work with local partners to collect the data. Both demonstrate the power of data to bring urgent housing issues into public view and stimulate action. 29
We believe our approach of engaging with local actors to build local knowledge infrastructures via pragmatic means can help catalyze efforts to document the problem of housing deterioration, raise public awareness, and point the way to action. Such an approach could be useful in addressing other problems where national data are missing, where they fail to capture local variation, or where they otherwise underutilize local capacities necessary to understand the problem. The two aforementioned examples (the Eviction Lab and the Opportunity Insights Project) were expensive. Both secured funding from wealthy private charitable enterprises. Relative to the convenience of using one large database, building multiple new ones in hundreds of cities would be costly and labor-intensive. Fortunately, localities do not need to invent the wheel. We have constructed an approach that other localities could try and, importantly, improve. We deliberately chose an approach that does not require a large budget. Mail-in surveys and qualitative interviews are not very expensive, but they do require researchers skilled in survey research and qualitative interviewing.
Importantly, the approach detailed in this article requires researchers who are open to and skilled at engaging with local community partners. Many academic researchers are not used to having their research agenda shaped by local partners. In our case, this engagement frequently led us to change our questions and tactics, including several key choices: to add effective air conditioning as a necessary feature, to measure deterioration external to the house, and to conduct qualitative interviews for additional insight into the effects of home repairs. Initially, our community partners were skeptical that home repairs could be captured by standardized home repair “scenarios.” Ultimately, we convinced them that standard categories were necessary to measure deterioration and make it more visible to the public. At the same time, we changed the way we defined certain scenarios and estimated costs in response to feedback from partners. For example, they told us we needed to substantially increase cost estimates for replacing a roof from the initial estimates we had taken from the contractors’ database. We changed that estimate to a level our partners thought was reasonable for St. Louis.
Increased large-scale funding, whether by the federal government or national foundations, could seed local initiatives and help to build a national learning network of housing deterioration researchers skilled in working with local communities. The funding would focus on providing resources and personnel necessary to build an alternative knowledge production infrastructure. We have begun this process by posting a Home Repair Toolkit online with files documenting our methodology, including a sample questionnaire, a sampling plan, and a cost-estimating tool that automatically calculates costs based on survey answers. 30 We stress that this is only a start. Much more work is needed to improve going forward. 31 Such efforts to produce useful knowledge constitutes only one step on the long road of addressing housing deterioration and its human costs. It is, nevertheless, an important step.
Supplemental Material
sj-docx-1-srd-10.1177_23780231241303194 – Supplemental material for Pragmatic Knowledge Production: Bringing the Problem of Housing Deterioration into Focus
Supplemental material, sj-docx-1-srd-10.1177_23780231241303194 for Pragmatic Knowledge Production: Bringing the Problem of Housing Deterioration into Focus by John N. Robinson and Todd Swanstrom in Socius
Supplemental Material
sj-docx-2-srd-10.1177_23780231241303194 – Supplemental material for Pragmatic Knowledge Production: Bringing the Problem of Housing Deterioration into Focus
Supplemental material, sj-docx-2-srd-10.1177_23780231241303194 for Pragmatic Knowledge Production: Bringing the Problem of Housing Deterioration into Focus by John N. Robinson and Todd Swanstrom in Socius
Supplemental Material
sj-docx-3-srd-10.1177_23780231241303194 – Supplemental material for Pragmatic Knowledge Production: Bringing the Problem of Housing Deterioration into Focus
Supplemental material, sj-docx-3-srd-10.1177_23780231241303194 for Pragmatic Knowledge Production: Bringing the Problem of Housing Deterioration into Focus by John N. Robinson and Todd Swanstrom in Socius
Supplemental Material
sj-docx-4-srd-10.1177_23780231241303194 – Supplemental material for Pragmatic Knowledge Production: Bringing the Problem of Housing Deterioration into Focus
Supplemental material, sj-docx-4-srd-10.1177_23780231241303194 for Pragmatic Knowledge Production: Bringing the Problem of Housing Deterioration into Focus by John N. Robinson and Todd Swanstrom in Socius
Supplemental Material
sj-docx-5-srd-10.1177_23780231241303194 – Supplemental material for Pragmatic Knowledge Production: Bringing the Problem of Housing Deterioration into Focus
Supplemental material, sj-docx-5-srd-10.1177_23780231241303194 for Pragmatic Knowledge Production: Bringing the Problem of Housing Deterioration into Focus by John N. Robinson and Todd Swanstrom in Socius
Supplemental Material
sj-docx-6-srd-10.1177_23780231241303194 – Supplemental material for Pragmatic Knowledge Production: Bringing the Problem of Housing Deterioration into Focus
Supplemental material, sj-docx-6-srd-10.1177_23780231241303194 for Pragmatic Knowledge Production: Bringing the Problem of Housing Deterioration into Focus by John N. Robinson and Todd Swanstrom in Socius
Footnotes
Acknowledgements
We thank Kiley Bednar, Adam Brown, Rachel Goldmeir, Terry Jones, Cynthia Palazzolo, and the research team at University of Missouri-St. Louis Community Innovation and Action Center for their relentless work on this project. We thank the Vacancy Collaborative for inspiring this study. We thank Eileen Divringi and Keith Wardrip (Federal Reserve Bank of Philadelphia) for helpful feedback. Finally, we thank our nonprofit partners who made this research possible: Mission St. Louis (Todd Martin), Rebuilding Together-St. Louis (Jessica Klostermann and Elaine Powers), City of St. Louis Community Development Agency (Bill Rataj), the Urban League of Metropolitan St. Louis (Paula Carey-Moore), Beyond Housing (Vik Bijanki and Wayne Holland), the St. Louis Association of Community Organizations (Kevin McKinney), and the Legal Services of Eastern Missouri (Peter Hoffman and Matt Ampleman).
Authors’ Note
John N. Robinson III and Todd Swanstrom share equal authoriship.
Funding
The author(s) disclosed receipt of the following financial support for the research, authorship, and/or publication of this article: We thank the RRF Foundation for Aging and the St. Louis City Senior Fund for generously supporting this study.
Supplemental Material
Supplemental material for this article is available online.
Notes
Author Biographies
References
Supplementary Material
Please find the following supplemental material available below.
For Open Access articles published under a Creative Commons License, all supplemental material carries the same license as the article it is associated with.
For non-Open Access articles published, all supplemental material carries a non-exclusive license, and permission requests for re-use of supplemental material or any part of supplemental material shall be sent directly to the copyright owner as specified in the copyright notice associated with the article.