
Abstract
In recent years, housing costs have outpaced incomes in the United States, resulting in millions of eviction filings each year. Yet no study has examined the link between eviction and voting. Drawing on a novel data set that combines tens of millions of eviction and voting records, this article finds that residential eviction rates negatively impacted voter turnout during the 2016 presidential election. Results from a generalized additive model show eviction’s effect on voter turnout to be strongest in neighborhoods with relatively low rates of displacement. To address endogeneity bias and estimate the causal effect of eviction on voting, the analysis treats commercial evictions as an instrument for residential evictions, finding that increases in neighborhood eviction rates led to substantial declines in voter turnout. This study demonstrates that the impact of eviction reverberates far beyond housing loss, affecting democratic participation.
The voting rate in the United States trails behind most advanced democracies. Roughly 56 percent of the voting-age population cast ballots in the 2016 US presidential election, a substantially lower turnout than in national elections around that time in Australia (79 percent), South Korea (78 percent), Germany (69 percent), and several other nations. 1 The United States is also defined by much higher levels of inequality than other rich nations, and the two factors are not unrelated. Researchers have shown that poor Americans vote at significantly lower rates than citizens with more financial resources, 2 leaving disadvantaged communities underserved by elected officials who are incentivized to work on behalf of economically advantaged constituents. 3
Participatory inequality in America is driven in large part by disparities across social environments. Neighborhoods with higher rates of concentrated poverty and incarceration, for example, display lower levels of political participation. 4 Yet no study has analyzed the link between eviction and voting. This oversight is concerning, as housing costs have significantly outpaced incomes in recent years, resulting in more than 3 million residential evictions being filed in a typical year in the United States. 5 Involuntary housing loss increases families’ material hardship and neighborhood instability, 6 factors shown to be determinants of political participation. 7
Drawing on tens of millions of administrative records from several states, we find a strong, negative relationship between eviction and voter turnout rates in the 2016 presidential election. This finding is robust across several alternative specifications and sample restrictions, and it is replicated in a county-level analysis focused on the 2012 presidential election. Results from a generalized additive model show, surprisingly, that eviction’s effect on voter turnout was strongest in neighborhoods with relatively low rates of displacement. To address endogeneity bias and estimate the causal effect of eviction on voting, we treat commercial evictions (the legal repossession of property used as a business) as an instrument for residential evictions. Trends in commercial evictions are not directly related to voter turnout but are strongly associated with residential evictions, as both forms of displacement are influenced by the dynamics of housing markets. The results of our instrumental variables (IV) analysis present new causal evidence that a neighborhood’s residential eviction rate reduces its voter turnout rate.
This study contributes to our understanding of the social determinants of political behavior, identifying how the unabated eviction crisis affects voter turnout. Our findings demonstrate that any account of the ecological determinants of political participation is incomplete without attending to the role of renters’ forced mobility. Because eviction disproportionately affects low-income neighborhoods, as well as those with predominantly Black and Hispanic populations, 8 our results have troubling implications for participatory inequality.
Voting in a Time of Residential Instability
Living in a disadvantaged community can dampen the civic life of all residents. Cathy Cohen and Michael Dawson document the negative consequences of neighborhood-level poverty and social isolation for political action. 9 Traci Burch identifies the spillover effects of mass incarceration, finding “a strong vicarious effect” on voter participation for neighbors uninvolved with the criminal legal system. 10 Matthew Desmond and Adam Travis reveal how political quiescence may emerge, even for individuals with prior histories of political participation, as a product of living in a community where exposure to trauma and disadvantage is common. 11
Residential stability is fundamental to fostering an environment that promotes civic engagement. Stable neighborhoods allow longtime residents to form social ties and invest in shared goals, often leveraging the political system to do so. Unstable neighborhoods, characterized by high levels of residential churn, compromise the emergence of collective efficacy—that combination of neighborhood-based social cohesion and a synergistic investment in the common good. 12 Studies have documented active political participation in poor—but stable—communities that witnessed low levels of residential turnover, from ethnic slums in Northern cities during the interwar years to rural hamlets in the Deep South during the Civil Rights era. 13
In recent years, however, residential instability has emerged as a defining characteristic of low-income communities. Nationwide, median asking rent more than doubled over the last two decades. All regions of the country have experienced a surge in rents. 14 Housing costs have significantly outpaced wages, while federal housing assistance services a minority of poor households. 15 Consequently, the majority of renting households below the poverty line (52 percent) spend at least half of their income on housing, with one in four of those households (26 percent) spending more than 70 percent of their income on shelter costs alone. 16 Rising housing costs have placed millions of low-income families at risk of eviction. Newly released national data find that in 2016, 3.7 million residential eviction cases were filed nationwide, representing just over 8 eviction cases per 100 US renter households. 17
Despite these trends, researchers have not analyzed how residential eviction rates may affect political participation across neighborhood contexts. Studies have found that neighborhoods impacted by the foreclosure crisis experienced lower-than-expected voter turnout, 18 but since that time the number of residential evictions filed in an average year far exceeds the number of foreclosure starts at the height of the recession. 19 For renters in low-income communities, the housing crisis has not abated.
We theorize that residential eviction rates may depress voter turnout by shaping three neighborhood conditions: (1) material hardship; (2) social isolation and community disinvestment; and (3) government cynicism. First, forced mobility exacerbates material hardship within neighborhoods. Residents working to avoid eviction and those confronting adversity that follows displacement (e.g., homelessness, job loss) may deprioritize political participation to focus on more immediate needs. 20 Renters facing eviction may also strain the resources of their neighbors—by asking them for monetary assistance or requesting shelter 21 —creating spillover effects that ripple away from a displacement home to surrounding members of the community. 22 Those effects are not likely to dissipate if evicted families leave the neighborhood, as studies have shown that residential eviction, like crime and concentrated poverty, tends to persistently affect specific neighborhoods across time. 23 This implies that outmigration caused by eviction often does not result in subsequent neighborhood uplift or stability because evicted renters are typically replaced with renters also at high risk of eviction, on account of both their financial precarity and their landlords’ proclivity to evict.
Second, eviction may deplete the social cohesion of a neighborhood. Residential churn within a community may severely weaken the power of local networks, known conduits for political participation. 24 Long-term residency in a community can foster trust between neighbors and shared expectations. This can spur political action, as when neighbors gather to host a political fundraiser or carpool to a school board meeting. 25 Areas disrupted by eviction, on the other hand, can breed social isolation and mistrust, severing neighborhood ties and triggering instability, which may dampen political engagement. 26 Just as flags and campaign posters may encourage neighbors to connect and engage, the frequent sight of eviction notices or a family’s effects piled on the curb may turn residents inward and induce community disinvestment, resulting in residents considering themselves to be “in but not of the neighborhood.” 27
Third, eviction may breed government cynicism. Studies have shown that residents of highly policed communities often view the government negatively. 28 Even light contact with the criminal legal system, like being stopped by a police officer or jailed for a misdemeanor offense, may decrease one’s likelihood of voting. 29 Similarly, experiencing or witnessing eviction may result in a “civic penalty” and discourage political action. When filing for eviction, property owners activate the state. A court issues an eviction notice; a judge hands down an eviction judgment; and armed law enforcement officers execute writs of restitution, physically removing families from their homes. As such, residents of high-eviction communities may come to see the government more as a disciplinary force than as a democratic institution.
Data
This study evaluates the relationship between residential eviction and voting rates in Census tracts. Focusing on voter turnout during the 2016 presidential election, we combine two large administrative data sets: records of court-ordered evictions from the Eviction Lab and of registered voters compiled by Labels and Lists (L2). 30
Studies have shown that survey research underestimates eviction and overestimates voting. Household survey samples often exclude recently evicted families, a hard-to-reach population, and phrase questions about eviction in a narrow way, resulting in underreporting. Studies based on court-ordered eviction records produce more accurate estimates of eviction than those reliant on self-reports. 31 Postelection surveys, on the other hand, regularly overestimate voter turnout. In the American National Election Study, for example, 77 percent of respondents said they voted in the 2008 presidential election, but government statistics reported a 62 percent turnout rate. 32 Researchers have increasingly relied on voting records to provide a more accurate picture. 33 Accordingly, we rely on tens of millions of administrative eviction and voting records that are not subject to misreporting or recall bias. In so doing, we are able to produce findings that generalize to a large pool of American communities, including urban and rural locales, red and blue states, and high- and low-cost housing markets. 34 This increases confidence in our results, since significant variation exists in electoral context and housing security, both within and between states.
Analytic Sample
We obtained 82 million records of court-ordered evictions that occurred in forty-eight states and the District of Columbia between 2000 and 2016. Procured from state and proprietary vendors, records were cleaned, stripped of duplicates and serial cases, geocoded, and validated against publicly available data sources published by county and state court systems. 35 To estimate how neighborhood-level residential eviction rates influenced voter turnout, we aggregated evictions to the Census-tract level. We employed the Eviction Lab’s guidelines when excluding areas with poor data coverage. This entailed omitting tracts considered to have underestimated and overestimated eviction rates. 36
We aggregated L2’s 2017 individual-level voter files from every state to construct a national file containing more than 183 million registered voters and reporting 132 million votes in the 2016 election. We dropped observations from the voter file where the address information was incomplete and lacked a Census tract assignment and those assigned to tracts that did not match with a county’s Federal Information Processing Standards (FIPS) code (1 percent of reported votes). In addition, we excluded Census tracts where voter turnout and/or the Citizen Voting Age Population (CVAP) were reported to be either zero or above 100 percent, as both conditions lacked face validity (0.66 percent of reported votes). Compared to the United States Election Project national estimate, 37 reported by state boards of elections, our cleaned version of L2’s voter file captures 94 percent of ballots cast in the 2016 election.
Merging the voting and eviction records yielded a sample of 31,943 Census tracts drawn from thirty-five states. Our analysis primarily relies on a subset of observations from nineteen states and 7,166 Census tracts, where eviction data are available for three consecutive years (2013–15): Alabama, Colorado, Delaware, Florida, Georgia, Iowa, Kentucky, Massachusetts, Michigan, Minnesota, Missouri, Nebraska, North Carolina, Ohio, South Carolina, Texas, Utah, Virginia, and Wisconsin. 38 We supplement this analysis with an examination of evictions that occurred in a single year (2015), which uses 12,907 Census tracts from twenty-four states, adding Illinois, Kansas, Maine, Rhode Island, and Washington to the above-mentioned states. Our analytic samples include Census tracts with ample variation in voter turnout rates and eviction rates. In our nineteen-state sample, eleven states have eviction rates above and eight states have rates below the nationwide median eviction rate, and thirteen states have voting rates above and six states have rates below the nationwide median voting rate. In our twenty-four-state sample, twelve states have eviction rates above and twelve states have rates below the nationwide median eviction rate, and sixteen states have voting rates above and eight states have rates below the nationwide median voting rate. We incorporate aggregate-level data from the American Community Survey (ACS) five-year estimates (2013–17), including information on the demographic composition, housing conditions, and material disadvantage in neighborhoods.
Our interest in neighborhood effects led us to construct an analytic sample that operationalizes eviction and voter turnout rates using Census tracts, which do not align with political boundaries such as congressional districts. Sociological studies commonly rely on Census tracts as neighborhood proxies because they contain “smaller and more socially homogeneous areas” and “attempt to take into account major streets, parks, and other geographical features” 39 and have boundaries “selected by resident committees to reflect local opinions about neighborhood borders.” 40 Census tract data provide useful approximations of neighborhoods while avoiding measurement challenges associated with smaller levels of aggregation. Our main analyses explore voter turnout rates in neighborhoods (tracts) rather than in electoral jurisdictions (precincts).
Measures
Dependent variable
Our outcome is a Census tract’s voter turnout rate in 2016. The voting rate’s numerator is the total number of votes recorded in a Census tract. Its denominator is the Citizen Voting Age Population (CVAP), drawn from the ACS five-year estimates (2013–17). 41 Using an external data source for the denominator reduces the potential bias associated with conditioning on the pool of registrants. 42
Explanatory variables
To assess the consequences of forced mobility on voter participation, we rely on two measures: a neighborhood’s residential eviction filing rate and its residential eviction rate. The eviction filing rate reports the number of eviction proceedings initiated in a neighborhood over the number of households in that neighborhood, drawn from the ACS five-year estimates. The eviction rate reports the number of eviction judgments (orders to vacate) in a neighborhood over the number of households in that neighborhood. 43 Our main results use eviction and eviction filing rates averaged across three years (2013–15) to reduce possible unit noise. We also estimate models using a one-year rate (2015) as a robustness check on the three-year modeling strategy and to assess eviction’s influence in the year prior to the election.
Using both residential eviction measures helps to clarify how displacement affects voter turnout. If the eviction filing rate more strongly predicts turnout, this suggests an adverse relationship between the threat of displacement and democratic participation. On the other hand, if the eviction rate is more predictive of lower turnout, this suggests actual forced moves drive participatory inequalities. Our models omit tracts where the eviction filing rate or eviction rate was zero during the three-year period. 44
Control variables
To account for neighborhood-level characteristics known to affect both voting and eviction, we observe several tract-level measures drawn from the ACS five-year estimates. Keeping with past research, we include demographic information on poverty, race, gender, education, and age. 45 We constructed these measures as follows: the official poverty rate; percent Black, percent Hispanic, percent Asian, percent other, and percent white (reference group); percent female; and percent with bachelor’s degrees. Age cohorts exercise different levels of civic participation. 46 Accordingly, we calculate four percentage shares among the voting-age population within a Census tract: 18–24 years; 25–34 years; 35–44 years; and 45 years and older (reference group). 47 We additionally account for the percentage of households with public assistance income and for the share of naturalized citizens in neighborhoods. Last, to adjust for variation related to the neighborhood environment, we control for national percentile rank of the neighborhood’s population density.
To control for housing-related conditions in neighborhoods, we include five additional measures. First, we control for the percentage of residents in group quarters (e.g., nursing home residents, college students), as those residents vote at lower rates. 48 Second, we observe the percentage of renter-occupied households, capturing any distinct compositional influence stemming from the percentage shares of renters and homeowners. 49 Third, we control for the percentage of vacancies, accounting for the influence of unoccupied residences in communities, which may deplete networks or signal disinvestment. 50 Fourth, we observe the percentage of newer occupied units, those built after 2013. Newer housing developments may signal neighborhood transition, which has the capacity to influence both eviction and electoral turnout. 51 Finally, we construct a measure of general residential instability, which captures the percentage of occupied housing units with residents who moved into their units after 2014. Doing so allows an assessment of the effect of forced mobility, net of general residential mobility.
Fixed effects
We include county fixed effects in all ordinary least squares and generalized additive models. Doing so controls for unobserved variation in local governments’ policies that may influence both eviction and voting. These include housing laws (typically overseen by state and county courts) and electoral statutes and practices.
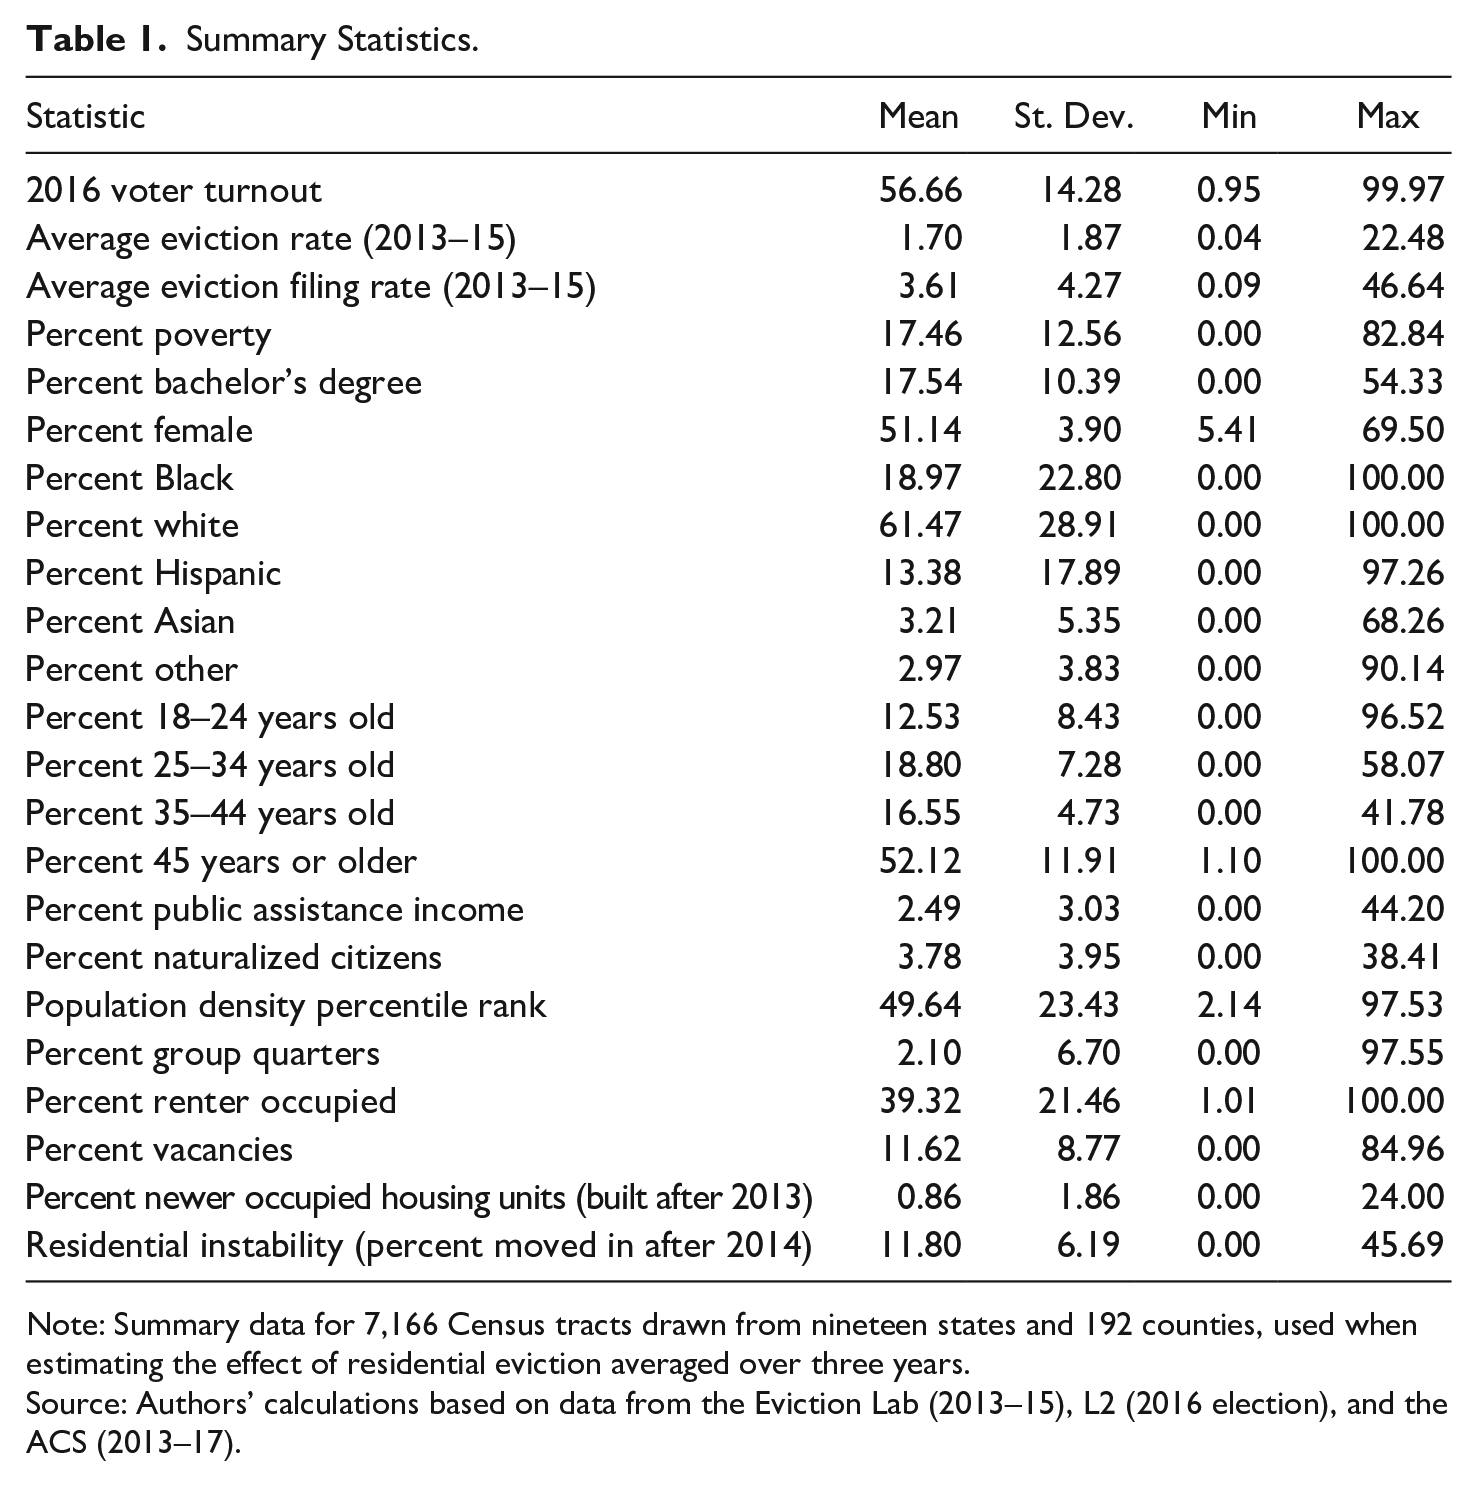
Table 1 provides descriptive statistics of these variables. In our sample, the average neighborhood has a 56.66 percent voter turnout rate and a 1.70 percent eviction rate. There is, however, considerable variation in voter turnout (from 0.95 to 99.97 percent) and eviction rates (0.04 to 22.48 percent) across neighborhoods. Table A.4 in the online appendix provides descriptive statistics on the analytic sample used for our one-year model.
Summary Statistics.
Methods
To assess the influence of a neighborhood’s average eviction rate between 2013 and 2015 on its voter turnout rate during the 2016 election, we leverage three approaches: multiple linear regression with fixed effects (i.e., ordinary least squares [OLS]), a generalized additive model (GAM), and IV estimation. Both OLS and GAM models rely on the same identification strategies, but they differ in their functional form. An OLS model assumes linearity across neighborhood contexts, such that raising the residential eviction rate from 1 to 2 percent has the same effect on voting as raising it from 5 to 6 percent. Instead of presuming linearity, generalized additive models intuit the shape of the response curve from the data themselves, uncovering potentially important variation in effect sizes across different social contexts. 52
For selection-on-observables, we employ two models to estimate the effect of residential eviction rates on voter turnout. Our OLS model takes the following form:

Here,
Our GAM takes the following form:

In this equation, we estimate the conditional association between each predictor and the outcome using smoothing splines, indicated by
The above models account for several demographic and socioeconomic neighborhood conditions associated with both eviction and voting and control for potentially relevant time-invariant, unobserved factors by employing county fixed effects. However, these models do not overcome two kinds of bias that complicate causal estimation. First, it is possible that we have omitted a critical variable steering both eviction and voting. If a city’s economic outlook improves, for example, that could lower the eviction rate and increase the voting rate, but not necessarily because the former influenced the latter. Second, our models could also be troubled by simultaneity bias if voter turnout also influences the eviction rate. For example, if unrepresentative voter turnout in local elections results in the appointment of a legislative body that lowers barriers to eviction, which in turn increases a municipality’s eviction rate, that would reflect a situation in which voter turnout affects eviction, not the other way around.
To address endogeneity and simultaneity bias, we employ an IV approach. Specifically, we use the incidence of commercial eviction as an instrument for the residential eviction rate. 54 Studies that examine eviction tend to focus exclusively on residential eviction: the legal repossession of a tenant’s apartment. But commercial establishments are also evicted, although at far lower rates than renter households. Trends in commercial and residential evictions should be closely related, since they are guided by overarching dynamics in housing markets, but unlike residential evictions, commercial evictions should not have a direct effect on voter participation.
We classified an eviction case as “commercial” if one or more defendants were identified as a business or restaurant, making use of commercial indicator variables in the eviction records, included in the raw data for 97.3 percent of cases. We supplemented this approach using regular expressions that assessed if defendant names included keywords associated with businesses (e.g., LLC, Laundry, Pizza). We validated the second method by comparing its results to the first method, finding significant agreement. However, our regular-expressions approach allowed us to identify roughly 223,000 cases where commercial indicators were unavailable.
We created a commercial eviction rate by placing all commercial evictions in a neighborhood over the number of households, as reported by the ACS five-year estimates. Our IV analysis includes Census tracts for which the commercial eviction rate was recorded for three consecutive years (2013–15). Excluding tracts unaffected by commercial eviction yielded a data set of 2,311 neighborhoods from eighteen states. Table A.5 in the online appendix provides descriptive statistics on the analytic sample. The average included neighborhood in this sample has a higher eviction rate (2.23 percent) but a similar voter turnout rate (56.01 percent), compared to our main sample. The average commercial eviction rate in a tract is 0.04 percent, ranging from 0.004 to 0.54 percent.
The commercial eviction rate can be considered a valid instrument if it meets three criteria. 55 First, the commercial eviction rate must be relevant to our analysis, being associated with the residential eviction rate. We verify this assumption by empirically demonstrating that commercial and residential eviction rates are strongly correlated.
Second, the causes of commercial eviction must be unrelated to the causes of voter turnout rates, the exogeneity assumption. Being rare and unrelated to regular neighborhood dynamics, we argue that commercial evictions are plausibly random in relation to voter turnout in presidential elections. One possible shared cause of both commercial evictions and voter turnout is the strength of the economy, which could be inversely related to commercial evictions and positively related to voting. However, in our full sample of Census tracts with commercial evictions, the commercial eviction rate was 0.017 percent in 2007 (a boom year preceded by four years of economic growth), 0.019 in 2010 (the height of the foreclosure crisis), and 0.014 in 2015 (when the economy had recovered). Unlike other indicators (e.g., unemployment claims), the commercial eviction rate appears fairly unresponsive to broad economic trends. 56
Third, commercial evictions can only impact voting rates through their effect on the treatment variable, residential evictions. We argue that commercial evictions meet the exclusion restriction both because of their rarity and their limited impact on community dynamics. When we regress voter turnout on the average commercial eviction rate using county fixed effects and the full suite of controls, commercial eviction’s association is statistically insignificant (
Unlike our OLS and GAM approaches, the IV strategy produces a local average treatment effect (LATE) of residential evictions on voting for a subset of complier neighborhoods where the residential eviction rate is responsive to the commercial eviction rate. 61 This matters when comparing the effect size of the IV estimate and those of the OLS and GAM models, which are generated with different analytic samples and under different specifications. The IV model’s system of equations is written as follows:


The first stage of IV estimation regresses the residential eviction rate on the commercial eviction rate. The observed value for the commercial eviction rate is represented by
Results
We begin by reporting the results of fixed-effects OLS models estimating the effect of residential eviction rates and eviction filing rates on voter turnout. As part of this analysis, we assess if our results are robust to multiple model specifications and sample restrictions. We also examine how variation in the time window under evaluation bears on eviction’s influence on the voting rate, assessing if the 2015 residential eviction rate had a larger effect on voter turnout during the 2016 presidential election than the average eviction rate in a neighborhood between 2013 and 2015. We then turn to our GAM model to address nonlinearity in eviction’s influence. Our flexibly specified results identify variation in eviction’s predicted effect on voter turnout across neighborhood contexts. Last, we report the results of our IV model, presenting causal evidence on the impact of residential eviction on voter turnout.
Table 2 reports the results of multiple linear regression models estimating the influence of a neighborhood’s residential eviction rate on its voter turnout rate, net of neighborhood characteristics. 63 We use county fixed effects and robust standard errors in all models. Model 1 assesses the bivariate relationship between the eviction rate and the voter turnout rate. Model 2 includes all neighborhood-level controls potentially influencing both eviction and voter turnout, save one: residential instability. Model 3 includes this final variable to examine how the estimated effect of residential eviction changes when controlling for recent moves into a neighborhood. In the full model, a 1 percentage point increase in the residential eviction rate predicts a 0.46 percentage point drop in the voter turnout rate. 64
Ordinary Least Squares Estimates of the Effect of Residential Eviction on 2016 Voter Turnout.
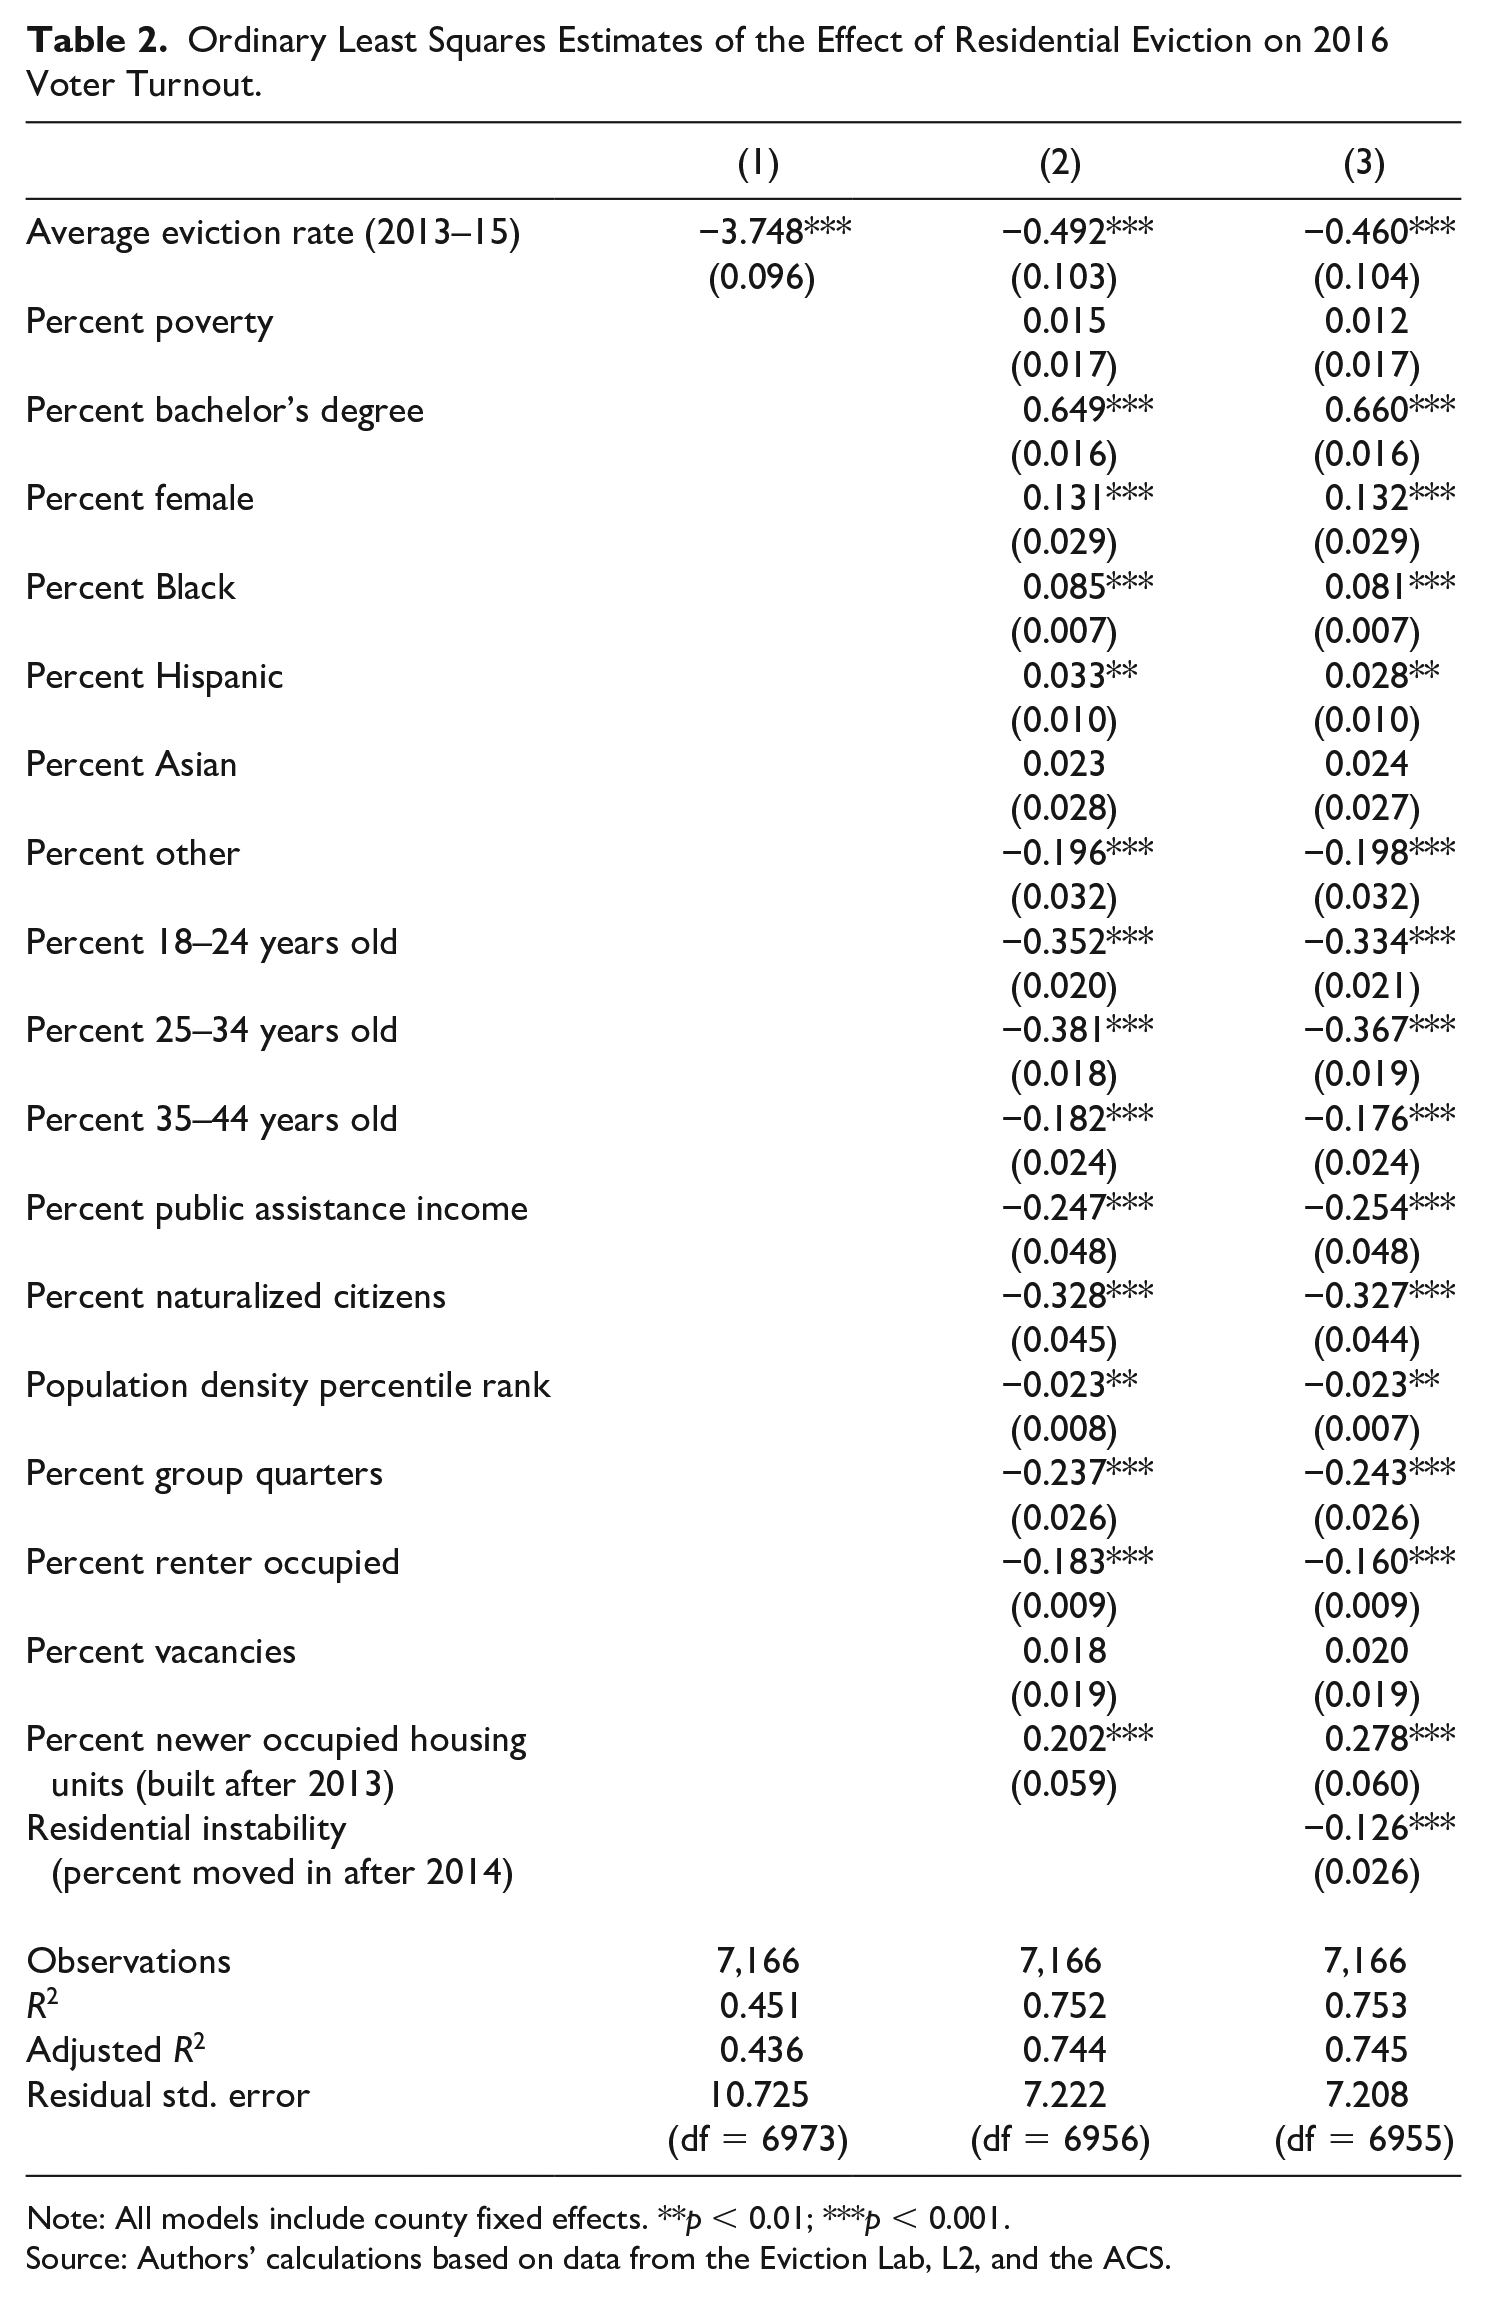
We replicated our full model using a log-transformation of the residential eviction rate, finding that a 1 percentage point increase in the mean eviction rate is associated with a 0.87 percentage point reduction in the voting rate. To enhance clarity and report more conservative results, our main analyses retain the nonlogged eviction rate. We also replicated our full model by using state fixed effects and a county-level control for 2012 voter turnout drawn from the MIT Election Data and Science Lab presidential election returns data.
65
Unsurprisingly, a neighborhood’s voter turnout in 2012 predicted its turnout in 2016 (
We additionally replicated our findings on another national election. Owing to data limitations, an exact replication was not possible. However, we were able to estimate the association between a county’s average eviction filing rate between 2009 and 2011 and voter turnout in the 2012 presidential election for 1,618 counties from thirty-six states and the District of Columbia. This analysis supports our main finding regarding the 2016 election, showing that counties with higher residential eviction filing rates experienced lower voter turnout in 2012, net of socioeconomic factors and housing-related controls (see Table A.6).
To explore the theoretical mechanisms through which renters’ housing insecurity influences the vote, we estimate separate models to test the influence of the residential eviction filing rate on voter turnout, using the same controls as in Table 2. Progressively built models of the filing rate share the same trends as are reported for the eviction rate; however, the effect of the eviction filing rate is small and imprecisely estimated in the full model (see Table A.7). This suggests that displacement itself is more significant to depressing voter turnout than the threat of displacement within a community.
Regional and Electoral Context
We conducted a series of additional robustness checks to determine if our findings held under different sample restrictions. Each model in Table 3 includes our full suite of controls and county fixed effects. First, to determine if our findings held in both urban and rural communities, we reran our model on the least and most populated tracts in our sample, defined as the bottom and top quartiles of the population density distribution. Our results replicated in both subsamples. A 1 percentage point increase in the residential eviction rate was associated with a 1.40 percentage point drop in the voter turnout rate in the least populated tracts (containing fewer than 327 people) and a 0.96 percentage point drop in the most populated tracts (containing more than 5,446 people). These results indicate that the effect of eviction on voting may be more pronounced in very rural and very urban communities.
Robustness Checks Estimating the Effect of Residential Eviction on 2016 Voter Turnout.
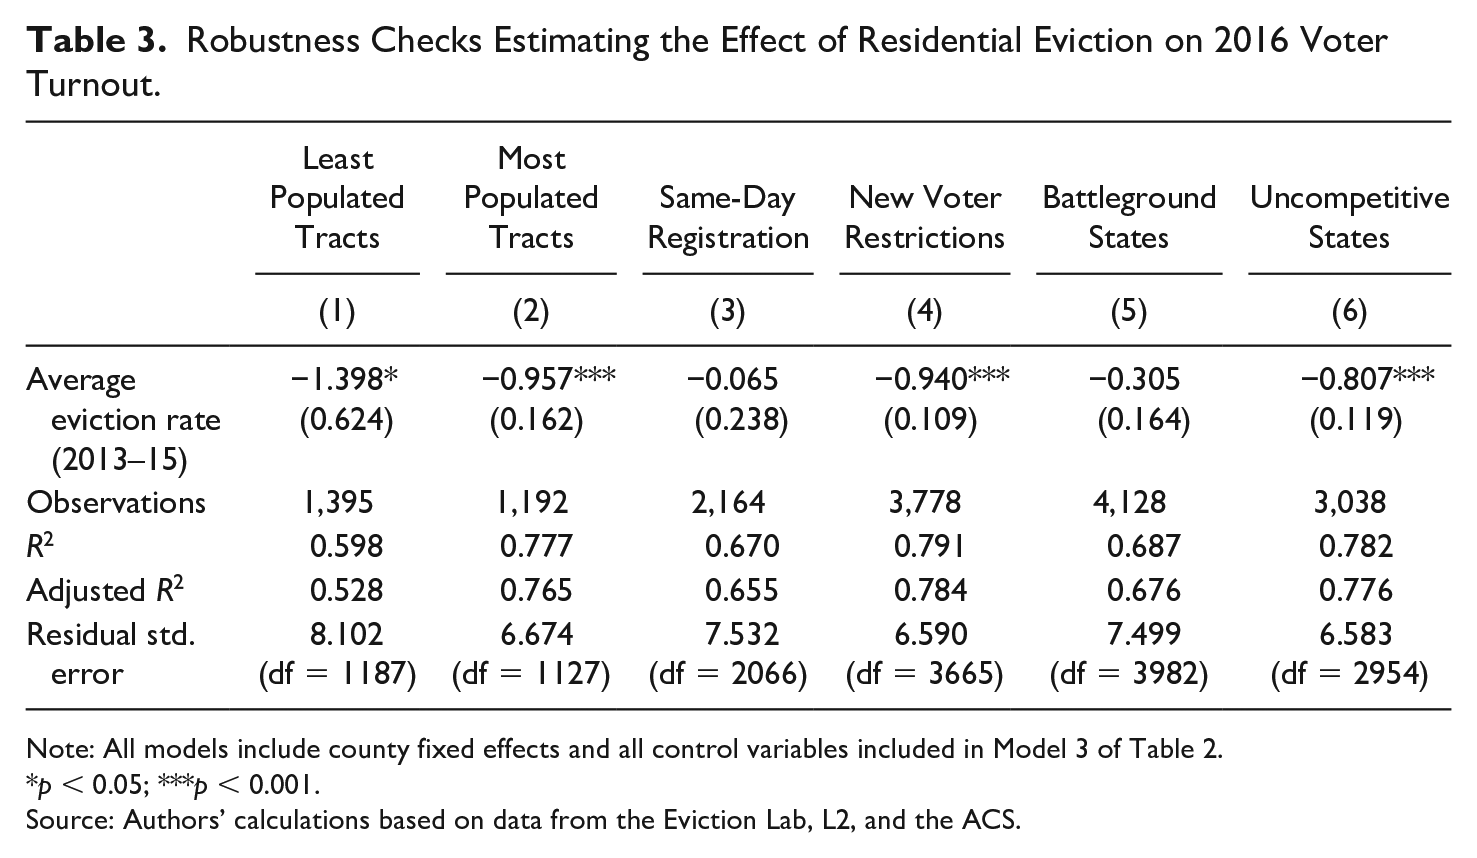
Next, we examined if our results were affected by the electoral policies of different states. Seven states in our three-year sample—Alabama, Nebraska, Ohio, South Carolina, Texas, Virginia, and Wisconsin—implemented new voting requirements in the run-up to the 2016 election. 66 These requirements, which include new photo ID requirements and voter registration restrictions, have been shown to depress voter turnout, particularly among populations disproportionately likely to live in high-eviction neighborhoods, including low-income, Black, and Hispanic voters. 67 The size of the association between eviction and voter turnout doubles in states with such voter restrictions.
On the other hand, five states in our sample—Colorado, Iowa, Minnesota, North Carolina, and Wisconsin
68
—allowed voters in 2016 to register and vote on the same day and/or Election Day.
69
As opposed to voter identification requirements, same-day and Election Day registration have been shown to boost voter turnout, including among disadvantaged populations.
70
We find that in states that allow for same-day registration, the effect between eviction and voting, although still negative, is statistically insignificant. (In states without same-day registration, the effect remains negative and significant:
Last, we examine if eviction’s relationship with voter turnout varies across states, depending on the level of competition. Studies have shown voter turnout to be higher in battleground contexts.
71
To examine if overall increased political participation was enough to erase eviction’s association with voting, we replicated our model in a sample limited to nine battleground states: Colorado, Florida, Iowa, Michigan, Minnesota, North Carolina, Ohio, Virginia, and Wisconsin. Each of these states either flipped between supporting the Democratic or Republican nominee at least once in the previous three presidential elections or was decided in the 2016 election by less than 2 percentage points. In battleground states where the election was hotly contested, the relationship between eviction and voter turnout is negative but marginally imprecise (
Temporal Variation
Next, we investigate how the temporal period under evaluation influences our results. Specifically, we are interested in exploring if evictions that occurred closer to the 2016 presidential election had a more pronounced effect on voter turnout than a neighborhood’s average eviction rate in the three years prior to the election. Figure 1 displays the results of a linear regression that examines the effect of a neighborhood’s eviction rate in 2015 on voter turnout in the 2016 national election, accounting for our full suite of controls and including county fixed effects. Our results indicate the eviction rate nearer to the election exercised a greater influence on voter turnout. In the one-year model, a 1 percentage point increase in the eviction rate predicts a 0.56 percentage point drop in a neighborhood’s voter turnout rate.
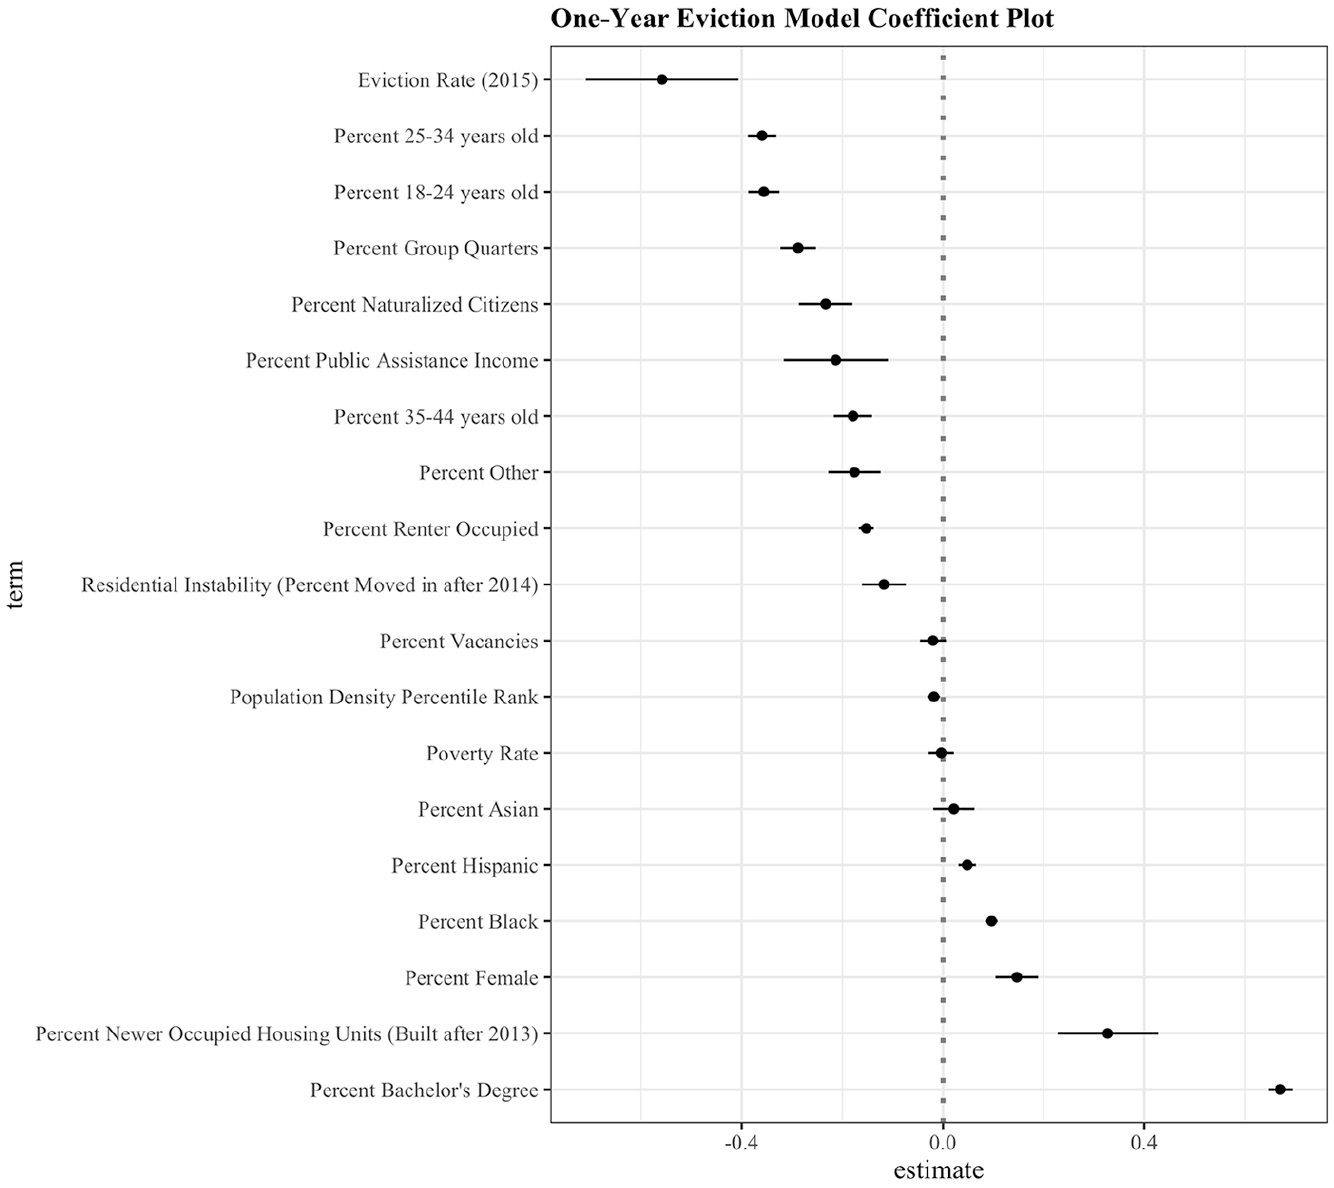
Coefficient plot generated using linear regression with county fixed effects. We regress neighborhood-level voter turnout rates on one-year (2015) eviction rates, maintaining all previous controls (n = 12,907).
Given the volume of previous work on the importance of race, age, and income with respect to predicting political participation, 72 not to mention other housing-related characteristics like homeownership and general residential mobility, 73 it is notable that the effect of a neighborhood’s 2015 eviction rate on its 2016 voter turnout rate is larger than the associations reported for a neighborhood’s poverty rate, age composition, racial makeup, percentage of renter households, or general residential mobility caused by all voluntary and involuntary moves. As Figure 1 indicates, the only other association that matches eviction’s influence on voter turnout is the percentage of individuals with bachelor’s degrees, which exceeds the effect of the eviction rate by less than one-tenth of a percentage point.
Neighborhood Variation
The residential eviction rate fluctuates considerably across neighborhoods. Some communities regularly experience high rates of displacement; for others, eviction is rare. To empirically assess potential nonlinearity in eviction’s influence on voter turnout across different types of neighborhoods, we employ a generalized additive model.
Figure 2 plots predicted neighborhood-level voter turnout rates, as a population average potential outcome, against set neighborhood-level eviction rates. 74 The rug on the x-axis plots the distribution of the observed data, and vertical lines mark the quartile splits in the observational data. A neighborhood falls in the first quartile if its eviction rate is below 0.45 percent. The second quartile contains neighborhoods with eviction rates greater than 0.45 percent but less than or equal to 1 percent. The third quartile contains neighborhoods with rates between 1 and 2.25 percent. The fourth quartile includes tracts with rates above 2.25 percent. The average marginal effects, marked as slopes in Figure 2 for each of the four quadrants in the data, show eviction’s influence to be greatest in the first quartile and smallest in the fourth. 75 Our GAM estimates that a 0.01 percentage point increase in the eviction rate predicts a 5.54 percentage point decrease in voter turnout in the first quartile (with the lowest rates of eviction), a 3.76 percentage point decrease in the second quartile, a 0.87 percentage point decrease in the third quartile, and a 0.39 percentage point decrease in the fourth quartile (with the highest rates of eviction). Our OLS model underestimates eviction’s influence on voter turnout in three of the four quartiles.
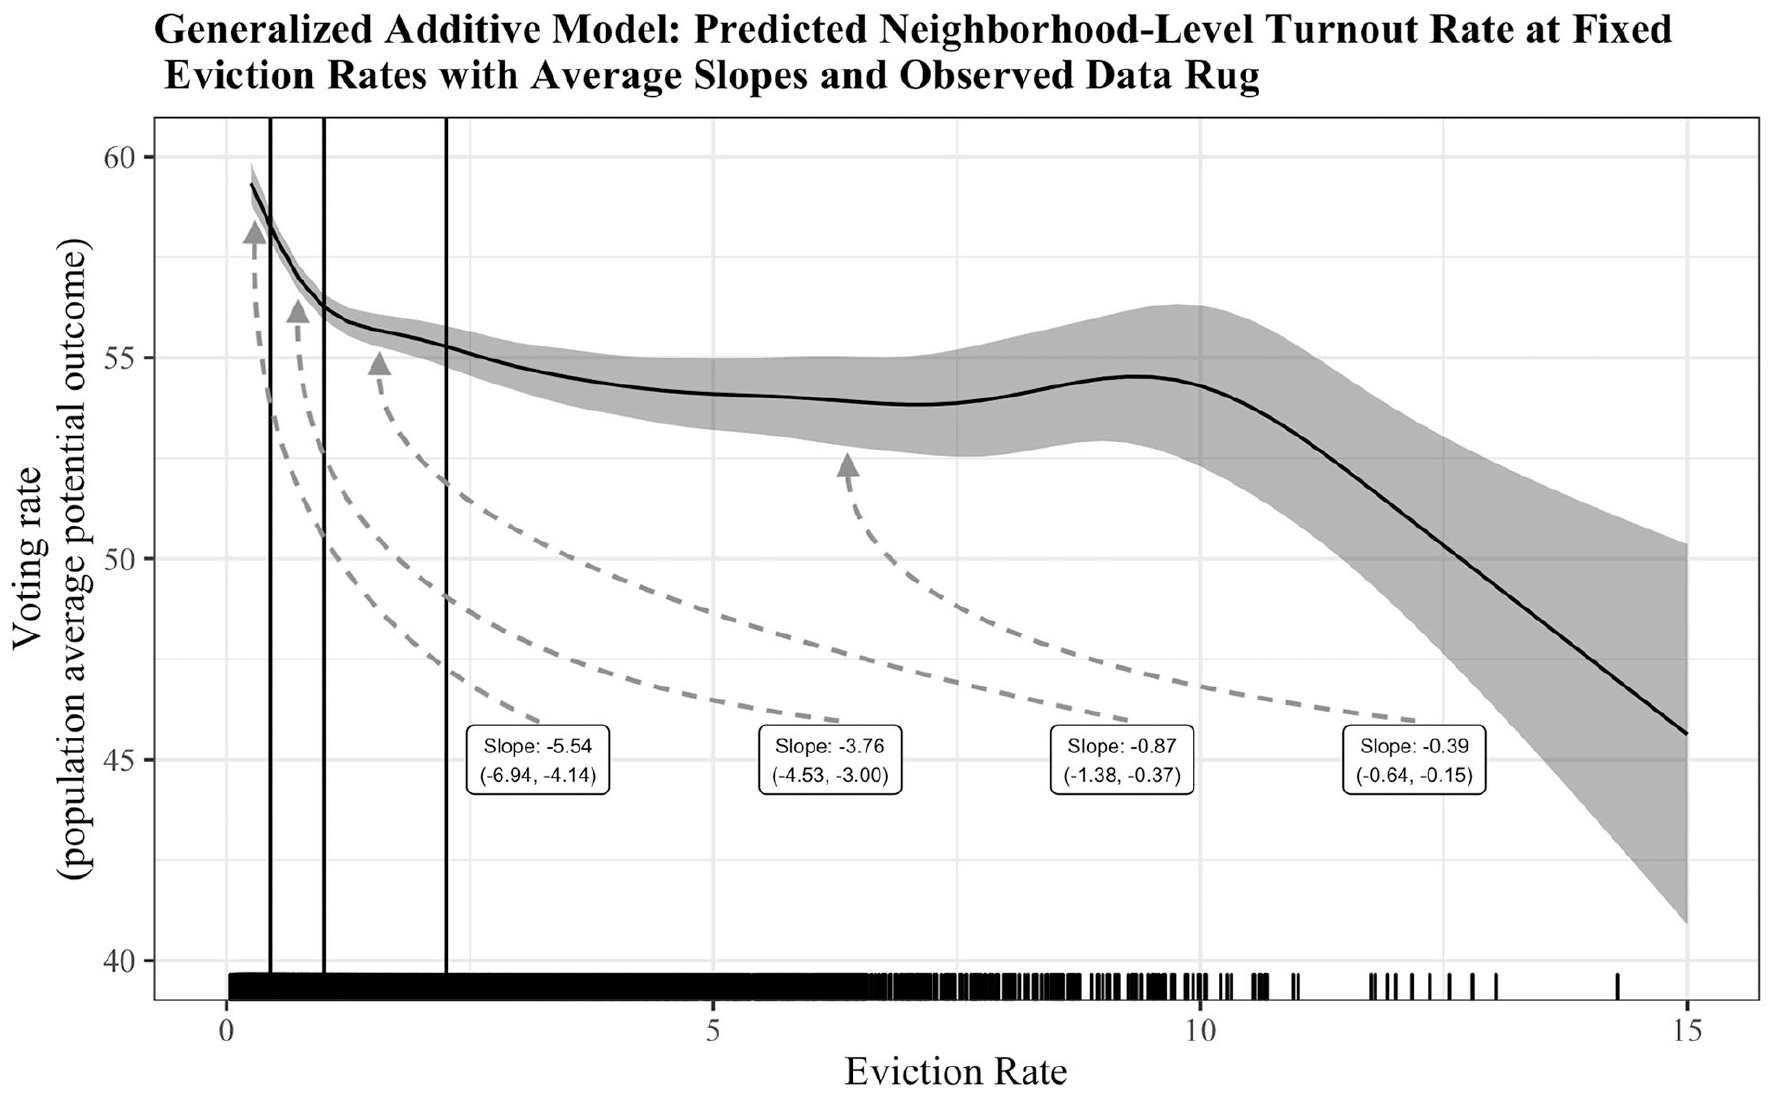
Generalized additive model (GAM) plot of predicted neighborhood-level voter turnout rates at fixed eviction rates. We predict from a generalized additive model regressing the voter turnout rate on the eviction rate, all controls listed in Model 3 of Table 2, and county fixed effects. The shade around the dose-response line is a pointwise 95 percent confidence band. The vertical lines on the plot mark the quartile splits of our observed data, reflecting the distribution of eviction rates across neighborhoods. Although the fourth quartile is characterized by a wider range, an equal share of neighborhoods falls into each quartile. A data rug on the x-axis plots the distribution of neighborhood eviction rates. The figure excludes one neighborhood with an eviction rate that exceeds 15 percent. The plot reveals variation in the estimated average marginal effect of eviction on voting, as indicated by the curve and the included average slopes for each quartile.
The dose-response curve produced by the GAM suggests that eviction exercises a far greater influence on voter turnout in communities with lower levels of forced mobility. Although surprising, this finding aligns with previous research. For example, Paru Shah and Amber Wichowsky find that “the cumulative impact of ‘additional distress’ [i.e., foreclosure] on already distressed communities that have lower voter turnout does not appear to drop participation further.” 76 Similarly, using individual-level data, Ariel White finds the demobilizing effect of jail on voting to be larger for homeowners, 77 a group economically advantaged in relation to her main sample. Although we find that eviction lowers voter turnout even in high-eviction neighborhoods, the effect is smaller than in neighborhoods characterized by much lower levels of displacement. High-eviction neighborhoods may be characterized by correlated adversity in which residential instability is compounded by other sources of neighborhood disadvantage, including high rates of joblessness and crime. 78 In these neighborhoods, voter participation is less responsive to the eviction rate, compared to neighborhoods with much lower levels of housing loss, where eviction may be experienced as an uncommon kind of disadvantage. Still, based on these analyses, we would expect voter turnout to rise if eviction rates were to fall, across neighborhood contexts.
Instrumental Variables Analysis
The above results control for several observable neighborhood factors related to both eviction and voting as well as unobserved, time-invariant conditions through county fixed effects. However, those results remain susceptible to endogeneity and simultaneity bias. To address this limitation, we employ an instrumental variables analysis that treats commercial evictions as an instrument for residential evictions.
As shown in Table 4, the first stage of our IV estimation finds a neighborhood’s commercial eviction rate to be positively associated with its residential eviction rate (
Instrumental Variables Estimation of Effect of Residential Eviction on Voter Turnout.
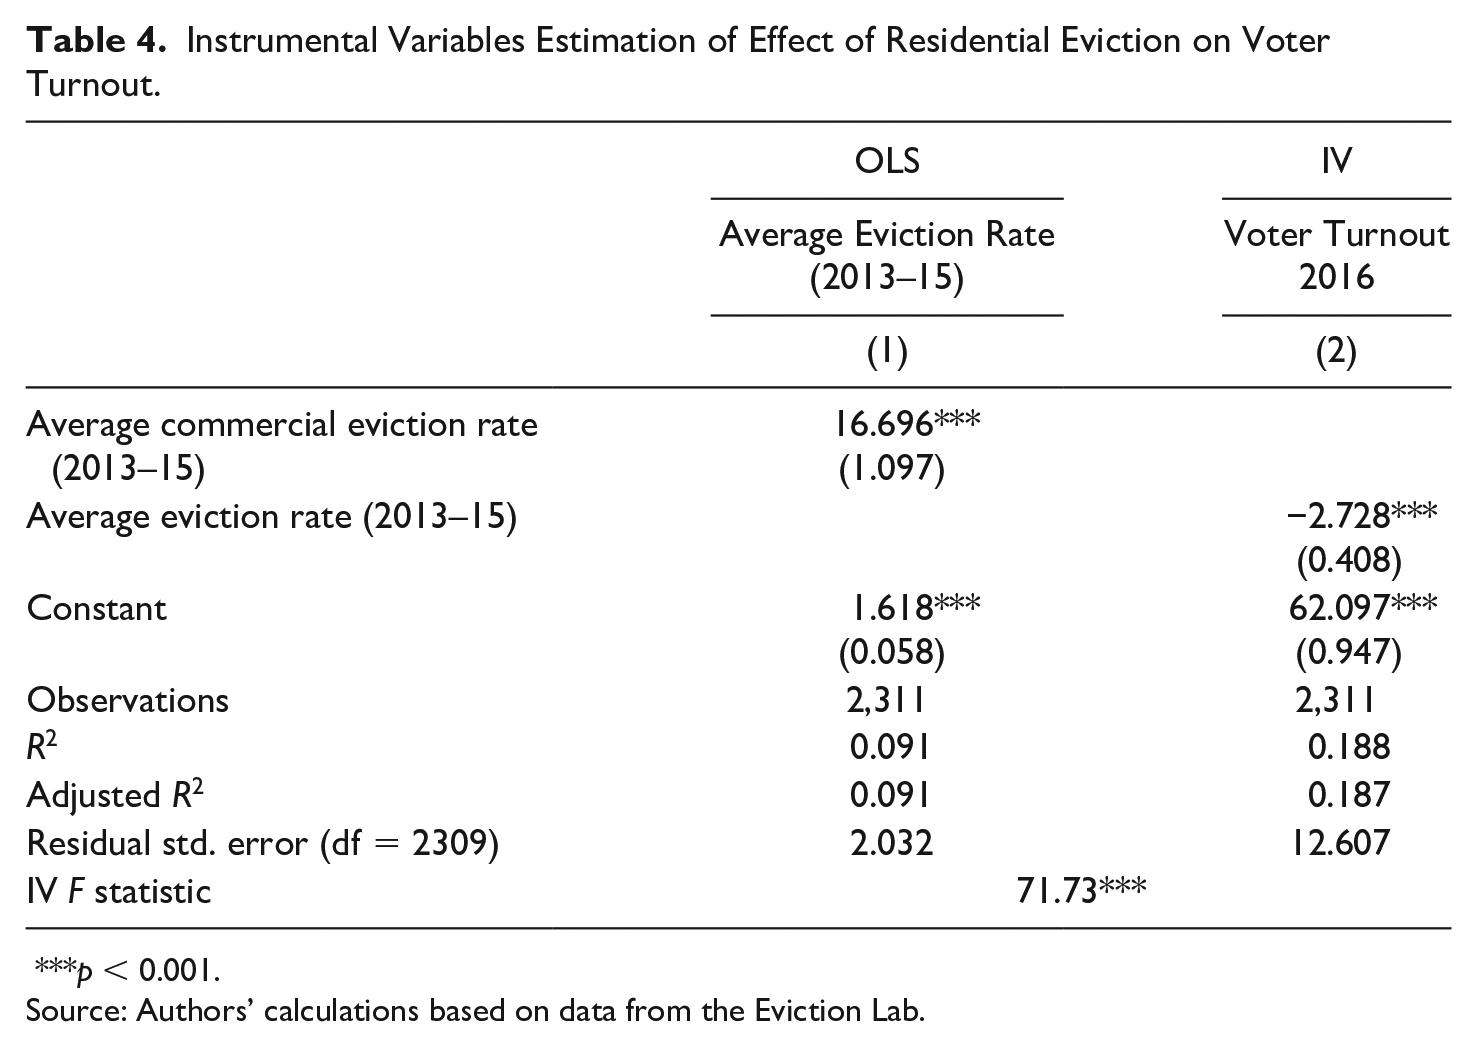
Source: Authors’ calculations based on data from the Eviction Lab.
p < 0.001.
The second column of Table 4 presents the two-stage least squares estimate of the eviction rate on the voting rate. This approach estimates that reducing the residential eviction rate by 1 percentage point would have increased voter turnout by 2.73 percentage points. 80 The estimated causal effect of eviction on voting produced from our IV strategy sits between the average slopes for the second and third quartiles generated by our generalized additive model.
We replicated our IV procedure using the residential eviction filing rate, as opposed to the eviction rate, finding the estimated causal effect of the filing rate on voting to be −1.23 (p < 0.001), significantly less than the effect of the eviction rate. This supports our earlier findings indicating that displacement itself exerts a much stronger influence on political participation than the threat of displacement.
Discussion
Drawing on tens of millions of eviction and voting records from multiple states, this study found evidence that residential eviction contributed to voter demobilization in the 2016 presidential election. This finding holds in both rural and urban communities and in uncompetitive states; it is imprecisely estimated in battleground states. A county-level analysis of the 2012 presidential election replicated our main finding. Importantly, we find the relationship between residential eviction and voting to be robust and significant in states that implemented new voter restrictions but imprecisely estimated in states that allowed for same-day and Election Day registration during the 2016 election. Election policies that expand voter access may mitigate eviction’s impact, but we stress that more research is required to validate this finding. 81 Flexible modeling uncovered variation in our main result across community contexts, showing that eviction’s negative influence on voter turnout is strongest in neighborhoods with relatively low rates of residential displacement. To address endogeneity bias and more precisely estimate the causal effect of eviction on voting, we develop an IV strategy that treats commercial evictions as an instrument for residential evictions. Our instrumental variables model estimated that reducing the residential eviction rate by 1 percentage point would have increased voter turnout in 2016 by 2.73 percentage points. In the 2016 presidential election, six states were decided by less than 2 percentage points, including Michigan, Pennsylvania, and Florida.
No previous study has examined the effect of eviction on voting. Our findings indicate that this has been a consequential oversight. Previous studies have documented a connection between general residential mobility (all moves) and suppressed voting. 82 Doing so, however, treats all moves equally, from voluntary relocations to improve residential advantage to involuntary relocations via eviction. In revealing eviction’s effect on voting to be distinct from general residential instability, this study expands research on the social determinants of political behavior in a novel way, identifying a heretofore overlooked source of participatory inequality and demobilization and informing specific policy interventions.
We theorized that residential eviction could impact voting patterns by influencing the level of material hardship, social isolation, and/or government cynicism in a neighborhood. Because this study sought to generate new evidence of the effect of eviction on voting, it could not sufficiently assess each mechanism. However, several of our findings provide insight into how eviction may affect voter turnout. First, separate models with identical covariates compared the estimated effects of the residential eviction rate and the eviction filing rate, finding that eviction’s political effect stems more from actual displacement than the threat of displacement. Second, we found that a near-term residential eviction rate (2015) had a greater influence on 2016 voter turnout than a recent, historical average (2013–15). The effect of a neighborhood’s 2015 eviction rate on voter turnout, in fact, was greater than the associations reported for several other neighborhood characteristics previous research has linked to political participation, including poverty, age distributions, and racial composition. This suggests that eviction’s influence on voter turnout likely increases the closer the displacement occurs to Election Day. At the same time, however, the difference in effect size between the 2015 eviction rate and the average eviction rate between 2013 and 2015 was modest, reflecting the durability of eviction’s influence on voter turnout. Third, we found that voter turnout is most responsive to the eviction rate in residentially stable communities that experience low (but nonzero) rates of eviction. This implies that eviction affects voter turnout across a spectrum of advantage and disadvantage and that increases in forced mobility in otherwise advantaged areas exert a sizable influence on political participation.
Eviction’s influence on voting may operate through both individual- and neighborhood-level processes. 83 For example, material hardship may befall an individual and come to strain a social network, just as legal cynicism can emerge through direct or indirect experience. If displacement affected political participation primarily through individuals, we would expect a linear relationship between eviction and voting. Instead, we found that eviction’s influence on voting was not uniform across varied political, regional, and housing contexts. At the same time, our results also indicated that eviction’s influence was modestly greater in the near term and statistically imprecise in voter-friendly jurisdictions, which suggests that individuals’ experiences with material hardship and barriers to voter registration may also contribute to eviction’s depressive effects on turnout.
That eviction exercises a greater influence on voting in communities where its occurrence is relatively rare may reflect the fact that similar increases to the eviction rate in high- and low-eviction neighborhoods are experienced as dissimilar. After all, when a neighborhood’s eviction rate rises from 1 to 1.5 percent, that signals a 50 percent change, but when the rate rises from 5 to 5.5 percent, that signals a 10 percent change. Just as isolated instances of lawbreaking might provoke outrage and political mobilization in a low-crime neighborhood but be ignored or downplayed in a community with much higher levels of crime, limited occurrences of eviction might spread cynicism or political nihilism in a low-eviction neighborhood while exerting a weaker influence on the political life of neighborhoods where eviction is more commonplace. The nonlinear relationship between eviction and voting across neighborhood types may also suggest that eviction influences turnout through different channels, depending on the community context. High-eviction neighborhoods are often characterized by extreme levels of concentrated disadvantage. The political consequences of eviction may be smaller in these communities on account of its co-occurrence with other social problems that may also depress political participation, such as crime, poverty, and incarceration. 84 By extension, if eviction’s effects on voting appear to be largest in low-eviction communities, it may be because their negative effects on social cohesion, say, are not diluted by competing adversities. It could also be the case that eviction influences voter participation in high-eviction areas primarily by deepening community-level rates of material hardship while its impact on turnout is primarily attributed in low-eviction areas to government cynicism spread by rare yet memorable moments of displacement.
This study has several limitations. In focusing on neighborhoods, we cannot discern how eviction shapes voter engagement for individuals with direct and indirect experience with forced mobility. Further research could probe how forced mobility influences not only the evicted but also their neighbors. Qualitative researchers may elaborate or refine our proposed mechanisms, and quantitative researchers may use individual-level data and alternative modeling strategies to identify whether eviction operates primarily through individuals or neighborhoods. Likewise, eviction’s influence on political participation may vary depending on the election cycle and candidates on the ballot, and it may be mitigated by grassroots political action and campaign efforts targeting renters. Future research can extend our findings to other elections, including local ones. The results of our IV model, moreover, produced a local average treatment effect (LATE) generalizable to neighborhoods where the residential eviction rate is responsive to the commercial eviction rate. Entirely different identification strategies that would apply to another complier population would allow a broader generalization of the LATE.
Conclusion
Presidential elections are often decided by the thinnest of margins. As a voting bloc, renters are much more likely to vote Democrat. In 2016, homeowners favored Trump over Clinton by 6 percentage points, but renters voted for Clinton over Trump by a much larger margin: 30 percentage points. 85 If residential eviction impedes renters’ likelihood of voting, it could have decisive consequences on the outcomes of close national elections.
Eviction may socialize potential voters into a diminished form of citizenship in a way that resembles the political consequences of living in neighborhoods with heavy contact with the criminal legal system. 86 This holds troubling implications for participatory equality because eviction, like criminal-legal supervision, is disproportionately concentrated in low-income, predominantly Black and Hispanic communities. 87 As such, eviction likely plays a role in suppressing the political voice of the poor and blunting the full power of the Black and Hispanic vote.
The results of this study hold implications for both housing and electoral policy. In revealing the effect of eviction on turnout to be pronounced in states that installed new voter restrictions in 2016, as well as those that did not offer same-day registration by Election Day, this study produced suggestive evidence that efforts to expand voting access may help to mitigate the negative consequences of forced displacement from housing. Moreover, our results suggest that voter turnout would increase if eviction rates were lowered, even in disadvantaged communities confronting other barriers to political participation. This implies that efforts to reduce eviction—from establishing the right to counsel in housing court to expanding rental assistance to reduce cost burden 88 —could reduce participatory inequality and increase voter turnout.
Supplemental Material
sj-docx-1-pas-10.1177_00323292211050716 – Supplemental material for Eviction and Voter Turnout: The Political Consequences of Housing Instability
Supplemental material, sj-docx-1-pas-10.1177_00323292211050716 for Eviction and Voter Turnout: The Political Consequences of Housing Instability by Gillian Slee and Matthew Desmond in Politics & Society
Footnotes
Acknowledgements
We thank Ingrid Gould Ellen, Jacob Faber, Ashley Gromis, James Hendrickson, Peter Hepburn, Aparna Howlader, John Logan, Will Lowe, Ian Lundberg, and Brandon Stewart along with members of Princeton’s Eviction Lab, participants in the empirical seminar, and staff at Data and Statistical Services for feedback and guidance. We also thank Labels and Lists and the Committee on Research and Computing in the Politics Department at Princeton University for providing access to the voter file. Earlier drafts of this article were presented at the American Sociological Association Annual Meeting, New York City, August 12, 2019, and the Association for Public Policy Analysis and Management, Denver, November 8, 2019.
Declaration of Conflicting Interests
The author(s) declared no potential conflicts of interest with respect to the research, authorship, and/or publication of this article.
Funding
The author(s) disclosed receipt of the following financial support for the research, authorship, and/or publication of this article: This research was funded by the JPB Foundation (GR-887), the Bill and Melinda Gates Foundation (AWD1006387), and the Ford Foundation (128606; 130007), as well as the Chan Zuckerberg Initiative. Research reported in this publication was supported by the Eunice Kennedy Shriver National Institute of Child Health and Human Development of the National Institutes of Health under Award Number P2CHD047879. The content is solely the responsibility of the authors and does not necessarily represent the official views of the National Institutes of Health.
Supplemental Material
Supplemental material for this article is available online.
Notes
Author Biographies
Supplementary Material
Please find the following supplemental material available below.
For Open Access articles published under a Creative Commons License, all supplemental material carries the same license as the article it is associated with.
For non-Open Access articles published, all supplemental material carries a non-exclusive license, and permission requests for re-use of supplemental material or any part of supplemental material shall be sent directly to the copyright owner as specified in the copyright notice associated with the article.