
Abstract
The STEM (science, technology, engineering, and mathematics) potential of youth with cognitive disabilities is often dismissed through problematic perceptions of STEM ability as natural and of youth with cognitive disabilities as unable. National data on more than 15,000 adolescents from the High School Longitudinal Study of 2009 first suggest that, among youth with disabilities, youth with medicated attention-deficit/hyperactivity disorder (ADHD) have the highest levels of STEM achievement, and youth with learning or intellectual disabilities typically have the lowest. Undergraduates with medicated ADHD or autism appear to be more likely to major in STEM than youth without cognitive disabilities, and youth with autism have the most positive STEM attitudes. Finally, results suggest that high school STEM achievement is more salient for college enrollment than STEM-positive attitudes across youth with most disability types, whereas attitudes are more salient than achievement for choosing a STEM major.
Science, technology, engineering, and mathematics (STEM) occupational pursuits, with relatively higher earnings and status, represent an important site for the upward mobility of people with disabilities 1 (Meyer 2017), and a degree in a STEM major is a common prerequisite to STEM occupations (Langdon et al. 2011). Moreover, increasing the share of STEM workers who have cognitive disabilities will facilitate innovation that is more creative and more representative of a diverse population, thus helping meet the needs of a larger share of our society (Augustine 2007; Gonzalez and Kuenzi 2012; Koonce et al. 2011). Although youth with cognitive disabilities form a sizable minority, about 12 percent of U.S. adolescents (Office of Special Education Programs 2015; Snyder, De Brey, and Dillow 2019), they are less often considered as a status group facing educational and occupational inequities, potentially because their poorer outcomes are dismissed as natural and inevitable. The STEM disparities of people with cognitive disabilities are legitimated and perpetuated through perceptions of STEM ability as natural and of youth with disability as unable.
Perceptions of STEM ability as natural are problematic because cross-national and within-country disparities in STEM achievement are better explained by social differences than by inherited differences (Epstein, Mendick, and Moreau 2010; Riegle-Crumb et al. 2012; Stevenson, Chen, and Lee 1993). Perceptions of youth with cognitive disabilities as unable and lacking potential are problematic because of the marked heterogeneity in achievement both within and across disability types (Estes et al. 2011; Harry and Anderson 1994; Owens and Jackson 2017; Saatcioglu and Skrtic 2019) and because of the social rootedness and subjectivity of how cognitive disabilities are classified (Eyal 2013; Saatcioglu and Skrtic 2019; Shifrer 2018; Shifrer and Fish 2020). Students with learning disabilities (e.g., dyslexia, dyscalculia) and attention-deficit/hyperactivity disorder (ADHD) constitute the largest share of both the K–12 and college populations of students with cognitive disabilities (McFarland et al. 2019; Raue and Lewis 2011), but college attendance among youth with intellectual disabilities and autism, the disabilities perceived to be most severe, is increasingly documented (Hart, Grigal, and Weir 2010; Plotner and Marshall 2014). Indeed, undergraduates with disabilities may even choose STEM majors at higher rates than undergraduates without disabilities (Lee 2011). Some industry leaders describe “neurodiversity” as a “competitive advantage,” with tech employers seeking employees with autism and dyslexia for their special gifts in pattern recognition, mathematics, or memory (Austin and Pisano 2017; Reuters 2013; White 2019). Aiming toward problematizing perceptions of STEM ability as natural and perceptions of youth with disability as unable, we use nationally representative data on more than 15,000 adolescents and their schools from the High School Longitudinal Study (HSLS) of 2009 to document and establish links between their high school and postsecondary STEM outcomes. We compare youth with cognitive disabilities versus youth without cognitive disabilities and differentiate by cognitive disability type.
The previous literature, recognizing STEM outcomes as the product of a trajectory of educational and social experiences, routinely emphasizes achievement and attitudes in high school as key factors for postsecondary outcomes (Bottia et al. 2015; Ganley and Lubienski 2016; McEachin, Domina, and Penner 2017). It is less well established whether educational reform policy should place more emphasis on achievement or attitudes and whether the relative importance of different factors varies depending on cognitive disability status and disability type. We measure high school STEM outcomes with math test scores and STEM attitudes from when most of the sample was in the 11th grade, and attainment and grade point average (GPA) in STEM coursework from post–high school transcripts. We measure postsecondary outcomes in terms of college enrollment and STEM major. This study moves beyond the previous literature by documenting the real-world status of the nation’s youth with cognitive disabilities as they transition into adulthood, using a rich data set to consider a wide range of disability types and a wide range of achievement, attitudinal, and status attainment outcomes. In addition to having practical implications for diversifying STEM fields, this study contributes a focus on processes that more broadly affect the learning and life outcomes of an understudied minority group.
Achievement, Attitudes, and Postsecondary Educational Outcomes
Youth with cognitive disabilities are largely disregarded in research focused on postsecondary education or on STEM-related pursuits. In an exception, Lee (2011) found that undergraduates with disabilities actually choose STEM majors at the same or higher rates compared with undergraduates without disabilities. Yet regardless of academic disciplines, youth with disabilities are less likely to enroll in college overall (Wagner et al. 2005) and to complete college (Carroll et al. 2020), than their peers without disabilities. Because more than two thirds of STEM workers completed at least a bachelor’s degree, compared with fewer than one third of non-STEM workers (Langdon et al. 2011), increasing access to STEM fields for youth with disabilities depends not only on encouraging them to pursue STEM majors but also to enroll in college.
High school STEM achievement (e.g., math and science course attainment, test scores) and STEM-positive attitudes (e.g., math self-efficacy) are routinely emphasized as key factors that are associated with enrolling in college and choosing a STEM major (Bottia et al. 2015; Ganley and Lubienski 2016; McEachin et al. 2017). In the few studies that juxtaposed different measures of achievement and attitudes, course attainment and particularly high school test scores may matter most for college admission (Allensworth, Nagaoka, and Johnson 2018; Long, Conger, and Iatarola 2012), whereas achievement and attitudes both seem to predict selecting a STEM major (Wang 2013). No studies have examined whether the factors that matter most for the postsecondary STEM pursuits of the general population also matter for youth with cognitive disabilities.
Youth with cognitive disabilities likely have poorer high school achievement and attitudes than youth without cognitive disabilities, first, because of the individual differences that predict disability classification. Low achievement is required to qualify for special education services (U.S. Department of Education 2018) and research shows that youth with disabilities experience lower levels of math and science course attainment (Shifrer 2016; Shifrer, Callahan, and Muller 2013), lower math test scores (Shifrer 2013), and lower math self-efficacy (Lackaye and Margalit 2008). With emotional affect and social skills included as diagnostic criteria, poorer attitudes are framed by some as comorbidities of these disabilities (Asherson and Trzaskowski 2015; Matson et al. 2010). Youth with cognitive disabilities may also have poorer STEM attitudes because of U.S. stereotypes of STEM ability as natural and of youth with disability as unable (Metzger and Hamilton forthcoming; Owens and Jackson 2017; Shifrer 2013). The prior research suggests that high school STEM achievement and attitudes will both be salient for postsecondary outcomes but does not provide a clear indication of which measure of achievement and attitudes will relate most closely and how that might vary by disability status and type.
Problematizing Perceptions of Potential
We first problematize the perception that all youth with cognitive disabilities lack potential and ability. Learning disabilities are typically assigned to children who struggle to learn despite an average or high IQ (Fletcher, Denton, and Francis 2005). Similarly, diagnoses of ADHD and autism are not based on a low IQ (Grandin 2008; Matson et al. 2010). Rather than inherently lacking potential, these disabilities identify youth whose potential remains untapped by standard educational approaches. Similarly, it is not clear that youth classified with cognitive disabilities are objectively distinct from low-achieving youth with no disability classification. Categories of inequality, like disability, are dichotomized (i.e., disabled or not disabled) to mask intergroup heterogeneity that might impair the perceived integrity of the categorization (Shifrer and Frederick 2019). These disabilities are defined in or associated with conditions in the Diagnostic and Statistical Manual of Mental Disorders (DSM). Similar to other conditions in the DSM, such as clinical depression (Pickersgill 2014), these disabilities are classified on the basis of subjective qualities such as achievement, behaviors, and emotions (Gronvik 2007), qualities that have neurological but also important social origins. Without objective biomarkers, neurological difference is only inferred for youth classified with disabilities (Vellutino et al. 2004), but the medicalization of these conditions masks their social origins. A school disability classification, or qualification for special education services, is often precipitated by a disability diagnosis outside of school, but not all youth with a disability diagnosis are in receipt of special education services. Although qualification for special education services requires low achievement, some youth with disability diagnoses are not low achieving and are even sometimes simultaneously classified as gifted (Donovan and Cross 2002). In addition to an unclear dichotomy between low achievers without a disability classification and youth with a disability classification, achievement levels are heterogeneous within categories. Intellectual disability describes learning difficulties that range from mild to severe, just as functional levels occur along a spectrum for youth with autism (Estes et al. 2011; Harry and Anderson 1994). Achievement levels are also variable among the disabilities considered more mild, such as learning disabilities and ADHD (Owens and Jackson 2017; Saatcioglu and Skrtic 2019). Ultimately, the low achievement and poorer attitudes of youth with cognitive disabilities are likely the result of social differences as well as individual differences.
Disability categories shape others’ perceptions of potential and children’s expectations for themselves (Owens 2020a; Owens and Jackson 2017; Shifrer 2013, 2016). Disability categories also shape marginalization from curriculum and isolation from mainstream peers (Morgan et al. 2010; Shifrer et al. 2013). Youth with intellectual disabilities typically experience the highest levels of stigma and stratification (Blanchett 2010; Spellings, Knudsen, and Guard 2007), whereas ADHD can prompt accommodations that do not relate to notable separation from mainstream peers (Harrison, Edwards, and Parker 2007; Saatcioglu and Skrtic 2019). Because there are no biomarkers, and differences between disability categories are inconsistent and indistinct, educators and parents have substantial levels of discretion in the classification process (Hinshaw and Scheffler 2014; Shifrer and Fish 2020). Ultimately, youth with sociodemographic traits that link to poorer educational outcomes (e.g., low socioeconomic status, racial minority) are more likely to be classified with the more stigmatizing and stratifying disability categories (Eyal 2013; Fish 2019; King, Jennings, and Fletcher 2014; Saatcioglu and Skrtic 2019). Intellectual disability categories are more stratifying, for instance, because they typically result in more time during the day spent in separate special education classrooms (Blanchett 2010). In these ways, differences in the high school achievement, attitudes, and thus postsecondary educational outcomes of youth with cognitive disabilities reflect not only the individual differences that led to their classification but also the social exclusion resulting from the particular disability category.
We also problematize the perception that differences in STEM achievement solely reflect differences in natural ability. Whereas Americans often frame STEM ability as based on natural talent or genius, the East Asian countries that outperform the United States in math and science culturally frame success in these subjects as based on hard work (Archer et al. 2010; Mendick 2005; Scherz and Oren 2006; Stevenson et al. 1993). The role of cultural biases and social processes is particularly evident in the fact that gender disparities in postsecondary STEM pursuits remain marked despite gender parity in high school STEM achievement (Reardon et al. 2018; Riegle-Crumb et al. 2012; Saw, Chang, and Chan 2018). Because the term disability connotes innate immutable deficiency or disorder (Samuels 2014), Americans may be less likely to think hard work will enable STEM success for youth with cognitive disabilities. Problematizing perceptions of STEM ability as natural, and youth with disability as unable, is central for examining the STEM potential of youth with disabilities. To these ends, we investigate two questions: (1) How do high school and postsecondary STEM outcomes vary by disability status and type? and (2) Which measures of high school STEM achievement and attitudes relate most closely to postsecondary outcomes for each disability group?
Data and Methods
The National Center for Education Statistics (NCES) administered the nationally representative HSLS. The HSLS investigates the educational trajectories, with a particular focus on math and science, of a cohort of 21,444 adolescents in the ninth grade in 2009. Most sampled adolescents were in their junior year during wave 2 (2012), had just finished high school by wave 3 (2013), and were three years out of high school by wave 4 (2016). Transcript data were collected through 2014. The HSLS measures of disability are in the wave 1 (2009) parent surveys and school records. We measured educational outcomes using the wave 2 (2012) and wave 4 (2016) surveys of the adolescents, wave 2 scores from the math proficiency test administered by NCES, and transcript data collected by NCES in 2014. After excluding 530 students with unspecified disabilities (detailed below), our main analytic sample included the 15,380 students 2 who participated in waves 1 and 4, the respective sources of the study’s predictor of interest (disability status), and dependent variables. Analyses focused on college enrollment included only 15,200 students because of missing values on this measure. Analyses focused on STEM major included 10,830 students. The HSLS did not ask the major question of 3,830 students who never enrolled in college; 990 either did not respond to this question or were missing because they attended college without pursuing a degree or certificate. As specified in the HSLS users’ guide (Duprey et al. 2018), we used Stata’s survey procedure to apply the wave 4 student analytic weight, account for the HSLS’s complex survey design, and adjust standard errors for the clustering of students within schools. About 5 percent of cases were missing on measures of STEM achievement and 10 percent on measures of STEM attitudes. We addressed missing values on independent variables with multiple imputation by the multiple imputation using chained equations (White, Royston, and Wood 2011), including the dependent variables for imputation as recommended (von Hippel 2007). Table 1 provides population-estimate descriptive statistics on all variables used in study.
Means and Proportions Describing Variables Used in Study.

Note: This dataset focuses on a cohort of adolescents who were in the fall term of their ninth grade year during wave 1 (2009). Most sampled adolescents were in their junior year during wave 2 (2012), had just finished high school by wave 3 (2013), and were three years out of high school by wave 4 (2016). Transcript data were collected through 2014. Proportions and means are population estimates; standard deviations are sample estimates.
Disability Status
We used HSLS data from parents and schools to determine adolescents’ disability status and type. Parents reported whether a doctor, health care provider, teacher, or school official ever told them that their ninth grader had a learning disability, developmental delay, autism, intellectual disability, or attention-deficit disorder or ADHD. We include youth whose parent reported they have developmental delay in the intellectual disability category because the classification criteria are quite similar and because the group of youth with developmental delay is extremely small and would otherwise have to be excluded. Schools reported which sampled students had individual education programs (IEPs) (i.e., were in receipt of special education services). NCES did not require schools to report the disabilities qualifying students for special education services. We classify students who are reported to have IEPs but whose parents did not respond positively to any of the disability questions as having “unspecified disabilities.” In national data, disability status is often measured only through IEPs, whereas our group of youth with disabilities includes those with and without IEPs, an important strength of this study.
Because the share of adolescents reported by their parents to have multiple disabilities (~5 percent, detailed in Supplementary Table 1) exceeds estimates from national data (McFarland et al. 2019) and from non-national studies on comorbidity (Connor, Steeber, and McBurnett 2010; Matson et al. 2010), these parent reports may lack validity. Learning disabilities are broadly misunderstood by nonpractitioners to include disabilities (e.g., autism, ADHD) that are actually separate diagnoses and separate federal disability categories. Intellectual disabilities, a relatively new term for mental retardation, may also be misunderstood as a broad category encompassing all cognitive disabilities. ADHD and autism, in contrast, are increasingly prevalent in popular media and potentially better understood by parents. In a best attempt to streamline analyses and improve the validity of the disability measures, we created a mutually exclusive categorical indicator by not considering adolescents to have learning disabilities if they were also reported to have ADHD, autism, and/or intellectual disabilities; not considering adolescents to have intellectual disabilities if they were also reported to have ADHD and/or autism; and not considering adolescents to have ADHD if they were also reported to have autism (autism may be more salient, as it is less prevalent than ADHD and typically more severe).
Because this is only one possible way to construct a mutually exclusive disability indicator from these measures, we used several sensitivity analyses to assess how our analytic decisions might influence results. With the educational outcomes of youth with multiple disabilities poorer than those of youth with one disability (Supplementary Table 1), averages were slightly higher for the mutually exclusive version relative to the non–mutually exclusive version of the same disability type (Supplementary Table 2). Our confidence that results were not unduly altered by using the mutually exclusive measure of disability was increased by the fact that the disability types most and least advantaged, in terms of both educational outcomes (Supplementary Table 2) and social background (Supplementary Table 3), were consistent regardless of whether we used mutually exclusive or non–mutually exclusive disability indicators. Additional sensitivity analyses are discussed under “Analytic Plan.”
Parents also reported whether their adolescent was taking medications for ADHD. We considered unmedicated ADHD and medicated ADHD as separate categories to support our aim of capturing students’ cumulative experiences (e.g., neurological, social) as youth with disabilities. This analytic decision was based on findings from other studies (e.g., King et al. 2014; Owens 2020b) and our own extensive exploratory analyses showing marked differences by medication status in both educational outcomes (Supplementary Table 2) and social background (Supplementary Table 3). Finally, we exclude youth with unspecified disabilities, that is, youth with IEPs but no positive reports on any of the more specific parent reports, as it is impossible to know whether their disabilities are cognitive or physical.
Postsecondary Educational Outcomes
We considered two of students’ postsecondary educational outcomes as dependent variables: college enrollment and STEM major. For the first measure, we used the wave 4 composite measure describing the postsecondary institution the respondent most recently attended as of February 2016 (three years after the end of high school for most sampled students). We focus on both two- and four-year colleges because youth reported STEM majors in both settings. Moreover, two-year colleges are increasingly central in the nation’s postsecondary landscape, particularly for youth with disabilities. Differentiating analyses by institutional type is beyond the research focus of this study and would increase the risk for small cell size. For the second measure, we used the wave 4 composite measure of whether the student reported a first or second major in a STEM field.
High School STEM Achievement
We measured high school STEM achievement with HSLS-reported math and science course attainment, STEM GPA, and math test scores. We measured math course attainment with a categorical measure of progression (algebra I or lower, geometry, algebra II or higher) combining measures NCES constructed on credit accumulation using transcript data. Because the science coursework hierarchy is less consistent, we measured science course attainment with three dichotomous measures of whether the student completed Biology, Chemistry, and Physics. NCES used transcript data to construct STEM GPA, averaging across adolescents’ high school courses with School Courses for the Exchange of Data codes beginning with 02 (math), 03 (science), 10 (computer science), and 21 (technology). We used the wave 2 (2012) item response theory–estimated number-correct math test score. Because of small cell sizes or insufficient variation, we used a dichotomous version of math course attainment (algebra II or higher) and excluded the measure of completing biology when predicting STEM major.
High School STEM-Positive Attitudes
Drawing on the values and expectancies framework developed by Eccles and Wigfield (2002), we measured high school STEM attitudes with math and science identity/self-efficacy and utility value (useful for future goals). Appendix A details survey items used to construct each scale. Scales were set to missing for cases missing on any of the HSLS survey items used to construct the scale, as bias is a likely result of constructing “pro-rated” scales (Mazza, Enders, and Ruehlman 2015). We constructed one scale for identity and self-efficacy because survey items were estimated to measure the same latent factor despite wording that indicates otherwise (all α values > .70). After using factor analysis and averaging to construct scales, we standardized them (i.e., transformed them so means equal zero and standard deviations equal one) to increase interpretability.
Analytic Plan
To answer our first research question, we used predicted probabilities and means from bivariate logistic regression models to show differences by disability status and type in high school and postsecondary educational outcomes. For our second research question, we used logistic regression models to predict college enrollment and STEM major with all measures of STEM achievement and attitudes. Learning and disabilities are a complicated product of neurology, environment, and social factors (King and Bearman 2011; Liu, King, and Bearman 2010; Saatcioglu and Skrtic 2019; Shifrer 2018). We expect differences in these students’ outcomes reflect all these factors and specifically do not want to “account for them” or “explain them away.” We are interested in how these groups of students differ in terms of achievement, attitudes, and postsecondary outcomes, as they actually are, rather than with statistical adjustments.
We stratified models by disability type to understand how these processes work for each group. Because statistical significance estimates are influenced by cell size (Sullivan, Weinberg, and Keaney 2016), and because of the multidisciplinary call for a shift in emphasis from statistical to substantive significance (American Statistical Association 2016; Healy and Moody 2014; Williams 2012), we use a variety of techniques to clarify the relative importance of each measure of STEM achievement and attitudes. We emphasized substantive significance, first, by presenting results in terms of predicted probabilities, which have more real-world meaning, are more intuitive, and are more comparable across models than log odds or odds ratios (Mood 2010). We then estimated standardized coefficients 3 (Greenland et al. 1991; Menard 2011), F ratios from Wald tests (Long and Freese 2014), squared semipartial correlations (Anglim 2009; Peugh 2010), and dominance analysis rankings (Luo and Azen 2013; Menard 2004). Main analyses report which achievement or attitudes was indicated most often, across these techniques, to relate more closely than the other measures of achievement and attitudes to the outcome. Our confidence in findings is increased by the relative consistency of results regardless of the technique (detailed in Supplementary Tables 7–10). We reestimated analyses focused on our first research question using both the mutually exclusive and non–mutually exclusive measures of disability in Supplementary Table 2; we did the same for our second research question in Supplementary Tables 5 and 6. Results were essentially the same, increasing our confidence that results are not unduly altered by the mutually exclusive measure of disability.
In this study, we seek to document the outcomes of youth with cognitive disabilities as a holistic product of the disability, the disability label, and related differences in social background (i.e., rather than treating these various factors as confounders or alternative explanations). Nonetheless, we conduct sensitivity analyses with measures of social background to benchmark these data with findings from other data sets. Supplementary Table 3 shows that the social backgrounds of youth with autism, and particularly with medicated ADHD, are the most advantaged, whereas the backgrounds of youth with intellectual and learning disabilities are the least advantaged. Regression models predicting educational outcomes (Supplementary Table 4) show that, as expected, negative coefficients typically decrease for learning disabilities, intellectual disabilities, and unspecific disabilities once we account for their relative social disadvantage, whereas negative coefficients typically increase for youth with medicated ADHD and autism once we account for their relative social advantage.
Results
Differences in Educational Outcomes by Disability Status and Type
Table 2, focused on our first research question, includes predicted probabilities and means to show differences by disability type in educational outcomes. Values are in boldface type to indicate the two most advantaged subgroups along each measure. Youth with disabilities were significantly less likely to have enrolled in college by 2016 (.48 to .58 enrolling, depending on disability type) than youth with no cognitive disability (.73). Among youth with disabilities, youth with medicated ADHD were most likely to have enrolled in college (.58). Among those who enrolled in college, youth with intellectual (.09) or learning (.13) disabilities were significantly less likely to major in STEM than youth with no cognitive disabilities (.19). Although not statistically significant, youth with autism (.35) or medicated ADHD (.23) appear to be more likely to have STEM majors than youth with no cognitive disabilities (.19). Table 2 also shows that youth with disabilities, regardless of disability type, had significantly lower levels of STEM achievement by the end of high school relative to youth with no cognitive disabilities. Among youth with cognitive disabilities, youth with medicated ADHD had the highest levels of math and science course attainment, the highest STEM GPAs, and the highest math test scores. Youth with autism also fared well relative to their peers with cognitive disabilities in terms of completing biology and their STEM GPA. Youth with learning or intellectual disabilities, in contrast, typically had the lowest levels of achievement. In contrast to achievement, the differences in high school STEM attitudes between youth with and without cognitive disabilities were typically not statistically significant. In fact, although not significantly different, the STEM attitudes of youth with autism appear to be more positive than the attitudes of youth with no cognitive disability.
Research Question 1: Predicted Probabilities and Means Showing Differences by Disability Type in Educational Outcomes.
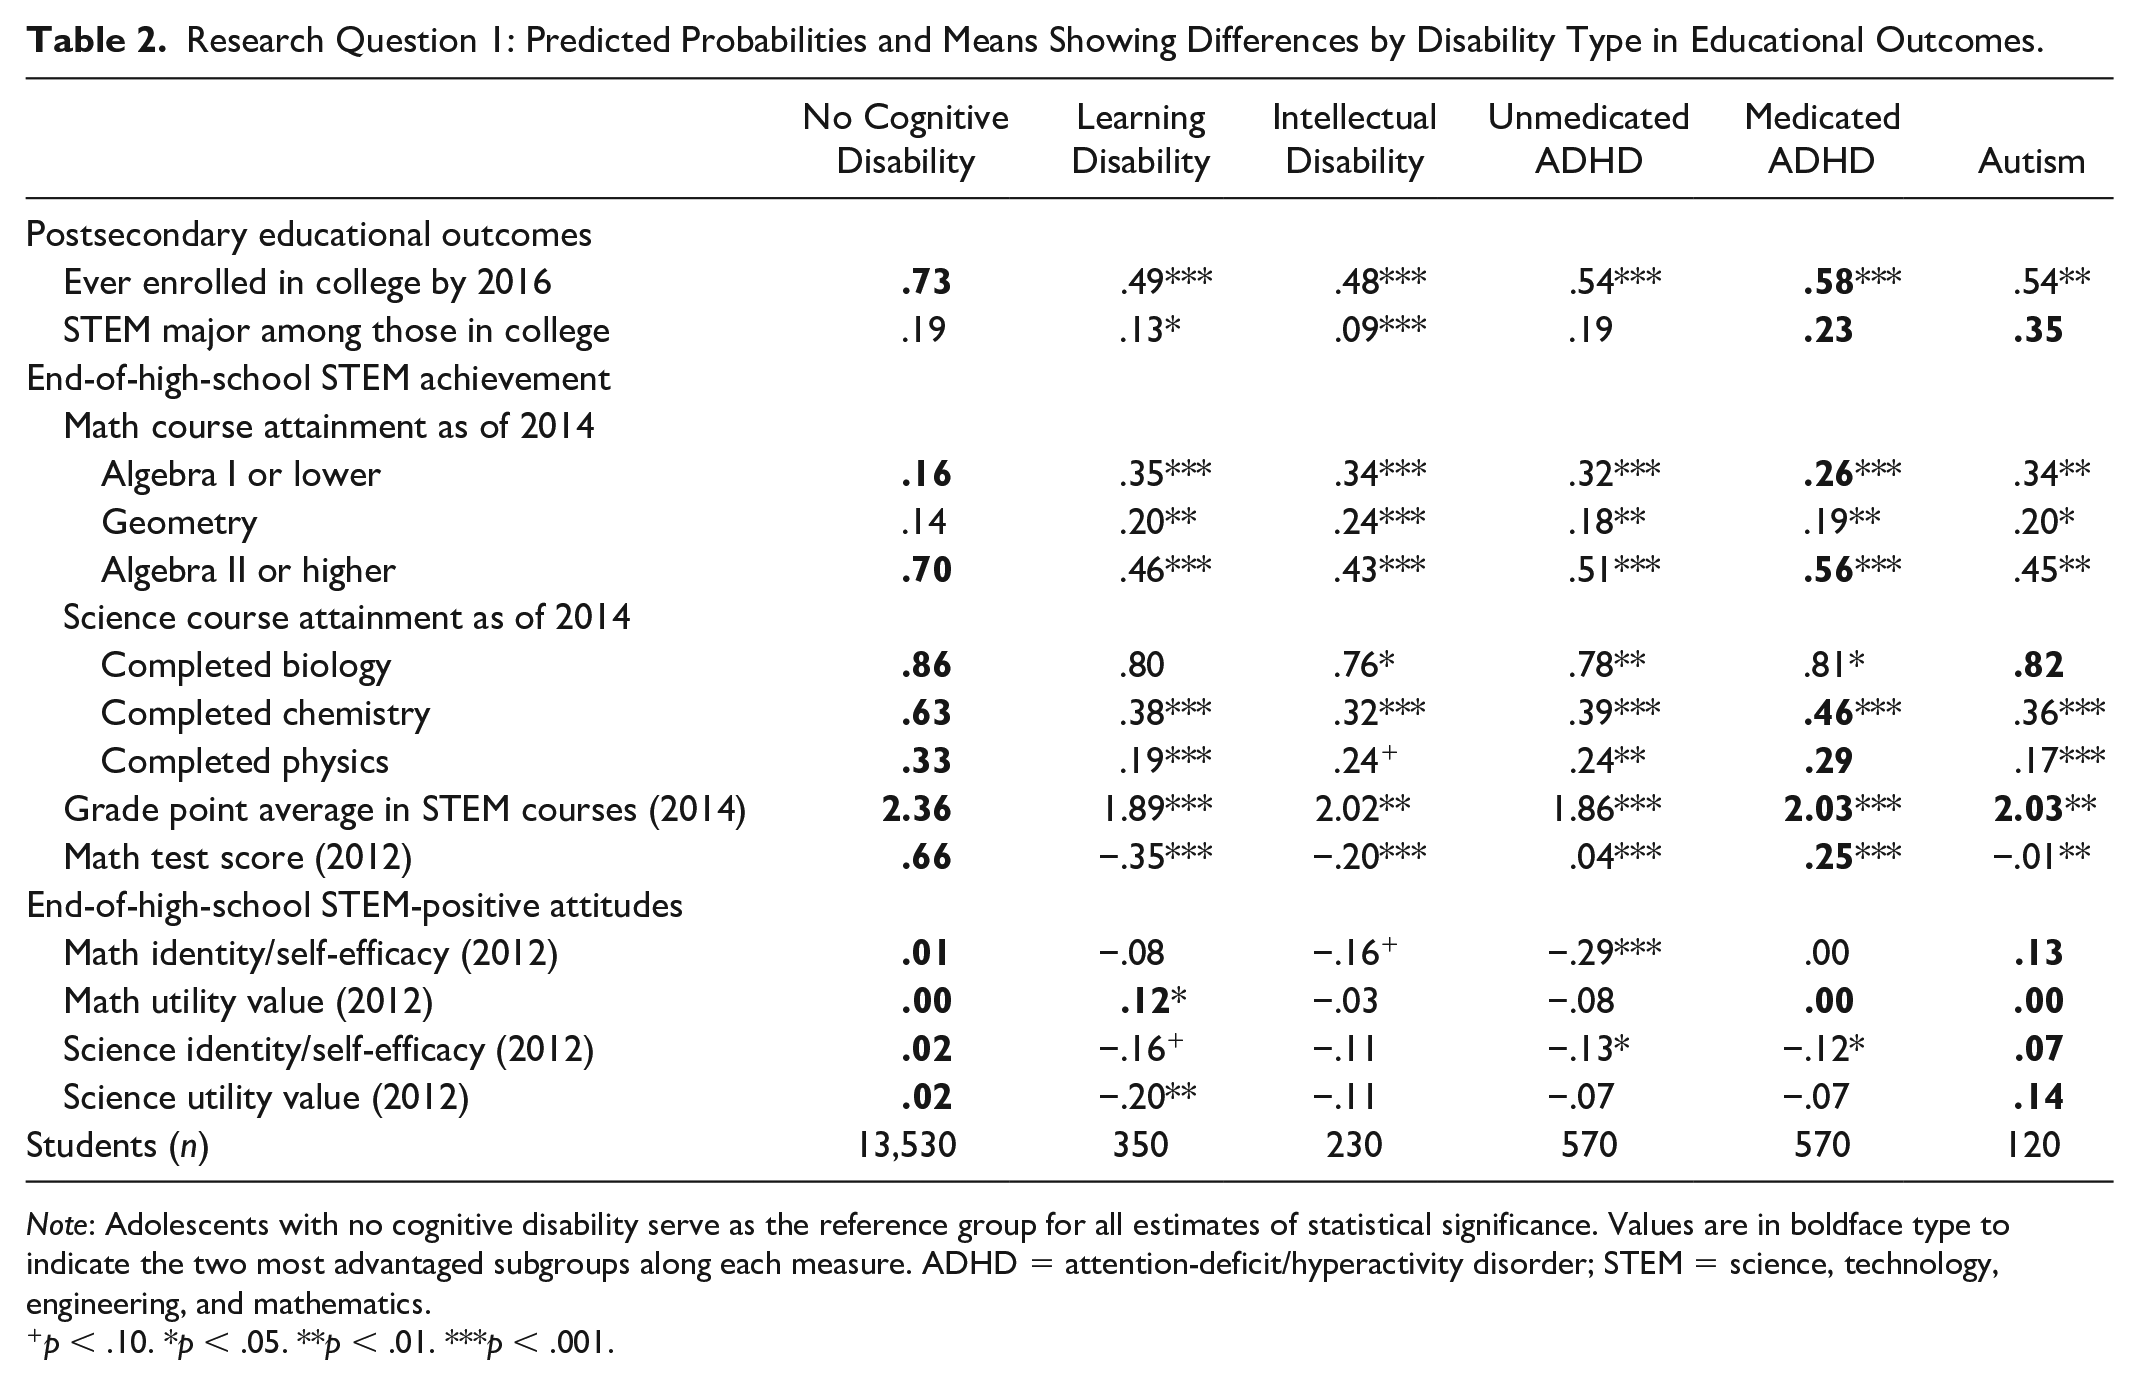
Note: Adolescents with no cognitive disability serve as the reference group for all estimates of statistical significance. Values are in boldface type to indicate the two most advantaged subgroups along each measure. ADHD = attention-deficit/hyperactivity disorder; STEM = science, technology, engineering, and mathematics.
p < .10. *p < .05. **p < .01. ***p < .001.
Relevance of STEM Achievement and Attitudes for Postsecondary Outcomes
To answer our second research question, results from multivariate regression models show how high school STEM achievement and attitudes relate to college enrollment (Table 3) and STEM major (Table 4) depending on disability status and type. Marginal effects, differences in predicted probabilities in this case, facilitate more intuitive results and estimates that are more comparable across models. In one example, model 1 in Table 3 shows that the predicted probability of college enrollment for youth without cognitive disabilities who completed algebra II or higher was six percentage points higher than the probability for youth without cognitive disabilities who completed algebra I or lower. We outline the measure, indicated most often by the various statistical techniques we used, to relate more closely to college enrollment than the other measures.
Research Question 2: Marginal Effects (Predicted Probability Changes) from Logistic Regression Models Predicting Ever Enrolled in College as of 2016.

Note: For each disability group, measures in cells with boldface values relate more closely than other predictors to college enrollment across the most indicators (standardized coefficients, F ratios, squared semipartial correlations, and dominance analysis rankings). More detailed presentation of results is available in Supplementary Table 7. ADHD = attention-deficit/hyperactivity disorder; STEM = science, technology, engineering, and mathematics.
p < .10. *p < .05. **p < .01. ***p < .001.
Research Question 2: Marginal Effects (Predicted Probability Changes) from Logistic Regression Models Predicting STEM Major.
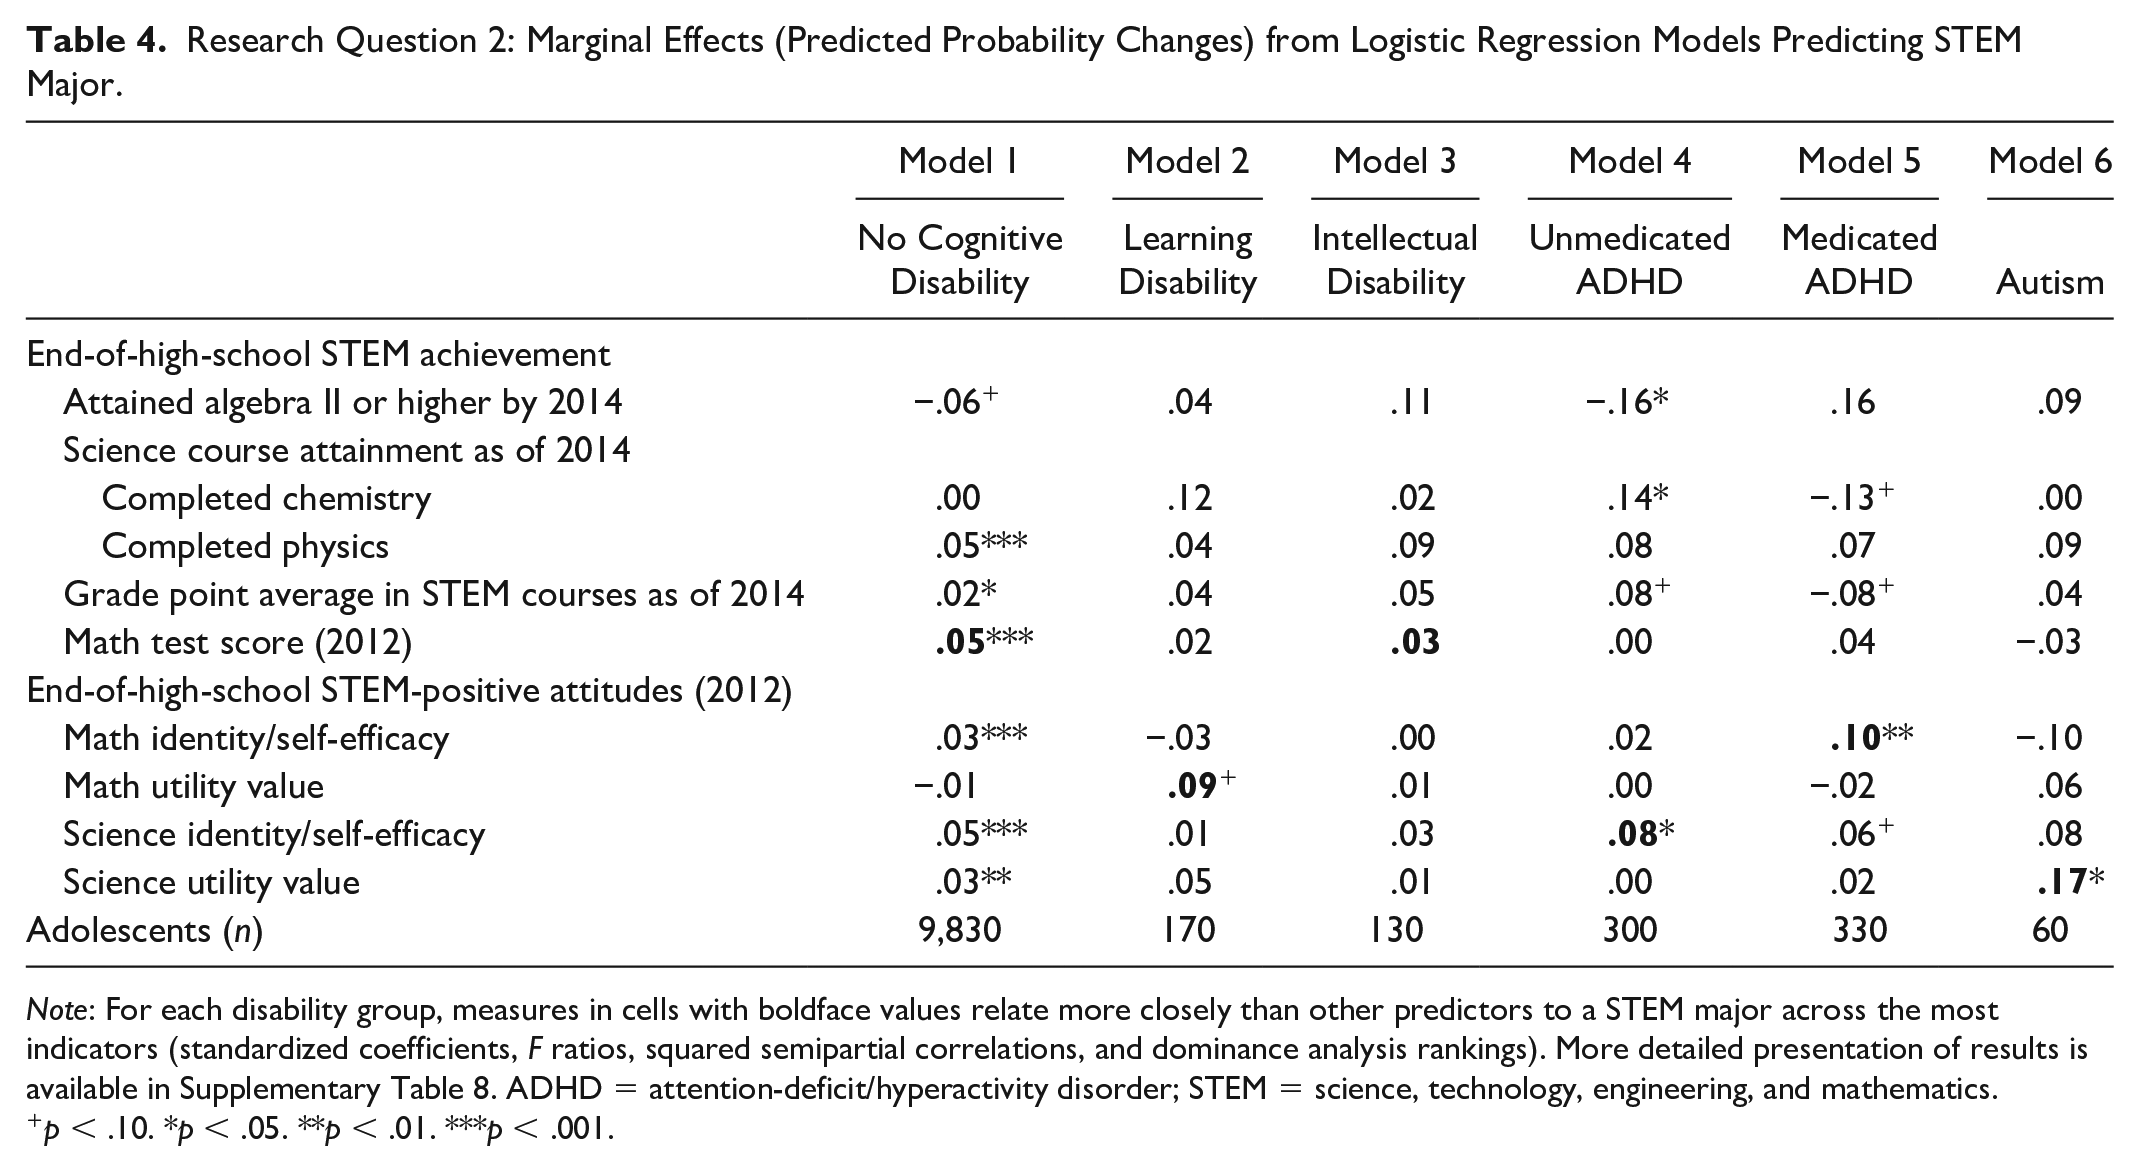
Note: For each disability group, measures in cells with boldface values relate more closely than other predictors to a STEM major across the most indicators (standardized coefficients, F ratios, squared semipartial correlations, and dominance analysis rankings). More detailed presentation of results is available in Supplementary Table 8. ADHD = attention-deficit/hyperactivity disorder; STEM = science, technology, engineering, and mathematics.
p < .10. *p < .05. **p < .01. ***p < .001.
Table 3 suggests that higher levels of high school achievement and STEM-positive attitudes typically increased the predicted probability of college enrollment regardless of disability status and type. Importantly, these results reflect the independent estimated effect of each measure of achievement and attitudes, with all measures included in the same model for each disability group. High school STEM GPA appears to have related more closely to an increased probability of college enrollment than other measures of achievement and attitudes for youth without cognitive disabilities (model 1), as well as for youth with learning disabilities (model 2), or unmedicated or medicated ADHD (models 4 and 5). With every 1-point increase in STEM GPA, the predicted probability of college enrollment increased by 11 to 13 percentage points, adjusting for related differences in achievement and attitudes. In exceptions, high school math test scores related most closely to college enrollment for youth with intellectual disabilities (model 3), and science identity/self-efficacy related most closely for youth with autism (model 6).
Table 4 shifts focus to the predicted probability of majoring in a STEM field among those who enrolled in college. Like college enrollment, higher levels of high school achievement and STEM-positive attitudes typically increased the predicted probability of a STEM major regardless of disability status and type. In contrast to college enrollment, positive attitudes toward STEM by the end of high school were typically more relevant for selecting a STEM major than end-of-high-school STEM achievement. With every 1 standard deviation increase in STEM-positive attitudes, the predicted probability of majoring in STEM increased by 9 to 17 percentage points. Math utility value was most relevant for youth with learning disabilities (model 2), science identity/self-efficacy for youth with unmedicated ADHD (model 4), math identity/self-efficacy for youth with medicated ADHD (model 5), and science utility value for youth with autism (model 6). Math test scores, in contrast, related more closely to majoring in STEM than other measures of achievement and attitudes for youth without cognitive disabilities (model 1) and youth with intellectual disabilities (model 3).
Discussion
This study enhances understanding of the underrepresentation of persons with disabilities in STEM fields through the use of a nationally representative longitudinal data set and the extension and expansion of long-established research themes with an understudied minority group. The results first suggest that youth with medicated ADHD have higher levels of STEM achievement at the end of high school than youth with other disabilities, while youth with learning or intellectual disabilities typically have the lowest levels. Undergraduates with medicated ADHD or autism may even be more likely to major in STEM than youth without cognitive disabilities. Youth with autism have the most positive STEM attitudes, even relative to youth without cognitive disabilities. Finally, results suggest that high school STEM achievement is more salient for college enrollment than STEM-positive attitudes across most youth, whereas attitudes are more salient than achievement for choosing a STEM major.
The findings of this study demonstrate that youth with cognitive disabilities are not a homogeneous group uniformly lacking in STEM potential, problematizing U.S. perceptions of youth with cognitive disabilities as “unable.” The variability across disability types and among youth with the same disability classification is indicative of the socially rooted and subjective nature of these disability classifications. Youth with autism had more positive STEM attitudes even relative to youth without cognitive disabilities, potentially because of the social-psychological benefits of cultural beliefs linking autism to unique talent (Grandin 2008; Reuters 2013). Both youth with medicated ADHD and those with autism are more likely to major in STEM than even youth without cognitive disabilities. This is consistent with earlier findings from Lee (2011) on all youth with disabilities but points to the importance of disaggregating by disability category.
Youth with medicated ADHD may be advantaged relative to other disability groups because they are more likely to receive accommodations through 504 plans (U.S. Department of Education 2016), which may be less stigmatizing and stratifying than special education. Their academic performance may also benefit from access to stimulants (Harrison et al. 2007; King et al. 2014), with the very poor STEM attitudes of youth with unmedicated ADHD in our study suggesting real potential benefits of medication. Diagnosis and medication are often a product of school intervention, with teachers encouraging parents to visit their pediatricians to resolve learning or behavior challenges (Brinkman et al. 2009; Cormier 2012; Sax and Kautz 2003). Youth with medicated ADHD and autism also had the most advantaged social backgrounds, even more advantaged than youth without cognitive disabilities along some measures. Similarly, the disability types with the poorest achievement outcomes, youth with learning and intellectual disabilities, also had the most disadvantaged social backgrounds.
Researchers document how a child’s social background shapes the disabilities youth actually experience (Konkel 2012; Shifrer, Muller, and Callahan 2011). Social background can also determine which disability type is used to describe a child’s learning differences, as well as whether learning differences are classified as a disability at all (Saatcioglu and Skrtic 2019; Shifrer and Fish 2020). Social background, finally, also shapes the experience of disability, with socially advantaged parents better able to secure less stigmatizing diagnoses, and better equipped to intervene and ensure their child experiences more of the benefits of special education, and fewer of the costs (Blanchett 2010; Ong-Dean 2009). These patterns demonstrate how learning and disabilities are a complicated product of social and biological differences, rather than biological differences alone.
Our findings support the importance of both achievement and attitudes for postsecondary STEM outcomes, but achievement typically matters more for college enrollment, whereas attitudes matter more for choosing a STEM major. We specifically find that adolescents’ high school STEM GPA is most salient for college enrollment. This runs counter to previous studies that find test scores are most salient (Allensworth et al. 2018; Long et al. 2012), although estimates in these studies were not adjusted for differences in attitudes. Results may also vary depending on whether the focus is on college enrollment or college success, or depending on the characteristics of the high school (Allensworth and Clark 2020). In exceptions, math test scores related most closely to college enrollment for youth with intellectual disabilities and science identity/self-efficacy for youth with autism. Both intellectual disabilities and autism tend to be perceived as the most severe disabilities, such that these youth may need something more concrete or personalized to be persuaded to enroll in college. Youth with intellectual disabilities, as well as youth without cognitive disabilities, were also exceptions in that their high school math test scores were most predictive of whether they chose STEM majors. Although Wang (2013) found that attitudes and achievement are both salient for selecting a STEM major, high school STEM attitudes related most closely to choosing a STEM major across most of the disability groups in this study. We found that identifying as a math or science person, feeling efficacious in their abilities, and perceiving math and science as useful for their goals most strongly predicted students’ decisions to major in STEM. Curriculum geared toward building student confidence and linking the material to things students care about, even for students with disabilities, might help boost postsecondary STEM pursuits.
Some limitations merit mention. The measures of disability available in the HSLS may reflect parents’ misunderstandings of different disability types. This study remains a contribution because of the general lack of data on cognitive disabilities, particularly in large diverse samples. This study also contributes a more comprehensive focus on disability by including those with and without IEPs. Confidence in findings is increased through the incorporation of a wide range of measures of STEM achievement and attitudes, but the potential influence of unmeasured factors should not be discounted. In all, this study disrupts common perceptions of disabilities and of STEM potential and increases understanding of the postsecondary STEM pathways of youth with cognitive disabilities. Like other social groups who are underrepresented in STEM fields, raising STEM achievement may not be solely sufficient for increasing the representation of youth with disabilities in STEM majors.
Supplemental Material
sj-xlsx-1-srd-10.1177_2378023121998116 – Supplemental material for Problematizing Perceptions of STEM Potential: Differences by Cognitive Disability Status in High School and Postsecondary Educational Outcomes
Supplemental material, sj-xlsx-1-srd-10.1177_2378023121998116 for Problematizing Perceptions of STEM Potential: Differences by Cognitive Disability Status in High School and Postsecondary Educational Outcomes by Dara Shifrer and Daniel Mackin Freeman in Socius
Footnotes
Acknowledgements
This study benefitted from suggestions from Drs. Amanda Bosky, Rachel Fish, Lynn Fuchs, Sander Greenland, Eric Grodsky, Sarah Lubienski, Laura Mauldin, Jennifer Pearson, Carrie Shandra, and Gwen Shusterman, as well as project colleagues Sarah Florig, Decatur Foster, Tristen Kade, and Ned Tilbrook.
Funding
The author(s) disclosed receipt of the following financial support for the research, authorship, and/or publication of this article: This research was supported by the National Science Foundation (DRL-1652279) and the National Institutes of Health–funded Build EXITO program at Portland State University (UL1GM118964). Publication of this article in an open access journal was funded by the Portland State University Library’s Open Access Fund.
Supplemental Material
Supplemental material for this article is available online.
1
Respecting varying language preferences in disability communities, we alternate between person-first language (people with disabilities) and identity-first language (disabled people) throughout this article.
2
NCES requires that unweighted frequencies be rounded to nearest 10.
3
Author Biographies
References
Supplementary Material
Please find the following supplemental material available below.
For Open Access articles published under a Creative Commons License, all supplemental material carries the same license as the article it is associated with.
For non-Open Access articles published, all supplemental material carries a non-exclusive license, and permission requests for re-use of supplemental material or any part of supplemental material shall be sent directly to the copyright owner as specified in the copyright notice associated with the article.