
Abstract
For over 30 years, researchers such as Eisenberg and McGinty have investigated the relationship between 3-D visualization skills and choice of college major. Results of the present study support the fact that science and math majors tend to do well on a measure of 3-D visualization. Going beyond these earlier studies, the present study investigated whether a measure of Rapid Automatic Naming of Objects—which is normally used to screen for elementary school students who might struggle with speech, language, literacy, and numeracy—would further differentiate the choice of majors by college students. Far more research needs to be conducted, but results indicated that college students differentially clustered in scatterplot quadrants defined by the two screening assessments. Furthermore, several of these clusters, plus a statistical multiplier, may lead to a new understanding of students with phonological processing differences, learning disabilities, and speech and language impairments.
Keywords
This article describes a study with three levels of focus. The first level was confirmatory. Since at least Eisenberg and McGinty’s study was published in 1977, it has been known that college students majoring in science and math tend to have better visualization skills than students enrolled in math courses for other majors, such as elementary education. Furthermore, as has been shown by Medina, Gerson, and Sorby (1998), there seems to be a minimum level of visualization skill necessary for college students to succeed in majors such as science, technology, engineering, and mathematics (STEM). More recently, researchers have found visualization is useful to perform some STEM-related tasks outside the classroom (Lathan & Tracey, 2002; Menchaca-Brandan, Liu, Oman, & Natapoff, 2007; Piburn et al., 2005). In addition, researchers have begun to demonstrate visualization can be improved in ways that help students succeed in college. For example, Sorby (2000) and Boersma, Hamlin, and Sorby (2004) enrolled college engineering students with low visualization skills into mini-courses designed to improve their visualization skills. These studies found that the mini-courses not only improved the student’s visualization skills, but they raised the student’s grade point averages (GPAs) and a higher percentage of them graduated with an engineering degree. Similarly, Onyancha and Kinsey (2007) have shown engineering courses can be designed to improve visualization.
Thus, to set a baseline for future implementation of visualization courses, the research question for the confirmatory level of focus was, “Do college students enrolled in a calculus class for math and science majors have higher levels of visualization ability than Early Childhood majors enrolled in a literacy assessment course?”
The second level of focus was to determine if there were other majors where visualization could be predicted to be necessary. For example, students were tested in three fine arts courses: Music Theory, Printmaking, and the Foundations of 3-Dimensional Art. The study also expanded beyond elementary education majors to several other education majors where it could be expected visualization may or may not be required. For example, this study’s participants included future K-3 early childhood teachers, Grades 4 to 8 middle childhood teachers, and high school science, math, language arts, and social studies teachers.
The research question for this second level of focus was, “Do students enrolled in college classes that seem to present prima facie evidence of requiring visualization have higher scores on a test of visualization than students enrolled in classes and majors where visualization does not seem to be required?
The third level of focus was exploratory. Researchers in the field of learning disabilities have long believed that with proper early intervention, students with learning disabilities who are given appropriate early interventions might succeed in certain fields. Corina et al. (2001) referenced the Aesop Fable to suggest that proper early intervention can help the methodical tortoise outrace the hare. A metaphor that is based on a tortoise seems appropriate to this study because slow times on assessment of rapid automatic naming (RAN) have long been correlated with the phonological processing disorders manifested in many students with speech and language impairments and learning disabilities. For example, in their meta-analysis, the National Early Literacy Panel (2008) found that measures of RAN of Objects have a moderate correlation with early reading failure (Objects r = .32 and Letters/Digits r = .40).
Unfortunately, Aesop’s fable version of the tortoise metaphor relies on the hare being lazy. A better tortoise metaphor might be built around E. O. Wilson’s (1999, 1978/2004) interpretation of evolutionary niches as well as Charles Darwin’s studies of the ecology of the Galapagos Islands. In terms of evolutionary biology, a tortoise trades off the advantage of carrying around a defensive shell for the disadvantage of slow mobility. Thus, the tortoise does not have to “catch” the hare to thrive; the tortoise merely has to live in an ecological niche where a defensive shell is a bigger advantage than possessing blazing speed.
The fact that RAN speed can differ depending on the task is supported by MacLeod (1991) theory of parallel processing. He suggested that differences in the quantity of parallel processors would explain differences in how long individuals take to complete a RAN task that has cognitive interference (i.e., Stroop effects). For example, it is much easier to name a series of objects when a word printed on top of the object is the same as the name of the object than when the printed word is different from the name of the object. Similarly, if the object is a line-drawing of a boat, then naming the object as being a “boat” is easier to do if the word “boat” is printed on top of a pictured boat than it would be to do if the printed word is “car.” Similarly, if the word “red” is printed in purple ink, it takes longer to name the ink as being purple than it is to name the printed word as being “red.”
When interpreting the results of an earlier study on a phonemic awareness intervention, Oldrieve (2005, 2007a, 2007b) used MacLeod (1991) theory to hypothesize that students with slow times on RAN would tend to devote more parallel processors to a given task than students with fast times. And that in early elementary school, this tendency makes it harder for them to make appropriate paired associations—for example, a beginning reader learning to
Identify that a specific letter sound is represented by a given written letter;
Identify that a given letter makes a specific sound;
During spelling, match spoken phonemes to written graphemes; and
During reading, decode written words into spoken words.
Yet, with more complex comprehension and problem-solving tasks—like those found in upper level college courses—the Oldrieve hypothesized that a student who tends to devote more parallel processors to a given task would have an advantage. Thus, Oldrieve hypothesized that students who name objects more slowly than their peers in elementary school, and who succeed in learning how to read, write, and do arithmetic (with or without having been officially diagnosed with a phonological processing disorder), and who succeed in getting accepted into college, may do well in college courses where complex comprehension and/or problem solving is required.
Admittedly, this is a correlational study instead of a longitudinal study. Therefore, it cannot causally show that the students who manifested slow rapid automatic times when they were tested for this study would have manifested slow times in elementary school. Therefore, the two third-level research questions are as follows:
What college majors would college students with slow RAN of Object times tend to be found?
Would there be any interaction effects between RAN of Objects times and Purdue Spatial Visualization Test: Rotations (PSVT:R) percentages that could be found on scatterplots?
Method
Multi-level Research Team
Just as this study has three levels of research questions, this study was conducted with the help of a three-level research team. At the top level, the overall funding grant for this study came from a consortium of four universities, an open enrollment community college that serves as a feeder school to the universities, and dozens of K-12 schools. The mission of COSMOS: the Northwest Ohio Center for Excellence in STEM Education is to improve math and science education for kindergarten to doctoral-level students.
The second level originated within a teaching and learning community sponsored by one of the participating universities. This teaching and learning community focuses on improving science and math education at the university where it is held. Members include professors and graduate students who teach college students algebra, biology, calculus, chemistry, environmental health, geology, physics, psychology, statistics, math education, science education, and literacy assessment. To fund the present study, six members of the teaching and learning community helped write a grant from the overarching consortium. They also helped collect the data within their math and science classes. They also recruited a member of the overarching consortium to collect data at her community college.
It was Oldrieve who convinced the other members of the teaching and learning community’s research team to include Wiig, Semel, and Nystrom’s (1982) assessment of RAN of Objects. Furthermore, Oldrieve recruited the fine arts and literacy assessment professors to grant us 30 min of class time to assess their students.
In addition, Oldrieve recruited Bertelsen, a fellow literacy professor, to supervise the “blind” data handling, and to help write and edit conference proposals, conference presentations, and this article. Graduate students in the literacy program were then recruited by the literacy professors to proctor the assessments in the literacy assessment and fine arts classes. The graduate students then helped collect, collate, and input the data into an excel database. The complete team of Oldrieve, Bertelsen, Darabie, Bullerjahn, Filippova, Bragg, Keil, & Meel (2008) reported preliminary results at a conference sponsored by the COSMOS consortium which funded the study.
After the excel database was created, it was analyzed by (a) Oldrieve, who conducted the SPSS analysis and formatted the scatterplots; (b) a statistics professor, Nancy Boudreau, who made the suggestion of using fine arts classes and who conducted an SAS analysis to check Oldrieve’s work; and (c) a doctoral student in statistics, Ngoc Nguyen, who found the statistical multiplier. Then the results were checked again by another statistics professor, Mike Gillespie.
Next, several of the math and science professors participated in a presentation of this study’s overall results at the consortium’s annual symposium. The math and science professors then used the data set to focus on the visualization data to improve their own teaching and decide whether to replicate the 10-week visualization course developed by Sorby (2000) and her colleagues (Boersma et al., 2004).
It is also important to note that both the overarching consortium and the university’s faculty research organization have provided additional grants for developing online administration of the assessments. In addition, as a follow-up to this study, the organizers for the consortium’s last two annual symposiums allocated the two literacy professors a conference room to conduct an all-day participatory action research project, where symposium attendees could stop in for 20 min to take the demographic survey and two assessments on iPads.
Participants
The original study included a total of 356 students who were either enrolled at a Community College located on the outskirts of an industrial city of a few hundred thousand residents or at a mid-sized State University located in a semi-rural area approximately 20 miles outside the city’s limits. The Midwestern Community College (MWCC) serves as a feeder school to the Midwestern State University (MWSU). MWSU is moderately selective and serves a predominately residential undergraduate student population.
At MWCC, five sections of introductory Biology 201 for health and science career majors were assessed. In addition, MWCC participants were tested from three sections of Microbiology 251—the third course in the biology sequence. Fortunately, the testing went well in Biology 201. Unfortunately, the projector and computer combination in the Microbiology classroom did not sync with the MS Excel program that was being used as the official timer. It could have been the computer was incompatible with the projector, or the computer’s operating system was incompatible with the special software coding being used by the timer’s MS Excel file, or the computer’s microprocessor was too slow. Thus, the RAN of Objects results for the three sections of the Microbiology class results could not be used in the study’s grand mean. Consequently, the results from the microbiology students on the PSVT:R were also excluded from the study’s grand mean. Nonetheless, the PSVT:R for these Microbiology students will be used for comparative purposes in the “visual analysis” section.
At the university level, professors volunteered their classes from a variety of fields. These included one freshman/sophomore-level art printmaking and one freshman/sophomore-level 3-D art course, one sophomore-level music theory (Aural Music IV), three senior-level Early Childhood Education (ECE) reading assessment, two senior-level Middle Childhood Education (MCE) reading assessment, three senior-level Adolescent and Young Adult (AYA) classroom assessment classes, one introductory calculus for math and science majors, and one junior-level industrial hygiene class. Although both art classes were freshman/sophomore level, there was little overlap in which art majors were taking the two courses the semester they were assessed. Finally, it must be noted that no engineering courses were enrolled because MWSU does not have an engineering program.
All 356 students were tested at the beginning of the semester. About half of these students were tested a second time at the end of the semester to determine if there were any classes which improved the visual processing of enrolled students. Most of the research team would have hypothesized that the 3-D art class would have had the best prospect of improving visualization ability. No class had marked improvement.
In statistical terms, it is recognized that each student’s data are an artifact of each student being nested within a particular section, a particular class type, within a given field, and within a given university situation. In general, class type was used when conducting statistical analysis of the numerical data and visual analysis of the scatterplots. Nonetheless, for each section of a class, a visual analysis of the scatterplots and a statistical analysis of the numerical data were conducted to see if they represented the same trend as the class as a whole.
Instrumentation
Self-reported data
During the class session before the assessments were administered, professors distributed a cover letter that explained the purpose of the study. They also distributed a permission slip approved by the Internal Review Boards of both MWCC and MWSU. Then, during the next class session, members of the research team would show an MS Power Point presentation that explained the purpose of the study. Students were also given a chance to ask questions about the tests, the permission slip, and/or their ability to opt out of taking the assessments. Because various members of the research team presented the MS Power Point to a given class, there could easily have been different points of emphasis and tones.
After the MS Power Point, participants were asked to answer 12 demographic questions. Some questions pertained to grade level, age, gender, and college major. As there were only five possible responses to the questions about the ethnic/racial background of the students, some students expressed discontent and wished more choices, such as “multi-racial,” had been offered as opposed to African American, Asian American, White European American, Hispanic American, and International Student/ESL. The last category was meant to separate out students who might be naming objects in their second language.
PSVT:R
After reviewing numerous tests purporting to measure “visualization,” the team members settled on Bodner and Guay’s (1997) PSVT:R sub-test as a good core assessment of visualization to be used for this study. On a written request to use the assessment, and to eventually post an online version of it, Bodner himself sent the research team a 20-question version with a 10-min time limit. One reason for choosing the PSVT:R was that it seems to measure a key component of visualization that would be required for doing well in math and science:
The spatial visualization factor measures the ability to mentally restructure or manipulate the components of the visual stimulus and involves recognizing, retaining, and recalling configurations when the figure or parts of the figure are moved. (Bodner & Guay, 1997, p. 6)
The PSVT:R also had four other key features that would make it easy to give within the 20 to 25 min time frame (i.e., half a typical 50 min college class) that even the art and music professors were willing to allot:
The PSVT:R assessment has a 10-min time limit.
The PSVT:R was designed to be given to large groups.
Many researchers have used the PSVT:R in the previously mentioned studies of college students (Charyton, Jagacinski, Merrill, Clifton, & DeDios, 2011; Sorby, 2000) or in studies finding visualization effects in outside the classroom situations (Lathan & Tracey, 2002; Menchaca-Brandan et al., 2007; Piburn et al., 2005).
The PSVT:R is an open source and therefore costs nothing to administer to hundreds of students.
See Figure 1 for the introductory sample question from the PSVT:R.

Introductory sample question from PSVT:R.
It should also be noted that in a personal communication, Sorby (May 24, 2012) mentioned that the standard version of the PSVT:R has 30 questions in which 20 min are allotted, and that her team had developed a 10-question version in which participants were allotted 7 min. Mathematically, it would then stand to reason that a 20-question version should have been allotted 14 min. As will be explained later, results also supported a 14 min limit. Thus, the online version for future studies was given a 14 min time limit instead of a 10-min limit.
RAN of Objects
The Rapid Automatic Naming (RAN) of Objects assessment used in this study was developed by Wiig et al. (1982) to help screen for Specific Language Impairments (SLI) in elementary schools. In addition, Wiig et al. mention that their assessment should be useful for screening for Specific Learning Disabilities (SLD) and dyscalculia. Wiig et al.’s assessment has eight objects arranged in an 8 × 4 grid in which six items are repeated 4 times, one object is repeated 5 times, and another object is repeated 3 times. The object names of key, comb, pen, ring, book, cup, cat, spoon would have been familiar to the 8-year-olds used in Wiig et al.’s study as well as the college students used in this study (though when practicing, college students often named the spoon as tennis racquet or magnifying glass). The names were purposely chosen by Wiig et al. to intermix the /k/ sound in the first and last position in five of the eight words, while the nasals of /m/,/ n/, and /ng/ are intermixed in four of the eight words. Each of the eight words contains a different medial vowel sound.
The protocol asks the test administrator to have the participant practice naming the objects in advance of the tests so as to allow clarification and ensure everyone is calling the spoon a spoon as magnifying glass or tennis racquet would take longer to say than spoon. Consequently, any hesitations and/or misnamings would be assumed to occur more often due to the processing difficulties posed by memory searching and/or the phonological processing needed to complete the task.
Like the PSVT:R, one reason for choosing Wiig et al. (1982) RAN of Objects assessment is that it is open source. Another reason is that Wiig et al. report that the RAN of Objects is relatively immune to improvement through practice on the task. Then, in a more recent study, Wiig, Zureich, and Chan (2000) found that teenagers with diagnosed learning disabilities continued to have slower RAN of Objects times than matched aged control students. In contrast, Wiig et al. (2000) found that other assessments of RAN, such as those focusing on numbers, letters, and sight words, lose their predictive value for speech, language, and SLD as the students learn the academic skill, and become fluent in naming the numbers, letters, and numbers. Thus, Wiig et al.’s RAN of Objects assessment should prove useful for longitudinal studies.
As was mentioned earlier, the fine arts and literacy assessment professors who allowed us into their classes preferred that the assessment battery be completed within a 20 to 25 min time frame (half of a typical college class period). Thus, it was clear that it would be too time-consuming to have three or four graduate students individually assess all the students enrolled in a 50-person class. As a concession to time limitations, each participant was asked to concentrate on naming the objects amid the verbal chaos of a simultaneous reading, and then when they were finished they were asked to look up at a projected timer and record their own time.
Because of fortuitous extenuating circumstances in several classes, 58 students took the test one-on-one AFTER taking it en masse. For example, one professor let us administer the assessments on the day he was leaving to attend a conference. Thus, after he introduced us, he left for the airport, and we had 48 min to show the power point, have students fill out the survey, take the PSVT:R, and take the RAN of Objects Assessment both en masse and one-on-one. Even with the extra time required to administer the RAN of Objects assessment one-on-one, class members were happy because we let them out 10 to 15 min early.
The correlation between the en masse and one-on-one administrations was r = .638 and p < .001. Admittedly, this demonstrates the en masse administration made the results less reliable and valid, but lower validity was already a given as Wiig et al.’s assessment was designed for elementary school students and had not been used on college students. (See the results of Aural Music IV for more explication on the slightly lower r value than normally considered “valid” and “reliable.”).
Grades
At the end of the spring semester, every professor whose class participated in the study sent the research team a list of each student’s name, ID number, the letter grade, and the percentage the student earned in the class. The percentages were then converted to z scores to compare one class to another. The research team was aware that there were differences among classes of different grade levels, and although they were not ideal, z scores seemed like they would be the best comparative tool.
Results
Overall Statistics Related to PSVT:R
Table 1 contains the overall means for the PSVT:R and the RAN of Objects. For the PSVT:R, Table 2 contains the average PSVT:R percentages and standard deviations for all nine class types sorted from highest to lowest. Table 2 reveals that there was a large gap between the highest class average of 70.91% for Printmaking at MWSU, and the lowest class average of 51.76 for Biology 201 at the MWCC. As depicted in Table 3, an ANOVA followed by a Tukey’s analysis (see Table 4) revealed there was a statistical difference between Biology 201 and the classes of Music Theory IV and Calculus for Math and Science Majors. Due to smaller class sizes, neither printmaking nor 3-D art were found to be significantly different from Biology 201. Although, when combined into a single category of “visual arts,” the combined class was significantly different from that of Biology 201.
Overall Descriptive Statistics for Individual Students.

Note. PSVT:R = Purdue Spatial Visualization Test: Rotations; RAN = rapid automatic naming.
PSVT:R Scores Sorted From Highest Class Average to Lowest.

Note. PSVT:R = Purdue Spatial Visualization Test: Rotations; RAN = rapid automatic naming; AYA = adolescent and young adult; MCE = middle childhood education; ECE = early childhood education.
Overall ANOVA Results: Comparing Courses.

Note. PSVT:R = Purdue Spatial Visualization Test: Rotations; RAN = rapid automatic naming.
Tukey’s Studentized Range (HSD) for PSVT:R.
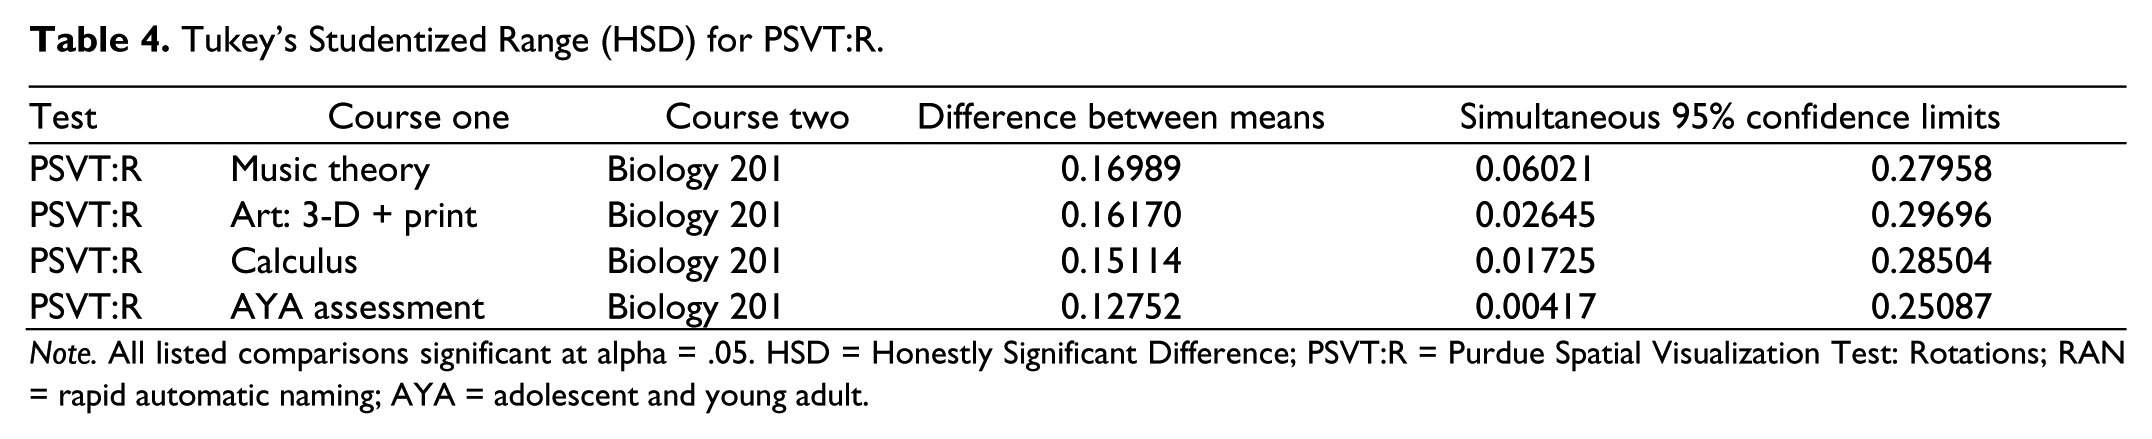
Note. All listed comparisons significant at alpha = .05. HSD = Honestly Significant Difference; PSVT:R = Purdue Spatial Visualization Test: Rotations; RAN = rapid automatic naming; AYA = adolescent and young adult.
As discussed earlier, the average percentage for the PSVT:R in MWCC’s Microbiology 251 was not included in the grand mean, because the projector, computer, and/or MS Excel timer did not sync well. Nevertheless, the average PSVT:R percentage for this third course in the MWCC’s biology sequence for biology and health career majors was 64.16%. This percentage is right in line with the PSVT:R percentages for MWSU’s Industrial Hygiene for health career majors (64%).
Brief Discussion of PSVT:R Results
In many ways, the fact that the Biology 201 PSVT:R scores were the lowest of any class measured seems rather incongruous with the hypothesis that students enrolled in math and science courses would tend to attain high scores on the PSVT:R. Even more so as Biology 201 is the first course in the sequence of courses designed for future biology majors while Biology 101 would be the course non-majors would take. Nonetheless, the community college has an open enrollment policy while the university has minimum requirements for ACT scores. Furthermore, other than the three fine arts courses, the university students would have been required to have taken or placed out of the university’s introductory level math courses before taking the upper grade level course where they were assessed for this study. Thus, it is important to note that 11 students enrolled in Biology 201 scored more than 2 standard deviations below the grand mean (approximately 20% or less) for visualization, then two courses later in the sequence only 1 student in Microbiology 251, and no students enrolled in the university, scored that low. Thus, Biology 201 seems to be an MWCC course that serves to either: (a) that improve the visualization skills of potential science and health professionals who come to school with low visualization ability; or (b) sort out students who are low in visualization ability from completing the Bio sequence.
Furthermore, the fact that Aural Music IV and a combined score for Printmaking and 3-D art would be significantly higher than Biology 201 supports a prima facie logic test that music majors and visual arts majors would be better at visualization.
It also seems to be important to point out that Sorby (2000) and Boersma et al. (2004) set a cut-off percentage of 60% for determining whether engineering students should be advised to take a mini-course in visualization. The average PSVT:R percentages for all the courses, except Biology 201 and Early Childhood Literacy Assessment, exceeded the cut-off percentage of 60%. And the Early Childhood average percent correct of 58% was off by less than one wrong answer.
Overall Statistics Related to RAN of Objects
As can be seen in Table 5, on the RAN of Objects assessment there was nearly a 2-s gap between the fastest class average time of 16.79 s for Aural Music IV and the slowest class average time of 18.47 for Middle Childhood Reading Assessment. Nonetheless, an ANOVA followed by a Tukey’s analysis revealed no statistical differences between any classes matched against any other class.
RAN of Objects Times Sorted From Fastest Class Average to Slowest.

Note. RAN = rapid automatic naming; MWSU = Midwestern State University; MWCC = Midwestern Community College; AYA = Adolescent & Young Adult; ECE = Early Childhood Education.
In contrast, when looking at the individual student, a statistically significant multiplier was found that indicated slower times might lead to better class grades. For example, for each second, longer a student took to complete the RAN of Objects assessment, the student had a 1.04 greater chance to earn a course grade that was half a standard deviation above the mean for that particular course.
Brief Discussion of RAN of Objects Results
The fact that there were no statistically significant differences from one class to another on RAN of Objects seems to suggest that students do not use their intuitive sense of their own naming speed to influence their choice of a major. This was supported by the demographic survey’s self-identification profiles when there was a statistically significant correlation of r = .398 between how a student thought they would do on the PSVT:R and how well they actually did. In contrast, there was a much lower, though still highly significant correlation of only r = .169 between a student’s prediction of being fast or slow and their actual results (see Table 6).
Highly Significant Correlations.
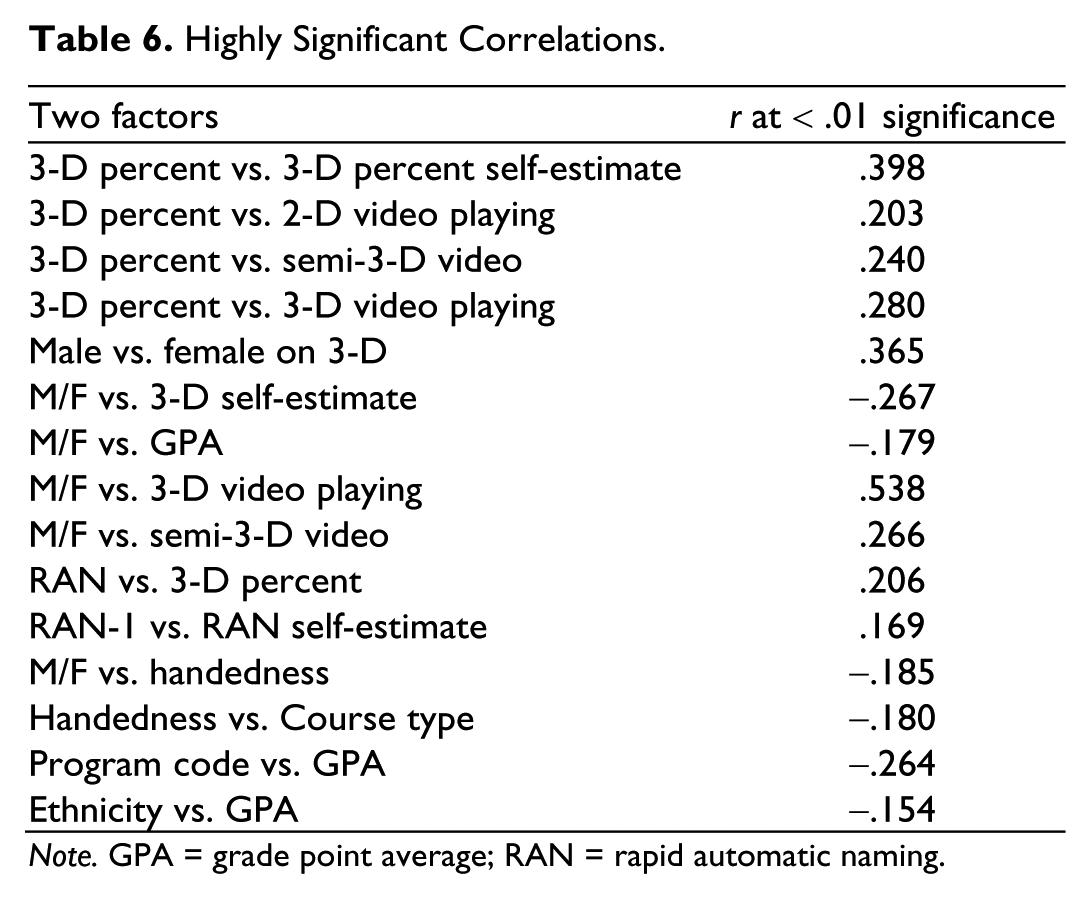
Note. GPA = grade point average; RAN = rapid automatic naming.
Yet, the fact that for every second slower a student takes to complete the RAN of Objects assessment increases the odds the student will do well in a given course, suggests that college professors might “value” whatever benefits slow times on RAN of Objects tests might bequeath to a given individual. In essence, the National Early Literacy Panel (2008) and notable researchers such as Denckla and Rudel (1974, 1976a, 1976b); Fawcett and Nicolson (1994); Korhonen (1991, 1995); Spring and Perry (1983); Torgesen (1988); Wolff, Michel, and Ovrut (1990) have found being slow on RAN assessments is correlated with struggling to learn phonemic awareness and phonics in pre-school and kindergarten. In contrast, this study found that being slow on Wiig et al. (1982) RAN of Objects increased the chances a college student could earn a high grade in a college class. The fact that the relationship was NOT a perfectly linear correlation makes sense as there are always limitations of completing a project on time in any class, and these limitations would tend to favor a fast-processor, because even a musical composition, art project, or take-home final has a deadline.
Visual Inspection of Scatterplots of PSVT: Rand RAN of Objects Results
A key premise of Single Subject research (Kazdin, 1982) is that there is little chance for statistical significance when comparing a small number of students to their own progress from condition A to condition B and back to A. Thus, Kazdin suggests that when conducting small n studies, visually different results should be considered to be adequate evidence that a given treatment has had an academically significant effect. Consequently, the researchers wondered whether there might be some intra-group, small-group effects that would show up in a visual analysis of scatterplots that combined PSVT:R and RAN of Objects results.
To make the analysis more intuitive, Y-axis was devoted to “visualization” because “high visualization” would correspond to being near the top of the scatterplot, while “low visualization” would correspond to being near the bottom of the scatterplot. Similarly, the X-axis was used to represent times on the RAN of Objects Assessment. Thus, fast times nearer to zero would be closer to the left-hand edge. In contrast, slower times will be higher numbers near the right hand edge of the scatterplot. The fact that the four quadrants are not equal size is due to the fact that the scatterplots were designed so the X-axis is bisected by the Y-axis right at the grand mean time for RAN of Objects: 17.56 s. Thus, it was possible for students to name objects 2 or 3 standard deviations slower than the mean but it was very hard to name objects more than 1 standard faster. Similarly, the scatterplots were designed so the Y-axis is bisected by the X-axis right at the grand mean PSVT:R percentage correct: 61.875% as opposed to 50%.
In the next few sub-sections, the scatterplots of classes, or sub-groups of classes, will be presented that delineate four quadrants:
Fast Processing and High Visualization in the upper-left quadrant.
Slow Processing and High Visualization in the upper-right quadrant.
Slow Processing and Low Visualization in the lower-right quadrant.
Fast Processing and Low Visualization in the lower-left quadrant.
Visual analysis of MWCC’s Bio 201
A quick visual analysis of the scatterplot for Biology 201 (see Figure 2) indicates that the students enrolled in Biology 201 are spread fairly evenly between the four quadrants defined by the PSVT:R percentages and RAN of Objects times. Although, a closer inspection reveals that there are many more students in the lower left quadrant than the upper right quadrant. Also, a visual analysis of the scatterplots for Biology 201, found that 11 students scored more than 2 standard deviations below the mean for PSVT:R. Then, when the scatterplots for all of the other classes were analyzed, only 1 MWCC’s Microbiology 251 student and no MWSU student scored more than 2 standard deviations below the mean. Hence, a reasonable conjecture would be the community college’s open admission policy allowed some students to enroll in Biology 201 who were either low on visualization or less motivated than their counterparts to take the PSVT:R assessment seriously.

Biology 201 at MWCC.
Visual analysis of MWSU’s Early Childhood Literacy Assessment
Students enrolled in the Early Childhood Reading Assessment class at MWSU (see Figure 3) mirrored the results of the students enrolled in Biology 201 at MWCC, with students found in all four quadrants (compare Figures 2 and 3). One major difference being that the extremes in all four directions were muted with most students within 1 standard deviation of the grand mean of both visualization and processing speed. In particular, as was already noted, there were 11 students enrolled in Biology 201 who scored more than 2 standard deviations below the Grand Mean on the PSVT:R, whereas, there were no students enrolled in Early Childhood Reading Assessment or any other class at MWSU who scored this low. The fact that there were no students with extremely low scores on the PSVT:R could be explained because Early Childhood majors may NOT enroll in the assessment class UNTIL they (a) pass a 200-level course targeting math skills, (b) earn a 3.2 overall GPA (grade point average), AND (c) either pass the Praxis I exam with a 172 on the math section or earn a 22 on the ACT.
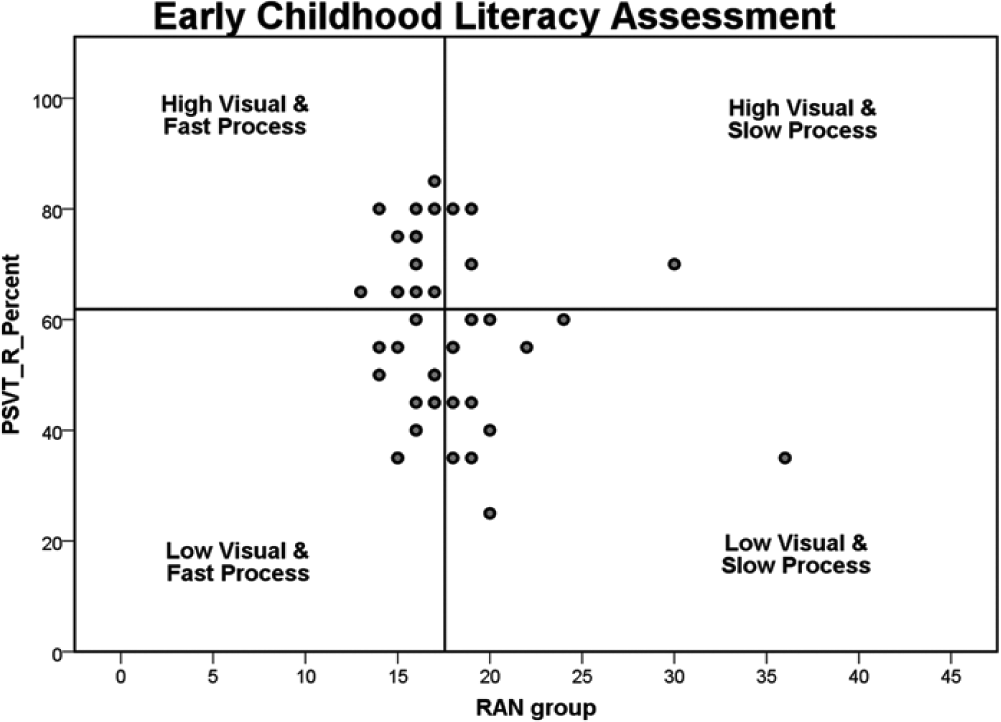
Early Childhood Reading Assessment at MWSU.
Verbal analysis of MWSU’s Calculus class for math and science majors
A similar “centered” pattern was found in the Calculus class for math and science majors. The key difference between Calculus, Early Childhood Literacy Assessment, and Biology 201, is that the top score for Calculus was almost 1 standard deviation higher than it was for Early Childhood Literacy Assessment, and the lowest score was between the mean and 1 standard deviation below the mean. This is higher than that between 1 and 2 standard deviations below the mean for Early Childhood Literacy Assessment, and more than 2 standard deviations below the mean for 11 students enrolled in Biology 201.
As noted earlier, the PSVT:R scores for calculus were found to be significantly different from those of Biology 201. Thus, as predicted by the previous results of Eisenberg and McGinty (1977), for the class average of 3-D visualization there was trend up the Y-axis when moving from Biology 201, to Early Childhood Reading Assessment, and on to Calculus. Based on course prerequisites and the demands of the fields, presumably scores on a norm-referenced math assessment such as the Praxis I, the ACT, and/or the Graduate Record Examinations (GRE) would follow the same upward trend.
It should also be noted that a few sections of Microbiology 251, the third course in the sequence of courses for MWCC biology majors, also participated in this study. As noted earlier, there was a projector, computer, and/or software synchronization issue with the MS Excel timing program and so the PSVT:R scores and RAN of Objects were not included in the Grand Mean. Nonetheless, the average PSVT:R score for Microbiology 251 was 64.16%. This percent falls in line with scores for the PSVT:R averages for Industrial Hygiene (64%) at MWSU.
Visual analysis of MWSU’s Aural Music IV
A quick visual inspection of Aural Music IV suggests that most of the students were located in the upper-left quadrant of Fast RAN times and High Visualization scores (see Figure 4). A closer visual analysis indicates all but 7 of the 55 students were faster than the grand mean on the RAN of Objects. A check through the self-promoted demographic profiles of these seven students found that all seven of these individuals self-identified as ambidextrous. This created a distinct contrast with their classmates as NONE of their classmates who were faster than the mean self-identified as ambidextrous. This might suggest more detailed interviews are needed to determine underlying factors of this fast/slow divide, especially as other researchers such as Goldberg (2001) have noted ambidexterity can be a hallmark of creativity and the fact students are using both hemispheres of the brain; or in terms of MacLeod (1991), creative students may be using more parallel processors.

Aural Music IV—Most students faster than RAN of Objects grand mean.
Plus, going back to the correlation between the individual administration of the RAN of Objects correlation of r = .638 and p < .001, it is interesting to note that it was the Aural Music IV class which not only had the fastest average time of 16.79 s, but the largest standard deviation of 7.66 s. The fastest average times seems to make prima facie sense for a major where musicians are trained to simultaneously try to fit into the group while paying attention to their own score and performance; this is because they would tend to be less flustered by aural chaos. However, the largest standard deviation seems to be surfacing another neurological trait of those who were simultaneously slower than the grand mean and ambidextrous. Future studies could target musicians to ask them what field of music they were majoring in and whether they were training to become a performer, director, or composer.
Finally, it should be noted that five of the students in the Aural Music IV class earned perfect scores on the PSVT:R. Only one other student in the study, who was enrolled in the calculus class, had a perfect time on the RAN of Objects. All six of these students completed their RAN of Objects assessment faster than the grand mean. In contrast, the highest PSVT:R score for students with times slower than the grand mean was 85%. This, plussubsequent informal and formal assessments, would suggest that to be fair to both fast and slow processor, the 20-question version of the PSVT:R should be allotted 14 min of time to complete. Or even more ideally, the amount of time a student is allotted to complete the test could be based on his or her RAN of Objects time.
Visual analysis of 3-D Art
As can be seen in Figure 5, the students in the 3-D Art class tended to have times slower than the Grand Mean on the RAN of Objects test, and the class average on the PSVT:R was higher than the Grand Mean. Thus, students in 3-D Art tended to be grouped in the upper right hand corner. This contrasts with Aural Music IV where students were grouped in the upper-left and to some degree in the lower right corner. The overall ANOVA found no statistical significant differences between the two classes on RAN of Objects.

3-D Art: Most students slower than RAN of Objects grand mean.
As a comparison, both the technically oriented art class of Printmaking and the technically oriented class of Industrial Hygiene had above the mean scores on 3-D visualization, AND straddled the Grand Mean for RAN of Objects. In fact, Industrial Hygiene had the second fastest average RAN of Objects time of 16.90 s and the smallest standard deviation of 2.33.
Distinct Patterns of Future High School Students Are Linked to Specific Quadrants
There were distinct patterns in scatterplots that could be linked to the content area the Adolescent and Young Adult (high school) majors intended to teach and their scores. Future high school math and science teachers overwhelmingly scored above 45% on the PSVT:R. Intriguingly, the future high school science teachers were clustered in the upper-left-hand quadrant of fast RAN of Objects and high visualization (see Figure 6). In contrast, the future high school math teachers tended to name objects slower than the Grand Mean (see Figure 7). Using an ANOVA specifically targeting future Math and Science teachers, there was a statistically significant difference between the two groups on the RAN of Objects (F = 5.852; p = 0.032); but not on the PSVT:R (F = 0.196; p = .666).

Adolescent and young adult science teachers at MWSU: High visual/fast processing.
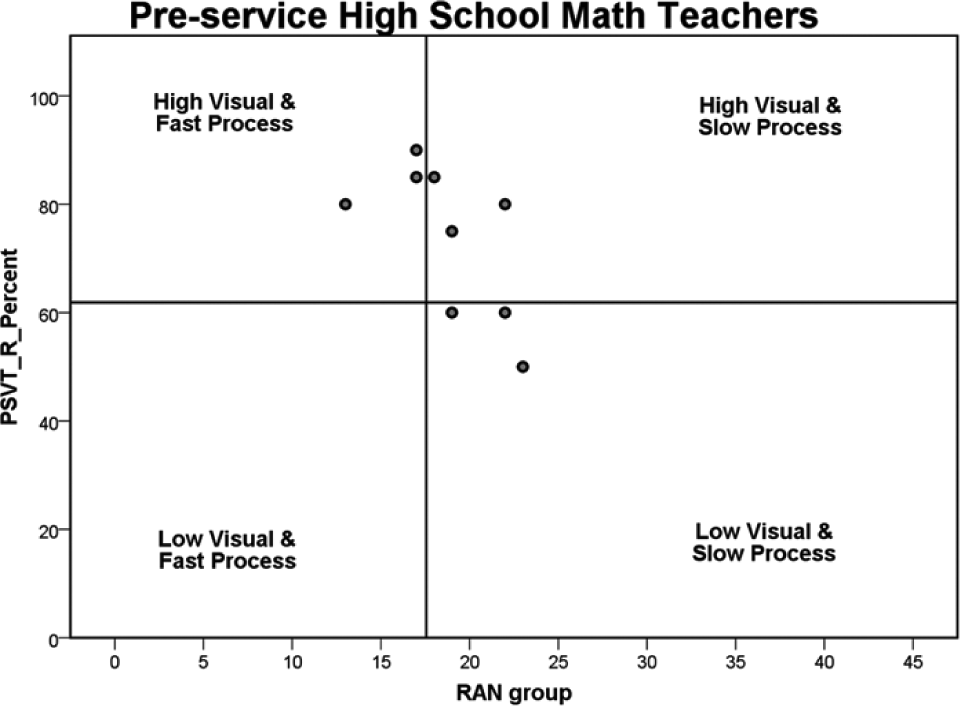
Adolescent and young adult math teachers at MWSU: High visual/slow processing.
It should also be noted that it is “common knowledge” that math and music go together. The results of this study suggest that this may not be quite true, because it was music majors and future science teachers who were located in the upper-left quadrant of high visualization and slow RAN of Objects. In contrast it was 3-D Artists and future math teachers who tended to be located in the upper right quadrant of high visualization and slow RAN of Objects. It should also be noted that there was no similar finding for middle childhood math teachers, but then the connection with 3-D Art makes sense because high school math teachers are teaching courses such as algebra, trig, and calculus where 3-D visual patterns are denoted by mathematical symbols. In contrast, middle school math primarily deals with 2-dimensional patterns and problem solving. Furthermore, in Ohio, the state where this study was conducted, students studying to become middle childhood teachers must pick two fields of study.
Visual analysis of language arts
As seen in Figure 8, the future high school language arts teachers can be found in the lower right quadrant representing slow times on the RAN of Objects and low visualization. On a visual analysis, the language arts teachers were both slower on RAN of Objects and lower on visualization than the science teachers. This was born out by a one-on-one ANOVA analysis with the language arts teachers highly significantly slower on the RAN of Objects (F = 10.068; p = .007). Plus, at an exploratory study-level standard of p < .10, they were significantly lower on the PSVT:R (F = 3.148; p = .099).

Adolescent and young adult language arts teachers at MWSU: Low visual/slow processing.
On a visual analysis, the language arts teachers had similar RAN of Objects times as the math teachers, but the language arts teachers were lower on visualization. Again, these were borne out by one-on-one ANOVA comparisons. Thus, compared with the future math teachers, language arts teachers had similar times on the RAN of Objects (F = 1.198; p = .289), but were highly significantly lower on the PSVT:R (F = 14.913; p = .001).
Visual analysis of social studies
In contrast to the three other academic fields where students clustered in three separate corners, the future high school social studies teachers clustered in two caddy-corner quadrants (see Figure 9). One group was clustered in the upper-left quadrant. This means they had the same high visualization and fast processing tendencies as the science teachers. Consequently, a future study with targeted qualitative interviews might reveal these social studies teachers tend to be focused on the facts and figures of history and government. In contrast, there was another distinct cluster in the lower right quadrant. Because four of the social studies students had times more than 1 standard deviation slower than the mean, their slow processing was even more exaggerated than the pre-service language arts teachers. Consequently, future studies that include targeted qualitative interviews might reveal these social studies teachers tend to be focused on the stories, strategies, and processes of history.

Adolescent and young adult social studies teachers at MWSU: High visual/fast processing OR low visual/slow processing.
Discriminant analysis and statistical limitations
At the request of two reviewers, a discriminant analysis of the high school teachers was conducted. As could be expected from the above description, there was no statistical significance found when social studies teachers were included in the discriminant analysis. This is because the social studies formed bi-modal clusters where approximately half fell into the quadrant of science teachers and the other half fell into the caddy-corner quadrant of language arts teachers.
In contrast, when focusing on science, math, and language arts teachers as being situated in distinct quadrants defined by the RAN of Objects and PSVT:R, for Function 1 the Eigenvalue was .628, the percentage of the variance was 67.2, and the canonical correlation was .621. For Function 2, the Eigenvalue was .307, the percentage of the variance was 32.8, and the canonical correlation was .485.
Next, for Test of Functions 1 to 2, the Wilks’s lambda was .470 and the chi-square was 15.477 with 4 degrees of freedom and a significance of .004. For the Test of Function 2, the Wilks’s lambda was .765 and the chi-square was 6.486 with 1 degree of freedom and a significance of .019.
Finally, in a discriminant analysis, the baseline percentages for randomly assigning a given individual to a particular group would be
Future Science teachers: .208 (n = 5)
Future Math teachers: .375 (n = 9)
Future Language Arts teachers: .417 (n = 10)
Compared with these baseline percentages, 66.7% of the cases were categorized correctly for “original grouped cases,” and 62.5% of cases were categorized correctly for “cross-validated grouped cases.” Thus, the categorization of science teachers is considerably above the generally accepted standard of 25% greater than baseline, while the categorizations of math and language teachers straddled the borderline of the generally accepted standard of 25% greater than baseline. (It should be noted that the ns listed above do not necessarily match up with the number of dots on a given scatterplot because 2 or 3 students might have the same match of PSVT:R percent and RAN of Objects time.)
Admittedly, conducting a series of statistical tests including the discriminant analysis, the Wilks’s lambda, chi-square, and one by one ANOVA comparisons run into all sorts of methodological issues because statistical analysis was performed on sub-samples that were not specifically proposed in the research questions. Similarly, the Bonferroni adjustments that would be needed could negate the statistical significance, especially if similar breakout comparisons were made for every participating class in regard to the exact major of every single student in the class. Nonetheless, in this exploratory study, the after the fact discriminant analyses and ANOVAs support the reasonableness of using visual inspections based on the logic of single-subject research described by Kazdin (1982). Then, in the future targeted studies where the research questions would focus solely on differences between high school science, math, and language arts teachers, there would not be as many statistical adjustments needed.
Patterns for Other Classes That Were Tested
In general, the pattern for all of the other classes was centrist in regard to both RAN of Objects and Visualization. Though there was a subset of four Middle Childhood social studies teachers who had Low Visualization scores and slow times on the RAN of Objects. Thus, these four Middle Childhood social studies teachers mimicked the cluster of High School social studies teachers.
Limitations
Limitations include the fact that Wiig et al. (1982) RAN of Objects test was being used for adults when it was normed using students in elementary school. Furthermore, the RAN of Objects test was administered en masse to reduce the time spent in a given classroom and reduce the number of graduate students required to help proctor a testing session. Thus, there are no pre-existing “norms” for comparison. In addition, though math and science majors were assessed, there is no engineering program at the university where most of the testing was conducted. Next, the test results surfaced questions that should be added to the demographic survey. For example, it would be good to know whether a given individual enrolled in Music Theory IV was interested in musical composition, performance, teaching, and/or directing.
What cannot be determined without a longitudinal study is whether students intuitively chose a major because their pre-existing thinking style matched the thinking style required to succeed in the field, or whether students chose a given field and then they were shaped into thinking in a certain way by the way the subject is taught.
Discussion
As noted in the introduction, back in 1977 Eisenberg and McGinty published an article describing how visualization predicted a student’s field of study. What this study adds to previous research on visualization is that it contains both a test for 3-D visualization (Bodner & Guay, 1997) as well as one for RAN of Objects (Wiig et al., 1982), and the results suggest both assessments may be needed to give appropriate guidance to students about their future academic majors and career choices.
The premise that RAN of Objects might surface differences in choice of college majors originates from the fields of special education and speech and language pathology. Researchers in these fields have long used RAN of Objects assessments to screen for pre-school and kindergarten students who struggle to learn how to speak fluently, develop phonemic awareness, and ultimately learn how to read. Thus, it only makes sense that RAN of Objects might also sort where students with slow RAN of Objects times end up in college if they learn how to read, write, and do arithmetic.
As noted earlier, researchers such as Corina et al. (2001) have used the Aesop’s fable of the tortoise and the hare to describe how students with learning disabilities might end up successful. Our research team suggests that a metaphor of a tortoise living in the appropriate ecological niche of Darwin’s Galapagos Islands might better explain this study’s counter-intuitive findings. For example, there was a statistically significant multiplier that for every second SLOWER a college student took to complete the RAN of Objects Assessment, the student had greater odds of earning a high grade in the class he or she was enrolled. Or, the supporting counter-intuitive finding that as fast times on RAN of Objects assessments are typically associated with early reading success (National Early Literacy Panel, 2008), it would seem that future language arts teachers would be found in the bottom-left-hand corner of low Visualization and fast RAN of Objects; instead this study found them in the bottom right hand corner where they had low Visualization and slow RAN of Objects.
Yes, there undoubtedly is a chicken or the egg component to any field of academic learning. As Sorby (2000) and her colleagues (Boersma et al., 2004; Medina et al., 1998) have shown, engineering students who score below 60 on the PSVT:R benefit from taking a 10-week course in visualization. Compared with their low scoring peers who do not take the 10-week visualization course, students who take the course have increased GPAs and graduation rates. Thus, direct training in how to visualize 3-D objects was effective in helping students “think like an engineer.” Similarly, Bruner (1999) said the goal of a math teacher should be to have their students learn how to think like a mathematician and that science teachers should be helping their students think like scientists. Thus, in the process of teaching their students to think like mathematicians, scientists, poets, and so on, the professors and teachers of any academic discipline may also be shaping the cognitive processing of their students. Yet, it could also be true that more explicit training in the underlying neurologically based skills needed to think like a high school science, math, and social studies teacher might make future teachers better prepared to teach their subject area.
Future Directions
This study supports the research of Eisenberg and McGinty (1977) who found that visualization skill tends to be higher in college students majoring in math or science than for elementary education majors. This study expands on their work by also finding that students majoring in music and the visual arts match or even better the visualization skills of future math and science majors. Finally, this research project found that a combination of PSVT:R percentages and RAN of Objects time creates scatterplots on which students in different majors cluster either in a centrist position or in one of four quadrants. To provide more support and added depth for these findings, our research team proposes four lines of follow-up research.
First, several larger n studies are needed to specifically target future and current high school science and math teachers. These larger n studies could then provide stronger evidence that except for approximately a 30% overlap near the grand mean, there are statistically significant categorical differences in the RAN of Objects times between high school science and math teachers. Furthermore, if this difference is confirmed, STEM educators could provide more guidance to prospective math and science teachers and help them choose the subject area which fits their cognitive profile. For example, prospective teachers who are deciding whether to teach high school math and/or science could be tested for their RAN of Objects times. Then, individuals who name objects more than half of a standard deviation faster than the grand mean, could be counseled to become science teachers. In contrast, those who name more than half of a standard deviation slower than the mean could be counseled to become a high school math teacher. Finally, individuals whose time is close to the grand mean might be counseled to pursue both math and science teaching—so that they could make themselves more marketable to small school districts. In contrast, a future teacher who does not receive appropriate guidance and chooses incorrectly might decide to quit teaching altogether because they sense they do not fit in with their colleagues. This would be particularly regretful if the prospective teacher perceived that they were feeling uncomfortable due to difference in race, religion, gender, or sexual identify.
Second, as is represented in Figure 10, our research team theorizes the thinking styles reflected in this study’s scatterplots align with the four types of thinking outlined by Rowe and Neitzel (2010). To prove this, a longitudinal study is needed that tracks students from kindergarten until they go to college and choose a major and career.
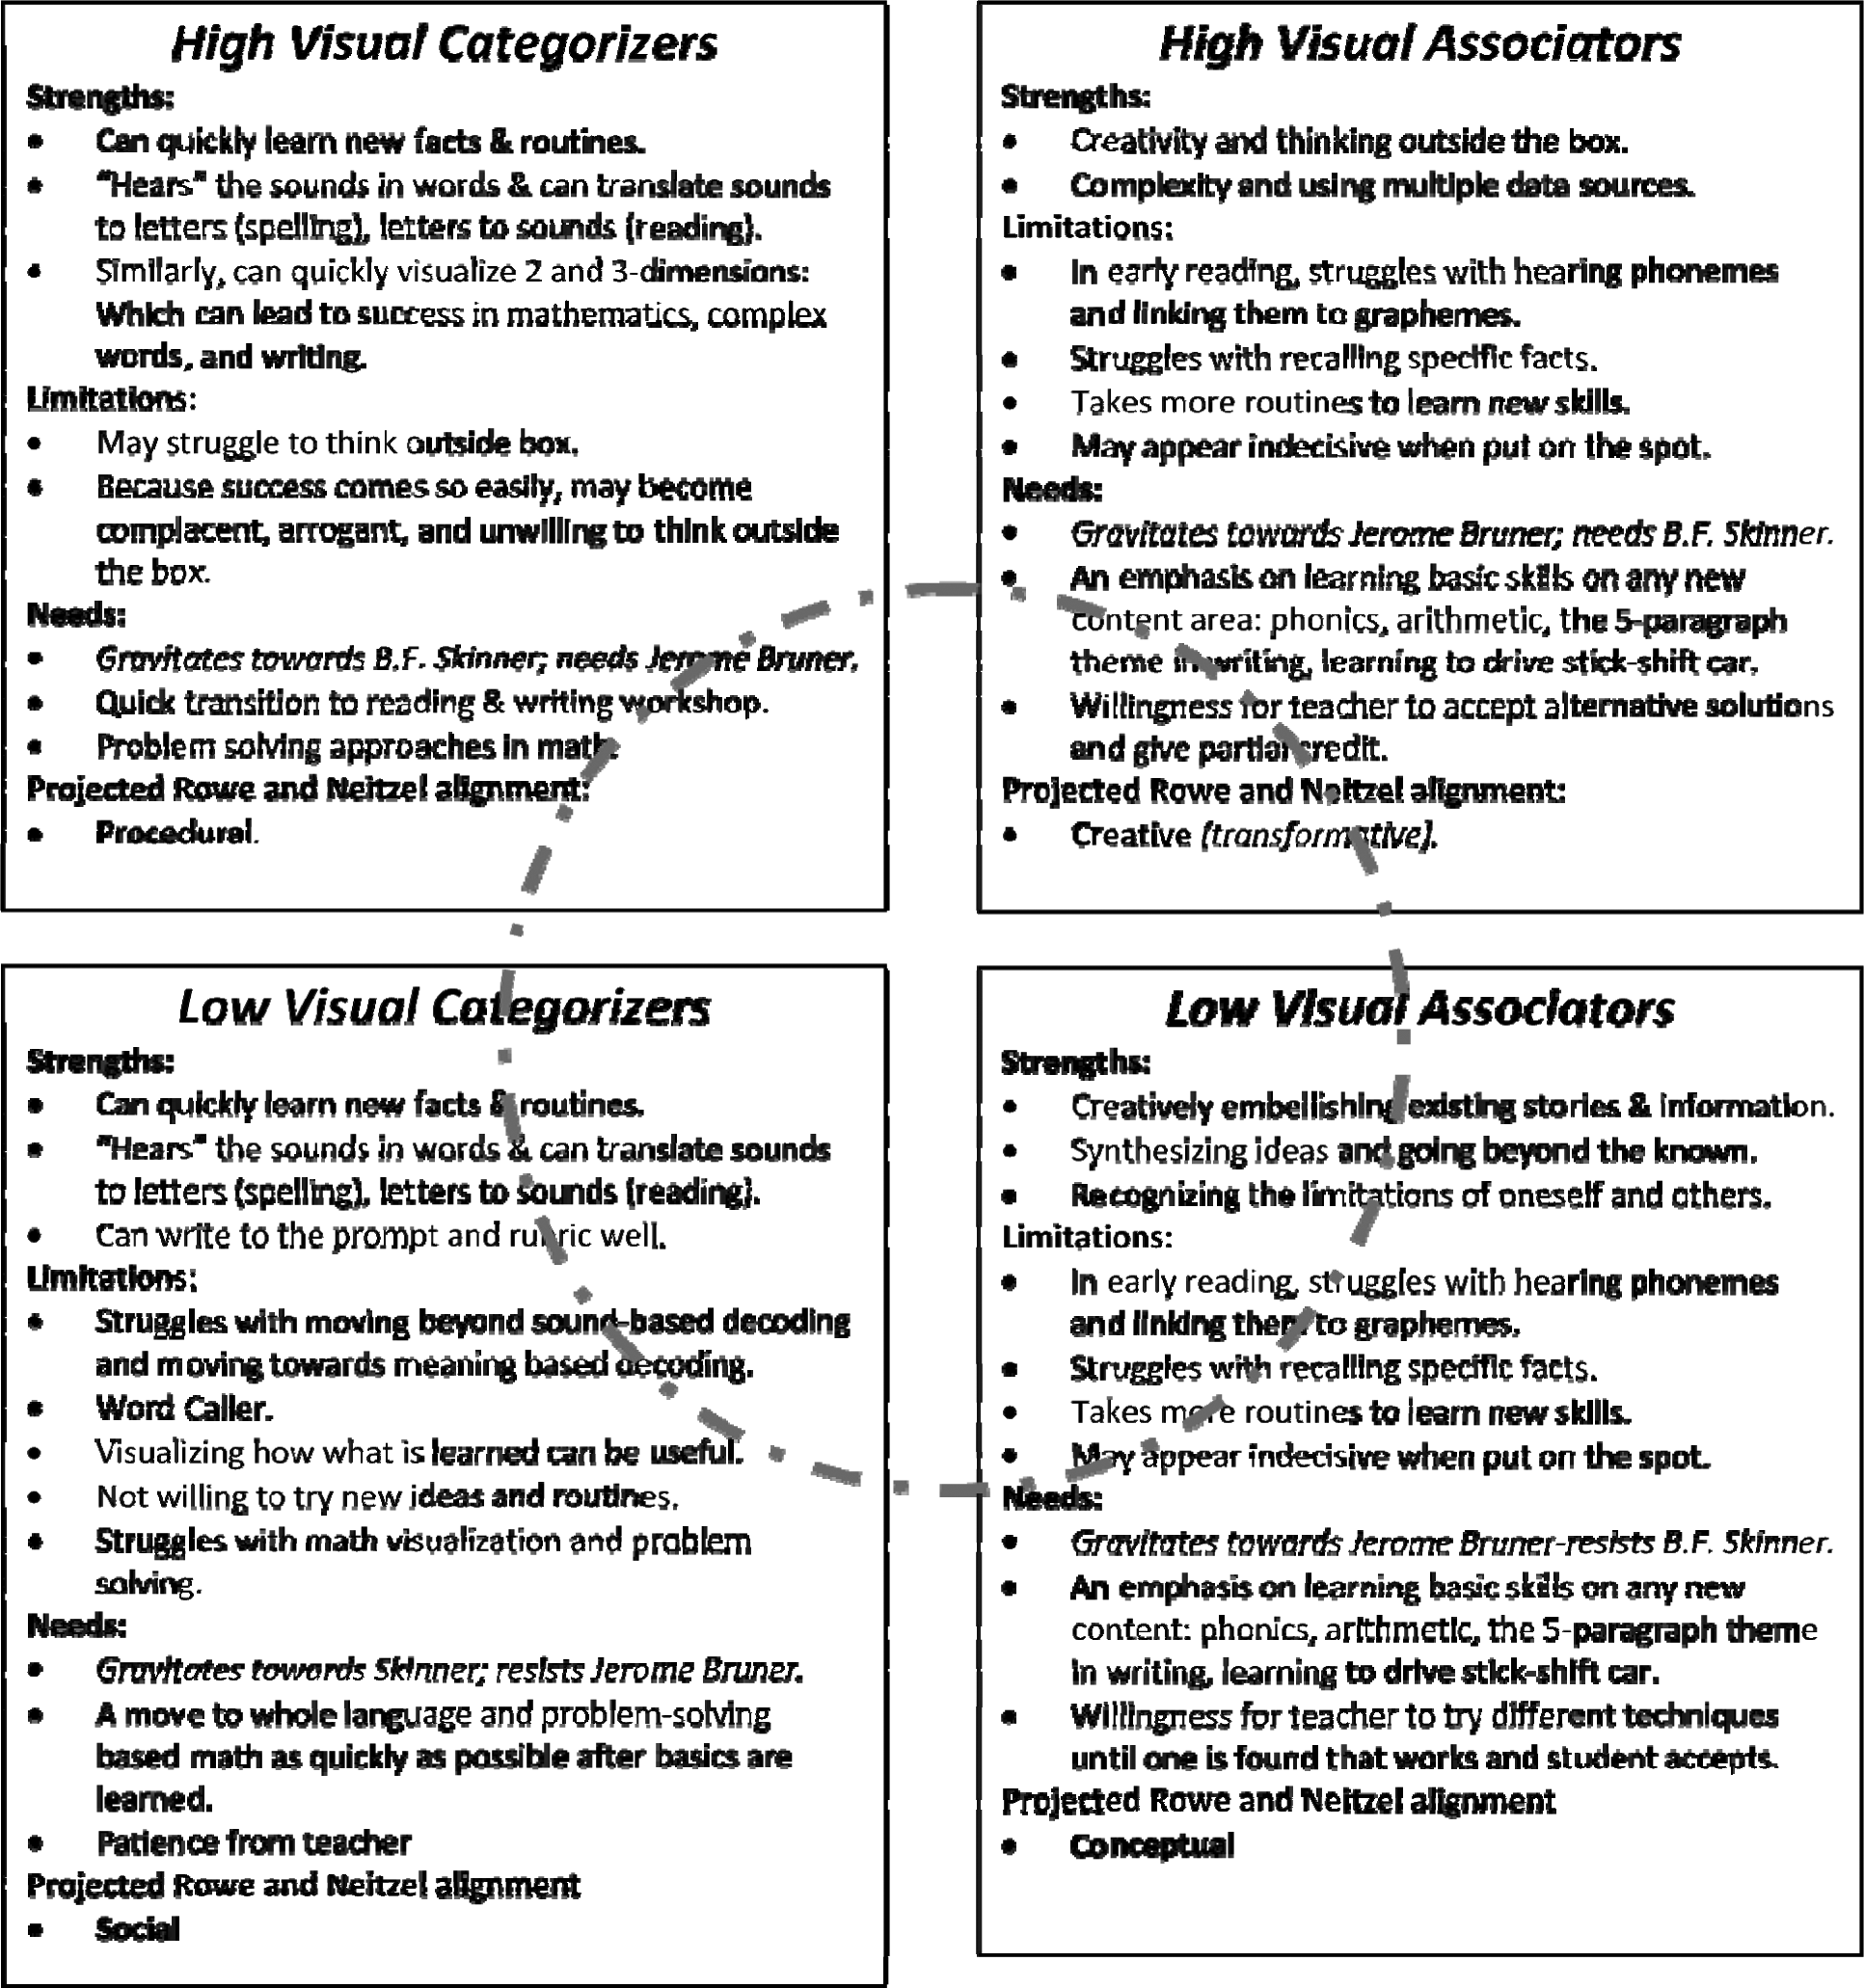
Proposed four ways of knowing: Academic strengths and weaknesses with center being a mix.
Third, even though this study showed high school math teachers have profiles of high visualization and slow cognitive processing, our research team predicts that accountants and other mathematically related professions with precise regimentation will end up in the quadrant of high visualization and fast cognitive processing. Similarly, even though future science teachers ended up in the quadrant of high visualization and fast processing, our research team predicts many theoretical physicists, chemists, biologists, and/or economists with fuzzy logic tendencies would tend to end up in the quadrant of high visualization and slow processing.
Fourth, even if the two constructs of visualization and parallel processing differences are independent of each other in the sorting process of choosing a college major, the PSVT:R and the RAN of Objects assessment might not have the highest validity, reliability, and generalizability—especially for students either beginning or ending their K-16 journey. Thus, a larger battery of assessments that measure visualization and processing speed will need to be created to determine which assessments are best at predicting a kindergartener’s thinking tendencies and a college student’s choice major and career.
Finally, the ultimate importance of the present study and future studies like it is that many individuals who feel “different” and “out of place” would like to know that there is a cognitive difference that does not imply “dumb.” We all want to know that there is an ecological niche where we can feel safe; many will then feel free to interact with the people from the other niches.
Footnotes
Acknowledgements
We thank the professors who helped collect data by administering the assessments: Ann Bragg, Anne Bullerjahn, Mohammed Darabie, Daria Filipova, Chris Keil, and David Meel.
Declaration of Conflicting Interests
The author(s) declared no potential conflicts of interest with respect to the research, authorship, and/or publication of this article.
Funding
For the research and/or authorship of this article, the authors received a small grant for materials, graduate students, and statitistical analysis from COSMOS: the Northwest Ohio Center for Excellence in STEM Education.