
Abstract
This descriptive study used nonparametric (Kruskal–Wallis and Mann–Whitney U) tests to determine the efficacy of New York City (NYC) small school initiative. A sample of 369 NYC high schools was tested on various performance indicators. The results: Large schools generated statistically significant higher performance scores and were more effective at preparing students for college and careers. On the New York State (NYS) English language arts (ELA) test, a Mann–Whitney U found statistically significant difference between scores for small school (median = 2.62, n = 213) and large school (median = 2.81, n = 58), U = 3200.00, z = −5.63, p = .001, r = −.34. On the state’s math test, a Mann–Whitney U found statistically significant difference between scores for small school (median = 2.76, n = 213) and large school (median = 3.12, n = 58), U = 3086.00, z = −5.84, p = .000, r = −.35. On NYC Department of Education (NYCDOE)–assigned college and career readiness scores (CCRS), a Mann–Whitney U found statistically significant difference between CCRS for small school (median = 3.00, n = 213) and large school (median = 3.00, n = 58), U = 4705.50, z = −2.90, p = .004, r = −.018. The evidence suggests the city reconfigured large failing schools into smaller ones, resulting in the concentration of poverty (through the placement of mostly low socioeconomic status [SES] and underperforming Black and Hispanic students) in those schools. Recommendations include future studies exploring the effect of mediating and moderating factors.
The No Child Left Behind Act of 2001 (NCLB) was established to address the intractable problem informing the achievement gap (Green, 2005; Huber & Bartee, 2003; U.S. DOE, 2014). Under its predecessor, the Elementary and Secondary Education Act (ESEA) of 1965, many school districts, without fear of penalty, diverted federal monies earmarked to help Black and poor children to their wealthier schools (Gittell, 1996), and hid the failure of such children in schools’ overall data (Green, 2005). However, using the fear of penalty, NCLB mandated the annual release of disaggregated school report card data. At the time of this study, the report card was the heart of the nation’s current initiative to improve schools for all its students/children (Green, 2005; Schoen & Fusarelli, 2008).
Holcomb (2004) explains that data can inform policymakers, parents, school professionals, and other stakeholders in various ways—leading to crucial decision making regarding the viability of schools. However, even though New York City (NYC) has been releasing data for more than 10 years, the raw data cannot explain whether there are significant academic gains for Black and Hispanic students, which initiatives are working, and which need to be tweaked. Of significance, data could provide evidence of the efficacy of the NCLB school improvement mandate instituted by the city, but they will appear to be meaningless, even to the trained eyes, if not deciphered.
Problem Statement
Consequence of the NCLB school improvement mandate, NYC Department of Education (NYCDOE) released its 2013-2014 school report card data. Such data contain information on the efficacy of the city’s small (and more expensive) school reform initiative. However, because data appear unintelligible if the useful information is not extracted, there is need for a study that analyzes the data to facilitate an extraction and reportage of the useful information regarding the efficacy of the city’s initiative.
Purpose
This study facilitated an examination of NYC high schools to determine what school size was most effective at educating the city’s (high school) students.
Theoretical Framework
A social capital framework, derived from the Coleman and Johns Hopkins’ University Report of 1967, provides the basis for explaining and understanding how malleable factors, such as school size, aid the development of social and other networks that could inform students’ achievement (success or failure). For example, small schools facilitate frequent and personalized communication between students and educators on a range of topics as well as the sharing of empowering information between parents (Farmer-Hinton & Holland, 2008). The impact of school-based social capital on the college success of “student of color” was revealed in Gonzales (2003, as cited in Farmer-Hinton & Holland, 2008). On the other hand, the positive benefit of said social capital relative to large high schools was restricted “because those schools are often organized around bureaucracy, hierarchy, and formal relationships”(Farmer-Hinton & Holland, 2008, para. 3). Nonetheless, the literature reveals that large schools could also have positive impact on students’ achievement—giving rise to the complexity of the problem.
Research Questions
The following research question and null hypotheses informed this study.
Hypotheses
Definition of Key Terms
The following definitions apply to this study.
Achievement Gap
The achievement results in the significantly different average scores between groups of students (Institute of Education Sciences [IES], 2014a).
Most Effective Schools
These are the schools that generated the highest mean scores on the New York State (NYS) ELA and math exams, or those that received the highest CCR scores from NYCDOE. 1
Performance Scores
These are the performance scores (1-4) representing the letter grades (A-F) NYCDOE assigned to its high schools, or the scores (1-4) students received on the New York State Education Department (NYSED) ELA and math tests.
Predictive Analysis Software 22 (PASW 22)
This is IBM’s data analysis software formerly known as Statistical Package for the Social Science 22 (SPSS 22).
Malleable Factors
These are things that can be changed by the education system to improve student education outcomes (IES, 2014b, p. iii)
Mediator
Baron and Kenny (1986) define a mediating variable as “the generative mechanism through which the focal independent variable is able to influence the dependent variable of interest” (as cited in Petrosino, 2000, p. 48).
Moderators
These are “Factors that affect the strength or the direction of the relationship between the intervention and student education outcomes” (IES, 2014b, p. iii). Such could be a function of students’ demographic characteristic, or factors within schools, neighborhoods, or educators (IES, 2014b).
Small Schools
Small schools are those with 450 or less students—learning communities (NYCDOE, 2013).
Large Schools
Large schools are those with 1,000 or more students (U.S. Department of Education, 2014).
Medium Schools
By default, in this study, medium schools are those with 451 to 999 students. These are the schools not within the range of small and large schools as cited above.
Literature Review
School Size and Its Effect on Students’ Learning
“School size affects student participation and satisfaction independent of the effects of SES and academic ability” (Mickelson & Greene, 2006, para. 6). However, various studies reveal low socioeconomic status (SES) at the personal level and at the school level directly affect students’ achievement (McBee, 2006). Blacks, on average, were reported to have lower SES, and lower SES resulted in lower IQ test scores (Nielsen, 2010; Nisbett, 2011).
Notwithstanding, teachers’ positive attitudes and their responsibility for students’ learning were more pronounced in smaller schools (Lee & Loeb, 2000; U.S. DOE, 2009). However, most learning was generated in midsize schools of “600 to 900 students,” less in relatively smaller schools, and the least in large schools (Lee & Smith, 1997, p. 217). In contrast to Lee and Smith’s (1997) findings on large school, Durban (2001, as cited in Stevenson, 2006) found that irrespective of poverty levels, larger South Carolina high schools outperformed their smaller schools. A later study of South Carolina high schools reported larger and higher SES schools were more successful (Crenshaw, 2003, as cited in Stevenson, 2006).
Regarding Larger Schools
Monk and Haller (1993) cited anecdotal evidence of a number of states which had sought to explore the implementation of larger schools, with NY being one of such states. To elaborate, Gershenson and Langbein (2015) reveal that
the school consolidation movement in the United States in the middle of the 20th century was predicated on the notion that larger schools could offer more specialized instruction, increase administrative efficiency, and reduce per-student costs by exploiting economies of scale (e.g., Berry, 2006; Conant, 1959; Duncombe & Yinger, 2007). The movement successfully eliminated about 70% of schools and increased the average school enrollment from less than 100 to about 440 between 1930 and 1970. (p. 1)
However, in large schools, the associated higher absenteeism and social disorder incident to students’ failure were the costs associated with the aforementioned benefits (Gottfredson & DiPietro, 2011).
Support for Small Schools
Notwithstanding the school consolidation initiative, according to various researchers (e.g., Copland & Boatright, 2004; Schneider, Wyse, & Keesler, 2007), the preponderance of current school size reports leans toward the conclusion that smaller is better. However, there was no assurance that merely converting large schools to smaller ones automatically improved their achievement scores, or that small schools worked for all students (Lee & Smith, 1997; Schneider et al., 2007). Nonetheless, such a change was found to improve school climate (Goldkind & Farmer, 2013). The NYCDOE and many educational departments in other localities and in other states converted many larger schools to house smaller ones—smaller learning communities (SLC)—but according to U.S. DOE (2009), the literature was silent on the effectiveness of such conversions. While Manpower Demonstration Research Corporation (MDRC; 2013) found SLC in NYC very successful, the empiricism of a study financed by the Gates Foundation warrants extra scrutiny. Notwithstanding, the fact that NYC implemented multiple changes simultaneously makes it difficult to definitively attribute any reported success to smaller schools (Gershenson & Langbein, 2015).
School Size Matters
Ravitch (2005) illuminated the matter under discussion and based on her analysis of empirical school size studies, she asserted that size matters. School size affected in-school social relations and the financing of better curriculum. “Schools that are too large lack any sense of community and cannot shape student behavior; schools that are too small cannot offer a solid curriculum” (paras. 9-10). While the school performance of low-income students declined in large schools with “2,100” students, such school size did not adversely affect students from advantaged backgrounds. However, schools with 600 to 00 students were found to be optimum for students’ success (Ravitch, 2005). In addition, Ravitch reported that while schools with fewer than 300 students were optimum for some students, especially those who were “educationally unsuccessful,” they were not the right size for most students. She revealed that smaller size schools could result in the absurdity of higher graduation rate of mediocre achieving students.
In Defense of Smaller Is Better as Well as Larger Is Better
Nevertheless, the weight of the evidence in the various reports informed policymakers’ decisions toward decreasing school size to increase students’ achievement (Schneider et al., 2007). Those reports likely influenced major funders, such as Gates Foundation and the U.S. DOE, to help fund the nation’s small school initiatives (Nehring & Lohmeier, 2010). With US$150 million funding from the Gates Foundation, from 2002-2008, NYCDOE reorganized 23 large failing high schools into with 216 small ones (Williams, 2012).
The success attained by small schools was not solely a function of their size but was also related to the support and the social capital of parents and other stakeholders, which reinforced the norm of college attendance (Schneider et al., 2007). Large urban schools were reported to lack many parents with such capital, but those schools had other desirables. For example, beyond cognitive development, schools developed “social relations, students’ engagement with learning, self-esteem, sense of belonging, participation in extracurricular activities, and leadership roles” (Lee & Smith, 1997, p. 219), and such activities were reported to be affected by school size.
A possible way of bringing more social capital into large urban schools was through socioeconomic integration (SI), or with the use of magnet schools (Kahlemberg, 2012). According to Kahlemberg (2012), SI is an approach to regulate the poverty-level of schools to ensure none had more than 50% of students on free or reduced price lunch. Still, “Crenshaw [2003] did provide an intriguing glance into the complexity of studying the effects of school size” (as cited in Stevenson, 2006, p. 5). Such complexity is demonstrated by the seemingly contradictory findings of the literature in the following two paragraphs.
The Justification for This Study
The various pathologies and their detrimental impact that large schools imposed on students, in particular low SES students and students of color, are delineated in numerous studies (Darling-Hammond, 2006; Darling-Hammond, Ross, & Milliken, 2007). On the contrary, small schools had positive impact on such students. In NYC for example, skepticism previously noted, MDRC (2013) reported: “Findings show that the [small] schools, which serve mostly disadvantaged students of color, continue to produce sustained positive effects . . .” (para. 1). 2 However, small schools and success were not an absolute.
Ornstein (1993) found students had higher achievement in larger schools of “495-1000 students.” He also found students in large schools took more courses compared with those in small schools. In addition, he theorized that students in larger school were more college-orientated than those in smaller ones. To further confound the issue, Weiss, Carolan, and Baker-Smith (2010) found that school size had no significant difference on students’ test scores and college aspiration. The discrepancy was elevated by the work of IES grant recipient Schwartz, Stiefel, and Wiswall (2013), which explored school size in NYC. It provides no conclusive evidence on the effectiveness of small school. In fact, it reports the problem as to the definition of what size school constituted being a small school. Giving the diverse findings on the impact of school size on student performance, and, for my concurrence with Ravitch’s (2005) statement, “Most of the “research” on small schools consists of testimonials by advocates for small schools (para. 8), it is necessary to conduct this study of NYC schools. The result could inform policymakers, parents, and other stakeholders on what school size was most effective at educating the city’s diverse students, thereby helping it to meet the nation’s school improvement mandate.
Method
This study facilitated an examination of NYC high schools to determine what school size was most effective at educating the city’s (high school) students. Through a purposive sampling, publicly available 2013-2014 school year data were obtained from the NYCDOE website. The site contained the progress report data for all reporting high schools, and the demographic data for all NYC schools. The merging of the data resulted in a sample comprising 369 (out of 465) high schools with the required data set (school size, college and career readiness grade [CCRG], and ELA and math scores).
The CCRG grades were those (A-F) assigned to schools by the NYCDOE; the math and ELA scores (1-4) were those generated by students on NYS administered tests. To facilitate data analysis, grades were assigned numerical values as follows (NCLB grade definitions are shown in brackets):
A = 4 (schools making excellent progress),
B = 3 (schools making above-average progress),
C = 2 (schools making satisfactory progress),
D = 3 (schools making less than satisfactory progress), and
F = 0 (schools failing to make adequate progress).
In addition, school size was assigned numerical values: small school = 0, medium school = 1, and large school = 2.
Data Analysis
IBM’s PASW 22 (formerly SPSS) facilitated statistical analyses, which included descriptive and inferential statistics. Because the data were from a nonrandom sample, a nonparametric analytical approach, using Kruskal–Wallis and Mann–Whitney U, was deemed most appropriate. The result of the normality test further warranted the decision. The test indicated a significant (p = .000) Kolmogorov–Smirnov and Shapiro–Wilk statistics, suggesting violation of the assumption of normality required for parametric analysis (Pallant, 2013). Because such Kolmogorov’s results were common in large samples (Pallant, 2013), an examination of the histogram, showing skewness, confirmed the violation (see Figure 1).

Results from a normality test of the data.
Results
School Size and ELA Scores
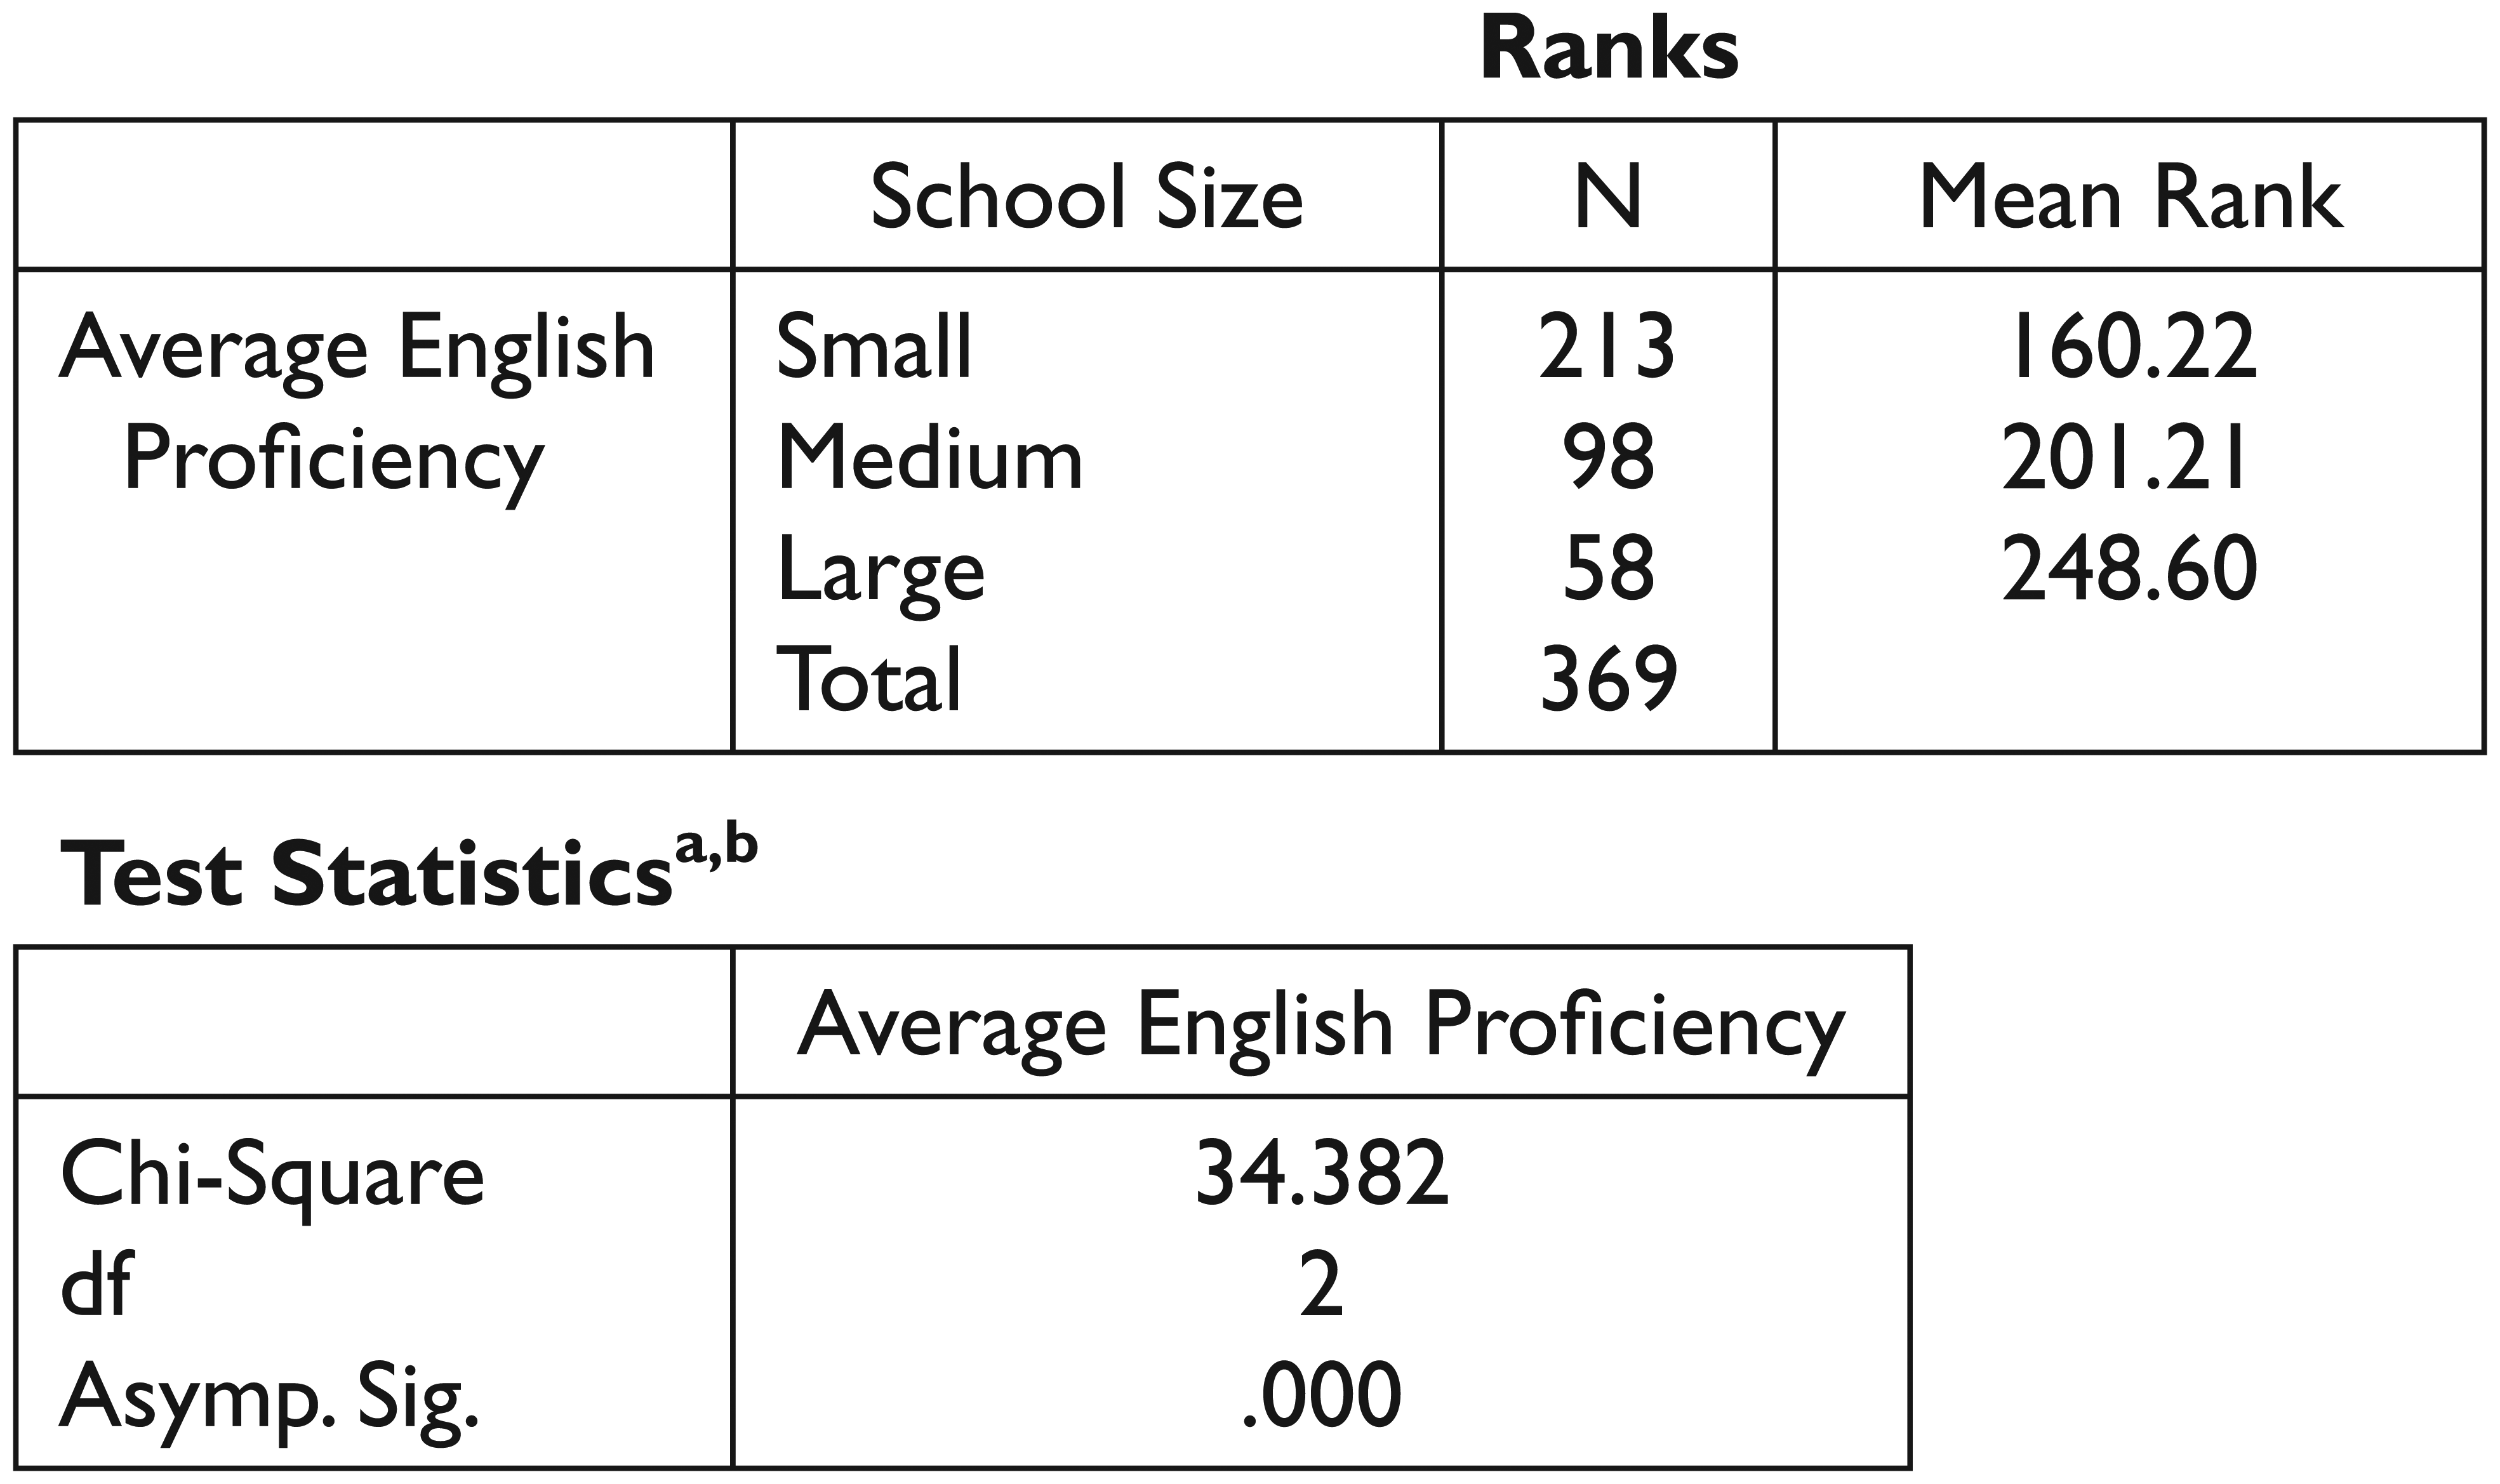
A Kruskal–Wallis test revealed significant differences between school size and ELA scores, χ2(2, n = 369) = 34.38, p = .001, with a mean rank of 248.60 for large school, 201.21 for medium school, and 160.22 for small school (see Figure 2).
Kruskal–Wallis statistics on school size and ELA score .
A Mann–Whitney U Test, using a conservative Bonferroni approach, explored specific differences between the significant groups. Therefore, the (alpha) p values generated for all Mann–Whitney U tests in this study were compared against a strict alpha, p = .05/3 = .017. The Mann–Whitney U revealed the following:
A statistically significant difference between the ELA scores for small school (median = 2.62, n = 213) and medium school (median = 2.68, n = 98), U = 8136.00, z = −3.12, p = .002, r = −.18 (see Figure 3). 3
A statistically significant difference between the ELA scores for small school (median = 2.62, n = 213) and large school (median = 2.81 n = 58), U = 3200.00, z = −5.63, p = .001, r = −.341 (see Figure 4).
A statistically significant difference between the ELA scores for medium school (median = 2.68, n = 98) and large school (median = 2.81 n = 58), U = 2130.00, z = −2.61, p = .009, r = −.21 (see Figure 5).

Statistics from a Mann–Whitney U comparison of ELA for small versus medium schools.

Statistics from Mann–Whitney comparison of ELA for small versus large schools.

Statistics from Mann–Whitney comparison of ELA for medium versus large schools.
Overall, though small schools were of numerical significance compared with large schools, large schools generated statistically significant higher ELA scores compared with small schools.
Regarding Math Scores and School Size
A Kruskal–Wallis revealed statistically significant differences between school size and math scores, χ2(2, n = 369) = 39.86, p = .000, with a mean rank of 252.67 for large school, 203.47 for medium school, and 158.08 for small school (see Figure 6).

Kruskal–Wallis statistics from math versus school size.
A Mann–Whitney U test explored specific differences between the significant groups. The test revealed the following:
A statistically significant difference between the math scores for small school (median = 2.76, n = 213) and medium school (median = 2.87, n = 98), U = 7793.00, z = −3.59, p = .000, r = −.057 (see Figure 7).
A statistically significant difference between the math scores for small school (median = 2.76, n = 213) and large school (median = 3.12 n = 58), U = 3086.00, z = −5.84, p = .000, r = −.35 (see Figure 8).
A statistically significant difference between the math scores for medium school (median = 2.87, n = 98) and large school (median = 3.12 n = 58), U = 2008.000, z = −3.10, p = .002, r = −.24 (see Figure 9).

Statistics from Mann–Whitney comparison of math for small versus medium schools.

Statistics from Mann–Whitney comparison of math for small versus medium schools.

Statistics from Mann–Whitney comparison of math for medium versus large schools.
Overall, though small schools were of numerical significance compared with large schools, large schools generated statistically significant higher math scores compared with small schools.
School Size and CCRS
A Kruskal–Wallis test revealed statistically significant differences between school size and CCRS, χ2(2, n = 369) = 9.29, p = .01, with a mean rank of 217.45 for large school, 191.98 for medium school, and 172.95 for small school (see Figure 10). A Mann–Whitney U test explored specific differences between the significant groups. The test revealed the following:

Kruskal–Wallis statistics from CCRS versus school size.
A statistically significant difference between CCRS for small school (median = 3.00, n = 213) and large school (median = 3.00, n = 58), U = 4705.50, z = −2.90, p = .004, r = −.018 (see Figure 11).
No statistically significant differences between the CCRS and school size were detected between the other groups (small and medium, and medium and large schools), p > .05.

Statistics from Mann–Whitney comparison of CCRS for small versus large schools.
Overall, though small schools were of numerical significance compared with large schools, large schools generated statistically significant higher scores for preparing students for college and careers.
Summary
There is evidence of a direct relation between school size and school performance in NYC. Large schools returned significantly higher scores on all measures. While small schools were of numerical significance, they returned the lowest overall scores on all measures, even ranking behind medium schools. The essence of the findings was that large and medium NYC high schools were most effective in educating NYC youth and preparing them for college and career.
Discussion
Improving the nation’s school for all children is a major objective of the current NCLB school improvement mandate. This study attempts to test NYC use of small school as a means to achieve the objective for high school students. The findings here were that larger (medium + large) schools were most effective. Such result was consistent with Durban (2001, as cited in Stevenson, 2006), Ornstein (1993), and Crenshaw (2003, as cited in Stevenson, 2006), but inconsistent with some studies (e.g., Darling-Hammond, 2006; Darling-Hammond et al., 2007; Lee & Smith, 1997). In addition, the findings were (a) in stark contrast to MDRC’s (2013) report touting the success of NYC small schools and (b) in variance with the preponderance of the findings elevating the successes of small schools.
Undeniably, large schools could offer better curriculum (Ravitch, 2005) and other motivational factors such as those outlined in Lee and Smith (1997). If those factors (e.g., participation in extracurricular activities/sports) did not contribute to higher students’ performance and, ultimately, higher performance of large NYC high schools, then a possible reason could be found in a key phrase cited in the literature review. The phrase, in MDRC’s (2013) findings, is, “which serve mostly disadvantaged students of color.”
The implication is as follows: Based on the preponderance of the literature revealing that small schools are more effective, NYCDOE may have converted its large failing high schools to house smaller new high schools. If the placement of new students in the smaller schools was oblivious to competing literature (e.g., Lee & Smith, 1997; Schneider et al., 2007) that such conversion was not a guarantor of success, or that of Kahlemberg’s (2012) regarding the need for SI for urban schools to succeed, NYCDOE may have populated the new small high schools with disadvantaged (high poverty) “student of color,” from the converted failing high schools. In the process, they concentrated poverty in the new and smaller high schools. Poverty has been shown to be a major factor in school failure (McBee, 2006; Nielsen, 2010; Nisbett, 2011). Indeed, the rush to convert large school to small ones, without empirical evidence, was outlined in Williams (2012). In addition, Ravitch (2005) revealed that anecdotal evidence was a major source informing the debate on the effectiveness of small schools.
A possible unintended consequence was as follows: White and Asian students became the dominant high scoring groups in the remaining large successful high schools, and their presence resulted in the higher performance scores of large schools. As revealed in Ravitch (2005), higher performing students performed well in large schools. An alternative explanation for the discrepancy is for the fact that none of the smaller charter high schools in the sample was provided with CCRG by the DOE; therefore, a possible skewing of the results toward larger schools. However, those (charter) schools, through their students, received ELA/math performance grades from the state; yet, they all returned significantly lower ranking scores compared with larger schools. Therefore, the discrepancy may transcend the absence of charter school CCRG, and may require an examination of the implication of the concentration of poverty on the poor performance of NYC small high schools.
Conclusion
With the aim of increasing students’ academic/technical achievement, NYC invested millions of dollars in its small school reform initiative. The process involved reconfiguring large failing high schools to house smaller ones. This study, however, suggests that large high schools were significantly better at serving the city’s youth. Albeit that a justification for continued conversion of larger schools to smaller ones is the higher graduation rates reported in MDRC (2013); however, a higher production/graduation rate of mediocre-educate product does not advance the state or the nation’s interest, treasure, national security, or democratic ideals.
With the national wave of smaller is better charging herd of policymaking leading the pact, it is possible for spit in the wind techniques and anecdotal evidence to inform school policies. Therefore, policymakers, practitioners, parents, and other stakeholders must be presented with research-based evidence that is understandable to all. This study is a step in that direction, and it provides a framework for future studies.
Recommendations for Future Research
Based on the conclusion of this study exploring the effect of school size on the performance of NYC high schools, the following recommendation is advanced:
A study exploring the impact of mediating and/or moderating factor on school size and performance (e.g., SES, student race/ethnicity, student gender, or principal gender).
Recommendations for Future Practices
The following recommendation is made.
To facilitate future study, report card performance data for charter schools and other data with principal gender delineated should be included on NYC DOE’s website.
Footnotes
Acknowledgements
Thanks to Bobby G. Martin, PhD, A&P, for his initial guidance with Excel, making this work possible.
Declaration of Conflicting Interests
The author(s) declared no potential conflicts of interest with respect to the research, authorship, and/or publication of this article.
Funding
The author(s) received no financial support for the research and/or authorship of this article.