
Abstract
Background
Chronic undernutrition (stunting) among children is associated with an increased risk of morbidity and mortality. The global community is committed to end all forms of malnutrition by 2030. Regardless of this, children are suffering from some form of malnutrition but the reason is unclear. This study thus was intended to identify stunting and associated factors among children aged 6 to 59 months in the South Ari Woreda of South Omo Zone.
Methods
A community-based cross-sectional study was conducted in South Ari Woreda from 1, January 2022 to 30, February 2022, and 409 children participated. A simple random sampling technique was used to identify study participants, and mothers/caregivers were interviewed. Data on sociodemographic, economic, and environmental determinants were collected by trained professional nurses using interviewer-administered questionnaires and anthropometric data were collected via weighting and measuring the height/length of the child. Emergency Nutrition Assessment for Standardized Monitoring and Assessment of Relief and Transitions 2020 software was used to generate an anthropometric index, and a child with a height for age index below −2standard deviations of the standard population was considered stunted. Factors of stunting were assessed using multivariate binary logistic regression at a 5% significance level.
Results
The study revealed that 44.0% (95% confidence interval (CI) = 39.19%-48.81%) of children were stunted in the study area. Household's wealth status (the poorest; adjusted odds ratio (AOR) = 4.14 [95% CI = 2.08-8.22] and poor; AOR = 3.31 [95% CI = 1.60-6.82]), improper solid waste management practice of the household (AOR = 2.67 [95% CI = 1.56-4.55]), and the children sleeping under insecticide-treated bed nets (ITN) (AOR = 0.37 [95%CI = 0.22-0.60]) were statistically significantly associated with stunting status of the children.
Conclusion
Stunting among the children in the study area was very high. Improving household's (HH) economy, safe management of domestic solid waste, and ensuring that the children are sleeping under ITNs are expected to reduce stunting.
Background
The term undernutrition is expressed as a condition or status below −2 standard deviations for height to age, weight for age, and weight for a height of the standard reference group.1–3 It includes wasting, stunting, underweight and micronutrient deficiency, and overnutrition include overweight, obesity, and diet-related noncommunicable diseases (NCDs).4–7 Undernutrition poses multiple unfavorable impacts from intermediate to chronic consequences. It is responsible for impaired mental growth and lower intelligence quotient (IQ), premature death, lower productivity, lowered immunity and risk of NCDs and is attributed to 45% of all death among children. 8
According to the World Health Organization (WHO) estimate, malnutrition is still rampant and affecting millions of children all over the world. Globally, 149.2 million (22%) children under the age of 5 years were stunted, 45.4 million (6.7%) were wasted of which 13.6 million were severely wasted, and 38.9 million (5.7%) were overweight in 2020. It was not uniformly distributed across all countries and regions; Asia and Africa are home to most cases. More than half (53%) of stunted children live in Asia, and Africa is home to 41% of stunted children. 9
One-third (34.7%) of children under the age of 5 years were stunted in the urban slums of India. 10 A study in Tanzania revealed that 8.37% of children were stunted in 2016. 11
Even though the prevalence of stunting in Ethiopia is decreasing as time proceeds, it is still high; 37% of children under the age of 5 years were stunted (short for their age).12,13 Almost half (46.1%) of preschool children were stunted in Gondar town, northwest, Ethiopia in 2019. 14
Stunting was affected by household wealth index and dietary quality; low wealth status and poor dietary diversity were enhanced stunting among children aged 6 to 59 months in the Jima Genti district. 15 School-age children, children who had low dietary diversity, used water from a nonpiped source and anemic children were more stunted than their counterparts. 14
The world community is committed to ending all forms of malnutrition including stunting across all countries by 2030.16,17 The Ethiopian government has also long been trying to ensure food and nutrition security intended to reduce stunting among children, adolescents, mothers, and all population,18,19 and targeted to reduce the prevalence among children under the age of 5 years from 37% 13 to 32% by 2022. 20 But studies showed a higher prevalence of stunting among childrens aged under-five year in Ethiopia even though the findings are inconsistent; 27% 15 to 37% 13 and 44%. 21 Besides, there is lack of studies and substantial evidence on the magnitude and factors associated with stunting among children under the age of 5 years in South Ari Woreda, South Omo zone. Therefore, this study was aimed at identifying the magnitude and factors associated with stunting among children aged 6 to 59 months in South Ari Woreda, South Omo Zone, South West Ethiopia, 2022.
Methods
Study Area
The study was carried out in South Ari Woreda, South Omo Zone, which is located 650 km to the Southwest of Addis Ababa, Ethiopia. There are 2 agrarian, 2 semi-agrarian, 4 pastoralist Woredas, and 1 town administration under South Omo zone, and these administrative units are divided into kebeles (the smallest administrative unit and further divided into villages that comprise households) in the zone. People with different sociodemographic (cultural backgrounds, religion, and ethnic bases [16 ethnic groups]) and economic characteristics are living in the zone. The agrarian Woredas (South Ari and North Ari) mainly rely on agriculture and produce cereals, pulses, green leafy vegetables and fruits, and rear domestic animals like hens, sheep and goats, cows, and oxen. The pastoralist mainly relies on animal production. The zone has 1 general hospital, 3 district hospitals, 45 health centers, 258 health posts, and 104 private clinics; of these health facilities, 1 hospital, 9 health centers 52 health posts, and 15 private clinics are in South Ari Woreda.
Study Design and Period
A community-based cross-sectional study design was carried out In South Ari Woreda from 1, January 2022 to 30, February 2022.
Study and Source Populations
All children aged 6 to 59 months who were living in randomly selected kebeles in South Ari Woreda (administrative unit with an estimated total population of 100 000 and further subdivided into the smallest administrative unit called kebele) were study population, whereas the source population were all children aged 6 to 59 months in the Woreda. Biological mothers or others who were in charge of caring for the child during data collection and living in randomly selected households were interviewed. Children who were healthy and had no deformity were included while those who were sick or have deformity and with incomplete data were excluded.
Sample Size Determination
The sample size to determine the magnitude of stunting and its associated factors among children aged 6 to 59 months was computed using single population proportion formula using EPI Info Version 7 for Microsoft Windows with the following assumptions. Expected prevalence of stunting is 41.2%, 21 95% confidence level, 5% margin of error, and 10% compensation for possible nonresponse. With the aforementioned assumptions, the sample size for the magnitude of stunting was found to be 409, and the sample size for associated factors was calculated using EPI Info 7 for Microsoft Windows with power assumption (power = 80), and found to be less than 409; thus, the sample size for the magnitude of stunting had been used for both purposes.
Study Variables
The dependent variable was the magnitude of stunting among children aged 6 to 59 months. The independent variables were the household's socioeconomic status (wealth status, educational attainment of parents, and ge and sex of the child), care for a child (vitamin A supplementation, up-to-date vaccination, and sleeping under ITNs), child feeding practice (breastfeeding practice, meal frequency per day, breast milk initiation after delivery, and dietary diversity score of the child), dietary diversity of the household, and domestic waste management practice.
Sampling Procedure
Initially, representative kebeles were selected from the total kebeles in the Woreda by simple random sampling method. The required sample size is proportionally allocated to kebeles based on their estimated source population number (the total number of 6-59 months children). The households with children under the age of 5 years drown from the health post's/kebele master family index from the respective kebeles with a simple random sampling technique in collaboration with health extension workers. If there were more than 1 6 to 59 months child in the selected household, the youngest was preferred, and a lottery method was used to select from twins.
Data Collection Tool and Data Collection
Pretest was conducted on 5% of the total sample size to check up consistency and become familiar with the data collection tool. Training was given to experienced data collectors, assistants, and supervisors on the objectives of the study, contents of the questionnaire, ethical considerations, field data management, quality assurance, and the total number of households/children to visit per day. A structured interviewer-administered Amharic version questionnaire that was translated by English teachers at Jinka University from the original English questionnaire was used. The questionnaire was adapted from Ethiopian Demographic and Health Survey 2016, 12 and it had sociodemographic, socioeconomic, hygiene, and sanitation related, child feeding practice, child dietary diversity assessment, household dietary diversity assessment, and child's anthropometric (weight and height/length) measurement questions. Child's dietary diversity was assessed via 24-hour recall method by interviewing the mother/caregiver. The weight of the child was measured with a portable digital weight scale (Seca electronic scale, Hamburg, Germany) to the nearest 0.1 kg with light clothes and no footwear. The weight scale was calibrated by known weight before measurement and scaled to 0 after each measurement. The height or length of a child had been measured with a portable height scale consisting of a simple movable headboard and fixed footrest to the nearest 0.1 cm with no footwear and head cafe. The height or length measurement was taken while the shoulder, buttock, and heel touched the board and the sole rest straightly on the fixed footrest.
Operational Definition
Optimum Dietary Diversity Score
Percentage of children who consumed foods and beverages from at least 5 out of 8 defined food groups during the previous day (breast milk, cereals, pulses and nuts and seeds, dairy products, flesh foods, eggs, vitamin-A rich fruits and vegetables, and other fruits and vegetables) whereas suboptimum when the child consumed less than 5 food items from 8 food groups according to current WHO, UNICEF, and World Bank cut-off (MDD-8). 22
Optimum Household Dietary Diversity Score
According to Food and Nutrition Technical Assistant (FANTA) cut-off for household dietary diversity, the household has optimum dietary diversity score if it consumed at least 4 food items from 12 food groups (33.3%) in the last 24 hours.23,24
Stunted
A child was considered stunted if his/her height for age Z-score (HAZ) was below −2 standard deviation from the standard reference population for the age and a child is severely stunted when HAZ is below −3 SD of the mean of the standard population. 1
Quality Assurance
Pretest was conducted on 5% of the total sample size to check up the consistency and become familiar with the data collection tool. Translation of the questionnaire from English to Amharic and back to English was made by independent English teachers at Jinka University to check the consistency. Training was given to data collectors and supervisors, and supervision was conducted by supervisor and investigators. Weight scale calibrated with an object with known weight before starting measurement and adjusted to 0 after each measurement. Checking for the data completeness and consistency was carried out, and the data cleaning continued to the end of descriptive analyses. Hard copies were checked when unexpected results and outliers were observed. The Hosmer and Lemshaw model fitness at nonsignificant value and multicollinearity tests were conducted. A sample adequacy for principal component analysis (PCA) was tested with Kaiser–Meyer–Olkin (KMO) value greater than 0.6 during PCA.
Data Analysis
Raw data were entered and analyzed using Statistical Package for the Social Sciences version 20 for Microsoft Windows. The household's economic status was measured by the wealth index that was constructed with PCA from household assets. Initially, 28 variables were used to construct PCA and all had factor loading values greater than 0.4. KMO measure of sample adequacy was 0.632 and Bartlett's test of sphericity was significant. We found eleven components with eigenvalues greater than 1 with a total explained variance of 63.625%. Height for the age of children was calculated by ENA for the SMART 2020 application. Descriptive analysis was carried out to see the magnitude of stunting and descriptive data were presented using tables and paragraphs. Multicollinearity test among independent variables was checked at variance inflation factor less than 10 or tolerance greater than 0.1 and a chi-square test was carried out to check expected cells adequacy by cross-tabulation. A binary logistic regression model was used to determine the factor that affected stunting status among children. Explanatory variables with greater frequency were used as a reference group, and variables with a P value less or equal to .25 were the candidate for multivariate logistic regression. Variables with a P value less than .05 during multivariable binary logistic regression were considered a statistical significant factor of stunting. Binary logistic regression outputs were presented with crude odds ratios (COR) and AOR with their respective 95% CI.
Result
Sociodemographic Characteristics of the Households
Four hundred and nine study participants had fully responded to the interview, and the response rate was a 100% Majority of the respondents belonged to Ari ethnicity; 374 (91.4%). The mean age of the children was 22 (± 13) months and the median age of the mothers was 28 with inter-quartile range ((IQR) = 5) years. More than a half; 56.0% of the children participated in the study were male (Table 1).
Sociodemographic Characteristics of HH, South Ari Woreda, South Omo Zone, 2022.

In more than half of the households, 53.3% belong to the fourth quintile of the wealth index and the HHs under the first, second, third (middle), and fifth wealth quintiles were 8 (2%), 68 (16.6%), 85 (20.7%), and 30 (7.3%), respectively. In majority of the households, 85.1% were using a simple pit latrine with wooden slabs, 35(8.6%) used a pit latrine with cemented slab, and 26 (6.4%) of the households had no toilet of any type.
More than a half of HHs in the study area, 65.8% were accessing drinking water from public stands, 111 (27.1%), 23 (5.6%), and 6 (1.5%) of HHs were fetching water for drinking from protected springs, unprotected springs, and pipes in the yard, respectively.
Health Care/Services and Household Practices
Almost three-fourth of households (302 out of 409) reported that they were collecting solid wastes separately and disposing of them by burial and carting away by the municipality. Most of the respondents (84%) were washing their hands after visiting the toilet and before feeding a child. Almost all of the caregivers/mothers (97.8%) mentioned that their index children were up to date with all vaccinations appropriate to their age and 373 (91%) of children received vitamin A supplementation in the past 6 months. Less than half (174 [42.4%]) of the children had slept under ITNs in the night preceding the data collection day, and 139 (33.9%) and 131 (32%) of the children were sick 2 weeks before data collection date from diarrhea and fever, respectively, and all the sick children were taken to the health facility.
All of the mothers/caregivers told that they initiated their recent children to breastfeeding immediately after birth or within 1 h of birth and 389 (95%) had exclusive breastfeeding for the first 6 months of birth. The median duration of breastfeeding was 18 (IQR = 15) months and the mean age of introducing complementary feeding was 5.92 (±0.747) months. Regarding the child's meal frequency per day, the minimum and maximum meals per day were 1 and 5, respectively, and the median meal frequency was 3 (IQR = 1) meals per day preceding data of the survey. Three-fourth of the respondents mentioned that they prepared separate food from the household for their recent children and only 2 (0.5%) reported that some foods are restricted or not given to the children.
Majority of the households (94.4%) had optimum household dietary diversity score (consumed at least 4 food types from 12 categories) and more than three-fourth (78%) of children had optimum dietary diversity score (consumed 5 or more food items from 8 food groups regardless of the amount of food item they consumed).
Regarding the chronic undernutrition status of the children, 44.0% (39.19%-48.81%) of the children aged 6 to 59 months were stunted; 11.7% were severely stunted and 33.3% were moderately stunted.
Factors Associated With Stunting Status of Children Aged 6 to 59 Months
Multivariable logistic regression analysis was carried out with 8 candidate variables, and finally, 3 variables became statistically significant factors of stunting among the children; HH wealth index (AOR = 4.14 [95% CI = 2.08-8.22]) the poorest and (AOR = 3.31 [95% CI = 1.60-6.82]) poor, improper HH waste disposal practice (AOR = 2.67 [95% CI = 1.56-4.55]), and the children usually sleeping under ITNs (AOR = 0.37 [95% CI = 0.22-0.60]) (Table 2).
Binary Logistic Regression Analysis of Children's Stunting Status, South Ari Woreda, South Omo, Ethiopia, 2022.
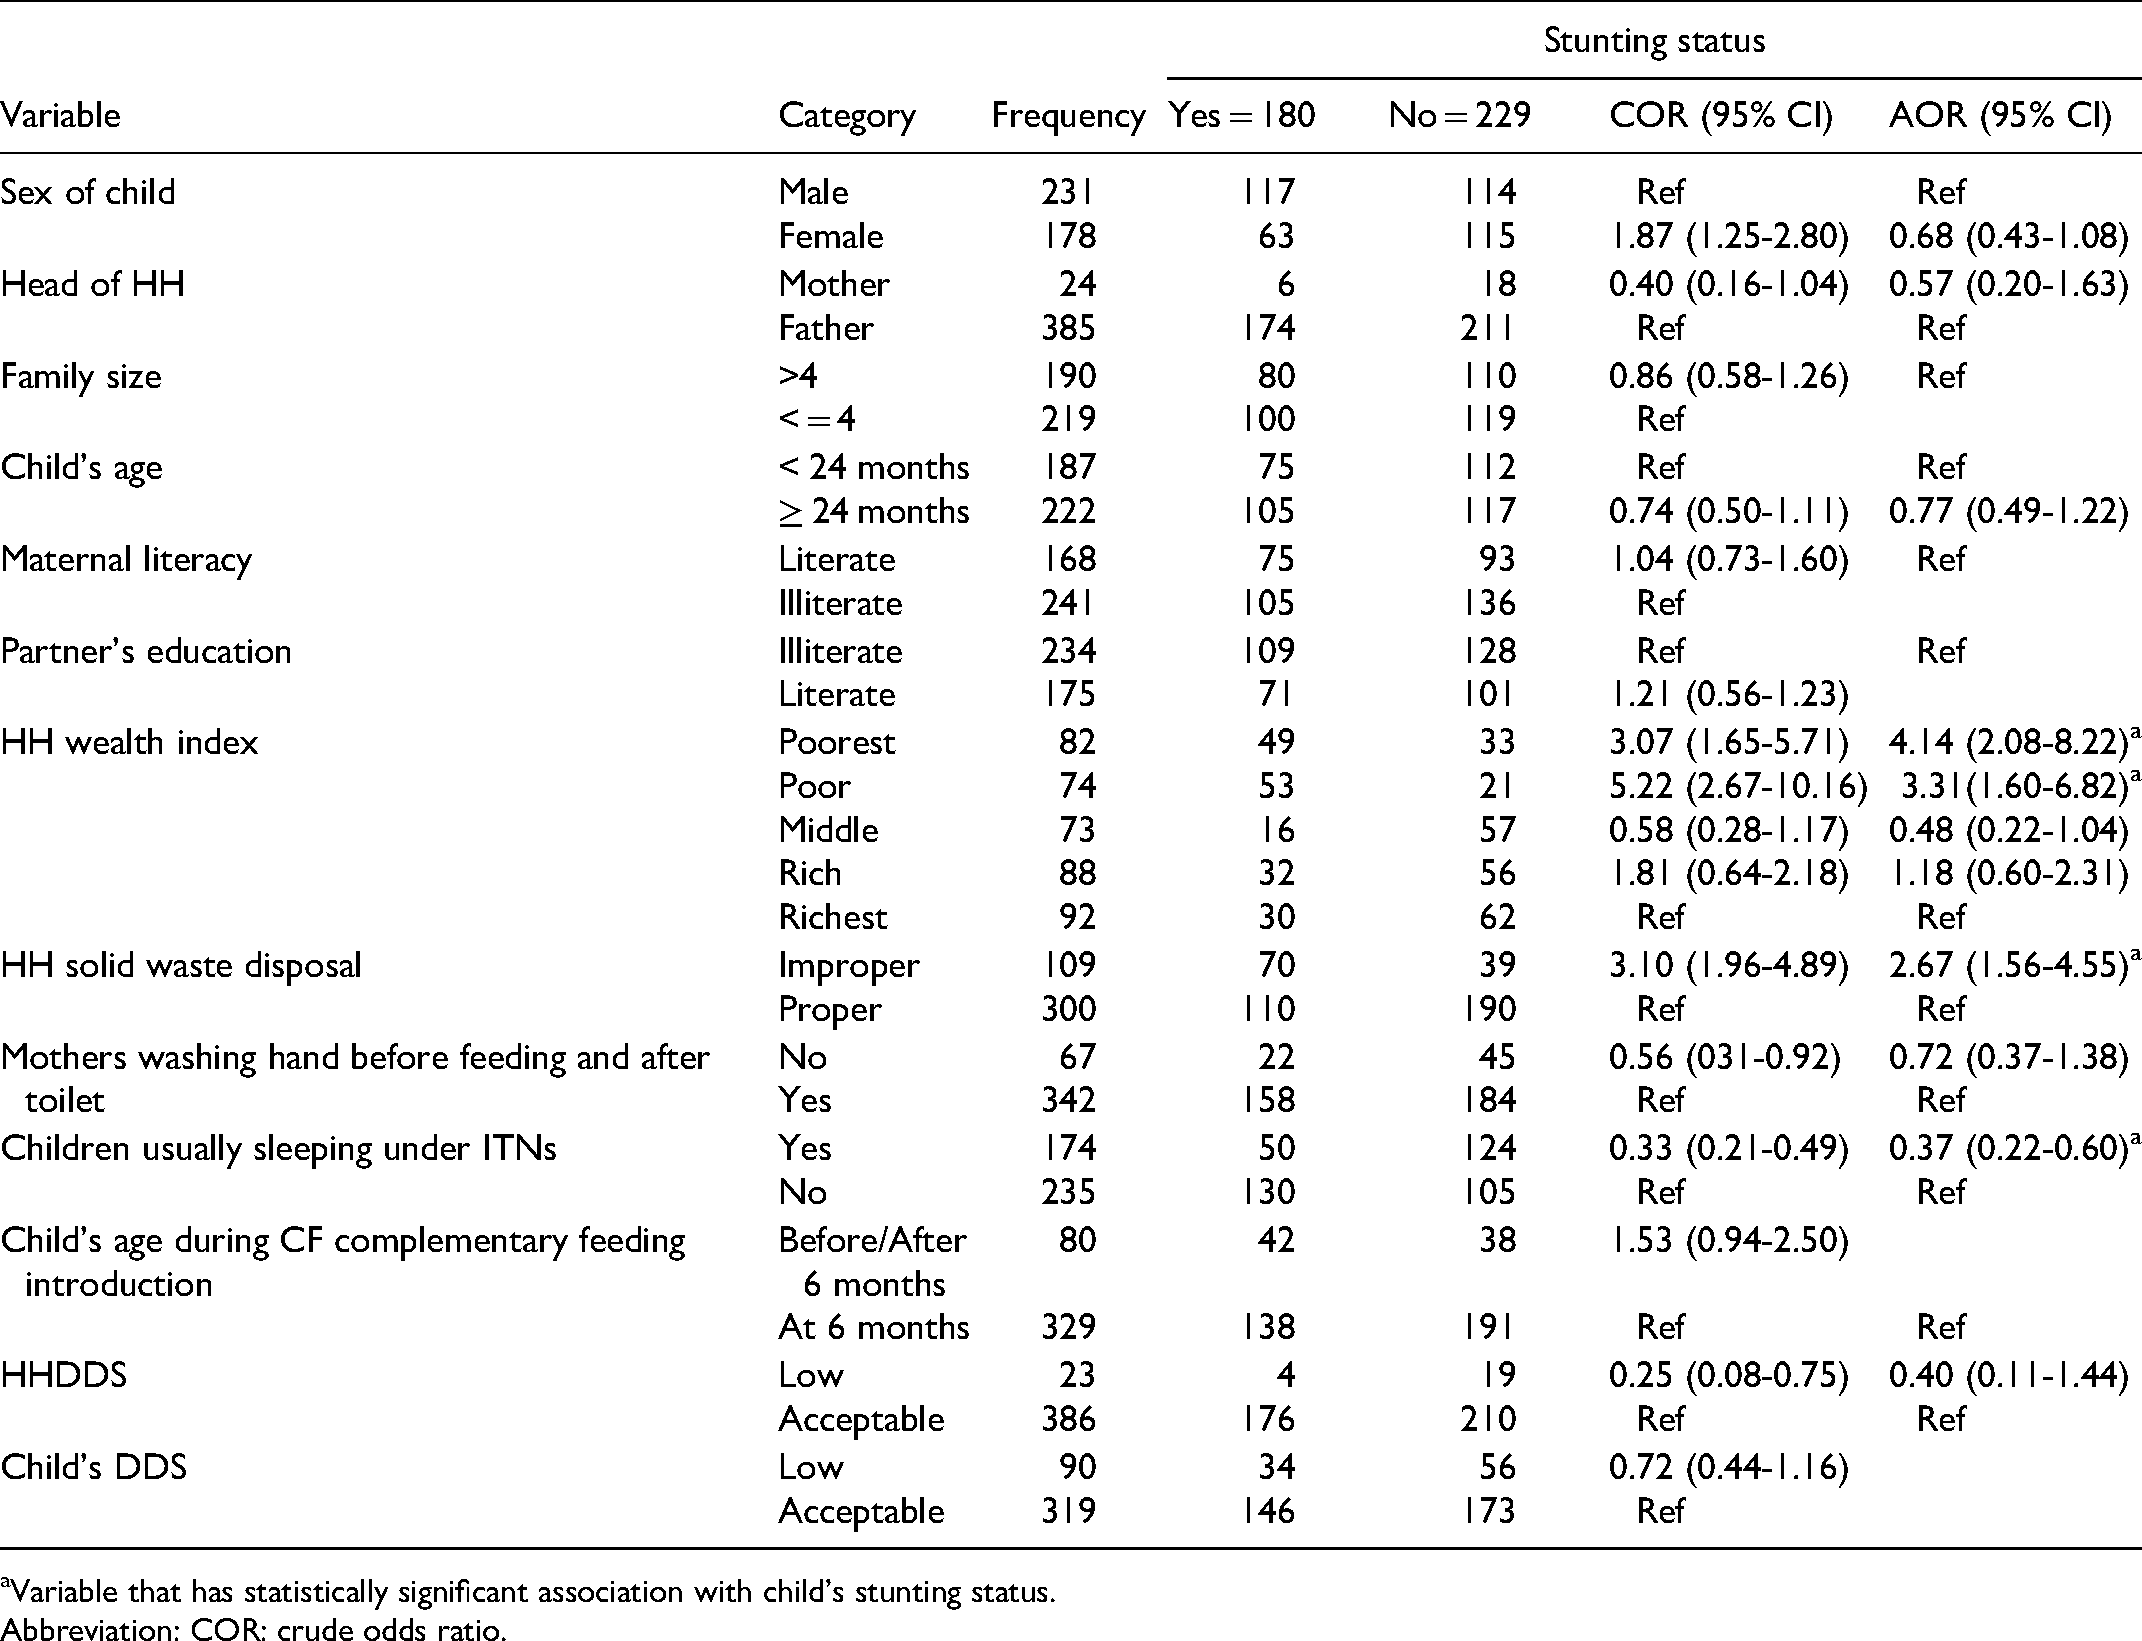
Variable that has statistically significant association with child's stunting status.
Abbreviation: COR: crude odds ratio.
Discussion
The current study tried to investigate the magnitude of stunting and its associated factors among children aged 6 to 59 months in South Ari Woreda, and revealed that stunting among the children was (44.0% [39.19%-48.81%[) and determined by household economic status, household waste management practice and using ITNs by children.
The current study witnessed the magnitude of stunting among children as 44%. It is similar to the proportion of stunting shown by the studies conducted in the Afar regional state 25 and Hawassa Zuria district, 26 but higher than the finding revealed by the Bayesian multilevel analysis of EDHS 2016; 41.2%. 21 modeling predictors of stunting; It is also higher than the data revealed by the analysis of EDHS 2016 to model the predictors of stunting (39.2%), 23 the current national average (37%), 13 the study conducted in Bangladesh; 36.2% 27 and Joint Monitoring Estimate of stunting in Ethiopia (35.3%). 24 The difference may be due to the former studies reporting stunting status among children all over the country; the areas with lower prevalence masked the proportion. It is higher than stunting among children in Aykel town; 28.4%, 28 and the inconsistency may be due to the latter study was carried out in an urban setting; several studies witnessed that rural children are more at risk of stunting than their urban counterparts. The current finding is also higher than finding (8.37%) witnessed by study carried out in reproductive and child health clinic at Bagamoyo District Hospital, Tanzania, 11 and this difference may be due to difference in maternal literacy which was 71% in Bagamoyo District, Tanzania and 42.3% in our case, inadequate access to social and economic center city of the country in current setting than Bagamoyo in Tanzania where there was adequate access to and presence of nutrition-specific service in Bagamoyo.
The current finding is lower than the prevalence of stunting among children 6 to 59 months old in North Shewa, Oromia regional state, Ethiopia; 47.6% 29 and the finding revealed by a study carried out in Bule Hora district, Southern Ethiopia; 47.6%. 30 The difference may be due to the time duration when different interventions by governmental (community-based nutrition approach), intensified livelihood interventions, by agricultural sectors nutritional interventions, by nongovernmental organizations like World Vision, and other working nutrition interventions in the study area and quality of life is also improving.
The lower the economic status of households in the study area, the more the likelihood of the child to be stunted; children from households with the poorest and poor quintile of economic status had 4.14 and 3.31 times increased odds of stunting, respectively, when compared with the fifth wealth quintile (the richest). This is consistent with multilevel analysis of EDHS 2016, 21 MEDHS 2019, 13 further analysis of EDHS 2016, 31 study in Jimma 15 study carried out in Sub-Saharan Africa, 27 analysis of Bangladesh demographic and health survey 32 , and study carried out in Pakistan. 33
Sanitation is a statistical significant factor in stunting among children aged 6 to 59 months in the current study area; our study witnessed that children from households that practiced improper solid waste management had higher likelihood of stunting than their counterparts. This is similar to the study done in Sub-Saharan Africa 27 and meta-analysis and systematic review. 34 The finding is also consistent with evidence revealed by the hierarchical analysis of EDHS 2000 to 2016 35 and study in Bangladesh. 36 Other studies also witnessed that stunting was directly related to poor sanitation.37–39
As to our study, children who have been consistently sleeping under ITNs had 63% reduced odds of stunting; malaria infection and stunting might be directly related. Even though we lack substantial evidence on the direct effect of child's ITNs utilization on stunting status, studies show that children who were infected with malaria had higher likelihood of stunting. Consistent use of ITN among children is associated with reduced episodes of malaria (proxy indicator for lower/no malaria infection). The finding from the study carried out in Uganda, 40 Gambia, 41 and Kenya 42 revealed that children with previous incidences of malaria had increased odds of stunting. Another case–control study conducted in Shashogo district, Southern Ethiopia also witnessed that children who had malaria infection also had increased risk of undernutrition. 43
Limitations
Some of the cells have smaller sample sizes, and as a result, caution is needed when interpreting the findings.
Conclusion and Recommendations
The prevalence of stunting among children aged 6 to 59 months was very high in the current study area. It seems that we are not on the right track to achieving the target set by the Ethiopian government to reduce to 32% by the end of 2022 and the SDG target to end stunting (all forms of malnutrition) by 2030. Higher stunting in the study area was determined by lower household wealth status, improper household waste management practice, and not using or inconsistent use of ITNs by children to sleep under it. Therefore, we recommend that the South Ari Woreda health office should work hard to ensure proper sanitation (safe management of household solid waste) and the children usually sleeping under ITNs by providing ITNs, health education, and follow-up on utilization through the health development army and health extension program. The Woreda needs to work to improve the economic status of households via creating income-generating activities and livelihood services. The authors call on the scientific community to search for additional evidence on the effect of ITN utilization and household waste management practices on stunting among children aged 6 to 59 months.
Footnotes
Acknowledgements
The authors would like to thank Jinka University for giving an ethical clearance and supporting letter to carry out the study. Our gratitude also goes to data collectors, supervisors, and study participants and we would like to express our sincere thanks to Jinka General Hospital for material support. We extend our thanks to the editor and peer reviewers for their scientific contributions.
Author’s Contribution
E.W.W. and G.A.T. conducted the conception and design of the study, supervised data collection and management, data analysis, interpretation of the findings, and wrote the manuscript. M.G.W. carried out data management and analysis and interpretation of the findings. All authors reviewed and approved the manuscript.
Declaration of Conflicting Interests
The author(s) declared no potential conflicts of interest with respect to the research, authorship, and/or publication of this article.
Funding
The author(s) disclosed receipt of the following financial support for the research and/or authorship of this article: The fund for data collection, supervision, management, and analysis was received from Jinka University, Ethiopia.
Ethics Approval and Consent to Participate
Ethical clearance was obtained from the Jinka university office of the vice president for research and community service with the reference number JKU/VPRCS/122/14 after evaluating the proposal based on the national research ethics review guideline. The written supporting letter was obtained from the South Omo Zone health department to select Woreda and from Woreda to kebeles, community, and households. All the objectives, benefits, and burdens of participating in the study were orally presented in a language the respondents can understand. The contact of authors (cell phone) was disclosed to the respondents to communicate when they have a question or any doubts. The informed oral consent was obtained from the interview participants and parental assent was assured before measuring children's weight and height or length. No individual identifier was used during the data collection and analysis stages of the study.