
Abstract
Background
Low dietary diversity is the main public health issue in developing countries. Despite its burden, there is a paucity of information on the dietary diversity of households and related factors in rural residents of southern Ethiopia. Therefore, this study assessed household dietary diversity and associated factors among rural residents of Gomole district.
Methods
A community-based cross-sectional study design was conducted from November 1 to December 30, 2020, among 554 randomly selected rural households. Data were collected by using pretested structured face-to-face interviews about dietary intake by any household members within the past 24 h. The data were coded and entered into Epi data 3.1 and analyzed using Statistical Package for Social Sciences version 23. Both descriptive and analytic statistics were employed. Adjusted odds ratios (AORs) together with 95% confidence intervals and p values of less than 0.05 were used to declare statistical significance.
Results
Out of the total, 19% (95%; CI = 15.7–22.2) of households had adequate dietary diversity scores. The mean (±SD) dietary diversity score was 5.12 (±1.6). The most consumed food groups in the study area were cereals/grains (96.4%), condiments (salt and beverages (tea)) (84.3%) and milk and milk products (80%). The sex of the household head (AOR = 2.31, 95% CI: 1.04–5.13), bank account ownership (AOR = 2.18, 95% CI: 1.04–4.59), and livestock ownership (AOR = 4.75, 95% CI: 1.35–16.73) were positively associated with dietary diversity. However, distance to the marketplace (AOR = 0.11, 95% CI: 0.02–0.56) was negatively associated with adequate dietary diversity.
Conclusion
There is low dietary diversity among households of study area. Improving livestock rearing and bank accounts should be strengthened through strong intersectional collaboration to alleviate the problem.
Background
Dietary diversity (DD) is defined as a series of food groups consumed within a given time to ensure that sufficient intake can promote the basic nutrition of good health, body development and psychological development.1,2 However, consumption of inadequate quantities of foods by households results in undernutrition, an abnormal physiologic condition caused by inadequate consumption of macronutrients and/or micronutrients. 3
Globally, it is estimated that approximately 2 billion (27%) of the world’s population suffer from micronutrient deficiency. Among micronutrient deficiencies, 793 million (10.7%) of worldwide population are calorie deficient and 19% of pregnant women are ‘vitamin A’ deficient. Over a quarter of the world’s population is anemic due to iron, folate and vitamin B12 deficiencies.4,5 Africa shared the highest ratio (44%) of iron deficiency anemia among nonpregnant women and 25–35% of the global burden of maternal vitamin A deficiency. In sub-Saharan Africa, approximately 26% of the population has inadequate zinc intake that reflects high zinc deficiency.5–8
According to the Food and Agricultural Organization, there are sixteen groups of food. These food groups are cereals, vitamin A rich vegetables and tubers, white tubers and roots, dark green leafy vegetables, other vegetables, vitamin A riches fruit, other fruits, organ meat (liver, heart, kidney, etc), flesh meat, eggs, fish and seafood, legumes (beans, peas, lentils, etc), dairy products (milk and milk products), oils and fats, sweets and spices, condiments and beverages. 1
Having a variety food groups in a diet to meet the nutrient requirements refers to dietary diversity. Practicing dietary diversity is increase the variety of foods across and within food groups capable of ensuring adequate intake of essential nutrients that can promote good health, physical and mental development. Moreover, it is a qualitative measure of food consumption that reflects household access to a variety of foods and is also a proxy for the micronutrient adequacy diet of individuals.9,10
In Ethiopia, several studies have reported low household dietary diversity ranging from 65.7% to 83.3%.11–13 The most food items consumed in the past seven days were cereals (rice, sorghum, barley, wheat). This can result in a reduction in nutrients since no single food group contains all nutrients required for the healthy functioning and performance of the body.13–15 The low dietary diversity of the family has short-term consequences, such as mortality, incidence, and disability, and long-term consequences, such as interruption, affecting cognitive ability, low economic productivity, poor reproductive performance, decreased metabolism and cardiovascular disease. 16
In addition, malnutrition is still very high among rural populations and increases the risk of food and nutritional insecurity, mainly where indigenous populations prevail. 17 However, there is no evidence of nature and the relative level of dietary diversity among rural residents, especially in pastoral areas of southern Ethiopia. Therefore, this study aims to assess the level of household dietary diversity and associated factors among rural residents of Gomole district, Borena Zone, Oromia, Ethiopia.
Methods and Materials
Study Design, Period and Setting
A community-based quantitative cross-sectional study design was conducted among randomly selected households from November 1 to December 30, 2020, in Gomole district, Borena Zone, Oromia region, Ethiopia. Gomole district is located 525 km from Addis Ababa, along the Addis Ababa - Moyale highway. The district is found 42 km north of the Zonal capital Yabelo and 58 km south of Bule Hora town. Gomole district has 14 kebeles (13 rural and 1 urban kebeles). According to the Gomole district administration office, the population of the district is approximately 67,798, and the majority of them are pastoralists. The district is an arid and semiarid area, with an annual mean daily temperature ranging from 17 °C to 30 °C. The district has bimodal rain seasons. The district has one health center and nine health posts.
Study Population and Inclusion Criteria
All randomly selected households in selected rural kebeles of Gomole district, Borena Zone during the study period were our study populations. The households who lived in the study area for at least six months were included in the study, while the households who were unwilling to participate in the study were excluded from the study.
Sample Size Determination and Sampling Procedures
The sample size for the first objective of the study was calculated by a single population proportion formula of rural households with adequate dietary diversity from a previous study (34.3%).
12
By considering margin of error-5%, confidence level-95%, 10% nonresponse rate and 1.5 design effect, the final sample size was
Data Collection Instrument and Procedures
Data were collected by pretested and structured questionnaires through face-to-face interviews on Scio-demographic, socioeconomic, market access, wealth index and others. In this study, the outcome variable (household dietary diversity) was measured as a dichotomous indicator/tool that was developed by FAO. A total of 16 food groups were considered in this study (ie, cereals, white tubers and roots, vitamin A-rich vegetables and tubers, dark green leafy vegetables, other vegetables, vitamin A-rich fruits, other fruits, organ meat, flesh meat, eggs, fish and seafood, legumes, seeds and nuts, milk and milk products, oils and fats, sweets, spices, condiments, and beverages). 1 These food groups were further regrouped into 12 food groups to collect the dietary diversity of households. These food groups are cereals; white tubers and roots; legumes, pulse and nuts; vegetables; milk and milk products; meat products; fruits; eggs; fish and other seafood; oils and fats; sweets; and spices, condiments and beverages. Data about household dietary intake patterns were collected by asking all food items consumed by any household member during lunch, dinner and any food eaten between each interval in the previous 24 h using a combination of open recall and list-based methods. 18 After respondents recalled all foods consumed, data collectors underlined the corresponding foods in the list under the appropriate food group and then wrote “1” in the column next to the food group if at least one food in the group was underlined. For any food group not mentioned by respondents, the data collectors wrote “0” in the column next to the food group. A household was classified into an adequate dietary diversity category if the household has an HDDS ≥7 and an inadequate dietary diversity category if the household has an HDDS <7.
Operational Definitions
Quality Assurance
To assure the quality of the data, data collectors were trained for four days on data collection instruments and procedures. The qualified language expert translated the English questionnaire into an Afaan Oromo to check for consistency. The Afaan Oromo questionnaire was pretested on approximately 5% of the sample size in the nearby Dugda Dawa district. Minor editions were made based on inputs from pretest and language translation exercises. The overall activities of the data collection processes were supervised by two supervisors, and two data clerks performed double data entry into Epi data version 3.1 to ensure accuracy and completeness of the data.
Data Processing and Analysis
The data were coded and entered into Epi-Data version 3.1 and exported to Statistical Package for Social Sciences (SPSS) version 23 for further analysis. Simple descriptive statistics, such as simple frequency distribution, measures of central tendency, measures of variability and percentages, were performed to describe the demographic, socioeconomic, and household-related characteristics of the respondents and then presented using graphs, pie charts and tables. Wealth index variables were analyzed by principal component analysis (PCA). 21 Bivariate logistic regression analysis was performed to assess associations between the dependent variable and independent variables. The independent variables with p values less than 0.25 in the bivariate analysis were considered for further analysis by multivariate logistic regression analysis to control for potential confounders and to detect the predictors of household dietary diversity. Multicollinearity was checked to determine the linear correlation among the independent variables by using standard error (SE). Variables with a SE of ≥ 2 were dropped from the multivariable analysis. The fitness of the model was tested by Hosmer–Lemeshow’s goodness-of-fit test model coefficient with an enter method, which was found to be insignificant with a large P value (P = 0.374), and the Omnibus tests were significant (P = 0.0001). Finally, the strength of associations between the dependent variable and independent variables was assessed by adjusted odds ratios (AORs) with 95% confidence intervals. A P value less than 0.05 was used to declare statistical significance of the observed associations.
Results
Socioeconomic and Demographic Characteristics of Households
Out of a total of 554 households were successfully enrolled in this study, with a response rate of 97.2%. Among the respondents, 94% (521) were females, and the rest were males. The ages of the respondents ranged from 18 to 59 years, with a mean (±standard deviation) of 28.6 (±1.1) years. A significant proportion of the household head occupation 52.3% (290) was herder (pastoralist), while the majority of 64.6% (358) of the household heads were unable to read and write. In terms of family size, the majority of households 65% (360) had more than five (Table 1).
Sociodemographic Characteristics Households in Rural Gomole District, Borena Zone, Oromia, Southern Ethiopia, 2020.

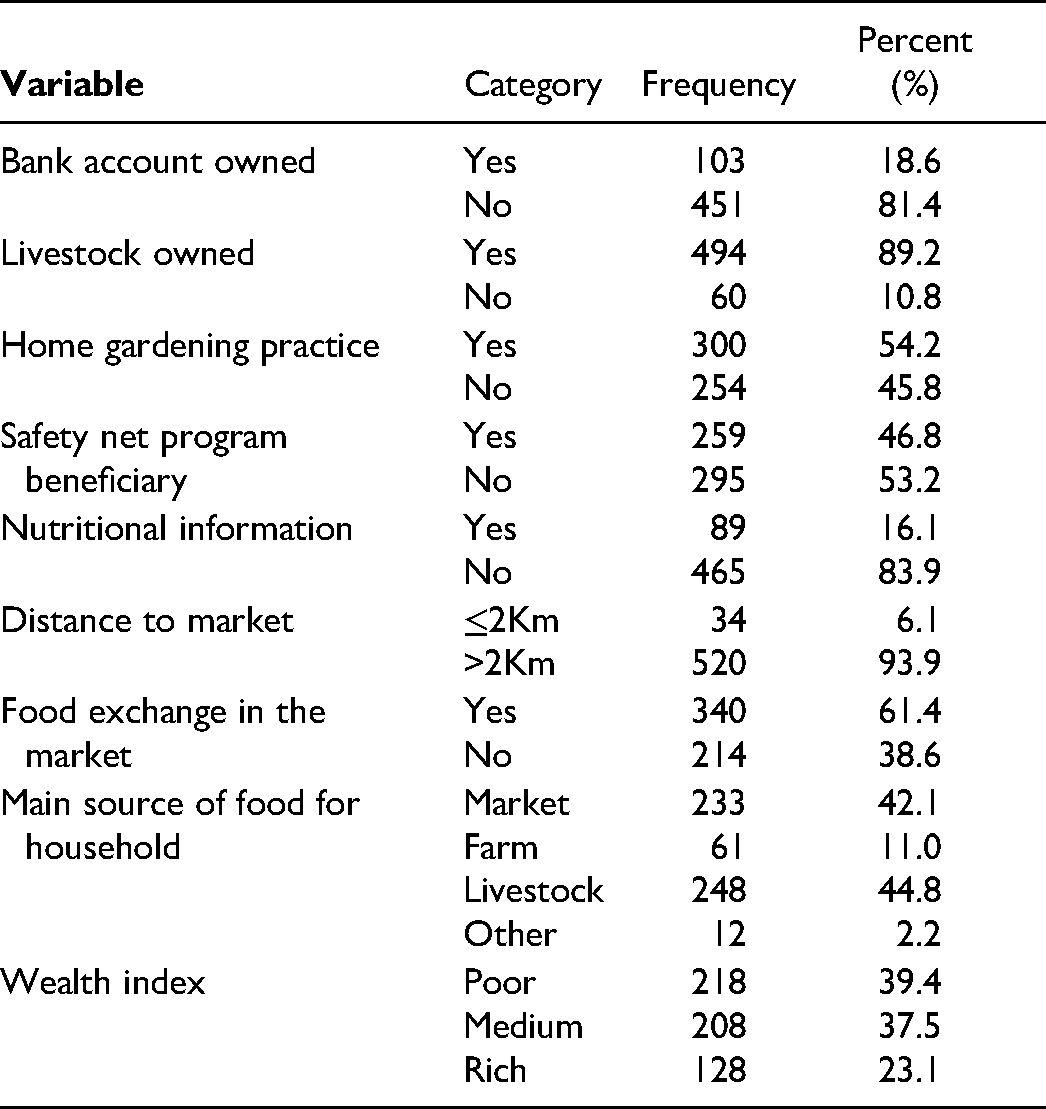
Regarding the socioeconomic status of households, 81.4% (451) of households did not have bank accounts, 89.2% (494) of households owned livestock, and 54.2% (300) of households possessed home gardens. The majority of households (93.9%, 520) lived at a distance of more than 2 km from the marketplace. The majority of households (61.4%, 340) engaged in food exchange at the market (Table 2).
Socioeconomic, Knowledge and Market Access Characteristics of Households in Rural Gomole District, Borena Zone, Oromia, Southern Ethiopia, 2020.
Household Dietary Diversity Practice
In this study, only 19% (105/554) (95%; CI = 15.7–22.2) of households had adequate dietary diversity (≥7 food groups), while 81% (449) had inadequate dietary diversity (20% low ≤3 food groups and 61% medium 4–6 food groups) (Figure 1). Among those who had adequate dietary diversity, 69.5%, 17.1% and 13.4% had rich, middle and poor wealth indexes, respectively (Figure 2).
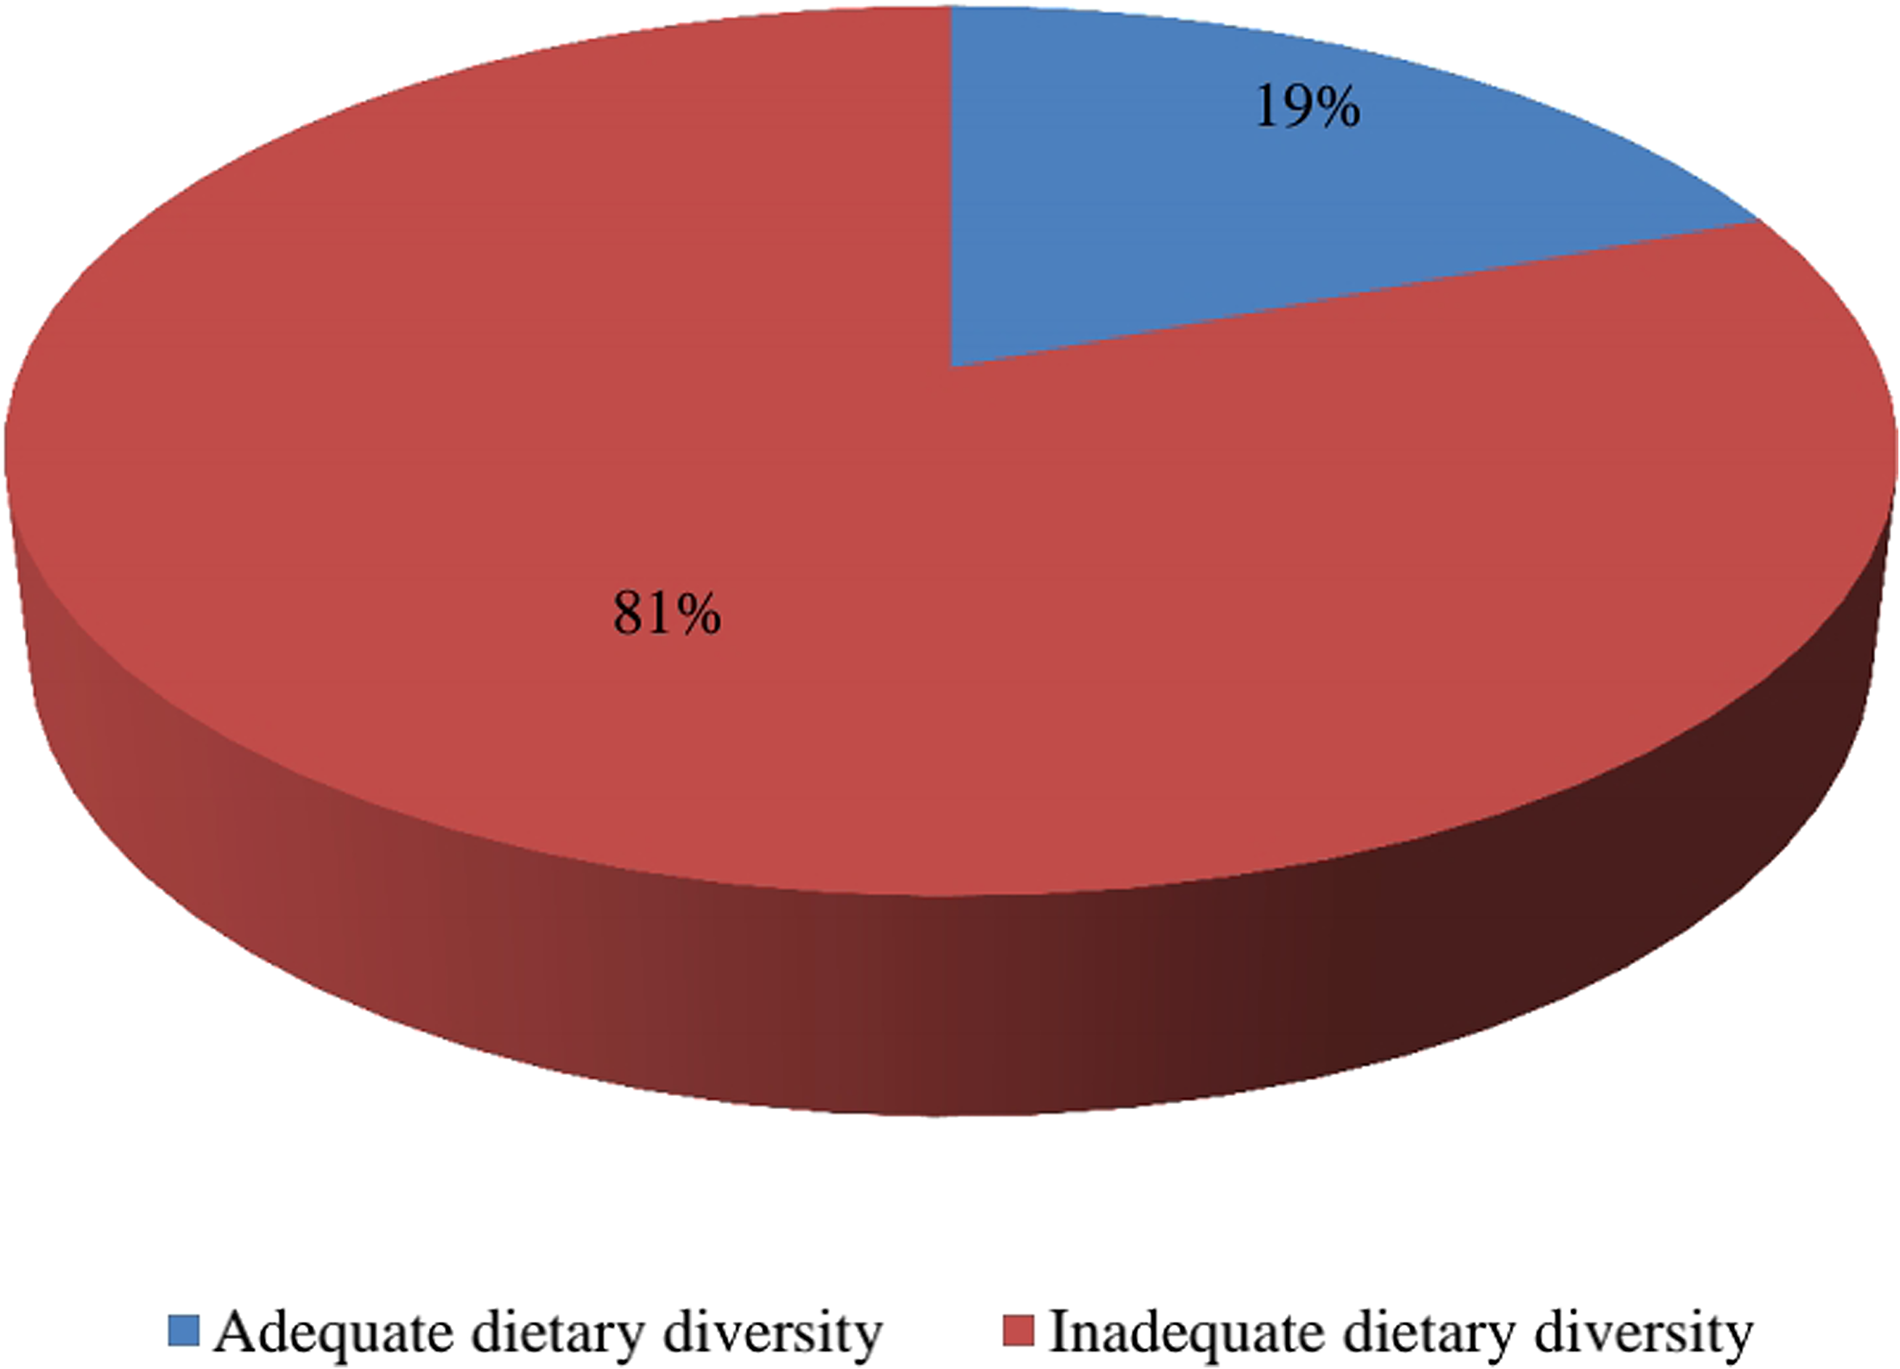
Household dietary diversity among rural residents of Gomole district, Southern Ethiopia, 2020.

Adequate dietary diversity among wealth status of housholds in Gomole district, Borena Zone, Oromia, South Ethiopia 2020.
Households Consume Food Groups
Cereals were the most commonly consumed food group (96.4%, 534) in the study area, followed by condiments and beverages (84.3%, 467), whereas fish and other seafood are the not consumed food group in the study area (Figure 3).

Food groups consumed by rural households in Gomole district, Borena Zone, Oromia, South Ethiopia 2020.
Factors Associated with Household Dietary Diversity
In bivariate logistic regression analysis, twelve variables, such as educational status of household head; occupation of household head; sex of household head; family size; ownership of bank account; ownership of livestock; home gardening practice; safety net program beneficiary; nutritional information; source of household’s food; distance to market place and wealth index, were found to be statistically significant at a p value of less than 0.25. However, in multivariate logistic regression analysis, bank account ownership (AOR = 2.18, 95% CI: 1.04–4.59), livestock ownership (AOR = 4.75, 95% CI: 1.35–16.73), sex of household head (AOR = 2.31, 95% CI: 1.04–5.13) and distance to market place (AOR = 0.11, 95% CI: 0.02–0.56) were found to be significantly associated with household dietary diversity (Table 3).
Factors Associated with Household Dietary Diversity among Rural Households in Gomole District, Borena Zone, Oromia, Southern Ethiopia: a Result of Multivariate Logistic Regression Analysis, 2020.

StatisticallyStatistical significance at P < 0.001 = ***, P < 0.01 = ** and at P < 0.05 = *, COR = crude odds ratio, AOR = adjusted OR with CI = confidence interval.
Discussion
The household adequate dietary diversity (≥7 food groups) in the present study was 19% (95%; CI = 15.7–22.2). This result is in line with the study conducted in different parts of Ethiopia South Gonder of Ethiopia 16.2%, 11 Yayu Southwest Ethiopia 21.3% 22 and Yayu Ilu Abbabora Zone 21% medium dietary diversity. 23 However, this finding is lower than that of a study conducted in the Tanzania Morogoro district (27%), 24 northeast Ethiopia (31.4%) 21 and Ethiopia Mirab Abaya woreda (34.3%), which reported high dietary diversity. 12 In contrast, the current finding is higher than that of a study conducted in the Tanzania Dodoma district (8%). 24 This difference in findings might be attributed to differences in geographical variation, sample size, mean cutoff point, agroecology, culture, seasonal variation and socioeconomic status.
In the present study, inadequate dietary diversity (<7 food groups) was 81%. This finding is similar to that of a study conducted in South Gonder Ethiopia (83.8%). 11 However, this value is higher than that of Mirab Abaya Woreda, Ethiopia (65.7%). 12 On the other hand, of households with inadequate dietary diversity, 20% scored low dietary diversity (≤3 food groups). This finding is in line with a study conducted in districts of Tanzania Morogoro with 20% low dietary diversity, 24 South Gonder Ethiopia with 21.1%, 11 Yayu Southwest Ethiopia with 17.5% 22 and Yayu Ilu Abbabora Zone with 19% low dietary diversity. 23 In contrast, the findings of the current study are lower than those of a study conducted in Bangladesh (42%), low dietary diversity, 25 Ghana (36.4%),, 26 and Tanzania Dodoma district (35%). 24 The possible explanation could be due to geographical variation and lack of enough production since the study was conducted in the winter season.
In the current study, the mean household dietary diversity score (DDS) was 5.12 with a standard deviation ± 1.6. This finding similar to the study conducted in Ethiopia Ilu Abbabora Zone Yayu biosphere reported DDS mean 5.2, 23 Yayu Southwest Ethiopia 5.51. 22 In contrast, the current study finding was higher than that of a study conducted in two districts of Tanzania, Morogoro and Dodoma DDS, with means of 4.7 and 4.1, respectively, 24 Northern Ethiopia Amhara region Lay Gayint District 3.1. 27 Regarding the types of food groups, all households (96.4%) consumed cereal/grain food groups, which agrees with a study conducted in Bangladesh, 25 India, 28 two districts of Tanzania Morogoro and Dodoma, 24 Ethiopia Lay Gayint District 27 and northeast Ethiopia. 21 On the other hand, the consumption of milk and meat products in this study was higher than that in studies conducted in India 28 and Bangladesh, 25 while a lower vegetable consumption study was conducted in two districts of Tanzania, Morogoro and Dodoma. 24 The believable reasoning for this may be because the majority of communities around the study area practice rearing animals; therefore, animal products are easily available for consumption but purchase vegetables from the market.
Multivariate analysis showed that households headed by males were 2 times more likely to have dietary diversity. This finding is in line with a study conducted in India 28 and Mirab Abaya woreda southern Ethiopia. 12 Similarly, having a bank account increases HHDDS by 2 times, which is in agreement with a study conducted in South Gonder Ethiopia. 11 Households who had livestock ownership had a nearly fivefold higher likelihood of consuming highly diversified diets than their counterparts. This is comparable with the study conducted in Lay Gayint District (2011) Amhara Region of Ethiopia 27 and South Gonder Ethiopia. 11 The possible reason could be the fact that being livestock makes household members easily obtain meat and other dairy products or sell them to the market to purchase other foods. In contrast, distance from market place was negatively associated with household HHDDS. This result is in agreement with the study reported from Yayu, Southwest Ethiopia. 22
Strength and Limitation of the Study
The strength of the study was data gathered from participants who were directly involved in food preparation for household members and its primary data, which increased the completeness and consistency of the data. In terms of limitations, the cross-sectional design nature of this study does not confirm a definitive cause-and-effect relationship, and bias may be introduced during interviews.
Conclusions
The prevalence of adequate dietary diversity among households was low in the study area. The majority of households have inadequate dietary diversity p (<7 food groups). The mean (±SD) DDS was 5.12 (±1.6). The food groups most consumed in the study area were cereals/grains (96.4%), condiments and beverages (84.3%, 467), and milk and milk products (80%, 443). Bank AOR, livestock ownership and sex of household head were positively associated with dietary diversity, whereas distance to market was negatively associated with adequate DDS. Interventions targeting the improvement of household accounts should be considered for rural residents of Gomole district. An agriculture office should encourage the community to practice livestock rearing. Further studies using two or more round seasonal surveys should be conducted to evaluate the effects on dietary diversity.
Footnotes
Acknowledgements
We would like to express our deepest gratitude to Bule Hora University, College of Health and Medical Sciences, for giving us the chance to prepare this research. Our earnest gratitude goes to the data collectors, supervisors and study participants. Finally, our heartfelt thanks to Gomole district administration office for allowed us to collect data from households.
Authors’ Contributions
All authors made a significant contribution in the conception, study design, execution, acquisition of data, analysis and interpretation, or in all these areas; took part in drafting, revising or critically reviewing the article; gave final approval of the version to be published; have agreed on the journal to which the article has been submitted; and agree to be accountable for all aspects of the work.
Availability of Data and Materials
Data essential for the conclusion are included in this manuscript. Additional data can be obtained from the corresponding author upon reasonable request.
Declaration of Conflicting Interests
The author(s) declared no potential conflicts of interest with respect to the research, authorship, and/or publication of this article.
Ethics Approval and Consent to Participate
Ethical approval for the study was received from the Bule Hora University institutional review board (Approval number: BHU/IRB/124/12). The letter of endorsement was taken to the Gomole District administration office. The district’s administration office wrote a letter of cooperation to all kebeles who participated in the study. Then, household informed consent was obtained from both respondents and the household head. Finally, the data were collected after confidentiality was guaranteed and written consent was obtained from each study participant. All the study participants were encouraged to participate in the study, and at the same time, they were also told that they had the right not to participate. They were also informed that the participation was fully voluntarily, the confidentiality of the collected data and their right to refuse the participation fully or partially.
Funding
The author(s) disclosed receipt of the following financial support for the research, authorship, and/or publication of this article: This work was supported by the BHU: Bule Hora University funded the research with award number PRD/124/12. The funders had no role in the study design, data collection and analysis, decision to publish, or preparation of the manuscript.