
Abstract
Background:
Specialty care access is increasingly constrained due to increasing demand for specialty care. Although much attention has been placed on the initial referral decision, much less is known about follow-up visit patterns. We examined the patterns of follow-up visits for new patients to a university-based cardiology practice and identified independent predictors of follow-up visits.
Methods:
This is a retrospective cohort study of new patient visits using electronic medical record data. The primary outcome was a follow-up visit.
Results:
Substantial variation in practice patterns by provider persisted after accounting for patient and disease factors. Most follow-up care was concentrated in a small population of patients.
Conclusion:
Specialty care follow-up visits may represent a significant opportunity for standardization and quality improvement, and further studies are warranted to understand follow-up visits in specialty care.
Implications:
Better understanding of between-provider differences could identify ways to reduce unnecessary follow-up visits.
Level of Evidence:
Single-institution study.
Introduction
Specialty care access is increasingly constrained due to increasing demand for specialty care—driven in part by an aging population and the increase in rates of comorbidities such as obesity and diabetes. Over the past 10 years, specialty care referral rates have increased to 100%, 1 whereas the supply of specialists has only increased to 20%. 2 Average wait times to see a specialist exceed 2 to 3 weeks in most metropolitan areas, resulting in patient dissatisfaction and complications from delayed care. 3 Efforts are underway to help address this demand–supply mismatch—such as the Patient-Centered Medical Home Neighborhood led by the American College of Physicians. Strategies focus on improving primary care–specialty care communication and coordination with the goal of reducing unnecessary specialty care referrals, optimizing the “prereferral workup” prior to the specialty care visit, and facilitating the return to primary care management after receiving specialty care input.
Although much attention has been placed on the initial referral decision, much less is known about follow-up visit patterns. Follow-up visits for established patients are a major component of ambulatory specialty care, comprising approximately 80% of total visit volume and 80% of total visit time to specialty care in a national survey. 2 There is a paucity of guidelines or recommendations for follow-up visit rates for common outpatient conditions, 4 and little is known about optimal visit frequency. The goal of this study is to examine the patterns of follow-up visits for new patients to a university-based cardiology practice across patient and provider factors and to identify factors most strongly associated with follow-up visit rates.
Methods
This is a retrospective cohort study of new patients seen in an urban university-based cardiology practice from July 1, 2011, to April 30, 2015. Data were extracted from the Epic Systems, Inc. (Verona, Wisconsin) electronic medical record (EMR) database. Patients were included if they had a new patient visit to a physician or nurse practitioner (NP) during this time period. All data were deidentified, and Committee on Human Research (CHR) was not required because this project was not classified as human subjects research.
The primary outcome was a follow-up visit to a physician or NP after a new patient visit. Visits for procedures (eg, catheterization) and tests (eg, exercise stress test) were excluded as follow-up visits in order to measure office-based encounters. Visits were further verified with a clinic administrator to ensure that visits counted as follow-up were not for procedures or tests. Visits were coded as “new patient” or “follow-up” in the EMR.
Predictor variables included patient, provider, and system-level factors. Patient factors included age, gender, race, and diagnosis, which were obtained from the EMR. Provider factors included provider gender and type (NP or doctor of medicine). System factors included health insurance and whether the patient received primary care within the same system. Insurance was obtained from the EMR. Primary care location was within the same system if the patient was listed as a member of a primary care physician’s panel. This factor was included because most referrals to this cardiology clinic came from community-based clinicians rather than from clinicians working within the same academic medical system. Although cardiologists could communicate through the EMR with primary care providers working within the same academic system, there was no such communication mechanism from patients referred from community practices. This academic medical center is not affiliated with any community hospitals, and any tests and procedures ordered by cardiologists would be performed at centers affiliated with the medical center. Providers with low new patient volume (<100 new patients over a 3-year period) were excluded to improve reliability of point estimates and to increase generalizability.
The primary diagnosis was obtained from the patient’s initial visit to the cardiology department. Only 1 primary diagnosis can be indicated of all diagnosis fields. Ten thousand six hundred forty-two (90%) of 11 893 patients had a primary diagnosis code listed. Ten thousand four hundred sixty (88%) of the 11 893 codes in the first diagnosis field were also the patient’s primary diagnosis. A total of 10 103 patients had complete primary diagnosis information listed. The primary diagnosis was categorized into 15 groups based on International Classification of Diseases, Ninth Revision (ICD-9) codes: atrial fibrillation or atrial flutter (427.31 and 427.32), other dysrhythmia (426-426.9, 427-427.9, 780.09, 780.2, 785-785.1, 794.31-794.39, and 996.01-996.04), cardiomyopathy (425.1-425.9 and 429-429.9), heart failure (428.0-428.9), hypertension (401-401.9, 402.9, and 796.2), congenital heart diseases (745-745.9, 746.01-746.9, 747.1-747.6, and 759.82-759.89), lipid disorders (272-272.9), coronary artery disease (410-410.9, 411.1, 412, 413.1-413.9, 414-414.9, and 786.5), pericardial disorders (420.9, 421, and 423.2-423.9), pulmonary vascular disease (415.19, 416-416.9, 786.05, and 786.09), valvular disease (424-424.9, 390, 394-394.9, 396.1, 396.3, 307, 398.9, and 785.2-785.9), vascular disease (362.3-362.35, 431-436, 438, 440-448, 453.4, and 453.9), other cardiac disorders (458-458.9, 459.9, 642.2-642.92, 648, 66814, 674.5, 996.61-996.83, and 997.1), preoperative evaluation (V72.81-V72.84), and noncardiac disorders (all other codes, excluding V codes).
Chart review was performed to assess the accuracy of ICD-9 codes listed as primary diagnosis in the EMR for true diagnosis as listed in the visit note. A random set of 100 new patient visits during June 2014 was selected, and the EMR diagnosis for each patient visit was extracted and categorized into 15 major categories. The physician’s notes were reviewed, and the visit diagnosis as indicated in the provider’s assessment was recorded and similarly categorized by a reviewer blinded to the EMR diagnosis. Concordance between the EMR diagnosis and the visit note diagnosis was calculated using κ, with a value of .51 (95% confidence interval: 0.48-0.54).
Survival analysis was performed to examine the time between the initial visit and the follow-up visit, with the advantage of allowing one to account for different observation periods following the first visit for each patient. We analyzed time to first follow-up visit as a representation of a clinician’s follow-up visit practices for new patients. We also analyzed third follow-up visit patterns as a representation of patients who will receive regular, ongoing follow-up within the specialty clinic. In bivariate analyses, the log-rank test was performed to test for statistical significance of differences in time to follow-up by patient, provider, and system variables. To account for the effect of case mix on follow-up practices, we performed an analysis on a subset of the 5 most common primary diagnoses: atrial fibrillation (427.31, n = 1239), palpitations (785.1, n = 797), unspecified chest pain (786.5, n = 787), essential hypertension (401.9, n = 651), and coronary atherosclerosis (414, n = 564). The top 10 clinicians by new patient volume for each diagnosis were included.
Cox proportional hazards regression analysis was performed to examine predictors of time to first follow-up, as well as time to third follow-up. In order to compare clinician behavior, a clinician with a clinical load similar to the practice average was chosen as the referent category. All analyses were conducted using Stata 13 (StataCorp, College Station, Texas).
Results
Study Sample
At this university-affiliated cardiology practice, there were 121 309 total patient encounters for 32 520 unique patients between July 1, 2011, to April 30, 2015, of which 55 184 encounters were office-based visits to a physician, NP, or physician assistant for 17 674 unique patients. These visits represented the care of 48 physicians, 4 NPs, and 1 physician assistant. Of the 17 674 unique patients with at least 1 office-based visit, 11 893 were new patients who had no previously recorded office visit to this cardiology clinic. The mean patient age was 55.7 years, 52% were male, 43.2% had private insurance, and 23% had a primary care provider within the same system. Among new patient visits, 10 103 had complete primary diagnosis information. The most common diagnosis category was dysrhythmia, including atrial fibrillation (37.8% of the diagnoses; Table 1).
New Patient Visits to Cardiology, July 1, 2011, to April 30, 2015.

Follow-Up Patterns
Overall, one-quarter (27%) of new patients returned for follow-up within 3 months and another quarter (24%) was seen for the first follow-up between 3 and 18 months (Figure 1A). A significant proportion of new patients (18%) had 3 or more follow-up visits over the 18-month period after their initial visit (Figure 1B), but these patients accounted for the majority (64%) of follow-up visit volume. About half (49%) of new patients had no follow-up at 18 months.
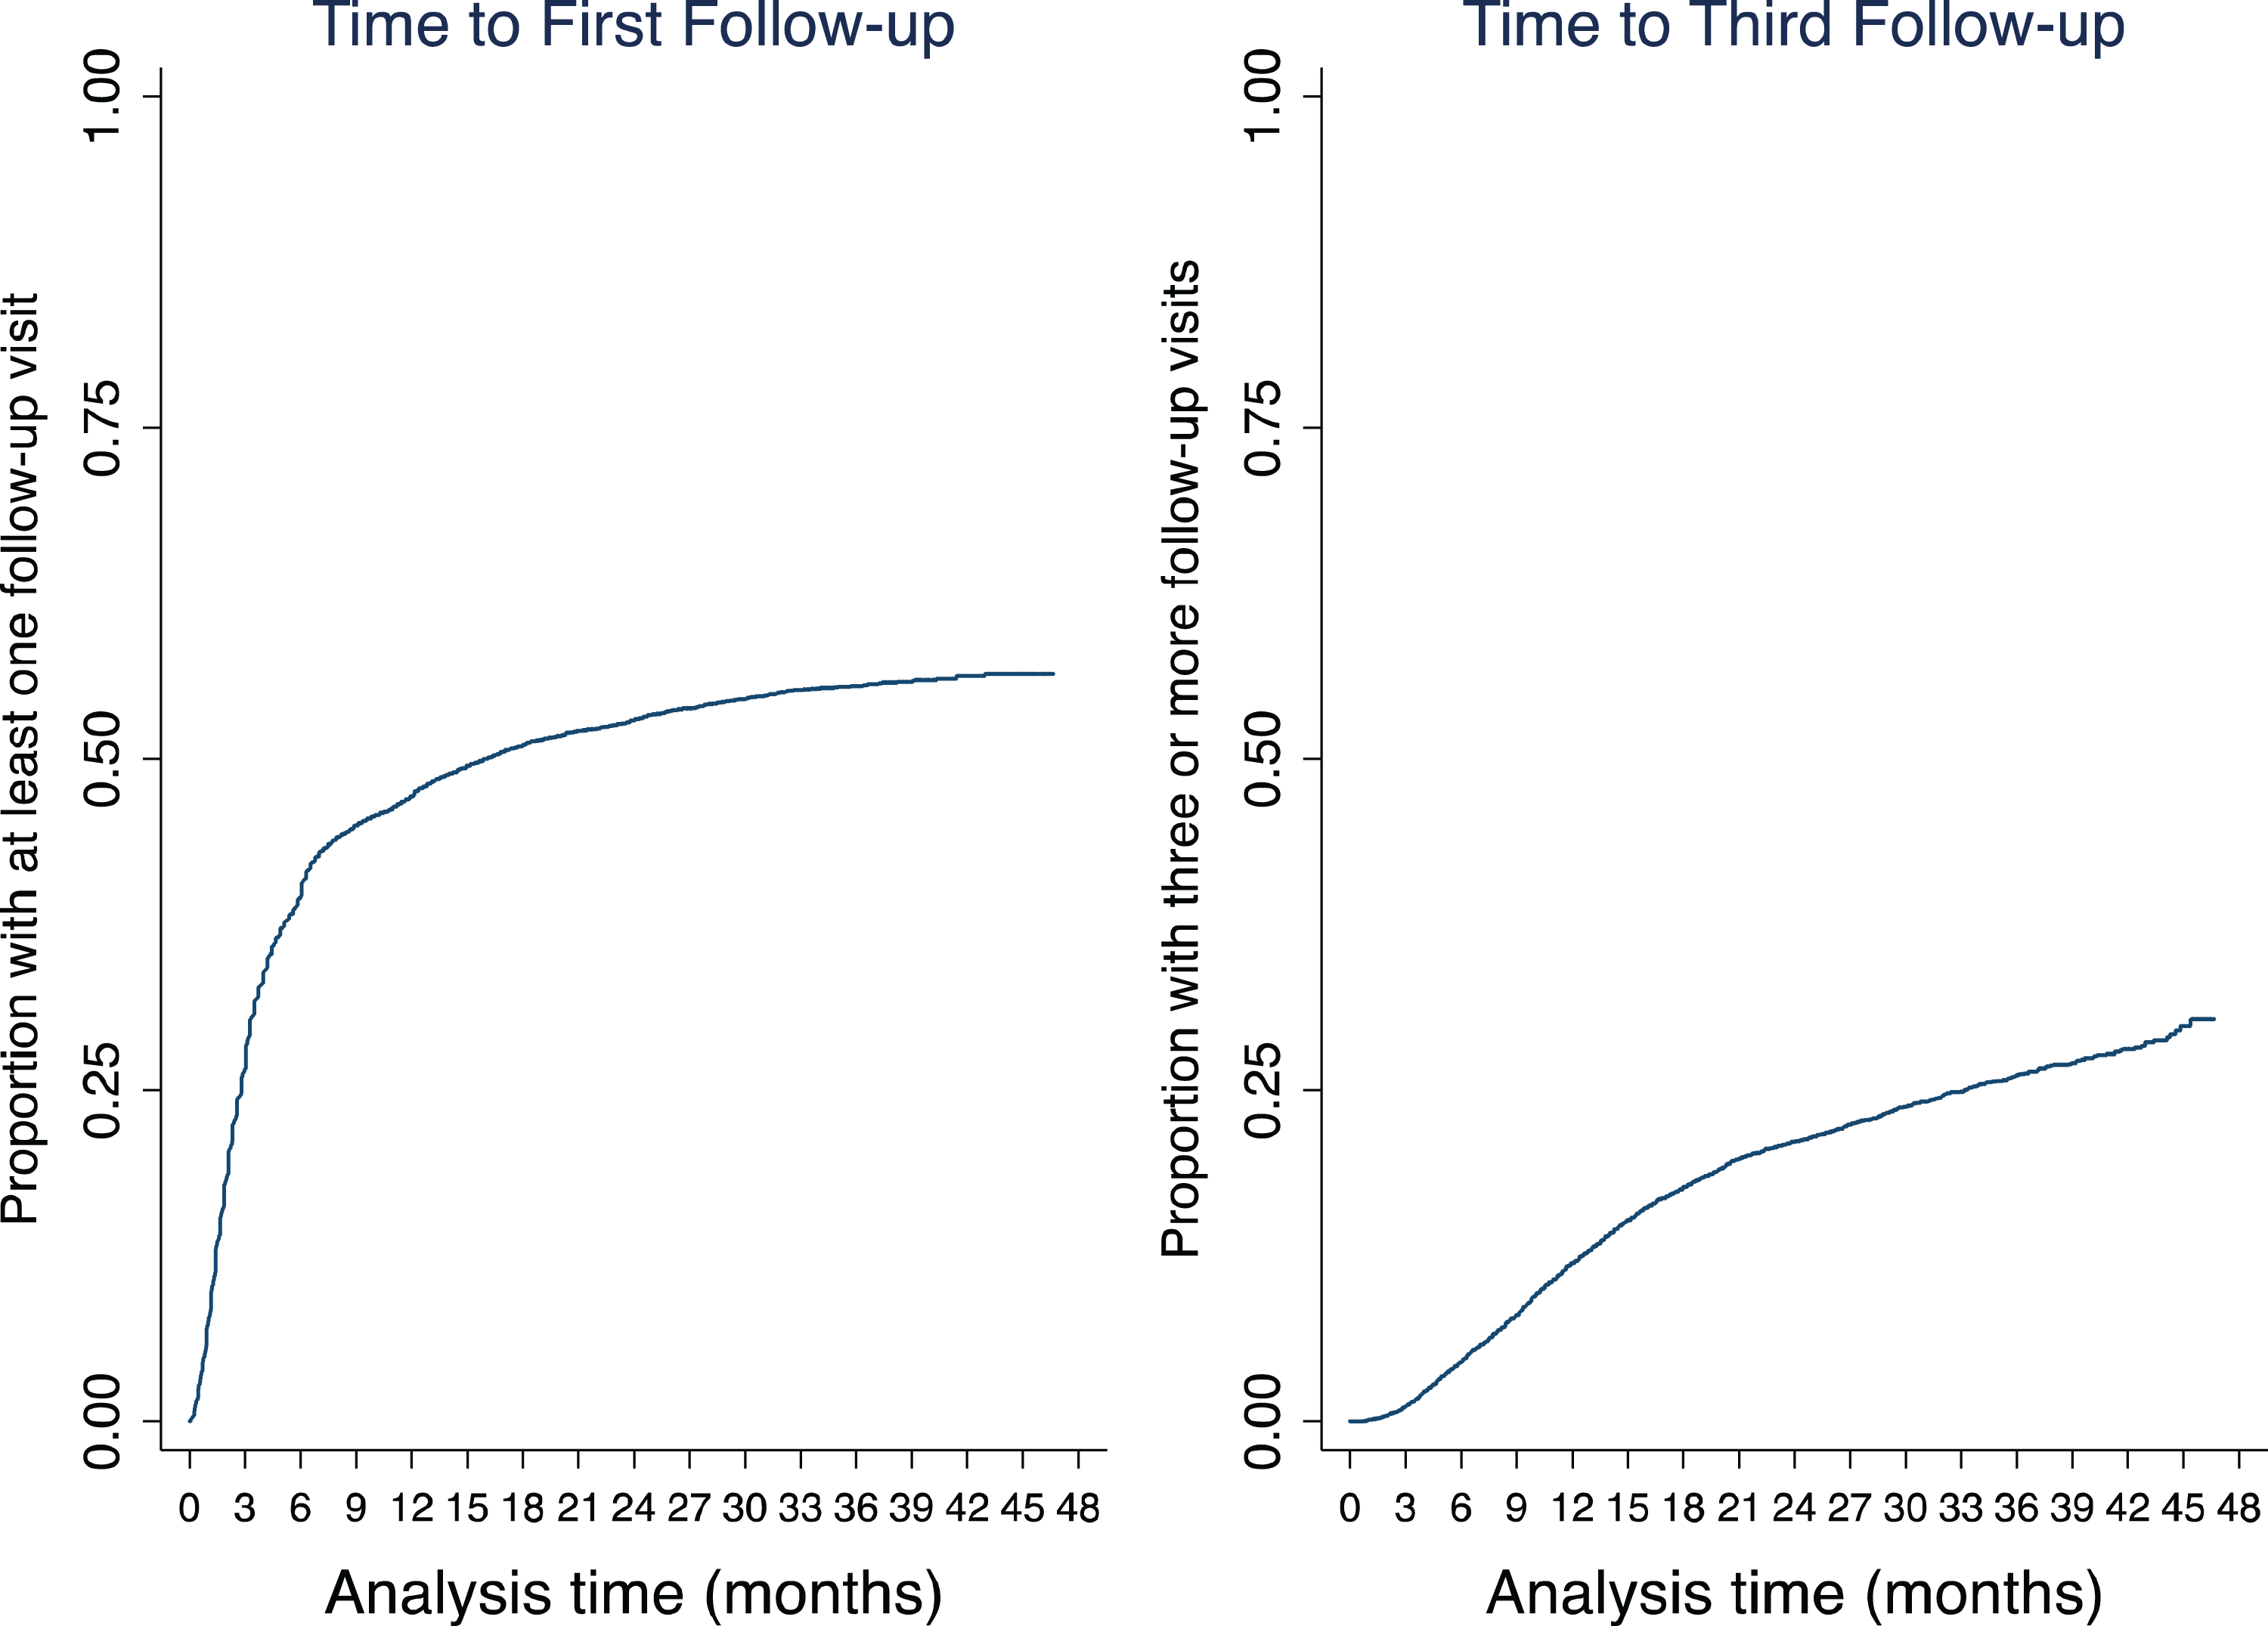
Follow-up patterns for new cardiology patients. A, Time to first follow-up. B, Time to third follow-up.
Follow-up patterns varied by diagnosis. There was a nearly 3-fold difference in the proportion of new patients with follow-up at 18 months comparing those with visits for preoperative evaluation (24%) compared with a diagnosis of atrial fibrillation (65%). High follow-up visit rates were also seen for heart failure (64%) and pulmonary vascular disease (59%; Figure 2A).

Patterns of follow-up for new cardiology patients by (A) diagnosis and (B) clinician.
Follow-up practices varied substantially between clinicians. There was a 4-fold difference in the proportion of new patients who returned within 18 months between providers with the lowest (17%) and the highest (70%) follow-up rates (Figure 2B). Some clinicians were 2 to 3 times as likely to see a patient in follow-up compared to their peers, whereas others were half as likely to see patients in follow-up (Table 2). Within a single diagnosis, the effect of clinician behavior remained evident: clinicians varied substantially in their tendency to have follow-up visits for chest pain and hypertension but less so in their management of atrial fibrillation (Figure 3).
Cox Proportional Hazards Regression of Time to Follow-Up.

Abbreviations: CAD, coronary artery disease; CI, confidence interval; FY, fiscal year; HR, hazard ratio; DD and EE, de-identified labels for individual clinicians (just like A and B).
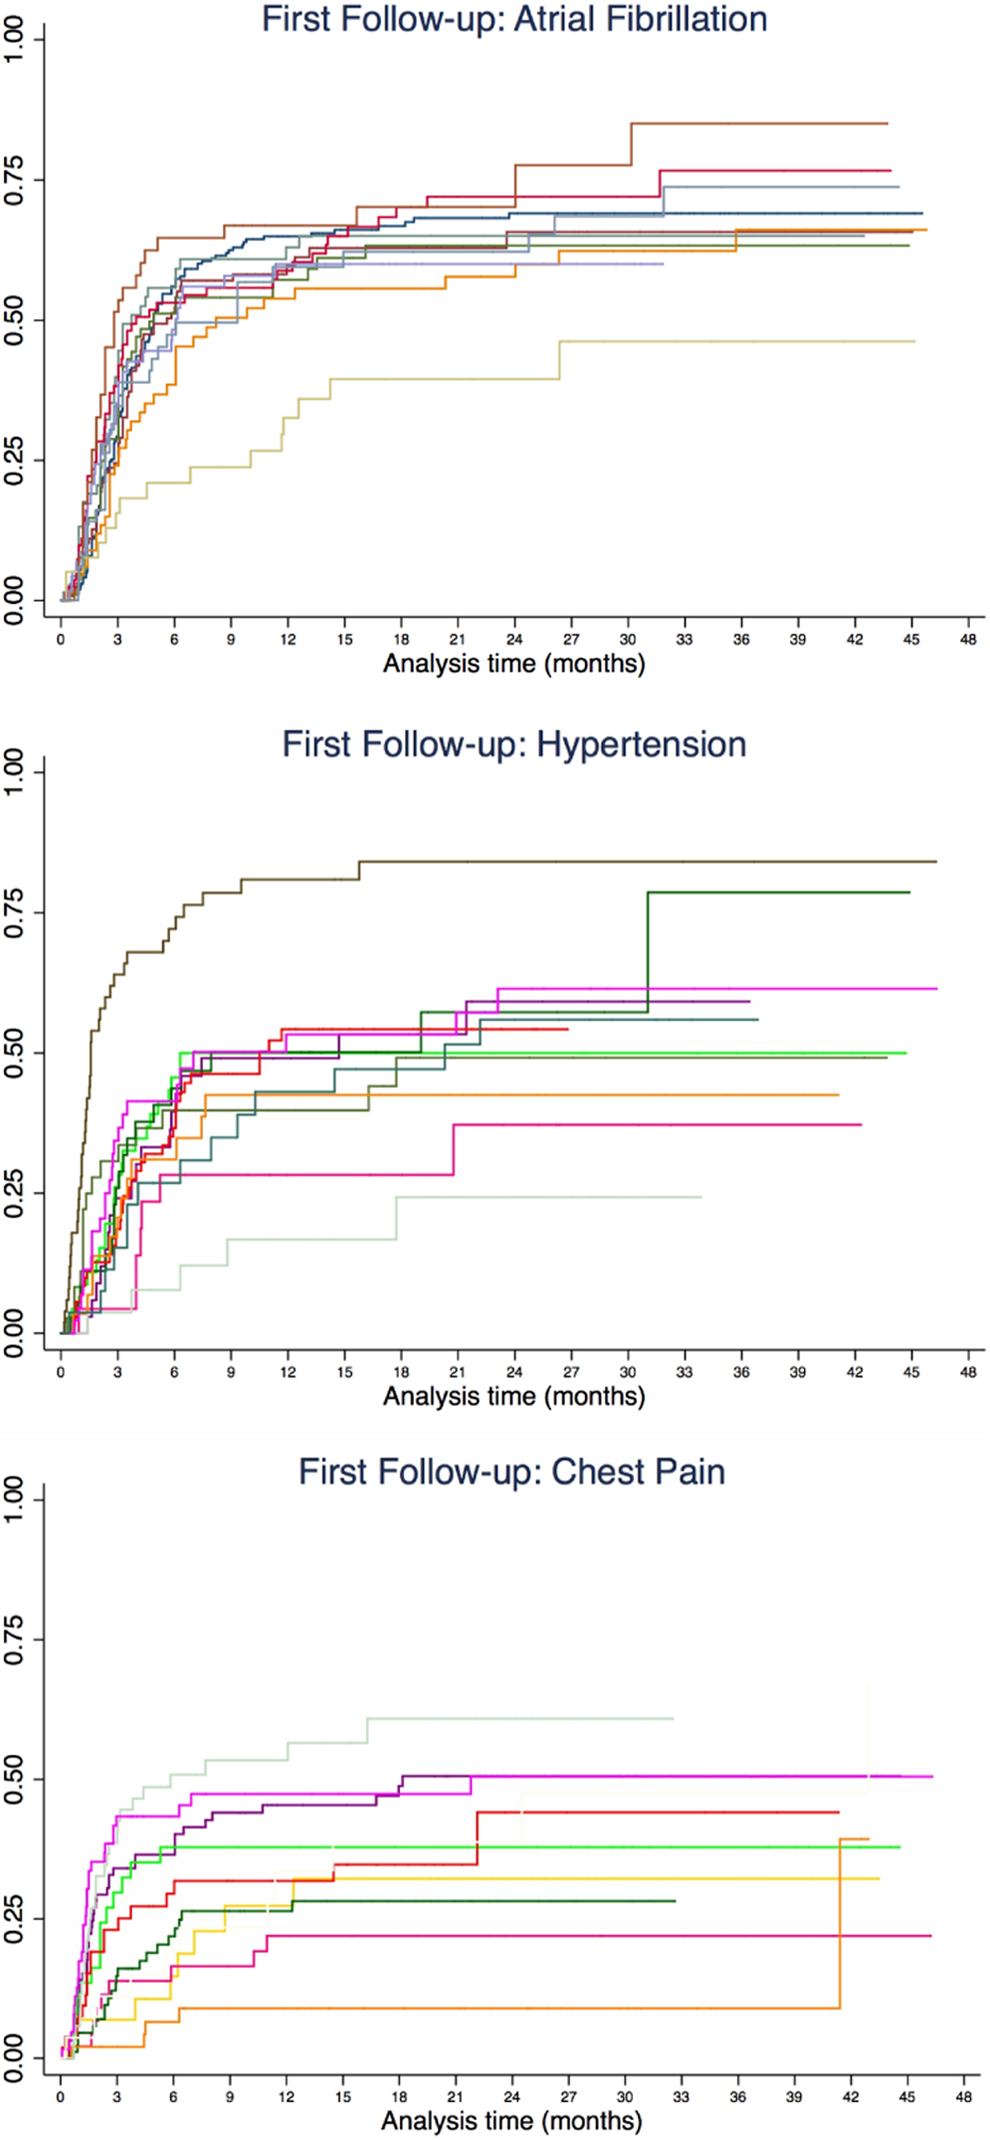
Clinician follow-up behavior for 3 common diagnoses: (A) atrial fibrillation, (B) hypertension, and (C) chest pain. The top 10 clinicians by volume in each diagnosis category were included in this graph.
Predictors of Follow-Up
Using a Cox proportional hazard model, diagnosis and clinician were the factors with the strongest association with follow-up visits. Patient factors independently associated with follow-up visits include age >65 years (hazard ratio [HR]: 1.21 [1.09-1.33] compared with age <50 years) and insurance type (Medicare patients: HR: 1.29 [1.15-1.44] compared with private insurance). The probability of follow-up decreased after fiscal year 2013 (FY13) and remained stable in the subsequent year (.75 in FY13 [.67-.83]. Among major diagnoses, atrial fibrillation (HR: 1.56 [1.38]) and congestive heart failure (HR: 1.50 [1.27-1.78]) had the strongest associations with follow-up compared with patients having coronary artery disease.
Overall, even after adjusting for the effect of diagnosis, patient gender, race, and insurance type in Cox proportional hazards regression, the influence of clinician behavior on follow-up visits remained significant. Likelihood of the first follow-up varied 7-fold across clinicians, with HR of follow-up ranging from 0.41 to 3.07 compared with a clinician with a clinical load similar to the practice average. Harrell C statistic for the full model for predictors of the first follow-up was 0.63, and the C statistic for the model including only clinician and diagnosis was 0.61. The relative contribution to explain the variance in follow-up visit patterns was greater for clinician than for diagnosis. The C statistic for a model with diagnosis alone was 0.56, whereas one with clinician alone was 0.59.
Discussion
This analysis of follow-up visit patterns at a university-based cardiology practice demonstrates significant variation between individual clinicians, which persists even after controlling for patient and disease factors. The clinician effect remained highly significant after adjustment for diagnosis, patient gender, race, and insurance type, suggesting that individual clinician practice style is more relevant than disease and patient factors in determining a patient’s follow-up visit pattern. Variation between clinicians is consistent with other studies utilizing survey-based designs 5,6 that have demonstrated the important role of physician beliefs on practice behavior. The results of this analysis cannot be used to make judgments about quality or appropriateness of the follow-up visit rates between providers. For example, the variation in follow-up visit practices may suggest that some clinicians are collaborating with referring physicians via e-mail, telephone, or in-person meetings, thus supporting ongoing management of the patient without additional visits. However, the other possibility is that some patients lack appropriate follow-up and experience poorly coordinated care.
Increased likelihood of follow-up for older patients and for atrial fibrillation and congestive heart failure is also consistent with the epidemiology and pathophysiology of these conditions. Half of the patients never returned for follow-up, which may reflect a combination of patient-driven behavior (cancellations or no-shows) and clinician behavior in terms of scheduling follow-up visits. Of the patients returning for follow-up, one-third had a follow-up visit every 6 months, and half were seen within 3 months of their initial visit. Clinician behavior and diagnosis were the greatest contributors to variation in follow-up patterns. However, the low Harrell C statistic indicates that the overall model was inadequate for discriminating patients who return compared to those who do not. Since this model includes many key clinical and sociodemographic variables known to influence health care utilization, the low Harrell C suggests that there are other, unmeasured “nonclinical” factors such as physician preference or patient expectations that are influencing the follow-up visit rate.
Several factors limit the interpretation of our findings. This is a single-site study at a clinic affiliated with an urban academic medical center, which may not be generalizable to all settings. For example, although cardiologists could communicate through the EMR with primary care providers working within the same academic system, there was no such communication mechanism from patients referred from community practices. Outside referrals comprised the majority of the clinic’s new patients. This fact may explain why the probability of follow-up was not significantly influenced by the location of the patient’s primary care clinic (used as a proxy for referral location); this factor was dropped from the final model. We only counted office-based encounters that generated a billing code and excluded visits that were exclusively for tests and procedures. However, tests and procedures are still part of a physician’s management plan for a patient and contribute to the utilization of health care resources. Furthermore, the medical center has outpatient diagnostic testing and imaging facilities but is not affiliated with community hospitals, and any additional follow-up testing done at an outside institution would not be captured in the electronic record. By only counting visits that generated a billing code, we excluded patients who were lost to follow-up due to cancellations or no-shows. This may not fully represent a clinician’s scheduling practice.
The significant heterogeneity in follow-up visit rates by individual clinicians and for specific diagnoses suggests an opportunity to improve quality of care for patients and to reduce unnecessary demand for specialty care visits. For example, creating incentives and mechanisms to facilitate increased specialty–primary care communication could improve continuity of care and increase access to in-person visits for the patients who need it most. To advance this field, we need an outcome measure of specialty referral to help determine when the goals and objectives of the referral have been met. Should this be decided by the primary care physician, the specialty physician, or both? And what role do patients and payers play in deciding about ongoing specialty care? Engaging these many stakeholders can help us improve access and quality of specialty care for all patients.
Footnotes
Acknowledgments
The authors acknowledge the contributions of Michael Wang who assisted with data acquisition and Dr Niraj Sehgal, Dr Rajni Rao, and Dr Jeffrey Olgin who provided guidance in developing the analysis and offered critical review of the manuscript. No compensation was received for such contributions.
Declaration of Conflicting Interests
The author(s) declared no potential conflicts of interest with respect to the research, authorship, and/or publication of this article.
Funding
The author(s) disclosed receipt of the following financial support for the research and/or authorship of this article: Caterina Yuan Liu was a recipient of the Clinical and Translational Research Fellowship, a program of UCSF’s Clinical and Translational Science Institute (CTSI) NCATS/NIH/UCSF-CTSI Grant Number TL1 TR000144.