
Abstract
Introduction/Objectives
Identification of groups of patients following similar trajectories of time-varying patient characteristics are often of considerable clinical value. This study provides an example of how the identification of trajectory groups of patients can be useful.
Methods
Using clinical and administrative data of a prospective cohort study aiming to improve the secondary prevention of osteoporosis-related fractures with a Fracture Liaison Service (FLS), trajectory groups for visit compliance over time (2-year follow-up) were predicted using group-based trajectory modeling. Predictors of trajectory groups were identified using multinomial logistic regressions.
Results
Among 532 participants (86% women, mean age 63 years), three trajectories were identified and interpreted as high followers, intermediate followers, and low followers. The predicted probability for group-membership was: 48.4% high followers, 28.1% intermediate followers, 23.5% low followers. A lower femoral bone mineral density and polypharmacy were predictors of being in the high followers compared to the low followers group; predictors for being in the intermediate followers group were polypharmacy and referral to a bone specialist at baseline.
Conclusions
Results provided information on visit compliance patterns and predictors for the patients undergoing the intervention. This information has important implications when implementing such health services and determining their effectiveness.
Introduction
Osteoporosis-related fractures are a significant public health problem because of their high prevalence and their harmful consequences.1,2 Numerous studies have shown that secondary fracture prevention (SFP) programs, such as Fracture Liaison Services (FLSs), improved fragility fracture management.3–6 These results led to worldwide enthusiasm to implement SFP programs in a real-world setting.7,8 However, several key components need to be considered for them to achieve optimal effectiveness.
In longitudinal studies, when subgroups of individuals follow heterogeneous patterns through time, performing analyses, known as trajectory modeling, can help describe varying patient evolution patterns according to the chosen clinical characteristic. 9 Trajectories are modeled using different statistical methods.9–11 Group-based trajectory modeling (GBTM), a specialized application of finite-mixture modeling introduced by Nagin (1999 ; 2005), 12 has been shown to have a robust capacity for the identification of trajectory groups that inform clinical practices. 9 Because trajectory modeling in non-behavioural epidemiological studies is relatively new, sharing the background information on the modeling of the present trajectory groups is deemed of scientific interest for other health services science projects.
We aimed to identify different visit compliance patterns using trajectory modeling and the identification of trajectory groups, over the two-year systematic follow-up of fragility fracture patients in a FLS. Our secondary objective was to identify predictors for belonging to one trajectory group or another.
Methods
Study Setting
This prospective longitudinal cohort study used data from patients systematically followed in the Lucky BoneTM FLS. From 2010 to 2013, women and men, 40 years of age or older, joined the FLS because of a fragility fracture. Patients with a fracture of the skull, face, hand, foot or patella were excluded. Outpatient orthopedic clinics from two hospitals were involved in this multidisciplinary study with a two-year follow-up. Patients were investigated for skeletal fragility with bone mineral density (BMD), biochemistry testing, as well as chart interviews. Based on these interviews, a 10-year fracture risk estimate for major and hip fractures (FRAX®) was determined. 13 When appropriate, a prescription for an osteoporosis preventive agent and calcium/vitamin D supplements was given. Participants could also be referred to a bone specialist at baseline. Thereafter, visits were scheduled at 3, 6, 12, 18 and 24 months after baseline. Detailed protocol and baseline characteristics of the cohort have been the subject of another publication. 14 The study was approved by the CIUSSS Nord-de-l’Île de Montréal ethics research committee and by the Commission d’Accès à l’Information du Québec. Enrolled patients provided signed informed consent.
Data Sources
Data on follow-up compliance and baseline patient characteristics were prospectively collected by FLS personnel. Clinical data was drawn from either patient interviews, medical files, or clinical reports (radiology, blood tests, pharmacy lists). Medical services and hospitalizations for citizens with public coverage were retrieved from a provincial administrative database (Régie de l’Assurance Maladie du Québec [RAMQ] and MED-ECHO). These tools provided information on diagnostics, procedures, dates, inpatient stays, in-hospital acts and date of death, among others. Diagnostics were coded according to the ninth revision of the International Classification of Diseases (ICD-9) for medical services. The ICD-9 up to March 31st, 2006, ICD's 10th revision (ICD-10) upon first April, 2006 were used to classify diagnostics during hospital stays. The combination of ICD codes and procedures was previously found to be sensitive for the identification of fracture injuries (85%). 15
Longitudinal Assessment
Follow-up compliance consisted of a time-dependant binary variable, where patients attending a follow-up visit were categorized as present (1) and those missing a visit as absent (0), for all time points (3, 6, 12, 18, 24 months). This repeated measurement was used to assess the longitudinal differential pattern of follow-up visit compliance using trajectory modeling.
Covariates
Clinical co-variables measured at baseline or during a retrospective period included: age, sex, BMD (from radiologist reports), body mass index (kg/m2), previous exposure to anti-osteoporosis therapy before the incident fracture (yes/no), prior fracture history before the incident fracture (yes/no), the number of co-medications (patient-reported or pharmacy list), the incident fracture type (major or other), referral to a specialist at baseline (yes/no), current smoking (yes/no), and the FRAX® risk assessment tool major and hip fracture risks. 13 BMD was collected as a T-score, which was defined as the number of standard deviations from normal BMD for a young healthy adult at the lumbar spine and the femoral neck using Dual-energy x-ray Absorptiometry (DXA). The World Health Organization's definition of osteoporosis for BMD was used. 16 Incident fracture sites were categorized as major (hip, spine, proximal humerus, wrist) and other (all other fracture sites). 17
Administrative data was available for up to 5 years before baseline and used to measure the Charlson comorbidity index (CCI), which was sub-categorized (0, ≥1, ≥2, ≥3).18–20 Several comorbidities were also measured using ICD-9, and 10 codes to measure medical history: ICD-9 733.0/ ICD-10 M8 1, M82 for osteoporosis, ICD-9 401/ ICD-10 I10 for hypertension, ICD-9 250/ ICD-10 E10-E14 for diabetes, ICD-9 243, 244/ ICD-10 E00.9, E01.8, E03.2, E03.8 to 9, E89.0 for hypothyroidism, ICD-9 272/ ICD-10 E78 for dyslipidemia, ICD-9 530, 578/ ICD-10 K2 0-K23, K92.0 to 2 for esophageal or gastroprotection related diseases, ICD-9 555, 556, 558, 564.1/ ICD-10 K5 0, K51, K52, K58 for abdominal inflammatory diseases.
Data Analysis
Follow-up compliance trajectories were modeled using GBTM, a semiparametric method for repeated measurements to identify the probability of belonging to a group (unknown number of groups, ≥2) defined by their estimated trajectory based on within-individual variability. 10 This model predicted trajectory groups using all available longitudinal data, assuming it is missing at random. It was also possible to derive forms of the trajectories, and to assign each subject to a trajectory group through a multi-step approach. First, the number of trajectories was identified to maximize the Bayesian Information Criterion (BIC), with the constraint that probability of group membership ≥5%. Two to five group models were estimated with all trajectories modeled as cubic functions of time. Second, the cubic trajectory for each group was trimmed (quadratic or linear functions of time) so that the highest order term was statistically significant at the 0.05 level. Finally, according to the selected model, subjects were assigned to a group based on the maximum posterior probability assignment rule, which measures the likelihood that an individual belongs to a trajectory group based on a particular behavioural pattern. 21 Therefore, these groups were labeled according to their qualitative nature. To assess accuracy of the selected model, three diagnostic methods were used; (1) the average posterior probability of assignment had to be at least 0.7, (2) the odds of correct classification had to be above 5.0, and (3) the estimated group probabilities had to be similar to the proportion of the sample assigned to the groups.10,21 GBTM was computed using SAS macro PROC TRAJ and a binary logit distribution.21,22
Baseline characteristics of trajectory groups were presented as means with standard deviations for normally distributed characteristics, or as medians with interquartile ranges for skewed distribution. Characteristic of trajectory groups were compared using Chi-square tests for categorical variables, and Student's t tests or Wilcoxon-Mann-Whitney tests for continuous variables. Crude and adjusted multinomial logistic regressions were performed to identify the predictors of trajectories according to patients’ baseline characteristics. The adjusted regression analysis included statistically significant variables from univariate analyses, but also those judged as clinically relevant. Multiple imputation was performed to account for missing data with regression analyses (PROC MI and PROC MIANALYZE). 23
All analyses were performed using Statistical Analysis System (SAS) Software 9.4 (SAS Institute, Cary, NC) and a P value ≤.05 was deemed significant.
Results
The cohort consisted in 532 women and men with a fragility fracture. Mean age was 63.4 years (±11.2) and almost 86% was female. 14
Identification of Trajectory Groups
The model identification process is depicted in Figure 1. The BIC was maximized with a three-trajectory model (−1549.42), all with cubic trajectories. The polynomial trimming process for the three-group model resulted in two linear and one cubic trajectories (BIC: −1541.41). Figure 2 displays the actual (solid lines) and predicted values (largely dotted lines) of each of the trajectories, which were labeled high followers (HF), intermediate followers (IF), and low followers (LF). Also, shown are 95% confidence intervals for the predicted values (small dotted lines), which show good model fit from their narrowness. Two-hundred and sixty patients were assigned to the HF group (48.9%), 110 to the IF group (20.7%) and 162 to the LF group (30.4%) based on the maximum posterior probability assignment rule. Diagnostic methods confirmed model accuracy; all average posterior probability of assignment were above 0.7, the odds of correct classification were all above 5.0, and estimated group probabilities were similar to the proportion of the sample assigned to the groups, although there was a slight discrepancy between IF and LF trajectory groups (0.7 and 0.6).

Flow diagram of the steps to identify trajectory groups using group-based trajectory modeling and assess model accuracy. Abbreviations: (BIC) Bayesian Information Criterion, (FLS) Fracture Liaison Service, (traj.) trajectories. *Proportions of individual membership assignment based on the maximum posterior probability assignment rule. For steps 1 and 2, the smallest BIC indicates best model fit for the identification of the number of trajectory groups (3 groups) as well as their forms (linear, cubic, linear). In step 3, the average posterior probabilities above 0.7, the odds of correct classification above 5.0, and the similarity between the probabilities of group membership and group classifications suggest good model accuracy.

Trajectory curves of visit compliance during a 2-year follow-up in a FLS. Abbreviations: (GBTM) group-based trajectory modeling. Solid lines represent the group-membership individual estimation based on the maximum posterior probability assignment rule. Largely dotted lines represent group-membership probabilities estimated with GBTM. Small dotted lines represent confidence intervals (95%) for group-membership probabilities. Proportions associated to each trajectory curve indicate the distribution probability of group membership for the study cohort.
Trajectory Groups Characteristics
Table 1 reports the difference between participant baseline characteristics across trajectory group. Most patients were female (>85%) and mean age was similar between groups (62-64 years). Patients in the HF group had more osteopenia and osteoporosis than those in the IF and LF groups according to the femoral BMD results. HF and IF patients were more treatment-experienced and had more polypharmacy than LF patients. IF patients were more often referred to a bone specialist than patients from other trajectory groups and HF patients had more hypothyroidism than LF patients.
FLS Patients’ Baseline Characteristics According to the Three Trajectories for the Entire Cohort.
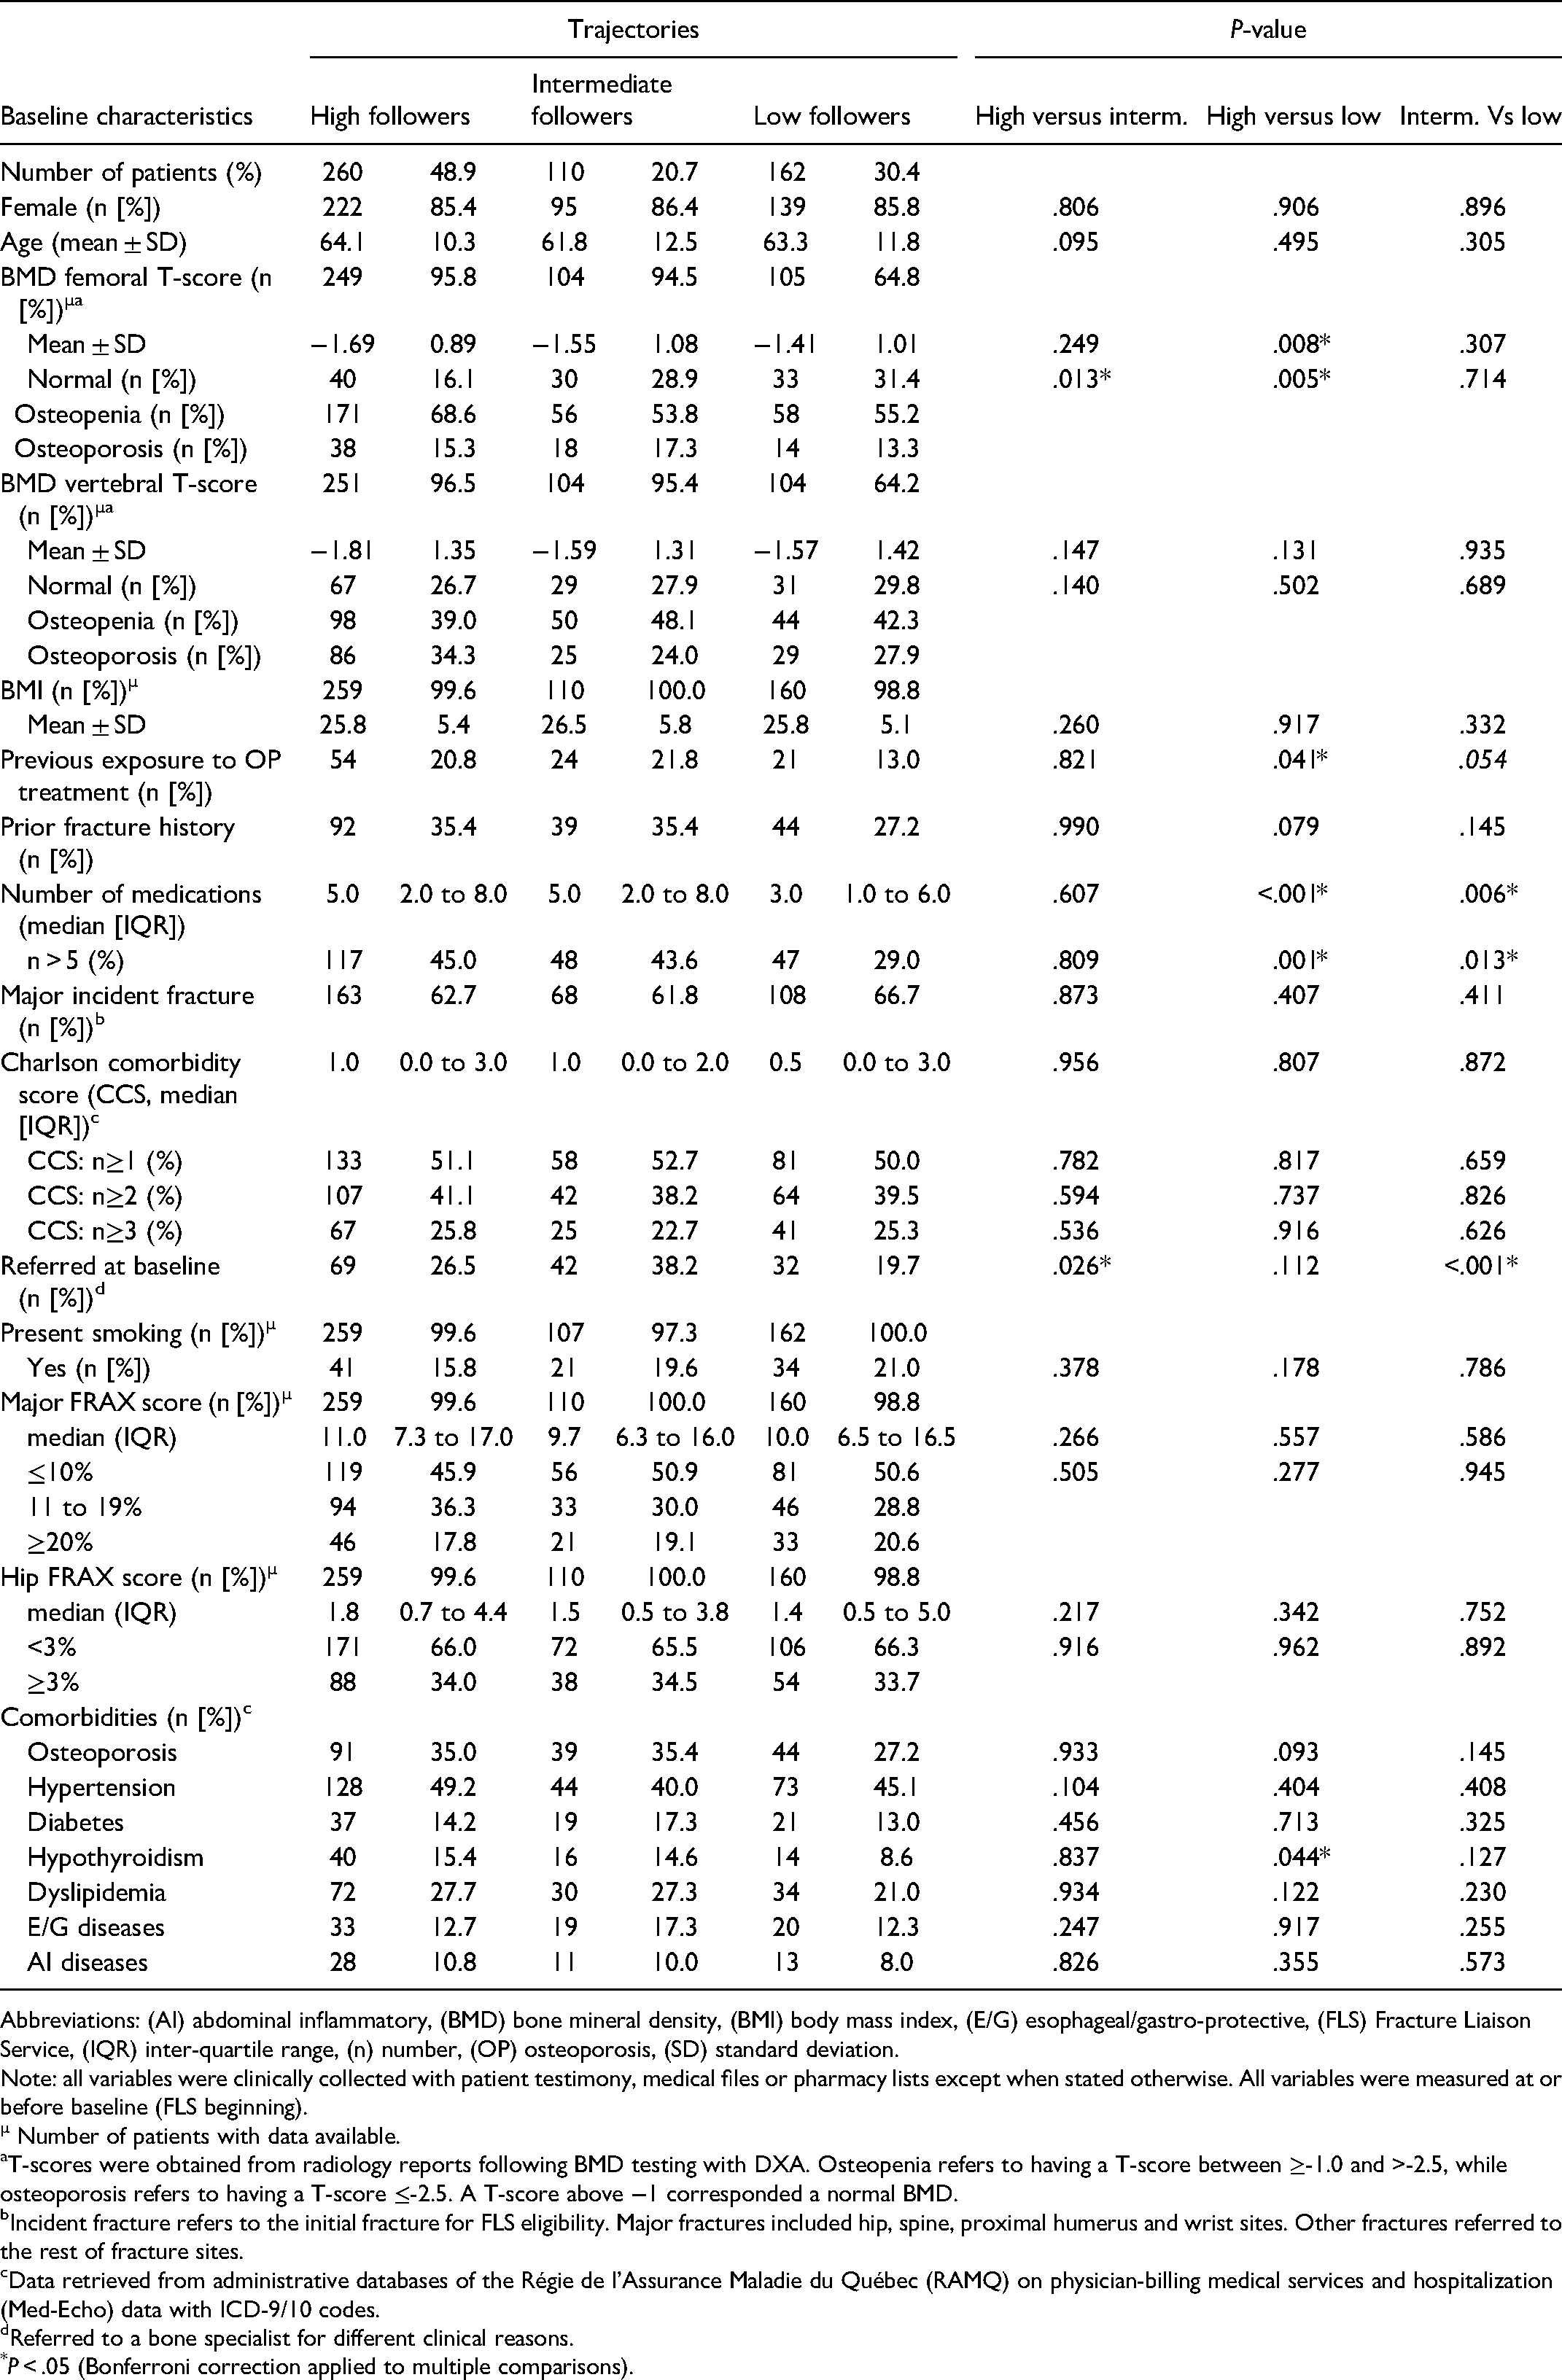
Abbreviations: (AI) abdominal inflammatory, (BMD) bone mineral density, (BMI) body mass index, (E/G) esophageal/gastro-protective, (FLS) Fracture Liaison Service, (IQR) inter-quartile range, (n) number, (OP) osteoporosis, (SD) standard deviation.
Note: all variables were clinically collected with patient testimony, medical files or pharmacy lists except when stated otherwise. All variables were measured at or before baseline (FLS beginning).
µ Number of patients with data available.
T-scores were obtained from radiology reports following BMD testing with DXA. Osteopenia refers to having a T-score between ≥-1.0 and >-2.5, while osteoporosis refers to having a T-score ≤-2.5. A T-score above −1 corresponded a normal BMD.
Incident fracture refers to the initial fracture for FLS eligibility. Major fractures included hip, spine, proximal humerus and wrist sites. Other fractures referred to the rest of fracture sites.
Data retrieved from administrative databases of the Régie de l’Assurance Maladie du Québec (RAMQ) on physician-billing medical services and hospitalization (Med-Echo) data with ICD-9/10 codes.
Referred to a bone specialist for different clinical reasons.
*P < .05 (Bonferroni correction applied to multiple comparisons).
Predictors of Trajectory Groups
Results for predictors are presented in Table 2. When modeling the LF group as reference, having osteopenia compared to a normal BMD (aOR = 2.85, 95%CI 1.60-5.06) and polypharmacy (aOR = 2.26, 95%CI 1.39-3.66) were significant predictors of being in the HF group. Using the same reference group (LF), polypharmacy (OR = 2.14, 95%CI 1.19-3.86) and being referred to a bone specialist at baseline (OR = 1.98, 95%CI 1.01-3.89) were significant predictors of being in the IF trajectory group.
Results of Multinomial Logistic Regressions Used to Estimate the Probability of Membership to Trajectory Groups.
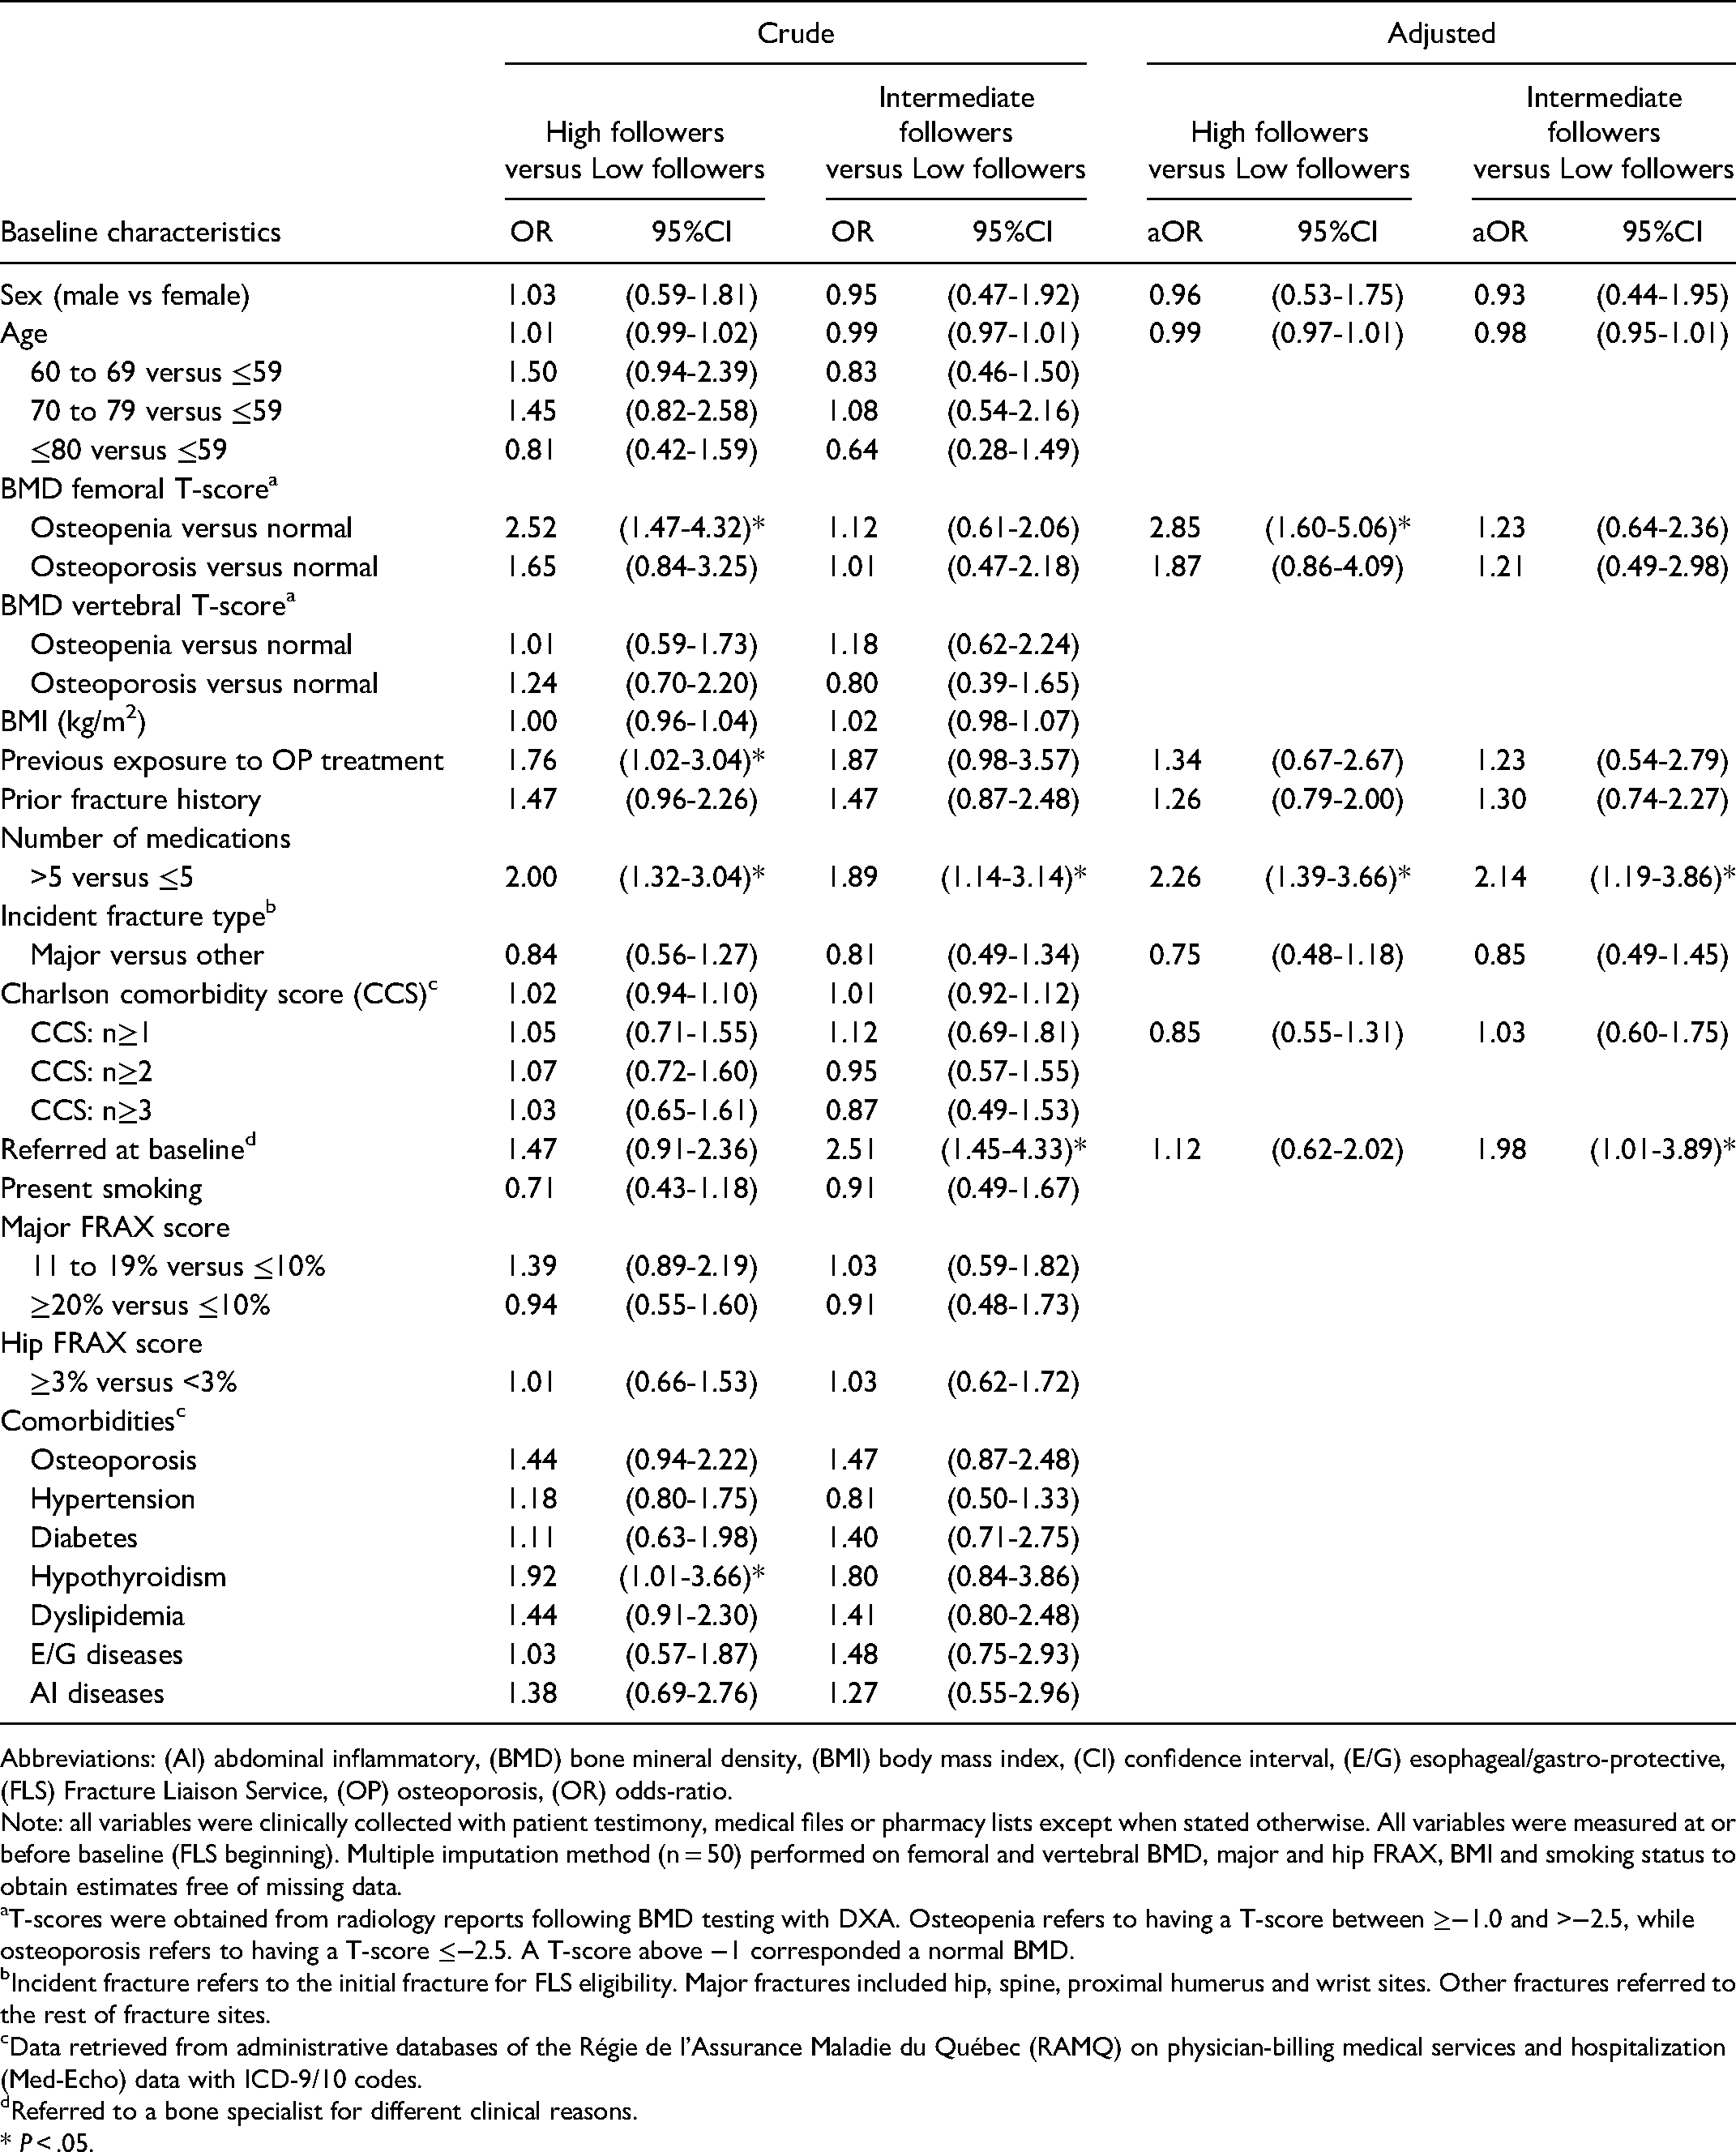
Abbreviations: (AI) abdominal inflammatory, (BMD) bone mineral density, (BMI) body mass index, (CI) confidence interval, (E/G) esophageal/gastro-protective, (FLS) Fracture Liaison Service, (OP) osteoporosis, (OR) odds-ratio.
Note: all variables were clinically collected with patient testimony, medical files or pharmacy lists except when stated otherwise. All variables were measured at or before baseline (FLS beginning). Multiple imputation method (n = 50) performed on femoral and vertebral BMD, major and hip FRAX, BMI and smoking status to obtain estimates free of missing data.
T-scores were obtained from radiology reports following BMD testing with DXA. Osteopenia refers to having a T-score between ≥−1.0 and >−2.5, while osteoporosis refers to having a T-score ≤−2.5. A T-score above −1 corresponded a normal BMD.
Incident fracture refers to the initial fracture for FLS eligibility. Major fractures included hip, spine, proximal humerus and wrist sites. Other fractures referred to the rest of fracture sites.
Data retrieved from administrative databases of the Régie de l’Assurance Maladie du Québec (RAMQ) on physician-billing medical services and hospitalization (Med-Echo) data with ICD-9/10 codes.
Referred to a bone specialist for different clinical reasons.
* P < .05.
Discussion
To the best of our knowledge, this is the first study to apply GBTM in the context of osteoporosis-related fracture prevention and FLSs. The use of GBTM in epidemiological research setting is also relatively new, as this method is more commonly used in social, criminal and psychological research. 24 With a two-year systematic follow-up intervention, three groups of follow-up compliance trajectories were identified. Almost half the patients had a high follow-up pattern in time, while the remaining of the cohort had an intermediate or low follow-up pattern. Regarding the predictors of belonging to a trajectory group, a lower femoral bone mineral density as well as polypharmacy were predictors of being in the high followers compared to the low followers group. Predictors for being in the intermediate followers group were polypharmacy and referral to a bone specialist at baseline.
The aims of this research were to inform on the clinical aspects of follow-up compliance and its determinants for the implementation of SFP programs, but also to provide an applied example of GBTM in health services research. Trajectory modeling could be applied to most studies with repeated measurements, which is often seen in epidemiological research with outcomes such as questionnaire monitoring, medication adherence or health services with innovative healthcare interventions.
Osteopenia was identified as a predictor for being in the HF trajectory group, illustrating how BMD results factor in the decisional process and behaviour of fragility fracture patients. Sustaining a prior fragility event did not seem to have the same impact, although sustaining a fragility fracture is, in itself, a strong predictor of having another event later on. 25 Furthermore, the FRAX risk assessment tool was not a significant predictor for a trajectory group when it came to follow-up compliance either. This means that the prediction of fracture risk was not significantly different among patients. It can also suggest that patients consider BMD results more than FRAX risks regarding their level of care. This may impact actual clinical practice because BMD test results carry a lot of weight when deciding to involve a patient into routine care, even knowing that fragility fractures can occur independently of bone density. 26 It would be interesting to use qualitative methods of research to better understand this patient-centered outcome.
Polypharmacy was a predictor for being in the HF and the IF trajectory groups. A potential explanation for this is that these patients had health conditions necessitating continuous medical attention over time, or that they were more health-conscious and prone to use the dedicated medical services offered by the program. Yeam et al. (2018) identified predictors of adherence to osteoporosis medication, where polypharmacy was associated with less optimal drug use in osteoporosis patients. 27 The referral to a bone specialist at baseline as a predictor for the IF trajectory group is also noteworthy. The decrease in follow-up visit compliance seen in IF patients can probably be attributed to the care provided following referral. This suggests that although they did not use the FLS as much as the HFs, they probably received adequate fracture management over time.
A strength of this study is associated with its presentation of a novel analysis not yet found in the literature on secondary osteoporosis fracture prevention; the identification of trajectory groups illustrating patients’ behaviours in terms of follow-up compliance to care over time. This methodology could help find new investigation pathways, target a subgroup of at-risk patients, improve clinical approaches and perfect current interventions. It is also of interest because of the insights it may provide on the reasons for patients lost to follow-up. 10
A limitation of this study was the missed data of a few baseline variables (∼5% for most variables), especially BMD (5% for HF and IF, 35% for LF), used to identify predictors of belonging to a trajectory group (Table 1). If the missed BMD data is associated with follow-up compliance, there is a possibility for attrition bias. However, the mean femoral BMD T-score of the HF group being statistically significantly lower than that of the IF and LF groups, the association between lower follow-up compliance and lower fracture risk seems plausible. This supports the association between high fracture risk and high follow-up compliance. Moreover, multiple imputation was used to correct for missing data when computing logistic regressions to identify predictors. GBTM remains a statistical model based on data from a study group. Therefore, behaviors at a larger population-level might lead to different findings because of external factors such as varying healthcare settings. This analysis was restricted to a population from one province in Canada with a two-year systematic follow-up intervention, thus potentially limiting the generalizability of results.
In summary, this study's main objective was to use trajectory analysis to identify different groups of fragility fracture patients in a SFP program, according to systematic follow-up visit compliance. Findings led us to conclude that three groups of follow-up pattern can be predicted in this type of service. Additionally, results show that half the FLS patients will have an intermediate or low follow-up compliance pattern. The use of qualitative patient-centered methods might be necessary to investigate patients’ behaviours regarding follow-up visits’ attendance in the context of secondary prevention where subsequent fragility fracture risk is increased. Trajectory modeling made it possible to gather valuable information regarding the implementation of a FLS with a systematic follow-up. Therefore, this type of modeling represents an important asset for researchers in health services science.
All procedures performed in this study involving human participants were in accordance with the ethical standards of the CIUSSS Nord de l’Ile de Montréal ethic research committee and with the 1964 Helsinki declaration and its later amendments or comparable ethical standards.
Supplemental Material
sj-docx-1-hme-10.1177_23333928211047024 - Supplemental material for Trajectories of Follow-up Compliance in a Fracture Liaison Service and Their Predictors: A Longitudinal Group-Based Trajectory Analysis
Supplemental material, sj-docx-1-hme-10.1177_23333928211047024 for Trajectories of Follow-up Compliance in a Fracture Liaison Service and Their Predictors: A Longitudinal Group-Based Trajectory Analysis by Andréa Senay, Julio C Fernandes, Josée Delisle, Suzanne N Morin, Daniel Nagin and Sylvie Perreault in Health Services Research and Managerial Epidemiology
Footnotes
Acknowledgments
The authors would like to thank participants, orthopedic clinics’ staff and research assistants involved in this study. The authors also thank the Régie de l’assurance maladie du Québec for their help with administrative data. A very special thanks to Andreea Banica, BScN, the research clinical nurse for this study, and Kathleen Beaumont for her assistance in reviewing this manuscript.
Availability of Data
The datasets generated and/or analysed during the current study are not publicly available by the Quebec Act respecting Access to documents held by public bodies and the Protection of personal information.
Declaration of Conflicting Interests
AS, DN and SP declare that they have no competing interests. JD reports support for personal fees from Amgen Canada and Eli Lilly outside of the conducted work. SNM reports research grants from Amgen Canada outside of the conducted work. JCF reports grants from Eli Lilly during the conduct of this study, and grants from Baxter outside of the conducted work.
Funding
This study was funded by orthopedic funds from the Hôpital du Sacré-Coeur de Montréal research center in Montréal, Canada, and grants from Eli Lilly Canada for study design and clinical data collection. The Sanofi Canada Chair of drug usage and the Réseau Québécois de Recherche sur les Médicaments (RQRM) financed obtaining provincial administrative data. AS received a doctoral training award from the Fonds de Recherche du Québec - Santé (FRQS) to finance analysis, interpretation and writing of the manuscript.
Supplemental material
Supplemental material for this article is available online.
References
Supplementary Material
Please find the following supplemental material available below.
For Open Access articles published under a Creative Commons License, all supplemental material carries the same license as the article it is associated with.
For non-Open Access articles published, all supplemental material carries a non-exclusive license, and permission requests for re-use of supplemental material or any part of supplemental material shall be sent directly to the copyright owner as specified in the copyright notice associated with the article.