
Abstract
Short, targeted interim assessments termed “benchmark modules” or “modular benchmarks” may hold promise for supporting teacher instruction and student learning throughout the year. This study describes one state’s adoption of benchmark modules, examines when and how frequently teachers choose to incorporate the modules into their instruction, and uses a series of fixed effects regressions to estimate the effect of completing benchmark modules on end-of-year learning outcomes for students. Results indicate that most teachers choose to use the modules only prior to the summative state assessment, resulting in a negligible effect on end-of-year student scores. However, in classes where benchmark modules are assigned regularly throughout the year students score higher on the end-of-year state exam relative to similar peers. Whether the observed difference in scores results from feedback provided to students, from instructional changes teachers make based on the results of the benchmark modules, or from practice effects, is discussed.
Keywords
Good teaching is characterized by the consistent exchange of information between student and teacher (Black & Wiliam, 1998; National Research Council, 2001). Teachers structure learning experiences for students and then collect data to infer student progress toward the learning goal. However, not all data are equally useful, and increasing the quantity of data may not help teachers improve their instruction (Shepard, 2008). Classroom assessments are still the primary assessment data that teachers use to inform instructional decisions (Farley-Ripple & Buttram, 2014; Jennings, 2022). State and district leaders, however, may suggest that thoughtfully designed interim assessments could supplement classroom assessments. Such assessments could serve the dual purpose of supporting teacher decision-making while building coherence between classroom instruction and end-of-year state assessment.
In this article I empirically address the question of whether a subset of instructionally focused interim assessments called benchmark modules do, in fact, support student learning. Given that districts and states are making large investments in interim assessment products (Topol et al., 2013) and almost every district in the United States uses some form of interim assessment (Woo & Diliberti, 2023), a better understanding of the relationship between these tools and student performance is of critical importance. Interim assessments are “medium-scale” assessments situated between classroom assessment and end-of-year summative testing that evaluate student knowledge and skills relative to a learning goal, and can be aggregated across students, occasions, or concepts (Perie et al., 2009). Early versions of these assessments were most frequently district or vendor created, given in regular increments during instruction, and covered content across multiple curricular units. The theory underlying interim assessment use is that standards-aligned information provided periodically throughout the school year can help teachers make better instructional decisions, thus improving student outcomes (Datnow et al., 2007; Marsh et al., 2006). However, since the mid-2010s, only vendor-sponsored studies have investigated whether teacher use of current forms of interim assessment improve student outcomes. Earlier studies published by external researchers have found small or inconsistent positive effects (Carlson et al., 2011; Konstantopoulos et al., 2013, 2017; Slavin et al., 2013), or null effects on student academic outcomes (Henderson et al., 2008; Konstantopoulos et al., 2016; Quint et al., 2008). A lack of integration into school curricula (Goertz et al., 2009; Shepard, 2008), the provision of information at too large a grain size to be useful for diagnosing student misconceptions (Goertz et al., 2009; Shepard, 2008), and long timescales for sharing results with teachers (Farley-Ripple & Buttram, 2014), have all been suggested as reasons for why teachers are not able to convert the information provided by interim assessments into meaningful gains in student achievement.
The development of benchmark module assessments can be viewed as a partial response to these criticisms. Benchmark modules are a subset of interim assessments that are shorter in length, focus on only a few content standards, and therefore can be more flexibly embedded into a teacher’s regular instruction. They are generally administered through an online assessment platform, allowing teachers to receive almost immediate feedback on student performance. Evans and Marion (2024) differentiate between these short-form benchmark modules (also called modular interims (Demonstrated Success, 2022), interim blocks (Smarter Balanced, 2022) or testlets (Accessible Teaching, Learning, and Assessment Systems [ATLAS], n.d.) and longer-form “mini-summative” interim assessments which assess items across multiple curricular units. They suggest that benchmark modules might be better suited (although not necessarily ideally designed) for classroom instructional purposes, but that there is a lack of research indicating whether this assumption holds in practice.
Despite minimal research on benchmark module use, states are increasingly adopting benchmark modules into their suite of state assessments (Killbride et al., 2022; New Hampshire Education Department, n.d.). Offering state-provided interim assessments may be seen as a relatively low-cost way to provide teachers with standardized instructional materials in a system that has traditionally been loosely coupled between policy and classroom practice (Mehta, 2013; Meyer & Rowan, 1977), since districts generally select the curricula used in schools. States may also intend to support teacher instruction by providing a balanced system of assessments that align to their state standards (National Research Council, 2001). In the absence of state provided materials, many districts pay for expensive vendor-created systems that claim to provide information to educators that will “inform their most impactful decisions about student learning” (Northwest Evaluation Assosciation, n.d., sec. 2, para. 1), or guide them with “actionable recommendations and high-quality tools” (Renaissance Learning, Inc., n.d., sec. 2, para. 1). District and school leaders are often left to determine whether the vendor-offered assessment options will live up to their promises of supporting teaching and learning. Providing similar interim assessments at the state level could free up funds for districts to spend on programs and training elsewhere, while ensuring coherence between the interim assessments being used in classrooms and the assessed standards on the end-of-year state test. Therefore, evaluating the extent to which benchmark modules are commonly used and whether they support student performance in practice, has wide-reaching implications for policy, assessment, and classroom practice.
In this study I describe when and how frequently teachers used benchmark modules throughout the state of Utah, and whether such use improves student performance on the end of year state summative assessment. Results from this analysis suggest that most teachers in Utah either assign benchmark modules only at the end of the year or not at all. In classes where teachers assign benchmark modules at the end of the year, there is a small, positive effect on student scores compared to students in classes where no benchmark modules are assigned. However, the estimated effect is slightly larger for a small set of students in classes where benchmark modules are assigned multiple times throughout the calendar year. In the discussion of these findings, I consider whether the observed effects are likely a result of a practice effect, whether they represent an improvement in teaching and learning, or whether they may be a mixture of both.
Literature
The current popularity of interim assessments in education is perhaps unsurprising. As Shepard (2010) described, many districts and schools adopted interim assessments in the wake of the federal 2002 No Child Left Behind Act in an attempt to gather data and raise test scores. Concurrently, scholars increasingly emphasized the importance of developing balanced systems of assessment that prioritized comprehensiveness, coherence, and continuity across state, district, and classroom assessments (National Research Council, 2001). Many districts and states responded to these calls by adopting interim assessments to track student progress during the year. Benchmark modules are one iteration of interim assessment on which, to date, there has been no formal research.
Perie et al. (2009) distinguish between three intended uses of interim assessments: predictive, evaluative, and instructional. Predictive assessments should help teachers evaluate student progress in relation to their likely performance on the end-of-year assessment. Evaluative assessments are intended to serve program evaluation roles at the grade, school, or district level to understand how students are progressing. Instructionally designed interim assessments should provide feedback to students and teachers in the moment about how to better reach a stated learning target (Evans & Marion, 2024). Interim assessments that are intended to serve an instructional purpose may require different sources of validity evidence than interim assessments that serve a purely predictive or evaluative role. Therefore, identifying the mechanism through which a specific assessment supports teachers and students is essential for evaluating whether the assessment achieves its intended purpose. Benchmark modules are intended to serve an instructional purpose, and therefore should be evaluated based on the extent to which they support instruction and student learning in practice.
The following section focuses on the possible mechanisms through which using interim assessments could serve an instructional goal and correspondingly support student performance on end-of-year assessments. I organize the research into three groups: (a) assessment used to provide feedback to students about how to improve, (b) assessment used to provide feedback to the teacher about how to adjust instruction, and (c) assessment that results in a practice effect generated by familiarity with the test format. The three mechanisms are used to contextualize findings from this study to consider the extent to which benchmark modules are achieving their goal of supporting instruction and student learning.
Assessment Mechanisms That May Support Student Performance
Feedback for students
Research has consistently suggested that providing students with detailed feedback on their progress supports their attainment of learning goals (Black & Wiliam, 1998; Hattie & Timperley, 2007; Kluger & DeNisi, 1996). Hattie and Timperley’s (2007) review of meta-analyses on student-focused feedback indicates that the average effect size of providing students with feedback ranged between 0.12 and 1.24 standard deviations, depending on the type and form of feedback. Lower effect sizes were related to praise, rewards, and punishment, while the highest effect sizes were observed when students received information about a task and how to do it more effectively (Hattie & Timperley, 2007). However, not all feedback is constructive. Feedback that only indicates “correct/ incorrect” or orients students towards concern about their ability may be associated with null or negative effects on learning (Bangert-Drowns et al., 1991; Deci et al., 1999). While the effects of providing feedback on student learning are often cited as positive, Bennett (2011) points out that there is wide variability in effect sizes depending on the form of feedback, and that simply providing feedback does not necessarily mean it is interpreted and acted on in a way that will support improvement in learning. Therefore, any feedback interventions should be clear about the intended mechanisms through which they expect feedback to work.
Instructional change
A commonly proposed use of interim assessment is that teachers will use the information generated by the assessment to support decision-making about subsequent content and pacing. Fuchs and Fuchs (1986) reviewed 21 studies that evaluated the effects of providing feedback to teachers on student performance (as opposed to feedback to students about their own performance). They found that these feedback interventions had an average effect size of 0.7 on student performance and were strongest when teachers were provided with explicit information on how to interpret and respond to the data. Examples include a teacher focused feedback program called Curriculum Based Measurement (CBM), which used regular outcome-based progress monitoring to support teacher decision-making (Stecker et al., 2005). However, Stecker et al. (2005) concluded that CBM progress monitoring alone did not affect student achievement, but that gains in student performance were observed when teachers made instructional adjustments using the provided information.
Data-based decision making (DBDM) developed from a similar theory of action, which proposes that teachers will modify their instruction based on assessment results to better support students in achieving a learning goal (Datnow et al., 2007). Some reviews of DBDM programs have found positive effects on student achievement, such as an average effect size of 0.24 in improved reading fluency for struggling readers compared to a control group (Filderman et al., 2018), and 0.38 on various researcher developed pre-post assessments for students with intensive learning needs (Jung et al., 2018). While meta-analytic studies have found positive results of DBDM interventions, others have pointed out that these results often occur in lab-controlled or researcher controlled settings, and they may not generalize to regular education contexts (Gesel et al., 2021; Shepard et al., 2017).
Test practice effects
A final mechanism through which interim assessments may increase student test scores is through a practice effect. A practice effect is observed when students raise their score from one testing occasion to the next (Hausknecht et al., 2007). Such an effect could be considered desirable if the change in score is due to learning that occurs as a result of the first test occasion. If, however, the change in score occurs because of familiarity with the test or test format that is not attributed to changes in underlying ability, then the effect may be a source of construct irrelevant variance (Haladyna & Downing, 2004; Koretz, 2017). Kulik and colleagues’ (1984) meta-analysis on practice effects reported that, across studies, students who took a practice exam scored significantly higher than students who did not have a practice opportunity. The authors found that the size of the effect was higher when students took an identical form (average effect size of 0.42) compared to a parallel form of the same test (average effect size of 0.23). In addition, they found that students scored higher with multiple practice tests, and that high-ability students benefited more from taking a practice exam than low-ability students did. In a more recent meta-analysis, Hausknecht et al. (2007) found a remarkably similar average effect size of 0.46 for identical practice and 0.24 for practice with an alternate or parallel form.
Effects of Providing Interim Assessments on Student Learning
Whether the implementation of an interim assessment program leads to increases in student achievement—the stated goal of such programs—is unclear. The results from randomized controlled trials which assigned schools or districts to use interim assessments have reported mixed estimates of the effect on student achievement. For example, two studies evaluating a single quarterly benchmark intervention estimated inconsistent effects on math and reading scores ranging from non-significant to 0.49 standard deviations, grade and subject dependent, making an effect difficult to generalize (Carlson et al., 2011; Slavin et al., 2013). In a study of NWEA’s MAP computer adaptive benchmark program, no significant difference in student reading scores was found between students in schools assigned to treatment (Cordray et al., 2012). In Indiana, Konstantopoulos et al. (2013, 2016, 2017) evaluated the impact of a staged randomized control trial that assigned schools to use a system of quarterly interim assessments in grades K–8 reading and math. While the authors estimated significant effects in the first cohort of about 0.30 standard deviations for treatment schools in Grades 5 and 6 math, and a smaller effect in Grades 3 and 4 reading (Konstantopoulos et al., 2013), effects did not replicate for the second cohort (Konstantopoulos et al., 2016).
Quasi-experimental studies have also evaluated whether there are differences in end-of-year student performance in schools using interim assessments. A 2008 report by Quint et al. evaluated a reading benchmark intervention in forth and fifth grade Boston Public Schools, finding no significant effects from using the interim assessment on end-of-year reading scores in either grade. A similarly timed Massachusetts pilot program (Henderson et al., 2007, 2008) evaluated the 1- and 2-year effects from implementing a quarterly benchmark assessment in eighth grade mathematics, also finding no statistically significant difference in end-of-year math scores between treatment and comparison schools. However, studies on the effects of interim assessments have been based on mini-summative versions of interim assessment. No studies have evaluated whether shorter, more flexible benchmark module style interim assessments may better support student learning.
Research Questions
Understanding how assessment tools could support student learning is essential for implementing an assessment system that supports teachers and students. Research on assessment suggests three mechanisms, outlined above, through which using interim assessments may increase student scores. Providing feedback to students and teachers is most consistent with the intended use of the modules, since a practice effect may not represent authentic improvements in student understanding. Therefore, the following analysis investigates whether teacher use of benchmark modules likely aligns with one or multiple of the mechanisms, by answering the following research questions:
When and how often do Utah teachers use benchmark modules in their instruction?
Does completing benchmark modules have an effect on student end-of-year summative state scores?
How does timing and frequency of benchmark module completion differentially affect student state summative scores?
Utah Benchmark Modules
Purpose
The Utah State Board of Education (USBE) began providing benchmark modules for instructional use in 2016. The modules are offered in Grades 3 to 8 in English language arts (ELA), math, and writing, and in Grades 4 to 8 for science. The state makes their use optional, although schools and districts may set their own policies around benchmark module use. USBE does not track which schools or districts use the modules, but they facilitated access for research purposes. The stated purpose of offering the modules is for teachers to use them to inform instruction and for students to set learning goals (Cambium Assessment, Inc., 2023). The state has referred to the modules as a productivity tool for teachers to understand how students are performing in relation to Utah’s state standards during the course of instruction (Cambium Assessment, Inc., 2023).
Design
The benchmark modules are developed in partnership with the assessment vendor who manages Utah’s end-of-year Readiness, Improvement, Success, Empowerment (RISE) exams. They range between five to 15 items and focus on a specific strand within the Utah Core Standards. Strands consist of small groups of one to five standards within the same domain. Benchmark modules are administered through the same online testing portal as the end-of-year summative assessments. Teachers may preview test items in a benchmark module before assigning it to the class. The assessments are secure but not confidential, therefore teachers are instructed that items should not be copied and distributed for practice outside the online system (Cambium Assessment, Inc., 2023).
Many of the benchmark modules have multiple forms. Each form covers similar content standard but includes different test items, providing the opportunity for teachers to assess students on the same standard at different points in the year. Items come from previously administered RISE assessments. Examples of item types include multiple choice, drag and drop, placing points or lines on a graph, entering text into a textbox or table, matching answers, or selecting a word or passage, among others.
Score Reporting
Student scores are accessed through the online RISE reporting system. Teachers can move between class level or student level information for each test item. At the class level they can see the average class score compared to the average of the school, the district, and the state. They can also see the number of students within each score designation, and filter by the five items that were the easiest and hardest for students to answer correctly. At the student level, teachers can see the number of items each student answered correctly out of the total number of test items, a students’ associated performance category for a given module, and students’ individual responses to each item.
Sharing Information
Once students complete a benchmark module in ELA, math, and science, students receive their raw score. Students do not have direct access to their item-by-item responses on the benchmark modules. Since the benchmark modules are secure and not public assessments, teachers must share student responses to test items securely. Teachers may display items that were on the benchmark as a whole class to review, but they may not print items or transfer items outside of the online assessment system.
Method
I use statewide assessment data to map the patterns and variation in benchmark module use by teachers across the state of Utah. Part 1 of the results provides a descriptive analysis of common patterns of benchmark module use focusing on two trends: trends over time and trends in the number of benchmark modules assigned. Part 2 estimates the effect of completing benchmark modules (defined three ways) on student end-of-year RISE scores.
Data
The data contain administrative information for all benchmark modules assigned in Utah between 2020–2021 and 2022–2023 in Grades 3 through 8. Each benchmark module observation contains a student ID, teacher ID, class ID and school ID, allowing student benchmark module results to be linked to end-of-year RISE scores. Additionally, each observation has the name of the module students took, the score they earned, and the corresponding performance level on the exam.
Unit of Analysis
Results are run at the student-year and class-year levels separately by subject. A class is defined as a single group of students who have the same teacher at the same time. I use class as a primary unit of analysis because teachers can have multiple classes of students for which they make different decisions about how many benchmark modules to administer. Results are run separately by subject since students in the same class may take a different number of benchmark modules in each subject. Finally, only grade-subject combinations in which students take an end-of-year RISE assessment are included in analysis. Subjects that do not have an attached end-of-year state assessment, such as social studies or art, are excluded.
Analytic Sample
After linking all benchmark module results to student end-of-year RISE scores, I retain only the observations for which a student has a corresponding end-of-year score in the same grade, subject, and class. Using this restriction, I exclude 3.8% of all benchmark module observations across the 3 years. In addition, students in a class with fewer than 10 students or more than 40 students are removed, excluding an additional 3.6% of benchmark module observations. The class size restriction is intended to ensure that only students in typically sized classrooms are included, as it could not be determined from the data why some students were in classes with only a few students (8% of all classes had only one student) or with many students (maximum class size was 811). I chose to restrict the data to classes between 10 and 40 students based on my knowledge of typical grade three to eight class sizes, with the understanding that this may remove classes in rural schools, some special education classes, or other alternative classes. The largest restriction comes from removing benchmark module observations that were not scored, about 25% of observations. A benchmark module might not be scored if a student mistakenly selects the wrong module, if they let the assessment time out, or if they do not compete the module. Benchmark modules that are not scored are not likely to be used by either the student or teacher for feedback, and thus do not represent cases of potential instructional use. See Appendix Table A1 for analytic restriction sample sizes.
The regression results include additional restrictions, since adding some covariates excludes some students. For example, adding a prior-year score restricts observations to school years 2021–2022 and 2022–2023, as 2020–2021 prior-year scores were not available due to the COVID-19 pandemic. For similar reasons, students in Grade 3 are excluded from regression estimates because that is the first year they take the state summative assessment. Finally, since writing is only tested in Grades 5 and 8, it is not possible to condition on a prior year score and is therefore excluded from the regression analysis.
Estimating the Effect of Benchmark Module Completion on End-of-Year Scores
Measures
RISE
The Readiness, Improvement, Success, Empowerment (RISE) exam is Utah’s end-of-year exam used for state accountability (Cambium Assessment, Inc., 2023). Utah administers end-of-year RISE assessments to all students in Grades 3 to 8 in ELA and math. Science is administered to students in Grades 4 to 8, and writing is administered in Grade 5 and Grade 8. The end-of-year RISE exam is a computer adaptive online assessment. Each exam is made up of a mix of item types including multiple choice, drag and drop, multi-choose, graphing, fill in a word of number, and select a word or passage, among others. End-of-year scores are reported as a scale score with a corresponding performance designation. Students are assigned one of four designations: below proficient, approaching proficient, proficient, or highly proficient. End-of-year RISE scale scores are standardized within grade, subject, and year.
Treatment variables
Three treatment variables explore how exposure to benchmark modules may be related to students’ end-of-year scores.
Zbinicpgsy is a binary variable where “1” indicates student i took at least one module in class c, with teacher p, grade g, school s, and year y in the designated subject, and “0” if they did not.
Zcounticpgsy identifies the number of benchmark modules that student i took in the designated subject.
Zprofilecpgsy, is coded as seven mutually exclusive binary variables where “1” indicates course c is coded into the associated profile for the designated subject, and “0” otherwise.
Zbin and Zcount are student level treatment variables, whereas Zprofile is a class level treatment that assumes that all students in the same class are exposed to teaching informed by a teacher’s use of the benchmark modules, regardless of whether they were present for all benchmark modules. Zprofile is an analytic variable I created based on observed patterns of benchmark modules use, as described in the following section. All models are run separately by subject, therefore subject subscripts are not included.
Regression modeling
I employ two models with varying covariates and fixed effects to estimate the effect of benchmark module use on end-of-year state summative assessment scores. I begin with the general model:

where EOY is the standardized end-of-year RISE score for student i in class c with teacher p in grade g in school s in year y. Z is one of the three treatment statuses defined earlier: at the student level for Zbin and Zcount, and at the class level for Zprofile. The vector of covariates
If highly skilled or trained teachers are also more likely to use benchmark modules in their instruction, such selection may represent a threat to the internal validity of the model. To minimize this potential threat, I specify an additional regression model using teacher fixed effects. This model replaces the school fixed effect for a teacher by school fixed effect,

A teacher by school fixed effect leverages variation between students who have the same teacher at the same school but who have different values of the treatment variable. For the class-level treatment, Zprofile, a teacher by school fixed effect compares students in different classes taught by the same teacher. The number of potential comparisons, however, decreases, since across the 2 years of included data a generalist elementary teachers will only have taught two classes. For student scores to be used in the estimation of the effect, a teacher must have varied in their module usage pattern or profile across classes. A teacher fixed effect in conjunction with teacher years of experience accounts for time-invariant changes in a teacher’s practice, minimizing the threat of selection bias due to better teachers choosing to use benchmark modules.
Creating Profiles of a Benchmark Module User
To characterize distinct patterns of benchmark module usage, I created seven profiles that describe the frequency and quantity of assigned benchmark modules within a class, by subject (written as class-subject). Heat maps, such as the one in Figure 1, helped visualize these patterns. Figure 1 displays the frequency and timing of benchmark module use for a subset of 50 third grade class-subjects in 2022–2023. The x-axis marks each week in the 2022–2023 school year, while the y-axis represents an individual class-subject. The darker pink boxes indicate that relatively more benchmark modules were assigned per student in the corresponding week.

Heat Map of Benchmark Modules Administered Per Student by 50 Class-Subjects, 2022/2023.
To create each pattern, I engaged in an iterative process of coding where I compared background understanding of interim assessment use to the patterns I observed in the data from looking at many iterations of the heat map above. As each new profile was hypothesized based on the data, I coded the corresponding rule and observed which class patterns remained uncategorized. I attempted to balance developing a small and manageable number of categories with creating enough categories to represent substantive differences that emerged in the data. Eventually, I was able to categorize every class-subject using the final set of seven developed class-profiles.
Table 1 summarizes the coding rules for each profile. The first noticeable pattern is that many classes do not administer benchmark modules until late spring, aligning with when the summative testing window opens. Therefore, I categorize classes that only assign benchmark modules starting after March 1 as “end-of-year preppers.” At the other extreme are classes where students consistently take benchmark modules throughout the school year. Classes that assign at least five benchmark modules before March 1, and at least one before January, are categorized as “continuous users.” Classes in which teachers assign a benchmark module fewer than five times prior to March, but at least once before January, to their full class (at least 50% of their class), are designated as “occasional checkers.” A class in which the teacher never assigns a benchmark module to more than five students for a given test administration is categorized as a “small group user.” A class designated as a “new year user” is similar to an end-of-year prepper, however, may begin assigning the modules as early as January as opposed to March. Finally, a class designated as a “supplementer” primarily uses benchmark modules at the end of the year, but may have given a few benchmarks to small groups of students (fewer than 50% of their class) earlier in the year. In Figure 1, an arrow for each type of user points to an example of each use-type pattern.
Profiles of a Benchmark Module User, by Class-Subject

Full class is defined as > 50% of students.
Results
Distribution of Benchmark Module Use
Table 2 displays the number of benchmark modules administered to students during the three years of included data. Between 2020–2021 and 2022–2023 teachers increasingly assigned more benchmark modules each year. In 2020–2021, Utah students completed about 486,000 benchmark modules. By 2022–2023, the number of benchmark modules administered more than doubled. While the number of students in Utah also increased, benchmark growth far outpaced student growth. However, not all classes used benchmark modules. In 2020–2021 only 26% of class-subjects assigned at least one benchmark module, though this grew to 50% by 2022–2023.
Benchmark Module Use, by Year
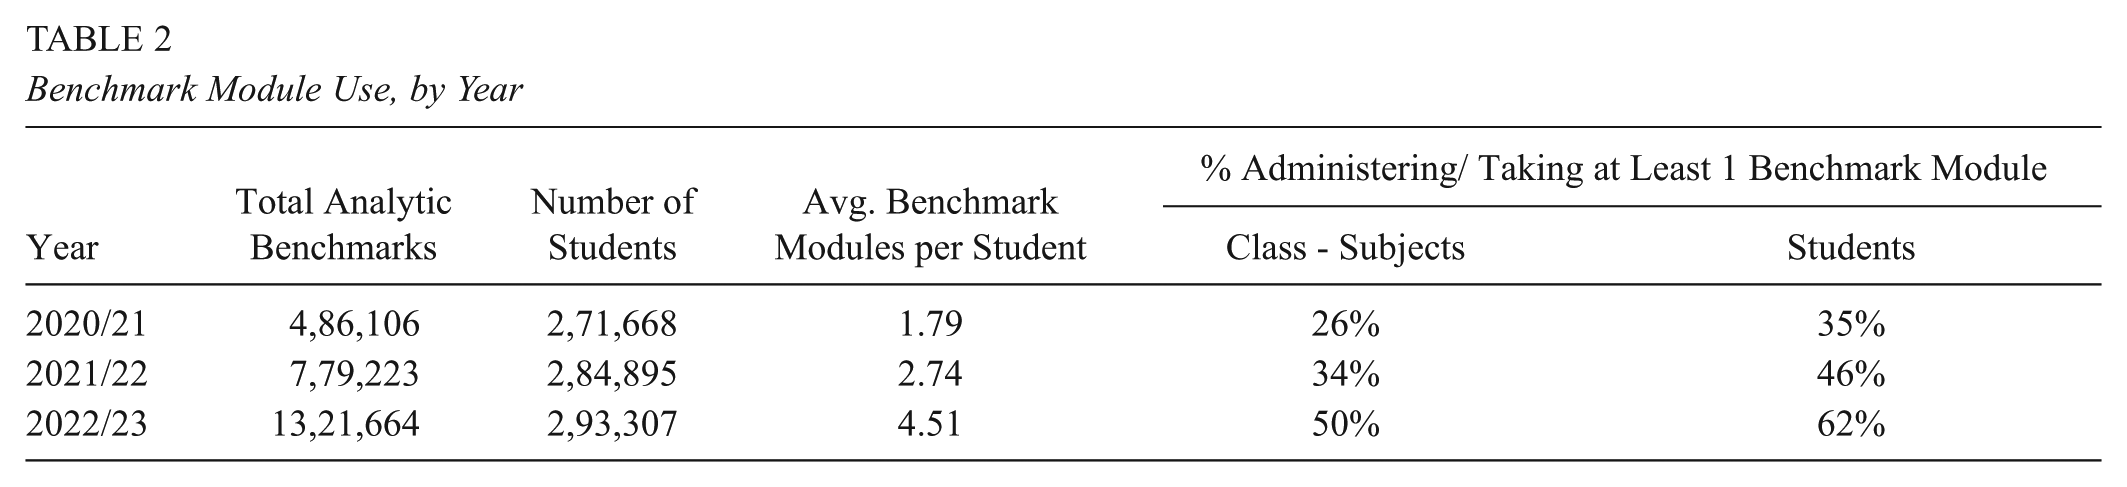
The percentage of students taking at least one module increased over the three years, mirroring the trend of benchmark module use throughout the state. Administration of benchmark modules, however, is not evenly distributed across grades and subjects. Figure 2 displays the number of benchmark modules taken by students by grade and subject in 2022–2023.
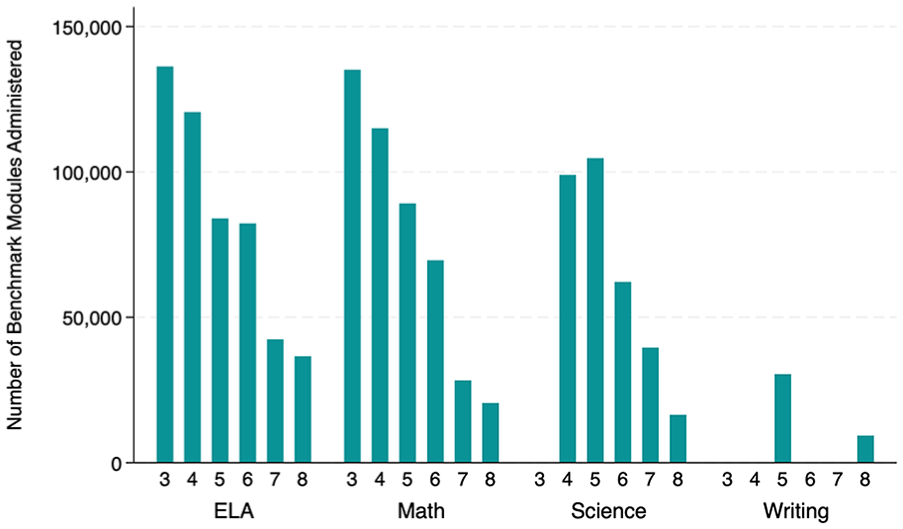
Benchmark Module Taking by Grade and Subject, 2022–2023.
The majority of benchmark modules are given in Grades 3 to 5 in ELA and math. Grade 5 is an exception, as more benchmark modules are administered in science than in math or ELA. Science is not offered in Grade 3, which is reflected in the figure. Writing benchmarks are available in all grades, however the above figure only includes student observations with a corresponding end-of-year RISE test. Finally, the number of modules administered decreases consistently across grade levels, with Grades 7 and 8 using significantly fewer benchmark modules than previous grades.
Timing of benchmark module administration may be indicative of how teachers are using the modules as part of their instruction. Figure 3 displays three histograms in which the x-axis is binned by week of the school year and the y-axis is the density of modules completed in that week.
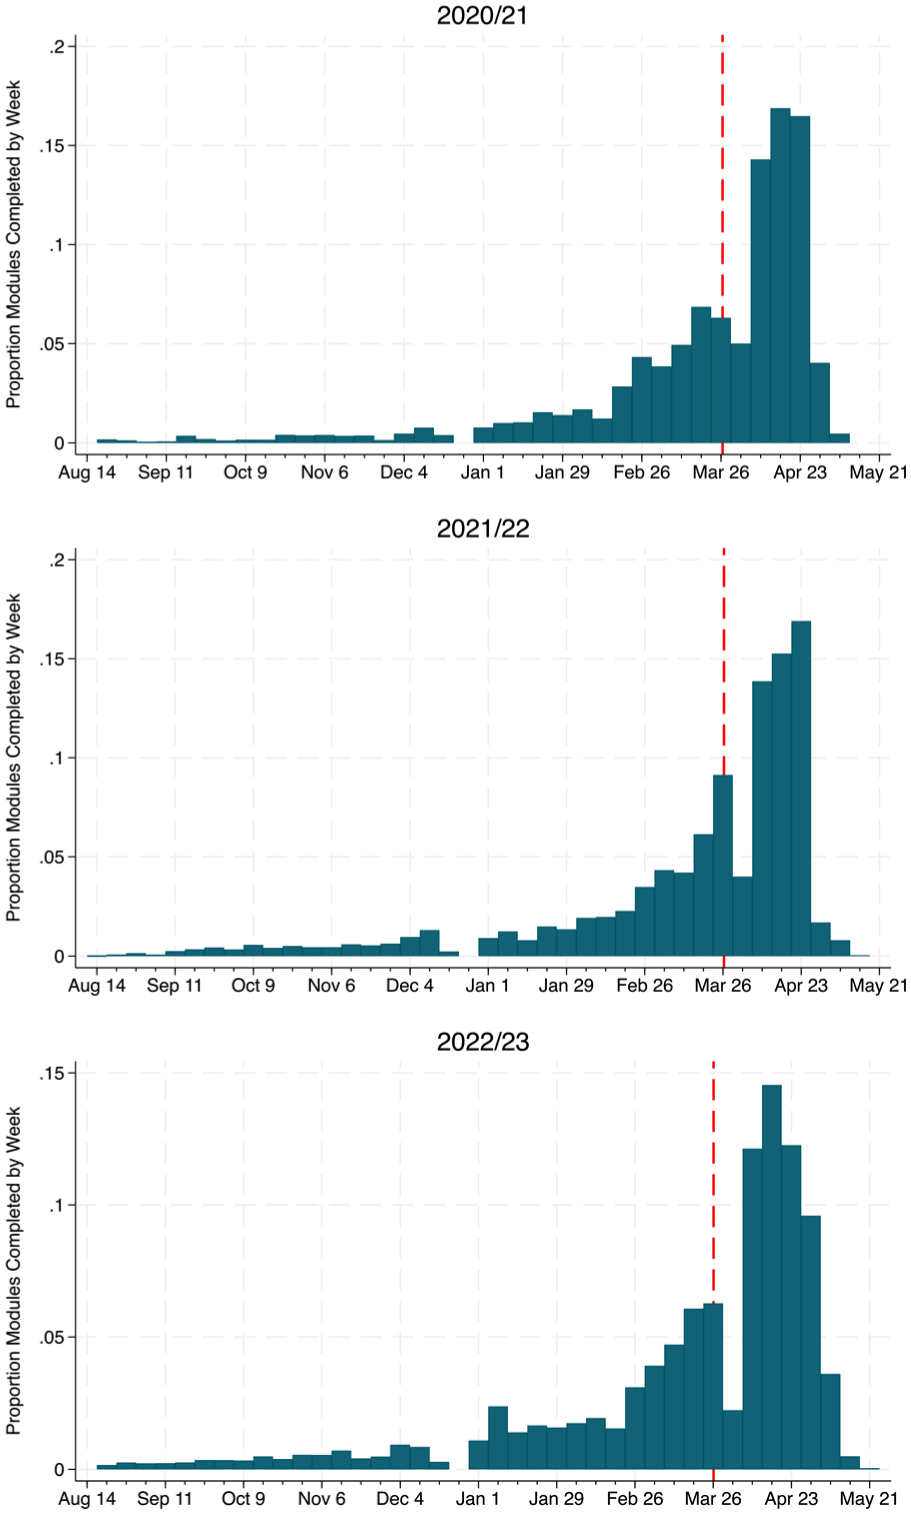
Benchmark Module Administration, by Year.
Figure 3 illustrates that most benchmark modules are given at the end of the year, a pattern which remains consistent across the 3 years of available data. Starting in late February, teachers began to administer benchmark modules at much greater rates. Remarkably, almost 17% of all benchmark modules assigned in 2020–2021 were taken in a single week in early April, and about 47% of all modules were assigned within the 3 weeks between late March to mid-April. A red line represents when the window for summative testing opens. In Utah, teachers and schools may choose when they wish to administer the summative state exam within that window. The window is open from late March through mid-May.
Patterns of Benchmark Module Use
Using the strategy outlined in the methods section, each class-subject was coded into a profile summarizing when and how often they used benchmark modules in their class. Table 3 displays the percentage and number of class-subjects in each profile.
Frequency of Benchmark Module Class-Subject Profile Type, by Year

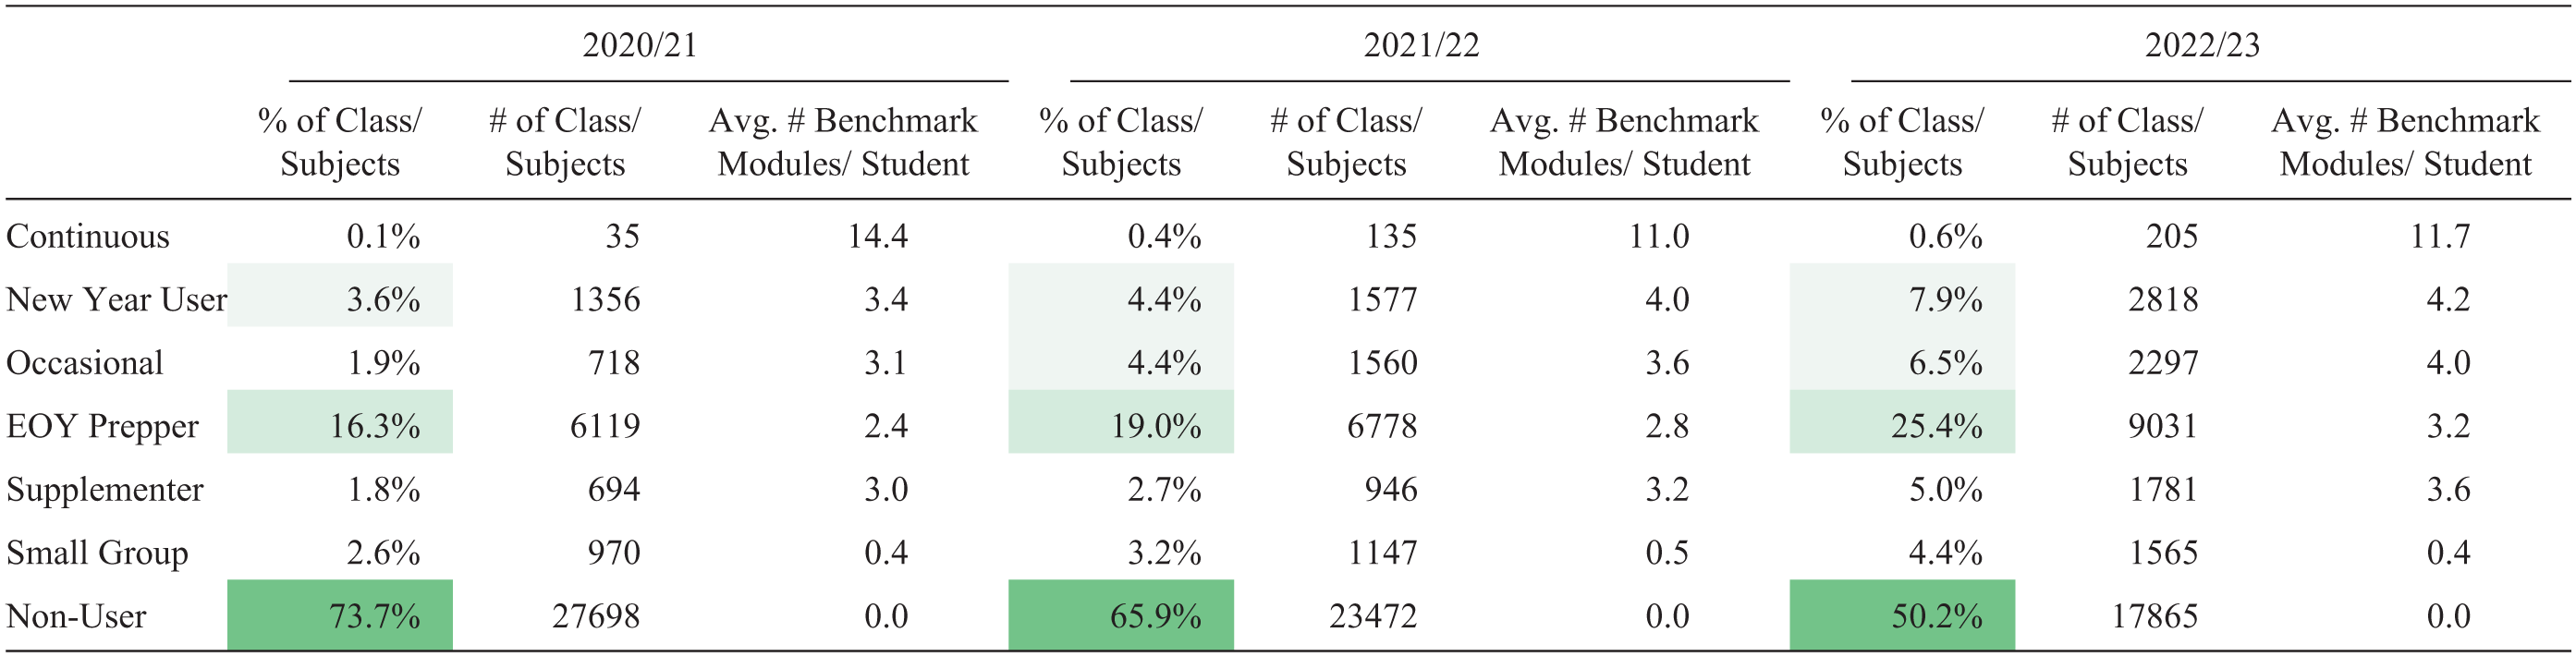
Note. Avg. = average. Dark green shading indicates higher percentages within-year.
The majority of classes in 2020–2021 and 2021–2022 were non-users, indicating that those teachers did not use benchmark modules in their instruction for that subject. However, by 2022–2023 almost 50% of classes were using benchmark modules in some capacity and were thus assigned one of the remaining six profile types. Among classes that used benchmark modules, end-of-year preppers were the most common. Over a quarter of class-subjects in 2022–2023 were identified as end-of-year preppers, reflecting that most teachers who use the modules did not assign them until after March 1. The next largest group were new-year users who differ from end-of-year preppers only in when they begin to give benchmark modules. The smallest group of benchmark module users were continuous users. In 2020–2021 only 35 class-subjects were identified as having teachers that regularly used benchmark modules throughout the year. However, between 2020–2021 and 2022–2023, the number of class-subjects identified as continuous users increased by over 400%, with 205 class-subjects using benchmark modules continuously in 2022–2023. Finally, small group users, supplementers, and occasional users each made up about 2% to 6% of total class-subjects in any given year.
There is surprising consistency in the average number of benchmark modules per student administered by end-of-year preppers, new year users, supplementers, and occasional users. Across all three years, teachers in those four profile groups gave an average of 2.4 to 4.2 benchmark modules per student (calculated as total number of modules given during the year divided by the number of students who took a RISE test at the end of the year in that subject). End-of-year preppers gave slightly fewer modules than the other three groups, but not by much, especially considering that they have a much later start in administering the modules. Continuous users gave almost triple the number of benchmark modules than the other groups, on average. Finally, small group users gave fewer modules per student, as would be expected considering that they are defined as only giving modules to fewer than five students at a time.
Effect of Benchmark Module Completion on End-of-Year Scores
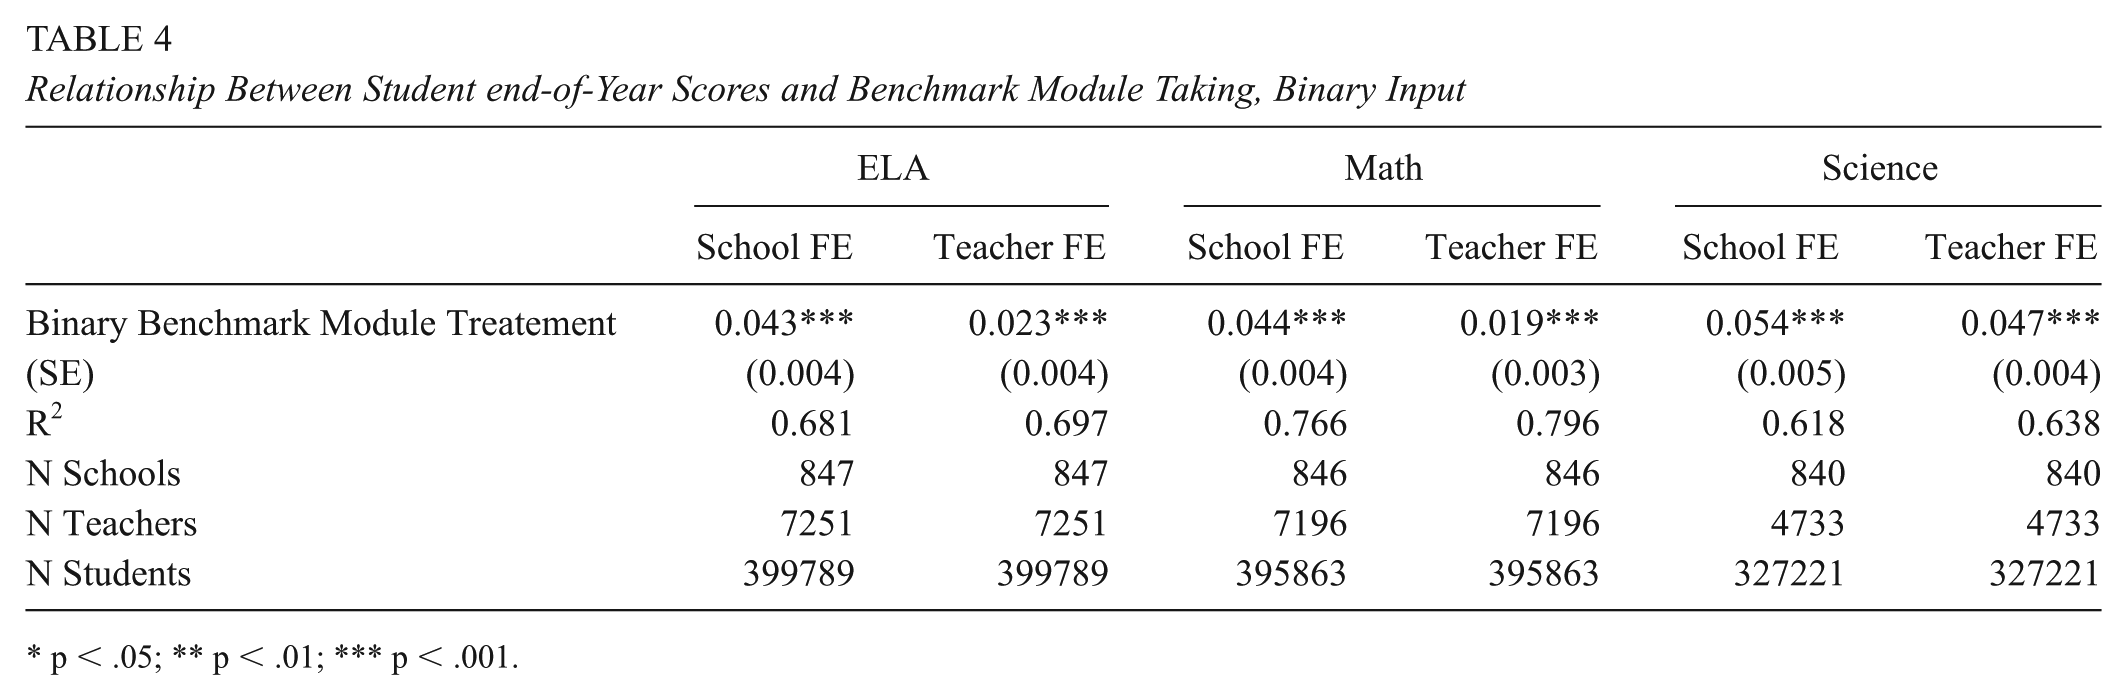
Table 4 displays the estimated difference in standardized end-of-year scores between students who complete at least one benchmark module compared to students who do not. The results from the baseline model are labeled “School FE”, and the results from Equation 2 are labeled “Teacher FE.” There are three N sizes presented. The first is the number of students, the second is the number of schools from which the students came, and the third is the number of teachers. However, when fixed effects are included, only students in schools or with teachers that vary in treatment status are used to estimate the effect. Appendix Table A2 presents sample sizes of students and teachers that vary in treatment when Zprofile is used as the treatment variable (Zprofile is the only treatment specification where low sample sizes are a concern).
Relationship Between Student end-of-Year Scores and Benchmark Module Taking, Binary Input
p < .05; ** p < .01; *** p < .001.
Across both models, there is a small, positive, and statistically significant relationship between having taken a benchmark module and end-of-year summative test scores. However, point estimates for the effect are small. Students who take at least one benchmark module in a grade and subject score about 0.02 to 0.05 standard deviations higher than their peers in the same school or with the same teacher, model dependent. The magnitude of the estimated relationship decreases as we replace the school fixed effect for a teacher-by-school fixed effect. The decreasing estimate provides some evidence that giving a benchmark module may be associated with teacher quality. However, even when comparing students taught by the same teacher and holding constant all covariates, there is still a positive and significant difference in end-of-year scores between students who take a benchmark module compared to those who do not.
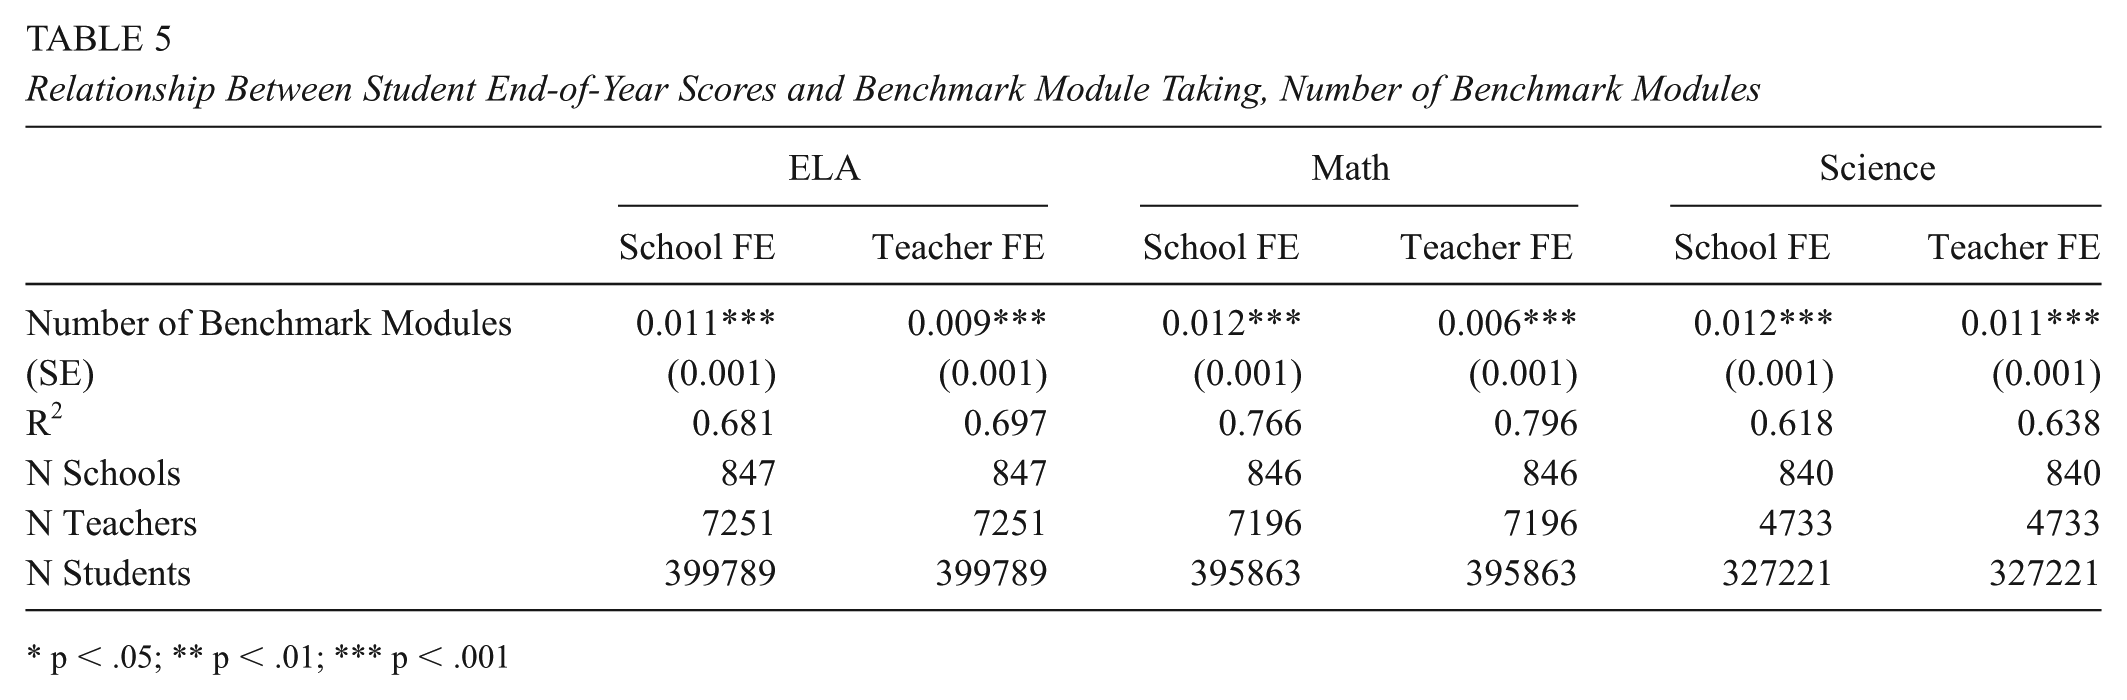
Table 5 displays the results when the benchmark module treatment variable, Zcount, is defined as a count of benchmark modules. The table presents the coefficient on Zcount for Equations 1 and 2, which can be interpreted as the difference in end-of-year scores associated with taking one additional benchmark module, holding constant all other variables in the model.
Relationship Between Student End-of-Year Scores and Benchmark Module Taking, Number of Benchmark Modules
p < .05; ** p < .01; *** p < .001
The estimates of the coefficient on Zcount remain relatively consistent across all subjects and models. Students who take an additional benchmark module score about 0.006 to 0.012 standard deviations higher, on average, compared to students who take one fewer module. We can use the average number of benchmark modules students take in a year, as reported in Table 3, to calculate the expected difference in end-of-year scores for students in different profile groups. For example, students in classes classified as an end-of-year prepper take about three benchmarks per year, implying that students in those classes would be predicted to score 0.02 to 0.04 standard deviations higher than their peers who do not take benchmark modules. Students in a class where their teacher is identified as a continuous user take 11 benchmark modules, on average. These students would be predicted to score about 0.07 to 0.13 standard deviations higher, subject dependent.
Finally, Table 6 displays the relationship between a class’s use profile and students’ end-of-year score. The reference group are students in classes designated as non-users, where no students take a benchmark module in that class or subject. Unlike the prior two models which defined treatment variables at the student-level (i.e., students in the same class can vary in benchmark module exposure), the treatment in Table 6 is defined at the class-level by the class’s use profile.
Relationship Between Student End-of-Year Scores and Benchmark Module Taking, by Class-Subject Profile

p < .05; ** p < .01; *** p < .001.
The estimates from Equation 1, School FE, indicate that within the same school, students in ELA classes coded as a continuous user score 0.104 standard deviations higher, on average, compared to students in classes that do not use benchmark modules, holding constant all other variables. The magnitude of the estimate decreases to 0.071 when using a teacher by school fixed effect (Teacher FE). The estimated relationship is even higher in math, with students in continuous use classes scoring about 0.11 to 0.14 standard deviations higher, on average, compared to non-use peers across both models. In science, the estimated difference is smaller and non-significant in both models, which may partially be explained by a smaller number of teachers who are coded as continuous users in science (see Appendix Table A2 for profile specific sample sizes).
There is a small, positive significant difference in RISE scores between students in classes coded as new year users, occasional users, end-of-year preppers, and supplementers, compared to students in classes coded as non-users. The estimates from the model range from being non-significant to 0.06 standard deviations depending on the subject and model. Once a teacher by school fixed effect is added, estimates of the relationship decrease and are non-significant in ELA and math. It may be that with the same teacher, there is less variability in the number of modules assigned between classes coded as two different use types. For example, a teacher may assign one or two benchmark modules to one of their classes at the end of the year and thus be coded as an end-of-year user in one class, whereas they did not assign benchmark modules in a second class. The difference of only a few modules between classes may be smaller than the average difference when using between-teacher comparisons in Model 1, and thus lead to a smaller estimate of the effect.
Students in the remaining group of small group users score lower, on average, than students in classes not using benchmark modules. The estimated difference reaches statistical significance in math and science. Appendix Table A3 displays student demographics by class-profile in each year. While most student demographics across class profile types are similar, small group users have a higher proportion of students who are coded as “mobile” (students identified as migrant or homeless), and students in these classes entered with lower prior-year end-of-year RISE scores, on average. Classes coded as small group users, therefore, may serve a different group of students than the general education classes.
Discussion
This research aims to understand when, how frequently, and with what relationship to end-of-year scores teachers use short, targeted, benchmark modules in their instruction. While qualitative work could more precisely identify the mechanism underlying differences in end-of-year student scores, our understanding of how the benchmark system works can provide some preliminary evidence about which mechanisms may be more likely in practice. Based on the provided evidence, I discuss whether the Utah benchmark modules are likely being used to provide feedback to students, to facilitate instructional change (the stated goal of the benchmark module system), or as test practice for students prior to the end-of-year assessment.
Limitations and Robustness Checks
Teachers, schools, and districts have the option to use benchmark modules. Therefore, a threat to inferring a causal relationship between benchmark module use and end-of-year summative scores are unobserved variables which may be associated with characteristics of teachers and students who use benchmark modules. For example, schools with a stronger culture of collaborative professional learning communities may also be more likely to schedule a benchmark module as part of their regular teaching practice. To minimize the possibility that school level factors may be correlated with benchmark module use and end-of-year scores, I used school fixed effects to leverage the variation across students and teachers within the same school. However, if decisions are made at the grade-team level, this approach may not capture all relevant factors that influence whether a teacher uses or does not use benchmark modules. To address potential within school, grade level sorting, Appendix Tables A5 and A6 demonstrate an alternative specification using school by grade fixed effects. Results hold for all treatment specifications, although only those showing class profile as a treatment are displayed.
Another variable that may confound the observed relationship between module use and student scores is teacher quality or experience. I attempt to address this in my analyses by restricting comparisons to teachers who varied in their benchmark module usage through the inclusion of teacher-specific fixed effects (recall Equation 2). However, estimates using a teacher-by-school fixed effect require that a teacher was coded into at least two different profiles of benchmark module use across two classes. Because the data only includes 2 years of module completion in which prior year scores are available, there are relatively few teachers who made a switch in profile status, especially among continuous users, thus limiting the number of teachers on whom the model estimates are based (see Appendix Table A2). As a robustness check, I also specify a model which adds a teacher level covariate to Equation 1, which calculates the mean Student Growth Percentiles (SGP) of all students the teacher had in the same subject in school year 2020–2021. The mean SGP serves as a rough proxy for teacher quality (Guarino et al., 2015), although researchers caution against using it to make inferences about individual teachers due to unreliability from measurement error (Castellano & McCaffrey, 2017; McCaffrey et al., 2015). Results for this model, reported in Appendix Tables A5 and A6, are consistent with the main results from Equation 1 for all treatment specifications.
An additional limitation is that the estimated effects compare benchmark module use to a business-as-usual approach taken by teachers who do not use benchmark modules. Teachers may use other vendor-offered interim assessments or curriculum embedded assessments to support their instructional decision-making. Unfortunately, data on teachers’ usual assessment practice was not available. Therefore, the comparison group of teachers who do not assign benchmark modules likely includes teachers with diverse instructional practices, many of whom may use other vendor created or curriculum embedded interim assessments.
Does Benchmark Module Use Improve Student End-of-Year Scores?
There is a small positive, significant, difference in end-of-year RISE scores between students in classes that use benchmark modules and those that do not. Estimates of the coefficient on the binary treatment variable, Zbin, range between 0.02 and 0.05 standard deviations. Even using Kraft’s updated guidelines for interpreting effect sizes, an effect of less than 0.05 is considered small (Kraft, 2020). To further put the magnitude of this difference in context, a 0.05 standard deviation difference in end-of-year scores between students who take at least one benchmark module can be translated to the scale score units of the end-of-year assessment. Appendix Table A4 displays the standard deviation of end-of-year RISE scale scores for each grade, as well as the scale score ranges for each performance category. In Grade 3 ELA, the standard deviation is 78.1 scale score points. A difference of 0.05 standard deviations would be 3.91 scale score points. Four scale score points can be further contextualized by thinking about the minimum and maximum range of the performance category “meets proficient.” Grade 3 students must earn a scale score between 291 and 333 to be categorized as proficient in ELA, which is a range of 42 scale score points. Therefore, a 0.05 standard deviation difference on the end-of-year assessment translates to approximately 1/10 of the distance of moving from “approaching proficient” to “exceeds proficient.” Repeating this process for other grades and content areas yields similar estimates equating to about 1/10 the range covered by a designation of proficient.
The estimated effect for students in classes coded as end-of-year preppers is also much smaller than the 0.23 standard deviation practice effect estimated in prior studies from taking a non-equivalent assessment (Hausknecht et al., 2007; Kulik et al., 1984). It could be that students who take only a few benchmark modules lower the estimate of the effect, since it may be unreasonable to think that taking one or two benchmark modules will provide enough practice to see a change in end-of-year scores. The significant, positive coefficient on Zcount partially supports the above interpretation since the model predicts that students who take more benchmark modules score higher, on average, than students who take fewer. This finding is also consistent with the literature on practice effects, which suggests that having more opportunities for practice is associated with higher scores. According to the model, students would need to take ~15 to 20 benchmark modules to achieve a difference of 0.2 standard deviations on their end-of-year assessment, assuming there are no diminishing returns to module use.
Notably, when looking at the estimated differences when using the class treatment Zprofile, the largest positive difference in end-of-year scores is for students in classes coded as continuous users. This finding could be consistent with either an instructional change or practice effect hypothesis. If teachers in classes coded as continuous users meaningfully integrate the benchmark modules into their teaching and use the results to make instructional adjustments, then students may experience better learning opportunities. This type of use would be consistent with the intended purpose and underlying theory of action for offering the exams: that regular use of the modules can inform instructional decision making, lead to more directed teaching, and thus improve student learning outcomes. It is also possible, however, that students in continuous user classes score higher simply because they take more benchmark modules and thus have more opportunity to practice with the online test format and with questions similar to the end-of-year assessment. That there is also a smaller but positive, significant difference in end-of-year scores for students in classes coded as end-of-year preppers suggests that students benefit from taking the modules even when the information from the modules is not incorporated into regular teaching. End-of-year use is most consistent with a practice effect hypothesis, since there is limited opportunity for teachers to respond to the results of the assessment. Therefore, if students in end-of-year prepper classes are benefiting from taking the modules, part of the difference seen in continuous user classes may also be due to a practice effect. The existence of a practice effect, however, does not necessarily mean that students do not learn from review prior to the test. If teachers help students identify specific misunderstandings and ways to approach the module questions, then the positive difference could be a result of learning that occurs during the process of practice. Qualitative exploration through teacher interviews (currently underway) may further clarify whether the observed difference in end-of-year scores between benchmark module users and non-users is driven by a practice effect, by feedback strategies employed by teachers, by changes teachers make to their instructional practice, or by a combination of the three.
What do Patterns of Benchmark Module Administration Suggest About Teacher Use?
Utah teachers are using the benchmark modules. Over the 3 years from 2020–2021 to 2022–2023, the number of benchmark modules completed significantly increased. There are several factors that could be driving increased benchmark module use. First, it is possible that more teachers learned about and subsequently assigned the benchmark modules as time went on. Relatedly, while the modules were first offered in 2016, the math and ELA modules were revamped prior to school year 2021–2022 to be both shorter and have a narrower focus on a few content standards (personal communication with Utah Test Administration Coordinator, March 7, 2024). It is possible that the narrower focus made the modules easier to administer and that teachers found the information increasingly useful, thus spurring greater use each year. Finally, it could be that more schools and districts began requiring teachers to use the benchmark modules. More exploration would be needed to determine which of the three is the most likely cause for increased use, or if increasing use was driven by a mixture of the three.
Evidence of student feedback
Specific, targeted, feedback helps students grow (Black & Wiliam, 1998). The Utah benchmark modules, however, are not designed to provide feedback to students directly without additional teacher support. When a student finishes and submits their answers to a benchmark module, the online system shares the number of points they earned out of the total possible for that module. However, students are not informed which questions they answered correctly or incorrectly. A teacher must either print individual scores to share with students or ask students to record their responses as they answer. Then, a teacher can review in small groups or with the whole class by projecting each question. While some teachers may successfully translate benchmark module scores into meaningful review, the modules are not optimized to provide feedback about specific skills, content, and areas of growth to students.
Evidence of teacher feedback
Despite considerable use throughout the state, there is not strong evidence that teachers are using the modules regularly to inform their instructional decision-making. A minimum requirement for using the benchmark modules to facilitate instructional change would be that the modules are assigned when instruction is happening in a given topic or content area. However, the vast majority of teachers are using the modules only at the end of the year. This implies that, for most teachers, the benchmark modules are not being given when instruction on the topic is occurring.
On the other hand, use throughout the year has been increasing. Continuous users, while still by far the smallest group, increased from 0.1% in 2020–2021 to 0.6% of all class-subjects in 2022–2023. The continuous users are the teachers who are the most likely to be using the benchmark modules to inform their regular instructional decision-making, although there is no guarantee that this is the case. In a best-case scenario, these teachers could be working with their grade-level team to give a benchmark module that is relevant to the content they are teaching, use the results to determine where students excelled and struggled, collaborate with their team to discuss instructional responses, and then decide what additional activities or content should be covered based on the results of the assessment. If, however, these teachers are required to give the assessments at regular periods and are not provided the time or support to incorporate the results into their planning, it is less likely that using the benchmark modules supports authentic instructional decision-making (Blanc et al., 2010).
Classes coded as having teachers who are occasional benchmark module users increased from 1.9% to 6.5% of all class-subjects. Teachers using the benchmark modules occasionally throughout the year could be using them as a progress check to see if their instruction is aligning to state curriculum and standards. However, there are several other reasons why a teacher may decide to give just a few modules in the fall semester. There may be schools or districts that require teachers to administer benchmark modules at least once in the Fall. If a teacher is administering a benchmark module out of compliance and does not spend much time looking at the information, then an associated change to instruction or learning would not be expected. It is also possible that a teacher could have assigned a benchmark module early in the year but then decided that the information from the report and the practice for students was not valuable enough for them to continue using them throughout the year.
Evidence of benchmark module use as a practice effect
Heavy end-of-year use suggests that teachers may perceive that the main value of the modules is to allow students to gain familiarity with the end-of-year test format and review skills prior to taking the state exam. Teachers who use the modules at the end-of-year may be operating using a practice-effect hypothesis, believing that practice with the test format can help students become familiar with the types of questions asked, thus helping students score higher than they otherwise would on the end-of-year assessment. That the largest number of benchmark modules are assigned in Grade 3 may also support the hypothesis that teachers are using the modules to help students familiarize themselves with the format of the test (logging onto the system, answering questions, submitting the assessment), since Grade 3 is the first year that students take an end-of-year assessment.
Conclusion
This study makes two primary contributions. First, it describes how frequently benchmarks modules—an emerging and increasingly common form of interim assessment—are used in a state which has made them freely available to all teachers. Second, it explores how different patterns of module use may be differently associated with student end-of-year learning outcomes. The Utah benchmark modules were designed, in part, to respond to criticisms of mini-summative interim assessments. The short design of the modules was intended to make them easier to fit into curricula, to provided targeted information on a specific skill, and to provide results to teachers the same day they assign the module. Ultimately, the modules are intended to support instruction and improve student learning outcomes. This paper helps explore whether the modules achieve this goal in practice.
The timing of benchmark module administration suggests that most teachers are not using the modules to inform their instructional decision-making throughout the school year. A majority of teachers use the modules primarily at the end of the year or not at all, indicating that most teachers do not incorporate them into their regular instructional use. There may be multiple reasons for this choice. The reason of largest concern is that, despite changes to the modules intended to make them easier to integrate them into curriculum, teachers still find that they are too broad or do not ask the questions necessary to fit into their specific curriculum or program of instruction. Additionally, teachers may feel that the information gained from the modules is still not specific or fine-grained enough for them to be able to understand what students are thinking. The lack of use could also be attributed to more technical or procedural issues, such as struggling to navigate the online reporting system or simply not knowing that the modules are available. Finally, teachers may be concerned about over testing and emphasizing the end-of-year exam to the detriment of how their students feel about learning. Follow-up research that asks teachers why they do or do not choose to use the modules, and how they incorporate them into their classroom, will be essential for developing a more complete picture as to whether benchmark modules are instructionally useful.
Students in classes where benchmark modules are being used consistently during the year score slightly higher on the end-of-year RISE assessment relative to similar students not taking benchmark modules. Although the total magnitude of the differences in RISE scores is small, the positive, significant relationship between continuous benchmark module use and end-of-year student learning outcomes warrants additional investigation. Ideally, teachers are using benchmark modules to support their instruction and decision-making. However, it may also be the case that the observed positive effect may be a result of a practice effect from taking relatively more benchmark modules, on average, than other use-profile types. Research on the supports and structures that facilitate effective module use, as well as the features of the modules that teachers find helpful, could clarify which elements of the benchmark modules should be replicated, if any.
Ultimately, there are only a small handful of teachers that used the benchmark modules throughout the year. The timing of when most benchmark modules are administered suggests that they are most frequently used by teachers to help students prepare for the end-of-year assessment. As such, the study raises important questions about the potential for benchmark module type assessments to support regular teacher instruction. What type of information do teachers typically use to support their decision-making, and could adjustments to the module design better provide the needed information? How do teachers and students perceive state sponsored assessment, and are these perceptions a barrier to interim assessment use? What forms of assessment are teachers likely to use and see as valuable for their instructional practice? As states and districts consider adopting assessment tools that promise to support teachers’ instruction, answering the above questions should help ensure that teachers are getting the information they need from assessments to in turn support student learning.
Footnotes
Appendix
Robustness Check, Equation 1 Using Various Fixed Effect and mSGP Covariates, Math

| Equation 1 | Year FE | Grade × Year FE | School × Grade FE | |
|
|---|---|---|---|---|---|
| Continuous User | 0.137***
(0.026) |
0.138***
(0.026) |
0.138***
(0.027) |
0.129***
(0.021) |
0.136***
(0.033) |
| New Year User | 0.031***
(0.008) |
0.031***
(0.008) |
0.031***
(0.008) |
0.014 (0.007) |
0.019*
(0.009) |
| Occasional User | 0.031***
(0.008) |
0.032***
(0.008) |
0.032***
(0.008) |
0.007(0.008) | 0.014(0.009) |
| End-of-Year Prepper | 0.030***
(0.005) |
0.031***
(0.005) |
0.031***
(0.005) |
0.020***
(0.005) |
0.023***
(0.006) |
| Supplementer | 0.032***
(0.009) |
0.033***
(0.009) |
0.033***
(0.009) |
0.014 (0.008) |
0.023*
(0.01) |
| Small Group User | −0.033***
(0.008) |
−0.033***
(0.008) |
−0.033***
(0.008) |
−0.026***
(0.007) |
−0.017 (0.01) |
| R2 | 0.766 | 0.766 | 0.766 | 0.781 | 0.774 |
| N Schools | 846 | 846 | 846 | 846 | 805 |
| N Teachers | 7196 | 7196 | 7196 | 7196 | 3303 |
| N Students | 395863 | 395863 | 395863 | 395863 | 240163 |
Note. See the Note for Table A5.
p < .05; ***p < .001.
Declaration of Conflicting Interests
The author declared no potential conflicts of interest with respect to the research, authorship, and/or publication of this article.
Funding
The author disclosed receipt of the following financial support for the research, authorship, and/or publication of this article: This work was supported by the National Center for the Improvement of Educational Assessment, Inc.
Author
KYLA N. MCCLURE is a PhD candidate in Research and Evaluation Methodology at the University of Colorado Boulder. A former high-school math teacher, she now studies whether and how teachers make use of large-scale assessments to improve their instruction and support student learning.