
Abstract
The use of student learning objectives (SLOs) as part of teacher performance systems has gained traction quickly in the United States, yet little is known about how teachers select specific students’ learning goals. When teachers are evaluated—and sometimes compensated—based on whether their students meet the very objectives the teachers set at the start of the year, there may be an incentive to set low targets. SLO systems rely on teachers’ willingness and ability to set appropriately ambitious SLOs. We describe teachers’ SLO target-setting behavior in one school-district. We document the accuracy/ambitiousness of targets and find that teachers regularly set targets that students did not meet. We also find that, within the same year, a student’s spring test scores tend to be higher on the assessments for which they received higher targets. This raises the intriguing possibility that receiving higher targets might cause students to perform better than they otherwise would have.
Keywords
Over the past 15 years, U.S. federal initiatives like Race to the Top (RTTT) and the Every Student Succeeds Act (ESSA) have pushed states and districts to incorporate individual measures of student growth into teacher evaluation systems (Berg-Jacobson, 2016). That requirement is often met by linking teachers to their students’ growth on end-of-year (EOY) statewide assessments (e.g., value-added measures [VAMs]), particularly in math and English language arts (ELA) in Grades 4 to 8. Yet this strategy raises at least two challenges. The first is logistical: VAMs can only be produced for teachers in tested subjects and grades—about 20% to 30% of a district’s teachers. A second concern is that evaluation systems linked solely to EOY tests fail to incorporate teachers’ professional expertise and knowledge of their students.
There have been a number of responses to these challenges but one that may address both is implementing student learning objectives (SLOs) systems. District SLO systems mandate a process by which teachers establish concrete, annual learning targets for their students, typically on some assessment chosen at the classroom, school, or district level. Since the SLO process does not necessarily rely on statewide tests, the approach can be used to cover a broader spectrum of teacher roles. Because teachers are more directly involved determining what reasonable goals should be, there is more reliance on the teacher’s professional judgment and their knowledge of the student’s context. The act of setting clear goals, along with having ambitious expectations for learners, may help teachers inform and improve their daily practice. These aspects of SLOs make them a potential lever for addressing the shortcomings of teacher evaluation systems that rely solely on teacher VAMs described above.
Little is known about how SLO systems are implemented in practice. In particular, teachers are not necessarily trained on how to select appropriate learning objectives on the given assessment their school or district has adopted. Moreover, when teachers are evaluated based on whether their students meet the very objectives the teachers set at the beginning of the school year, there appears to be a perverse incentive to set low targets. The success of SLO systems relies on the premise that teachers are willing and able to set appropriately ambitious goals for their students each year.
We describe target-setting behaviors within an SLO system piloted for 4 years in a subset of schools in a southeastern school district. We describe this district’s SLO system in greater detail below, but it is relevant to know at the outset that this district also used SLOs for a pay-for-performance policy; if fewer than 50% of a teacher’s students did not meet the targets, they would not receive any bonus (up to $5,000). How will teachers choose to enact a system that may run counter to their own interests (i.e., setting higher targets could lead to lower evaluations, losing a bonus)? The purpose of this article is therefore twofold: We provide new descriptive insights on how teachers set their SLOs for different students and on different assessments, and we examine associations between SLO targets and student outcomes.
SLO Policy Landscape
SLOs have gained traction quickly in part because several of the U.S. Department of Education’s grant initiatives (e.g., NCLB waivers, RTTT, the Teacher Incentive Fund [TIF] grant) have endorsed SLOs as a way to satisfy the requirement to measure student growth in nontested subjects and grades (U.S. Department of Education, 2012). There is considerable variability in what could constitute an SLO system, but the DoE has described the SLO process as [a] participatory method of setting measurable goals, or objectives, based on the specific assignment or class, such as the students taught, the subject matter taught, the baseline performance of the students, and the measurable gain in student performance during the course of instruction. (RTTT Technical Assistance Network, 2010)
Inherent in this definition is room for flexibility about who chooses the assessments and the extent to which assessments must be comparable across classrooms and schools.
As of 2015, about 30 states already either recommend or require SLOs (Lachlan-Haché, 2015). We are aware of one report that gathers information on SLO implementation in educator evaluator systems across states (Lacireno-Paquet et al., 2014). The current district’s SLO system has many of the most common features reported therein. Of the 30 states studied, the report finds that 23 use SLOs to evaluate individual teachers, as opposed to teams of teachers or the entire school. In 26 states, the assessment used for SLOs was not chosen by teachers—rather, SLOs were based on a test used statewide (N = 14) or district/school-wide (N = 12). In 21 states, the SLO-setting process required that SLOs are approved by an external evaluator, usually a principal or district leader. (A principal approves SLOs in the current district.) SLOs are sometimes linked to performance incentives, particularly among districts receiving TIF grants. It is not clear how common this practice is across the United States, but several other large districts have experimented with this, including Denver Public Schools, Charlotte-Mecklenburg schools, and Austin Independent School District (Lachlan-Haché et al., 2015).
In Figure 1, we reproduce a useful illustration initially developed by Lachlan-Haché et al. (2013) and widely adapted, which places SLO policies on a continuum: On the left side of Figure 1 are SLO approaches that emphasize greater teacher agency, while those on the right side of Figure 1 emphasize greater comparability. The current district’s SLO process falls on the right side of the Figure 1 continuum because teachers do not select an assessment of their choice.

Continuum of approaches to setting student learning objectives.
Early research documents some of the challenges districts experience with SLO implementation (Delaware Department of Education, 2013; Donaldson et al., 2014; Lachlan-Haché, 2015; Lachlan-Haché et al., 2013; Lamb et al., 2013; Schmitt, Cornetto, Lamb, & Imes, 2009; Slotnik, Smith, & Liang, 2013). 1 However, because these systems are relatively new, little research has yet attempted to describe teacher goal-setting behavior.
Unique Contribution and Research Questions
One of our objectives is to fill this gap by documenting the accuracy and ambitiousness of the learning targets teachers set for their students, capturing the extent to which teachers are willing to set targets they may not reach (thereby reducing their bonus pay), and considering whether target-setting shifts across study years, varies by teacher effectiveness (proxied with VAMs), or is approached differently across the seven pilot schools.
The district we study provides a number of advantages for these questions. First, their particular version of an SLO process uses the same assessments for each grade level across all schools, enabling us to compare target setting on the same assessments across classrooms. Second, this district piloted an SLO system in which teachers had to select and document very specific targets—that is, in the fall, teachers combined their knowledge of their students with a review of the student’s historical data to identify a score target for each child on each assessment (e.g., Grade 4 Teacher X sets as a goal that her Student Y will score a 221 on the math test at the end of this year). 2 This practice provides an opportunity to explore variability in objectives across students in the same class. Finally, in Grades 4 through 8, teachers set targets on at least two different EOY tests (both in math and ELA), providing an additional source of variability. 3
The goal of the current article is to provide the field with a thorough description of target-setting in an SLO system where not meeting targets is linked to decreased incentive pay. Because these pilot schools were selected based on low prior performance and high percentages of free-/reduced-price lunch (FRPL) eligible students, we also examine SLO target setting in a context under pressure to raise student outcomes. We organize our analyses into three research objectives:
Describe accuracy/ambitiousness of targets, percent of targets met, and variation in target-setting behaviors across schools, teachers, and study years
Document whether receiving higher targets predicts higher EOY test scores, for similar/same students/schools
Assess possible evidence of differential target-setting by race/ethnicity, conditional on prior achievement profile
Next, we provide details on the district and its SLO policy. Our literature review focuses on the potential mechanisms through which goal-setting might influence student outcomes. We then describe the data and methods used to explore these research questions, present our findings, and conclude with a reflection on takeaways, limitations, and next steps.
The District and Its SLO Policy
The anonymous district in which this study takes place includes one of the largest cities and its surrounding area in a southeastern state. It has about 60 schools and serves around 50,000 students annually in a mix of urban, suburban, and rural communities. In 2012, the majority (55%) of the students in the district were non-White. Specifically, 36.9% of students were designated as Black, 6.5% as Asian, 4.9% as Hispanic, and 6.1% as mixed or unknown race/ethnicity. The district covers a wide geographic area and has both high-poverty and low-poverty communities.
In 2010, the district was awarded a TIF grant to implement and evaluate the impact of a new performance-based employee compensation system in high-needs schools. Eight of the district’s highest needs schools were selected to participate (more on sample below). Given TIF’s focus on incentive pay, the district needed a way to connect compensation to teacher performance in nontested subjects and grades, and SLOs were selected to fill that role.
Beginning in 2011–2012, teachers created a “learning contract” with their principal for each student in their class. Teachers did so by first examining each student’s test scores from the prior spring. 4 The teacher then combined that information with his/her own insight into the student’s context. By mid-November, the teacher committed to an annual growth target for each student. 5 Teachers were not provided formal training on setting SLO targets. Because targets were reviewed by the principal, there was some oversight of teachers setting inappropriately low goals. We also will show that students did not meet the targets teachers set for them about 40% of the time, suggesting that teachers did not shy away from setting difficult-to-achieve targets.
The district opted to use uniform assessments across all students in the same grade. Each Grade 4 and 5 teacher selected score targets on four different assessments for each student each year—math and ELA scale score targets on the statewide standardized achievement test (pseudonym SSAT) and NWEA’s Measures of Academic Progress (MAP) spring math and ELA assessment. 6 In Grades 6 to 8, a student’s math teacher set the two math targets (SSAT and MAP), while a different ELA teacher set the 2 ELA targets. 7 SSAT results are high stakes since they play a central role in the state’s accountability policy, while the purpose of the MAP test is more formative. That said, since both the SSAT and MAP were used to determine the size of SLO incentive payments, both assessments had stakes attached to them in this context.
Teachers received incentive pay based on the percentage of their students who met their targets. If at least 50% of the teachers’ students met their target, they received a bonus between $2500 and $5000. 8 If less than 50% of a teacher’s students met their target, they received no bonus. The average annual base salary for teachers was around $49,500 (and an SDof about $10,900), so that a $5000 bonus is sizeable—about 10% of base pay for the average teacher.
Potential Mechanisms for SLO Impacts
A key driver of any link between SLO systems and improved student outcomes is the potential positive impacts of teachers setting high expectations for students. Researchers have long explored the positive association between teacher expectations and student outcomes (Jussim & Harber, 2005; Madon et al., 1997). Perhaps the best-known example is the Rosenthal and Jacobsen experiment from the mid-1960s in which the randomly selected students described to teachers as high-growth potential did exhibit higher EOY test scores (Rosenthal, 1987; Rosenthal & Jacobson, 1968). 9
Of course, teachers’ expectations are usually not randomly generated. Just because the students for whom the teachers have higher expectations tend to perform better does not imply that high expectations cause high performance. Teacher expectations may correlate with achievement simply because teachers can accurately anticipate subsequent performance. This ambiguity complicates any attempt to make a causal link between setting ambitious learning objectives and student outcomes (Jussim & Harber, 2005; Papageorge et al., 2020). To tackle this, Papageorge et al. (2020) leveraged data from a nationally-representative 2002 cohort of 10th graders—wherein two different teachers provided their educational expectations for the same student. This conditionally exogenous variation in expectations within student was linked to increased likelihood of college completion, suggesting that teacher expectations indeed become so-called self-fulfilling prophecies. 10
Even if we accept the premise that teacher expectations exert an independent, positive impact on student outcomes, the underlying mechanisms are not entirely clear. High expectations might lead a teacher to alter the way they deliver instruction to a student, either consciously or unconsciously. For instance, Proctor (1984) found that [t]eachers are less apt to direct instruction to low-expectation students, are less likely to be aware of, or more likely to tolerate, non-attending behavior on the part of such students, and tend to place fewer demands on them for classroom performance, homework assignments, and overall academic effort. (p. 472).
Teachers might also be directly communicating their high expectations to the given student, who may in turn alter their own behavior. The study by Papageorge et al. (2020) lends support to this potential pathway, since they found that high expectations led to students spending slightly more time on their homework. When teachers make their high expectations known, students might also find themselves reevaluating their own self-beliefs about what they can accomplish. In this sense, teachers’ expressed beliefs about a student’s capacity for growth also connects to the literature on the benefits of a growth mindset (see, e.g., Dweck, 2008). 11 Seaton (2018) provides a conceptual framework grounded in psychological theory for how a teacher’s growth mindset can stimulate their students’ growth mindsets, thus providing another potential pathway for positive effects of teacher expectations. Consistent with this idea, Papageorge et al. (2020) found that students exposed to higher teacher expectations also held higher expectations of their own educational prospects 2 years later.
Potential Bias in Teacher Expectations
Teacher expectations can also be harmful if they are shaped by implicit biases (Proctor, 1984). Indeed, it has been shown in many contexts that people have implicit association biases of which they themselves are not aware (Correll et al., 2007; Green et al., 2007; Tyler Eastman & Billings, 2001). Teachers may be expecting students to act or perform in accordance with their biases and may disregard contradictory evidence of change (Ferguson, 2003; Proctor, 1984; Rubie-Davies et al., 2006).
Burgess and Greaves (2013) detected troubling racialized patterns when comparing blinded versus nonblinded assessments of ethnic minority students’ work. Likewise, Gershenson et al. (2016) found that a Black student receives systematically lower expectations from non-Black teachers than Black teachers, particularly for male students in math. Their work is part of a growing body of literature that documents the importance of students being taught by teachers of their same race to academic and behavioral outcomes (e.g., Dee, 2004, 2005; Egalite et al., 2015; Gershenson et al., 2018; Holt & Gershenson, 2019). We cannot conduct a so-called race-match analysis because our data set does not include teacher demographics. However, given the potential for high expectations to improve student outcomes, we do explore differential target setting by student race/ethnicity.
Sample and Methods
Analytic Sample
The SLO process began in 2011–2012 as part of a TIF Initiative, which was targeted to high-needs schools. Of the district's 64 schools, 23 met the “high-needs” TIF definition—more than 50% of the school’s students are FRPL-eligible—and eight schools were selected to participate (five elementary, two middle, one high). In this study, we examine all learning targets set in the seven SLO schools serving Grades 4 through 8 (i.e., all schools except the high school).
In Table 1, we present average pretreatment means (left) and trends (right) in school-level demographics and standardized test scores from 2007–2008 through 2010–2011—the pre-SLO period—for the group of seven SLO schools. To provide the reader with a sense of how these schools compared with other district schools serving Grades 4 through 8, we also present these descriptives for the other 16 high-needs schools, as well as the remaining 34 K–8 schools. Table 1 shows that the seven SLO schools served a higher percentage of FRPL-eligible students than did even their other high-need counterparts. The SLO schools were also, on average, lower performing on state tests than other schools in the district.
Compare Seven SLO Schools to District’s 16 Other “High Needs” Schools, and All Other District Schools Serving Grades 4 to 8, Preonset of SLO System in 2012
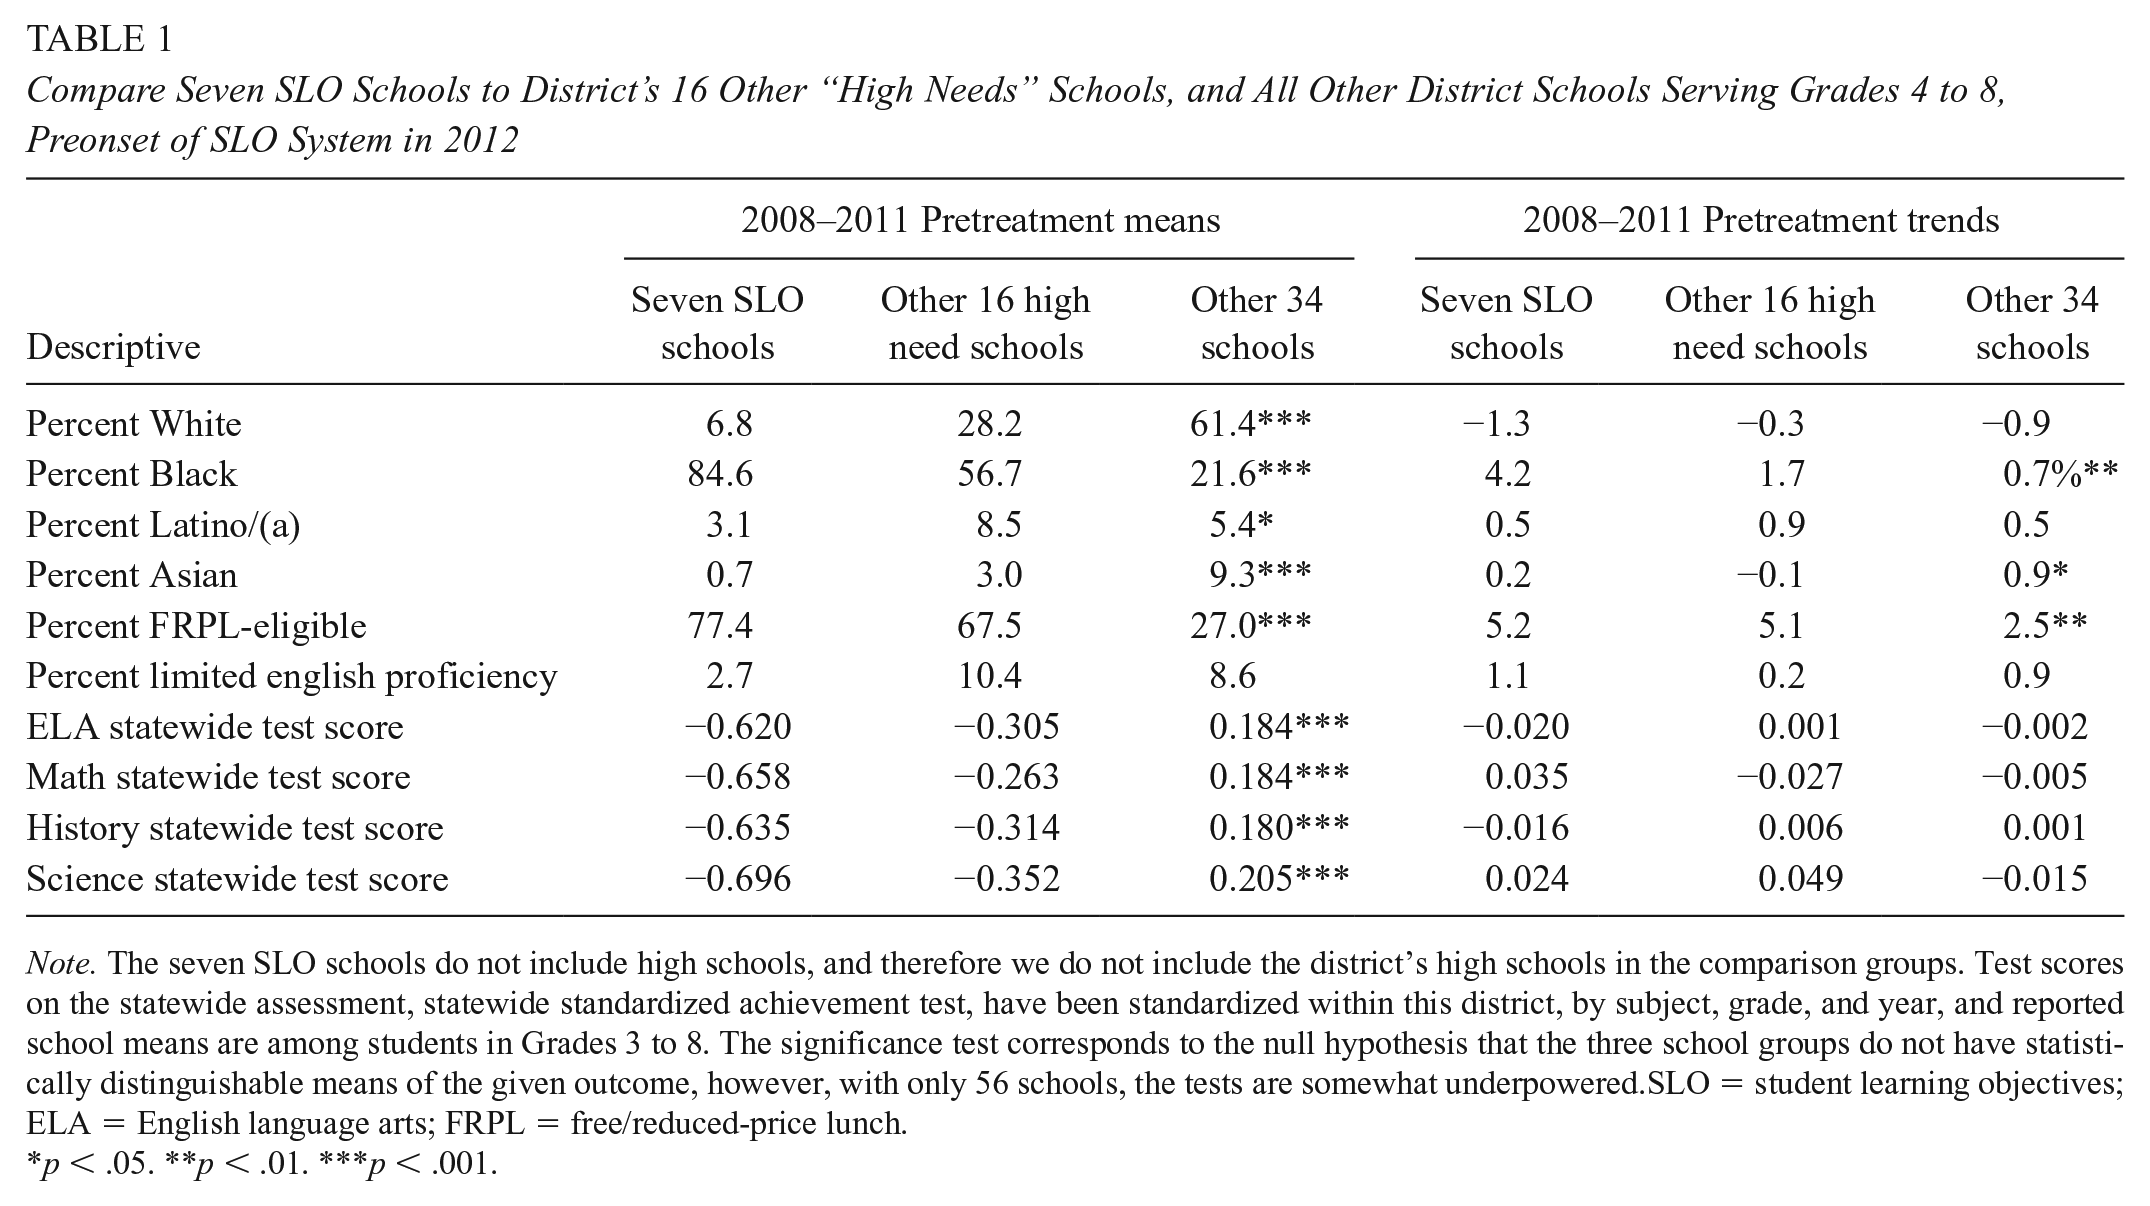
Note. The seven SLO schools do not include high schools, and therefore we do not include the district’s high schools in the comparison groups. Test scores on the statewide assessment, statewide standardized achievement test, have been standardized within this district, by subject, grade, and year, and reported school means are among students in Grades 3 to 8. The significance test corresponds to the null hypothesis that the three school groups do not have statistically distinguishable means of the given outcome, however, with only 56 schools, the tests are somewhat underpowered.SLO = student learning objectives; ELA = English language arts; FRPL = free/reduced-price lunch.
p < .05. **p < .01. ***p < .001.
In Table 2, we present counts of unique students and teachers in the analytic sample, overall, by year, grade, school, and—for students—by race/ethnicity (the data set does not include teacher demographics). The teacher counts capture the unique number of teachers who are responsible for teaching and setting targets for students. In Grades 4 and 5, the number of unique ELA and math teachers is exactly the same because a single teacher provides all four targets (both tests, both subjects). In Grades 6 through 8, a different teacher provides a students’ two math targets (both tests) than the teacher who provides that students’ two ELA targets. For this reason, we separately analyze elementary and middle schools when looking across all four targets. In this sample, no students were assigned to the same teacher for more than 1 year.
Counts of Unique Students and Teachers, Overall and by Year, Grade, School, and Student Race/Ethnicity
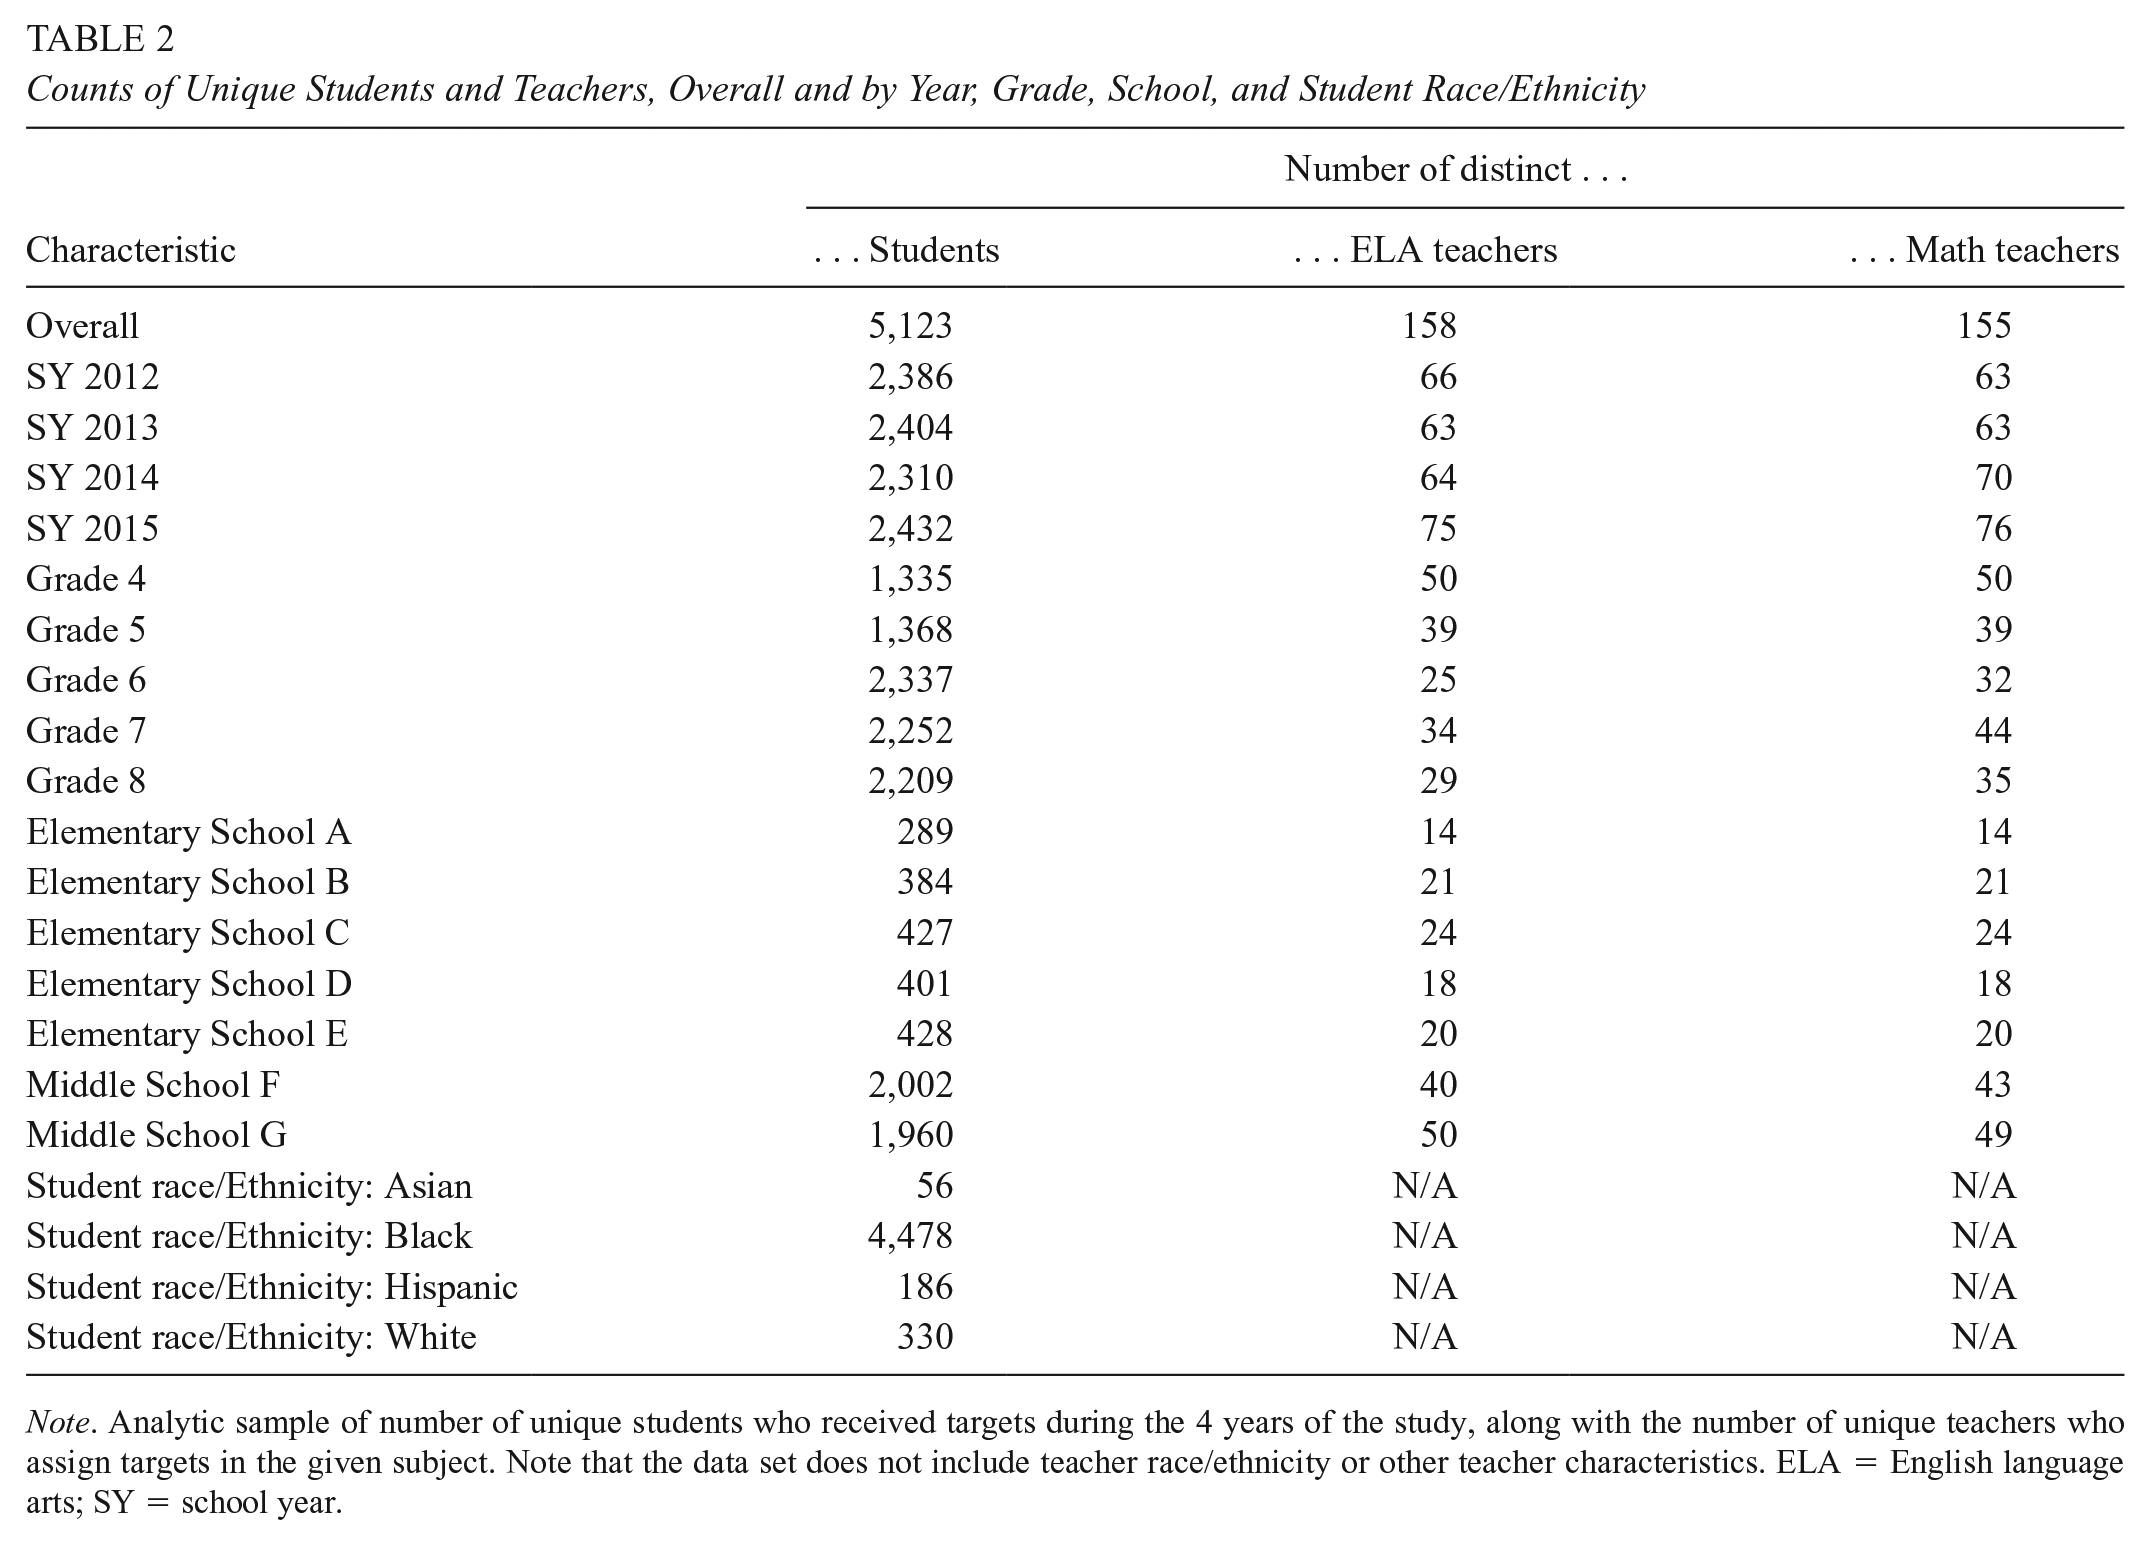
Note. Analytic sample of number of unique students who received targets during the 4 years of the study, along with the number of unique teachers who assign targets in the given subject. Note that the data set does not include teacher race/ethnicity or other teacher characteristics. ELA = English language arts; SY = school year.
Methods
Research Question 1: Target-Setting Descriptives
We begin by presenting descriptives for target setting in the current district. This includes the number of targets set and met overall and by test/subject, year, grade, and school. We next compare the target scores teachers set for their students on each of the four assessments to students’ actual scores on those EOY assessments. This allows us to introduce two key terms to characterize the targets: the “accuracy” and “ambitiousness” of each target set for test t for student i. In terms of capturing accuracy, the closer a start-of-year target is to the EOY actual score, the more accurate the target was:

In Equation (1), accuracy is equal to the EOY target score set for test
To capture target ambitiousness, we begin by estimating an expected EOY score based on student prior year achievement and characteristics. 13 The higher a teacher sets the target for an EOY test score, relative to this statistical prediction, the more ambitious the target:

This comparison captures whether targets are above or below what students would be expected to score based on prior performance. We describe targets along these two dimensions overall, and whether targets are becoming more accurate or ambitious across over time. Finally, we examine variation in target-setting behaviors at the school and teacher level.
Research Question 2: Do Targets Predict EOY Scores?
For two observationally similar students of the same prior skill, do we descriptively observe that having a higher target set at the start of the current year predicts higher test score performance at the end of the year? If a positive relationship exists, it suggests one of two mechanisms—or both—could be at work: One possibility is that teachers are able to bring to bear unobservable (to the district), local evidence to anticipate differences in how two students who are observationally similar will perform at the end of the year and set targets accordingly. Another possibility is that the experience of being given a higher target—that is, higher expectations—stimulates test score gains. If we find no conditional association between targets and scores, it suggests neither of these mechanisms is at play.
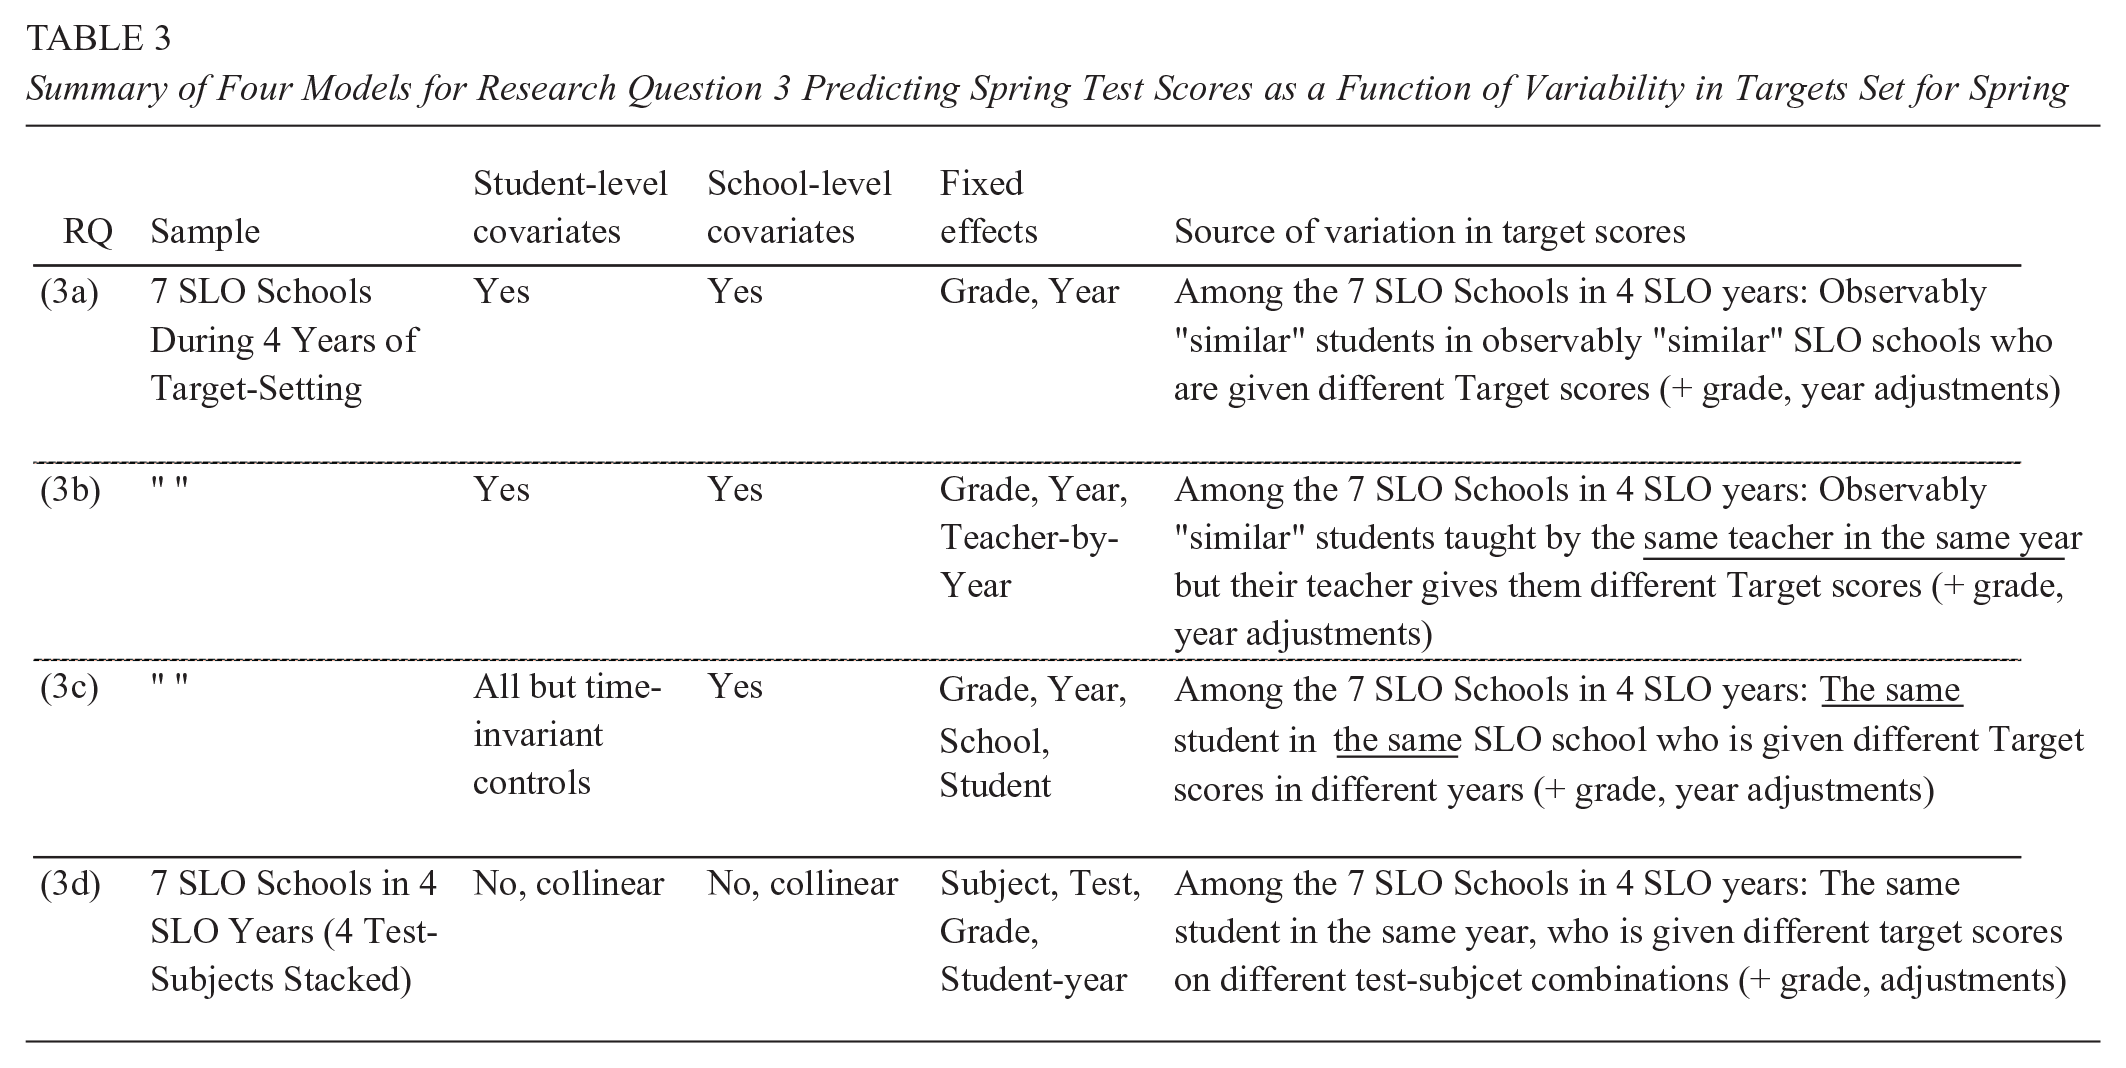
We adopt the following model to address this question, separately for each of the four tests on which targets are set for each student (MAP and SSAT, in math and ELA):

For instance, let
In addition to the covariate-adjusted model (3a), we explore three other iterations of this model: The first includes teacher-by-year fixed effects (
Summary of Four Models for Research Question 3 Predicting Spring Test Scores as a Function of Variability in Targets Set for Spring

Research Question 3: Differential Target-Setting by Race/Ethnicity
In light of research suggesting that teacher expectations may be susceptible to bias, and those expectations may in turn affect student outcomes, we explore whether teachers set lower targets for otherwise similar, non-White students. We begin with an overly-simplistic approach, predicting learning targets,

Equation (4a) provides a baseline for establishing observed differences in targets set for various race/ethnic groups relative to White students (the
However, if non-White students are systematically assigned lower targets even when they have comparable prior achievement to their White classmates, then we should be more concerned about racial bias in target-setting. We therefore modify Equation (4a) by sequentially adding a vector of up to four prior-year test scores in both tests/subjects,
Results
Research Question 1: Target-Setting Descriptives
Targets Set and Percentage Met
The sheer number of targets set in these seven schools over 4 years underscores the magnitude of the SLO system undertaking: In Table 4, we show that between about 8,000 and 9,000 individual student learning targets were set per test and subject from 2011–2012 through 2014–2015, for a total of approximately 34,000 target scores. Table 4 also presents the percentage of those targets that were met, the average target score (in standard deviation [SD] units), and the average EOY score received. EOY scores are low—around −0.30 and −0.70 SDs—which reflects the fact that the SLO schools were particularly low performing (see Table 1).
Number of Targets Set and Percentage Met Overall and by Year, Grade, and School

Note. Descriptive statistics are shown separately for SSAT tests (upper) and MAP tests (lower) and by subject (ELA left, math right). Results are reported overall and also disaggregated by year, grade, and SLO school. Columns report (A) the number of targets set for the given test and subject, (B) the percentage of those targets that were met, (C) the average target score set (after converting them to be standardized at the subject-grade-year), and (D) the average standardized EOY observed test score. A standardized score of −0.50, for example, would indicate that the group of students performed, on average, 50% of an SD lower on the given test than their peers district-wide, in the same subject, grade, and year. SLO = student learning objectives; ELA = English language arts; SY = school year; EOY = end-of-year; SSAT = statewide standardized achievement test.
By examining the percentage of targets that students ultimately met, we get a first glimpse at whether teachers were willing and/or able to set difficult-to-reach targets. For the SSAT test (upper panel of Table 4), we find that 43% of targets in ELA were met (61% in math). For the MAP test, 60% (ELA) and 65% (math) of targets were met. Overall, we see that students were more likely to meet math targets than ELA targets on both tests. We also disaggregate results in Table 4 by school year, grade, and school. There is some evidence that schools did not all approach target-setting uniformly. For SSAT ELA, only 37% of students met their targets in School B, while 49% of students in School E did so. To take another example, while 53% of School G students met their math MAP targets, 84% of students in School B did so. We do not see evidence that particular schools appear to have consistently high or low target attainment rates across the four assessments. For instance, while School B has the lowest rate of target attainment on the ELA SSAT test (and second to lowest on the SSAT math), School B has the highest rate of target attainment on the both the ELA and math MAP assessments.
The grade, year, and school means presented in Table 4 could obscure meaningful trends in target-setting over time in school-grades. We are interested in examining within- and between-school variance in target-setting, however, a formal decomposition of variance is underpowered given that there are only seven schools. Figure 2 (SSAT) and Figure 3 (MAP) provide a visual look at the trends in percentage of targets met, as well as within-school variation across grades and subjects.

Percentage of statewide standardized achievement test (SSAT) targets met over time, by school and grade.

Percentage of Measures of Academic Progress (MAP) targets met over time, by school and grade.
Taken together, the results in Table 4, Figure 2, and Figure 3 paint a picture of SLO target setting that generally did not guarantee that students would meet their targets. We can clearly infer from this that teachers either did not or could not act purely in strategic self-interest. We next examine the extent to which teachers appear able to select targets for their students that are near their EOY scores.
Target Accuracy
Recall that we characterize targets set at the beginning of the year for a given test as more accurate when they turn out to be closer to the actual EOY score. We are particularly interested in whether targets become more accurate as teachers gain experience with the SLO target-setting process. In Table 5, we therefore present descriptive statistics on the distribution of target accuracy,
Descriptive Statistics for Accuracy of Targets (in SDs), by Test, Subject, and Year

Note. Accuracy measures are calculated by subtracting the student’s observed EOY score from the target score set by the teacher for that student. Negative values of accuracy indicate that the target was lower than subsequently observed actual score. Positive values indicate that the target was higher than the actual score. Both the EOY observed and target scores have been standardized within the district at the subject-grade-year level. Results are shown separately for SSAT tests (upper panel) and MAP tests (lower panel) and by subject (ELA on left, math on right). ELA = English language arts; EOY = end-of-year; SSAT = statewide standardized achievement test; MAP = Measures of Academic Progress.
On average, teachers appear to be able to set target scores that are usually less than 20% of an SD away from scores the students ultimately received (Table 5). For instance, the average accuracy of 2011–2012 targets for the ELA SSAT was 0.01—very close to zero. On the other hand, the average accuracy of 2013–2014 targets for the math SSAT exam was −0.52, suggesting that teachers generally underestimated those EOY scores by about half an SD that year. In most cases, we see that accuracy scores tend to be negative. The exception to this is for setting targets in ELA on the SSAT, wherein teachers overestimated actual scores, on average, in all 4 years. The 10 to 90 percentile range for accuracy is ±0.93 SDs for ELA SSAT targets—that is, some teachers’ targets can be up about 1 SD above or below the student’s observed score. We see a similar range in accuracy across tests, subjects, and years.
We were particularly interested in whether accuracy improved over time, however, the results in Table 5 suggest this was not the case. For none of the four tests do we see a pattern of mean accuracy approaching closer to zero with additional years of the SLO policy. That said, we do observe relatively strong correlations (between .50 and .78) between the targets that teachers set and the scores students ultimately receive (last column of Table 5); teachers were able to set targets that generally aligned with how students would perform at the end of the year.
Target Ambitiousness
Recall that we define ambitiousness of a given target,

Distributions (1st–99th percentile range) of target ambitiousness (in SDs) separately for four tests.
Given that part of the logic behind setting learning objectives is to formalize reasonable but high expectations, we were interested to find that the typical target tended to not be particularly ambitious (close to zero). With the exception of SSAT ELA, we show in Figure 4, that median ambitiousness is close to zero and even negative for MAP math (underestimating EOY scores). On the other hand, the distribution of target ambitiousness for the SSAT ELA test is centered right of zero (median = 0.27 SDs), indicating that the median teacher sets targets for this test that are nearly 30% of an SD higher than students’ statistically expected scores.
We also find quite large variation in ambitiousness, particularly for SSAT math targets (SD of ambitiousness = 0.83). Some targets are therefore quite ambitious (e.g., target scores between 1.2 and even 2 SDs higher than the statistically expected score), while other targets are equally unambitious. Some teachers certainly are setting “reach” targets: For the SSAT, 30% of the ELA targets were at least half an SD above statistically expected scores (24% for math). For the MAP test, we observe slightly fewer targets at least half an SD above statistically expected scores: 19% for ELA and only 11% for math.
We are particularly interested in whether teachers adjust the ambitiousness of the targets they set as they gain more experience with the SLO process. One could imagine that teachers feel compelled to set less ambitious targets once they realize that most of their students are not reaching them (in order to obtain larger financial bonuses). On the other hand, it is also possible teachers become more willing to push the envelope and set more ambitious goals as they become more comfortable with the process and recognize that they typically are able to set accurate goals.
We investigate this in Figure 5 by examining temporal patterns in average target ambitiousness, separately for three groups of teachers: (a) those who received no bonus in the first year they set targets (in red) because less than 50% of their students met their target, (b) teachers who received between $2500 and $4000 in their first year (orange) because between 50% and 80% of their students met their target, and (c) teachers who received $4000 to $5000 in their first year (green) because 80% or more of their students met their target. We display two interrelated factors in Figure 5: The Y-axis is the average target ambitiousness (in SDs) of teachers in the given group and year, with the Y = 0 dashed line representing targets that were equal to the score a statistical model would predict. Then, each data point is labeled with the percentage of targets that were met in the given group. Here we can see how target performance tracked over time with the ambitiousness of targets.

Mean ambitousness of targets and mean percentage of targets met over time (data point labels), separately by teachers’ bonus results in their first year of target-setting.
If one could hope for any pattern, it would perhaps be to see teachers increasing the ambitiousness over time but simultaneously maintaining or even increasing the percentage of students who meet targets. We do not consistently observe this. Take as an example, SSAT ELA: Teachers who did not receive a bonus in their first year of target-setting (red) tended to set ambitious goals, but only 25% of their students’ targets were met. On the other hand, among the teachers who received large bonuses in their first year (green), those targets tended to be less ambitious (below Y = 0) but on average 97% of targets were met. We focus on how those three groups of teachers approached target-setting over the next 3 years. Unique to SSAT ELA, we see that all three groups of teachers notably increased the ambitiousness of their targets in Year 2—even those who did not receive a bonus in Year 1. In all three groups, only an average of 22% to 33% of targets were met in Year 2. There seems to be a downward correction in Year 3 and 4, with all three groups then lowering the ambitiousness of their targets (though all still above Y=0) and therefore having more students meet their targets.
We see a clearer pattern of adjusting targets over time for SSAT math. Teachers who received large bonuses in Year 1 (green) set unambitious targets—about half an SD below statistical predictions, on average—and tended to have nearly all students reach their targets. This group adjusted their target-setting in Year 2, making their targets somewhat less unambitious, at the cost at having fewer students meet those targets (76%). Only by the fourth year does this group set targets with average positive ambitiousness. The opposite occurred for teachers who did not receive a bonus in their first year (red). They initially set very ambitious targets—their targets were, on average 0.60 SDs higher than statistical predictions—but on average only 18% of their students met those targets. These teachers appear to recalibrate in Year 2, by lowering target ambitiousness (though still positive) and therefore having 58% of those targets met. In MAP, we see similar patterns: Teachers who receive the largest bonuses (green) in their first year (due to relatively unambitious targets that were almost always met) tend to correct somewhat, by making targets less unambitious over time. In MAP ELA, teachers who initially received no bonus (red) set average targets in Year 1 above statistical predictions but subsequently set less and less ambitious targets over time.
Figure 5 paints a picture of SLO target-setting that involved a certain learning curve, in which teachers struggled to find the balance between setting ambitious targets while maintaining a high percentage of their students meeting those goals. We do see evidence that teachers whose targets seemed clearly too low in their first year adjust those targets upward in later years, despite a financial disincentive to do so. However, with the exception of SSAT ELA, we also observe that the average ambitiousness of targets often stayed near or below 0. That is, while it was relatively common to observe average ambitiousness in the −0.20 SD range, it was much less common to see averages in the +0.20 range.
Target-Setting and Teacher Value-Added
Because the practice of setting targets and adjusting instruction toward achieving those targets is part of the professional practice that constitutes good teaching, one might hypothesize that more effective or experienced teachers set targets that are more accurate and/or ambitious. The only imperfect proxy for teachers’ effectiveness available to us comes from estimating teacher VAMs. 16 Unfortunately, this data set does not contain teacher years of experience information (or teacher demographics).
We do not find evidence that teachers with higher VAMs (in the preceding school year) set more accurate targets. The correlations between teacher VAMs and the accuracy of targets are
Research Question 2: Do Targets Predict EOY Scores?
In unconditional models (not shown), we find that students with higher targets have higher standardized achievement scores on the order of 40% to 70% of an SD for every 1 SD increase in target scores. In Table 6, we go on to compare yearly observations of students who are similar on prior achievement, student and school covariates, and are in the same grade and year (Model 3a). For reasons that are not observed to the researcher, one of those students is assigned a higher learning target at the start of the year than their counterpart. We further condition on being taught by the same teacher in the same year in the given subject (Model 3b), and then leverage variation in targets set across years for the same student (Model 3c).
Association Between Fall Targets Set for Spring Scores and Subsequent Spring Test Scores, Among Similar Students, Students With the Same Teacher, or for the Same Student Over Time (Prescores Imputed)

Note. Analytic sample comprises students in the seven district schools that implemented the SLO process in 2011–2012 through 2014–2015. All models have a baseline covariate vector (unless collinear with the fixed effects) that include grade and year fixed effects, a vector of four prior achievement scores (two subjects in each of two tests in the prior year), student covariates, and school covariates. Model 3a only includes that baseline covariate vector, Model 3b adds teacher-by-year fixed effects, and Model 3c replaces time-invariant student covariates with student fixed effects. Both the primary predictor of interest, the target score set in the fall for the EOY (spring) test and the outcome, the observed EOY test scores have been standardized (i.e., we subtract the district-wide mean and standard deviation (within subject-grade-year) of the EOY scores in their original metric from all target and spring scores. For the approximately 10% of observations missing at least 1 of the 4 prior-year achievement scores, we impute the mean and include a dummy variable indicating that the value was originally missing. As described in text, results are not substantively different if we instead exclude cases with missing data. ELA = English language arts; EOY = end-of-year; SSAT = statewide standardized achievement test; MAP = Measures of Academic Progress; SLO = student learning objectives; FE = fixed effects.
p < .05. **p < .01. ***p < .001.
We generally find that, even for two otherwise similar students, receiving higher targets is associated with higher EOY scores. Controlling for prior scores, demographics, and school setting characteristics (Model 3a), two students who have a 1 SD difference in the SSAT ELA target scores that teachers set for them tend to exhibit differences in EOY scores of about 24% of an SD (17% of an SD for SSAT math). Those associations are a little stronger for the MAP test: Estimates from Model (3a) indicate that a 1 SD difference in target scores is associated with about 36% and 47% of an SD in EOY test scores in ELA and math, respectively. In Model 3b, we examine the correspondence between targets set and spring scores achieved among students taught by the same teacher in the same year. Again, the coefficients are large and statistically significant, ranging from 24% of an SD (SSAT math) to as high as 43% of an SD (MAP math).
In Model (3c) in Table 6, these associations remain significant but are smaller in magnitude, in the range of 4% to 13% of an SD difference in EOY scores per 1 SD difference in target scores. Even once we hold time-invariant student-level factors constant by comparing the same student’s EOY performance over time as they receive different targets in different study years, we generally observe that higher targets correspond with higher EOY scores. However, it still may not be the case that receiving higher targets caused students to have improved EOY test scores; rather, their teachers could be considering information about the student’s context in each year to adjust targets accordingly.
Because a primary confounder in the analysis above is that time-varying contextualizing factors may be observed by the teacher when they set annual goals but are not observed by the researcher, we also explore whether a student in any single year performs more strongly on the assessments for which he or she is given higher targets (Model 3d). As discussed above, this approach may still miss systemic confounders in target-setting across tests and subjects, but at least it attends to explanations like a student having a particularly hard year at home. Because we stack targets and EOY achievement outcomes across tests and subjects within student-year, results in Table 7 are no longer shown separately across these dimensions. We do, however, show the results overall (Column 1), and then separate the sample between elementary (Column 2) and middle schools (Column 3). The logic here is that variation within student-year target-setting may be a little different when the same teacher sets all four of the targets (i.e., in elementary school where the homeroom teacher is responsible for both math and ELA), versus in middle school grades where a separate teacher sets the math versus ELA targets.
Association Between Fall Targets Set for Spring Scores and Subsequent Spring Test Scores Observed, Across Different Tests for the Same Student in the Same Year (Within-Student, Pooled Sample)
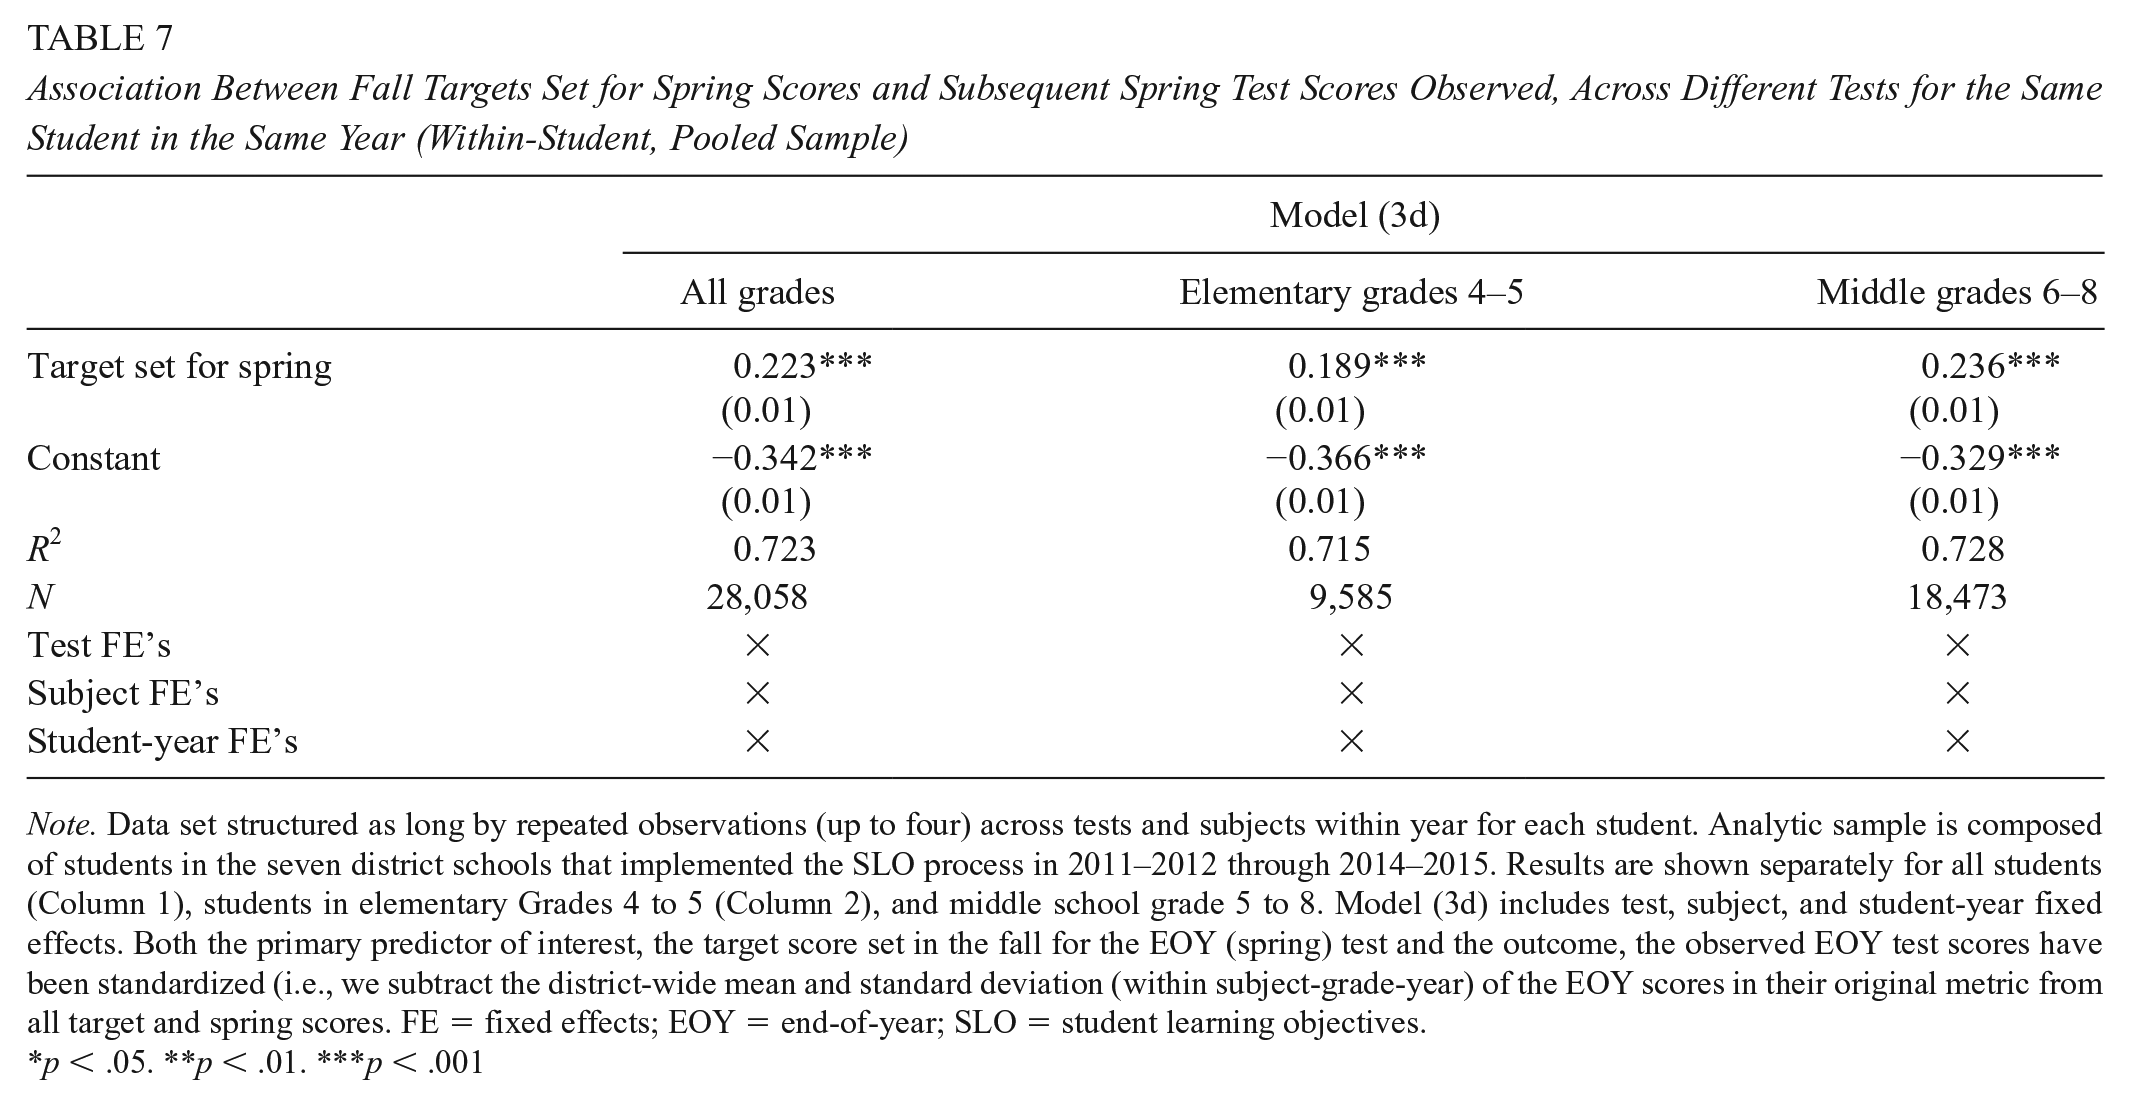
Note. Data set structured as long by repeated observations (up to four) across tests and subjects within year for each student. Analytic sample is composed of students in the seven district schools that implemented the SLO process in 2011–2012 through 2014–2015. Results are shown separately for all students (Column 1), students in elementary Grades 4 to 5 (Column 2), and middle school grade 5 to 8. Model (3d) includes test, subject, and student-year fixed effects. Both the primary predictor of interest, the target score set in the fall for the EOY (spring) test and the outcome, the observed EOY test scores have been standardized (i.e., we subtract the district-wide mean and standard deviation (within subject-grade-year) of the EOY scores in their original metric from all target and spring scores. FE = fixed effects; EOY = end-of-year; SLO = student learning objectives.
p < .05. **p < .01. ***p < .001
In Table 7, we again see evidence that higher target scores correspond to higher EOY scores. In this case, we observe that a 1 SD positive difference in a student’s targets set across tests/subjects in the same year is associated with a 22% positive difference in EOY scores. It is worth noting that observing a 1 SD difference in targets set across the four tests for the same student in the same year is not uncommon; the average range across the tests is 1.4 SDs. Results are similar in both the elementary grades in which the same teacher is providing those four different target scores (coefficient is 0.19 SDs) and in middle grades in which different teachers provide the ELA and math targets (coefficient is 0.24 SDs).
Research Question 3. Differential Target-Setting by Race/Ethnicity
One might be concerned that not all students in the district would have equal access to these potential benefits, or that teachers are not able to make these predictions equally well for all students. This could arise if teachers possess implicit or explicit biases about the capabilities of students of different races, e.g.,—a phenomenon that can arise when one does not attribute the observable differences in outcomes by race group to structural inequality but instead to underlying capacity. In Table 8, we present results across Models 4a through 4d, separately for SSAT targets (upper panel) and MAP targets (lower), and ELA (left) versus math (right). Again, we standardize the
Conditional Differences in Targets Set by Race/Ethnicity, Separately for Four Tests

Note. The outcome, target score set in the fall for the EOY (spring) test, has been standardized (i.e., we subtract the district-wide mean and standard deviation [within subject-grade-year] of the EOY scores in their original metric from all target and spring scores). Model (4a) only includes grade and year fixed effects. We add a vector of prior achievement in both tests in both subjects in 2 prior years (Model 4b), a vector of student demographics other than race including gender, free or reduced-price lunch status, and limited English proficiency (Model 4c), and finally teacher-by-year fixed effects (Model 4d).ELA = English language arts; EOY = end-of-year; SSAT = statewide standardized achievement test; MAP = Measures of Academic Progress; SLO = student learning objectives; FE = fixed effects.
p < .05. **p < .01. ***p < .001.
According to the unconditional Model (4a) in Table 8, we find large, negative raw differences between the targets set for non-White students relative to White students across all racial/ethnic groups and all test-subject combinations (all coefficients are also statistically significant, with the exception of the difference in targets set for Latinx students, relative to White students on the SSAT math test). However, when we add the vector of previous achievement test scores to the equation (Model 4b), almost all the observed differences in targets set for White and non-White students are no longer statistically significant and are much closer to zero (i.e., no differences in targets set). This remains the case when we add the set of student characteristic controls in Model (4c) and teacher-by-year fixed effects in Model (4d). It appears that Black and Latinx students in this district do not receive systematically different learning targets than their White counterparts when they possess similar test score profiles.
The possible exception to the lack of significant differences in racial groups’ targets received is for Asian students on both ELA tests (but neither math test). For the ELA targets that Asian students receive in this district, we observe that in every model, their targets are significantly lower than their otherwise similar White counterparts. For the ELA targets on the SSAT, Asian students received target scores that were 23% of an SD lower than White students with the same prior test scores, other student characteristics, and in the same school (Model 4d). The Asian White differences from Model (4d) are even larger on the MAP test for ELA, where we observe targets 47% of an SD lower for Asian students than their White counterparts. We find the lower targets for Asian students on ELA tests to be concerning and warranting of further investigation, though the population of Asian students in this district is small (<10%).
Conclusions
We explore a SLO system as implemented in one southeastern school district over a 4-year period. SLO systems serve many purposes. For instance, SLOs can address the limitation of using VAMs to evaluate teachers, which can only be calculated in tested subjects and grades. Our results come from SLOs in tested subjects/grades, and it is important to acknowledge that target-setting behaviors might be different in untested grades. The act of setting targets itself could change how teachers use data to inform their practice, monitor their students’ success, and reflect on what seems to work in their classroom. The SLO theory of action posits that, through thoughtful reflection on data and/or by setting high expectations for all students, learning outcomes will improve over time.
While a burgeoning literature describes the implementation process for SLO systems and documents the many challenges that often arise, there is little evidence about actual teacher practices in target setting. Teachers face a choice: They can set for ambitious targets in hopes that doing so improves their students’ outcomes, or they can set less ambitious targets that are easier to meet, which in turn increases bonus payments. A priori, we might anticipate a tendency to act in one’s own self-interest, and given that teaching is generally not a well-paid occupation, an up to $5,000 annual bonus may feel particularly high-stakes for teachers. Moreover, we also might expect teachers to hone their ability to set accurate and/or attainable goals as they become familiar with the system. Another possibility is that, with the limited information at their disposal in the fall, teachers are unable to predict EOY test scores with the degree of accuracy that this SLO system presumes is possible. In any of these scenarios, the hypothesized mechanisms for SLO systems would be undermined.
We find that many teachers set targets for their students that they did not always attain. Depending on the test, teachers only met, on average, between 43% and 65% of the learning targets they selected for their students. Teachers exhibited the ability to establish targets that broadly corresponded to later performance, generally within 0.30 SDs of EOY scores. However, the targets teachers set for students varied dramatically in terms of their ambitiousness. For instance, while 29% of targets set for the SSAT ELA were at least 0.50 SDs above a regression-adjusted predicted score, we see equal numbers of targets that were at least 0.50 SDs below the predicted scores. We also must grapple with the finding that, even when teachers set targets that were lower than would be expected based on prior performance, they often could not get students to meet those so-labeled unambitious targets (see Figure 5). We nonetheless find evidence supporting the idea that students have higher EOY test scores when teachers set higher targets for them.
Finally, if racial/ethnic biases are embedded within target setting, which in turn may affect student outcomes, then we worry that SLO processes could inadvertently exacerbate achievement disparities. We do not find, among students of the same prior skill, that White, Black, or Latinx students receive systematically different targets from one another. There is some concerning evidence that suggests the Asian students receive lower targets on ELA tests than their White counterparts (though not on math tests). These findings warrant continued attention, but they should be interpreted with caution since only 6% of the students in this district are Asian.
Taken together, the current study takes a step forward in our understanding of how teachers might react to and implement a SLO process. Because teachers’ success in reaching these objectives often plays a role in how they are evaluated—and sometimes how much they are paid—it is not at all clear how teachers will approach this task. Given the increasing use of SLOs, both as a complement to and substitute for other measures of teaching effectiveness, it is important for the field to have empirical evidence about whether the theory of action behind SLO systems is consistent with SLO implementation in practice.
Footnotes
Acknowledgements
We are grateful Martin West and Mark Long for their feedback on drafts of this article presented at the APPAM and AEFP conferences, respectively. Support has also been provided by IES Grant R305B100009 to the University of Virginia. The views expressed in the article are solely those of the authors. Any errors are attributable to the authors.
Notes
Authors
ALLISON ATTEBERRY is an assistant professor of research and evaluation methodology at the University of Colorado Boulder School of Education. Her research focuses on policies and interventions that are intended to help provide effective teachers to the students who need them most.
SARAH E. L