
Abstract
Does data use make a difference in student achievement? Despite the field’s optimism on this matter, relatively few studies have attempted to quantify the effects of data use. These studies have often used the presence of a data use intervention (e.g., a data system or data coaching) as a proxy for use, as opposed to tracking teachers’ direct interactions with data, via data system click logs, for example. Accordingly, the present study sought to address this methodological gap by exploring the 2-year effects of data use through a multilevel cross-classified model of teachers’ system interactions and student achievement. A significant relationship was found between system use and elementary reading, but no significant relationships were found for elementary math, junior high math, or junior high reading. The implications of this study on how to conceptualize and measure use, as well as how to support practitioners, are discussed.
Keywords
F
Although it is plausible that such interventions might support teachers and improve student outcomes, research has not been especially successful in establishing such links. For example, simply putting more data into the hands of teachers has not been found to result in achievement gains (Henderson, Petrosino, Guckenburg, & Hamilton, 2007; Konstantopoulos, Miller, van der Ploeg, & Li, 2016; May & Robinson, 2007). Studies of other interventions have examined the effects of coupling increased access to data with interpersonal supports, such as professional development or consulting (Carlson, Borman, & Robinson, 2011; Lai, McNaughton, Timperley, & Hsiao, 2009; Quint, Sepanik, & Smith, 2008)—with mixed results. Some of these studies have found that student achievement gains can be sustained or replicated (Lai, Wilson, McNaughton, & Hsiao, 2014; McNaughton, Lai, & Hsiao, 2012), but others have not (Slavin, Cheung, Holmes, Madden, & Chamberlain, 2013). Thus, it is yet unclear exactly how best to support teachers in using data.
This body of research has tended to focus on whether data were generally available and whether teachers had encouragement to use data. Missing in this picture is teachers’ direct contact with data. Research also needs to examine the extent to which teachers spend time accessing and engaging with data. Today, such interactions often take place with computer data systems (Means, Padilla, DeBarger, & Bakia, 2009; Tyler, 2013; Wayman, Snodgrass Rangel, Jimerson, & Cho, 2010). Through these systems, teachers are able to pursue particular matters of interest, looking at the big picture of classroom performance, drilling down to individual student performance, or connecting to outside resources.
Accordingly, the purpose of this study is to examine the 2-year effects of the sustained use of a computer data system on student achievement. In doing so, we draw on system use logs to capture teachers’ interactions with data. This study is guided by the following research question: Did teacher system use over two consecutive years correlate with student achievement?
Literature Review
In what follows, we describe the conceptual underpinnings to this study. First, we review the literature linking data use to student achievement. Second, we review the literature linking data use to student achievement specific to computer data systems.
Data Use and Student Achievement
Data use is premised on the notion that teacher decision making might be improved when it is informed by data about students. This idea is not new, and numerous scholars have pointed toward the potential benefits of data use (Datnow & Park, 2014; Kerr, Marsh, Ikemoto, Darilek, & Barney, 2006; Supovitz & Klein, 2003; Wayman, Cho, Jimerson, & Spikes, 2012). For example, teachers might rely on data to be better informed about decisions relating to classroom instruction, school programs, professional development, or school goals. Despite claims about the potential benefits of data use, relatively few studies have been aimed at quantifying the impact of data use on student achievement outcomes. Some lines of research have found data use to have a slight positive influence on student achievement, while others were unable to find any influence. In the following paragraphs, we review studies that examined this relationship without focusing on computer data systems; in the next section, we review studies that have examined this relationship while focusing on computer data systems.
One set of such studies involved the learning schools model (LSM) for whole-school improvement in New Zealand (Lai, McNaughton, Amituanai-Toloa, Turner, & Hsiao, 2009; Lai, McNaughton, Timperley, & Hsiao, 2009). These studies targeted seven schools and their reading achievement. The first phase of the LSM intervention involved engaging school leaders and teachers in analyzing student performance data. The second phase involved targeted professional development, and the third involved institutionalizing changes in practice over time. LSM was found to improve reading achievement during the 3 years of intervention as well as during the 2 years following the intervention. These gains occurred cumulatively, with rates of gain per year between 0.34 and 0.50 stanines. Later, LSM was replicated across other school settings and student age groups, with similar results (Lai et al., 2014; McNaughton et al., 2012). Although these studies highlight the benefits of LSM, it is notable that data use was only one part of the overall intervention. The results from these studies do not isolate depths or effects of teachers’ engagement with data.
Another set of studies involved the Center for Data-Driven Reform in Education (CDDRE; Carlson et al., 2011; Slavin et al., 2013). These studies reported findings from experimental investigations of a benchmark assessment initiative implemented in 59 districts, selected randomly across seven states. Similar to LSM, the CDDRE intervention proceeded in phases. The first year involved helping educators to develop and administer quarterly benchmark assessments. CDDRE provided district personnel with guidance in how to use benchmark assessment data to identify areas of curricular and programmatic weakness. In the second and third years, school and district leaders were expected to seek out and implement reforms that would address needs identified in the data. After 1 year of the CDDRE initiative, Carlson et al. (2011) reported a small positive statistically significant impact of the program on math achievement and a positive, though not statistically significant, impact on reading achievement. After 4 years of the CDDRE intervention, Slavin et al. (2013) found stronger effects on elementary reading and math achievement. However, effects on middle school achievement were less substantial, with benefits to reading and math achievement found only in the 2 years of intervention. As with the LSM studies, the CDDRE studies highlight the potential benefits of having participated in the overall phased intervention that included data use. These studies do not suggest that simply improving access to data might produce achievement gains.
Finally, four other studies are known to have examined issues linking data use to student achievement. These examined state-level initiatives. For example, Marsh, McCombs, and Martorell (2010) examined the implementation of instructional coaches in Florida middle schools. Eight school districts and their implementation of reading coaches were examined. This study found a statistically significant but practically small effect on reading achievement that was linked to the extent to which coaches reviewed and spoke to teachers about data. An increase of 1 SD in this support resulted in a 0.05 SD in reading achievement. Other coaching actions did not increase achievement; in fact, in the absence of conversations about data, one-on-one coaching had a negative impact on achievement.
Similarly, May and Robinson (2007) examined Ohio’s Personalized Assessment Reporting System (PARS) initiative, which was implemented in 51 randomly selected high schools in Ohio. The PARS initiative provided resources to students, parents, teachers, and administrators (e.g., analyses of data; online tutorials and training) to prepare students for the Ohio Graduation Test. Although PARS was found to have no impact for the majority of students, the authors did find statistically and practically significant effects for students who had initially failed the state test.
Two studies examined benchmark assessment initiatives in Massachusetts. Neither of these studies found statistically significant improvements to student achievement on state tests. In one study, Quint et al. (2008) explored the Formative Assessments of Student Thinking in Reading program, which periodically assessed reading comprehension among third- and fourth-grade students in a Boston school district. Similar to some of the studies described above, this initiative included direct consultancy to educators: Data coaches met with teachers to review student results and suggest interventions based on the data. However, Quint and colleagues point out that the relative infrequency of these meetings may have limited their effectiveness. In the other study, Henderson et al. (2007) examined schools across the state to determine if middle schools using quarterly benchmark exams showed gains in student performance after 1 year. Treatment effects may have gone undetected, however, due to lack of power: There were 22 program schools and 44 comparison schools. Furthermore, some comparison schools may have been using their own alternative approaches to benchmarking.
In considering this body of scholarship, it seems that the benefits of data use are yet to be well established. There might be some gains in some subject areas, but it is unclear if data use on its own is creating those gains. This research has tended to treat data use as only one dimension to an overall package of school reform activities (e.g., professional development; coaching or consulting) but has not directly examined the levels at which teachers access and examine data. One way to isolate the extent to which teachers engage with data would be to track the extent to which they interact with data in their computer data systems.
Today’s Computer Data Systems
It is impossible for data to be used if they are not made accessible; today’s computer data systems represent an attempt to provide access. The functionalities of individual data systems vary but may include the following: the integration of longitudinal data; the disaggregation of those data by class, student, or other demographic factors; and the projection of future performance (Brunner et al., 2005; E. Chen, Heritage, & Lee, 2005; Means et al., 2009; Wayman, Cho, & Richards, 2010; Wayman, Stringfield, & Yakimowski, 2004). Thus, the hope is that data systems will improve teachers’ analyses and uses of data. Guided by this premise, data systems have been commonplace schools in the United States for a number of years (Burch & Hayes, 2009; Means et al., 2009).
Despite the fact that these systems are commonplace and can provide a direct measure of data use, few studies have attempted to associate the use of a system with student achievement. Results from these studies have been mixed. For example, one set of studies involved school-level randomized experiments in Indiana. These studies assessed whether the treatment of having implemented an interim benchmark system affected mathematics or reading achievement. Analyzing data from the 2009–2010 academic year, Konstantopoulos, Miller, and van der Ploeg (2013) found that having access to the system had a positive but not consistently significant effect across all grade levels (K–8). This effect was larger in upper grades (3–8) than lower grades (K–2) and significant for mathematics in upper grades. Data from the 2010–2011 academic year (Konstantopoulos et al., 2016) provided a contrary account: No significant effects were found for students in Grades 3–8. Furthermore, a significant but negative effect was found in both reading and mathematics for students in lower grades (K–2). It is worth noting that although these studies divided schools into treatment and control groups, the context of Indiana was such that it is likely that control groups employed their own alternative approaches to interim assessments (Konstantopoulos et al., 2013). Furthermore, these studies simply compared schools that had access to the system with those that did not. Although a variety of school- and student-level covariates were considered, these studies did not measure teachers’ actual uses of or interactions with the system.
Thus, models are still needed that go beyond simply testing for school-level access to a system, providing measures of how deeply teachers engage with the system. One way to examine teachers’ direct interactions with a system is to examine computer use log data. Despite the potential importance of use log data, only one study employed use logs to examine the effects of system use on student achievement: Tyler (2013) examined the use of a dashboard system in one midsized urban district. Use of the dashboard system predicted neither achievement on state tests nor achievement on benchmark tests. Note that teacher use of this system was relatively sparse: Teachers spent a median of 3.5 hours on the system over the course of the year. When using the system, teachers spent their time mostly on resource pages, pages for individual students, and transactional pages (e.g., log-in, password, navigation). Training for the system for most teachers was optional
Present Study
We interpret current scholarship as suggesting that teachers’ use of data could support student achievement but that additional supports might be needed to help teachers engage with data. Although one way to get a sense for teachers’ engagement with data is to examine their uses of computer data systems, such work has yet to be thoroughly pursued. The present study adds to this research base by examining effects of 2 years of sustained data system use on student achievement, using detailed use logs to quantify teachers’ engagement with data. In doing so, we asked the following research question: Did teacher system use over two consecutive years correlate with student achievement?
Method
We employed a quantitative research design in conducting this study. Our analytic method examined the longitudinal impact of teachers’ system use, controlling for their teaching experience and student-level factors that correlated with student achievement. Analytic samples were disaggregated by school type (elementary/junior high) and content area (reading/math). In this section, we describe the study district, data system, measures, analyses, and sample.
Study District
The Brock district (a pseudonym) is located in a large city in the Southwestern United States. Brock’s 73 schools serve approximately 65,000 students, of which approximately 65% are enrolled in free or reduced-price lunch. Approximately 50% of the district’s students are non-Latino White; 40% are Latino; and 10% are from other ethnicities. Approximately 25% of students identify a language other than English as their primary home language.
Data System
The data system for the present study is SB938 (a pseudonym), a commercially available interim assessment system that offers numerous functions for accessing data and standards-based instructional content. It is intended to serve educators by assessing student progress on state learning standards and determining students’ readiness for state tests. SB938 comes with premade interim assessments that are correlated with the state test, the results of which are then accessible via the data system. These assessments—in both reading and math—target reading and math in Grades 3–8, as well as algebra. The study district implemented three forms of predictive tests. Form A is a baseline test given at the start of a year. In each grade, this test consists of material from the prior grade and material to be taught in the current grade. Form B is a midyear test typically given in late fall. It consists of material already taught but also material yet to be taught. Form C is given in the early spring. It consists of all material for the current grade and is intended to prepare students for the state test.
Brock administered these assessments in August, October, and January of each school year. Results from these assessments were made available to teachers through the SB938’s dashboard to help them track student progress toward mastering state standards and to predict students’ performance on the state test. District leaders also provided resources and trainings to help teachers use instructional resources that come with SB938. These trainings were conducted individually and in their professional learning communities.
At the time of the present study, Brock had completed the third full year of SB938 implementation. The district considers the first year an implementation year: Although SB938 was fully available, many educators were unfamiliar with it, and use was low. Use increased dramatically in the second and third years, once software training had been completed and educators were familiar with the system (see Table 1). In this report, we focus teacher use of SB938’s instructional functions. To evaluate these functions, we examined use logs generated by the SB938 system to track weekly educator use (see SB938 Use Logs section).
Average Districtwide Teacher SB938 Use Over 3 years

Note. Year 0, n = 546; Year 1, n = 643; Year 2, n = 670.
Prevalence of use is the number of instructional actions performed in a year. bConsistency of use is the number of weeks used in a year.
Measures
Data collected for this study included demographic data, weekly use logs from the SB938 system, and student achievement data. A section is provided for each.
Demographic data
Demographic data for students, teachers, and schools in the present study were provided by Brock district personnel (see Table 2). Unique identifiers allowed (a) students to be linked with teachers and (b) teachers to be linked with schools in any given year.
Descriptive Statistics for Student- and Teacher-Level Analytic Sample

Note. Cells with dashes (—) are empty because variables were not included in analyses. JHS = junior high school.
Prevalence of SB938 use is the number of instructional actions performed in Year 1 or Year 2. bConsistency of SB938 use is the number of weeks SB938 was used in Year 1 or Year 2.
Student demographic data included gender, ethnicity, economic status, and grade. Ethnicity was collapsed into three categories: Latino, non-Latino White, and other. Economic status was measured by whether students qualified for free and reduced-price lunch: Students were classified as economically disadvantaged or not economically disadvantaged.
Teacher data included years of experience in education and subject taught (for junior high teachers). Years of experience was collapsed into a four-level variable: ≤5 years, 6–10 years, 11–19 years, and ≥20 years. We also considered including teachers’ educational attainment in our analyses, but it was heavily confounded with years of experience.
SB938 use logs
Descriptions of teachers’ use of the system, in the form of weekly use logs, were developed and provided by SB938’s vendor. These logs reported actions taken and the date of the action, allowing us to investigate which teachers executed particular actions within the system and how often they performed an action. As with teacher background data, teachers’ unique identification numbers allowed linkage to student achievement data.
Use logs encompassed a breadth of actions, from purely mechanical actions (e.g., log-in, log-out) to specific actions to help understand student learning (e.g., assigning extra problems to a student based on an area of need, creating an aggregate report on a particular assessment). Since this study focused on whether SB938 helps teachers provide better, more effective instruction, we restricted our focus to analysis of instructional functions (actions that teachers took to support student learning).
Instructional functions available in SB938 were tracked throughout the school year and categorized into four areas: (a) instructional resources, which allows teachers to assign content to specific students; (b) management, which allows teachers to manage student information; (c) reports, which allows teachers to access summaries of data in the form of reports; and (d) tracking completion status, which allows teachers to view and manage the assessment status of individual assignments. 1
Use logs enabled us to view SB938 use in two ways: total actions (prevalence) and number of weeks used (consistency). Prevalence was defined as the total number of actions (relating to instruction) that each teacher performed with SB938 in a particular school year. Consistency was defined as the total number of weeks in a particular school year that teachers used SB938 for at least one instructional action. Table 2 describes prevalence and consistency of use for the 2 years of this study.
Student achievement
Student achievement was measured through state test scores for reading and math in Grades 4–8. 2 Scores were collected for three consecutive school years. Achievement in the initial year of SB938 implementation (Year 0) is used as a covariate for the subsequent 2 years examined in this study (Year 1 and Year 2). Table 2 provides descriptive statistics on state reading and math scale scores. Both portions of the state test are vertically equated.
Analyses
We used multilevel modeling as our primary tool of analysis due to the nested structure of our data (students nested within teachers). Statistical significance was assessed at the 0.05 level, and 95% confidence intervals were computed for each effect. Full models were compared with null models to determine reductions in Level 2 variability due to the inclusion of predictor variables. Model estimates were produced with restricted maximum likelihood estimation.
In our models, categorical variables were specified with reference categories. At the student level, “male” was specified as the reference category for the gender variable; “other,” for ethnicity; and “not economically disadvantaged,” for economic status. At the teacher level, the reference category for teaching experience was ≥20 years.
Teachers in the present study were “mainstream” teachers responsible for a classroom but not for special programs. Thus, we did not include teachers whose primary responsibilities included teaching English language learners or students in special education. Of course, the achievement of nonmainstream students is important; however, it carries its own set of correlates, and SB938 is designed for a mainstream environment.
SB938 variables and state test scores were standardized within grades and subjects (M = 0, SD = 1). Standardizing predictors and outcomes provides a measure of the relative impacts of variables explored in multilevel modelings; in other words, standardizing variables allows researchers to compare the effects of various predictors because those factors have been converted to the same underlying scale (Bloom, Hill, Black, & Lipsey, 2008; Heck, Thomas, & Tabata, 2010).
Additionally, descriptive estimates revealed that the prevalence of teachers’ SB938 use was more positively skewed than would be expected in normally distributed data, with a portion of frequent users creating a heavy tail in the upper end of the distribution. If not addressed, this type of violation of the normality assumption can lead to biased standard error estimates at both levels of the data structure, which can affect hypothesis test outcomes for predictors in the models. Thus, we addressed nonnormality by applying a square root transformation to the prevalence variable prior to standardization (Garson, 2012; Raudenbush & Bryk, 2002).
To explore 2-year correlational effects of SB938 use with student achievement in Year 2, we analyzed cross-classified models, nesting students within their Year 1 and Year 2 teachers. Unlike traditional balanced designs (e.g., repeated-measures analysis of variance, hierarchical linear growth models), cross-classified models more accurately reflect the longitudinal data structures found in school settings—contexts where students are assigned to different combinations of teachers over time (Raudenbush & Bryk, 2002). Our models accounted for these complex nesting structures by accounting for the variance in Year 2 achievement attributable to teacher use in Year 1 and teacher use in Year 2 (Heck et al., 2010; Raudenbush & Bryk, 2002). Thus, these models allowed us to estimate cumulative contribution of both teachers’ SB938 use. In estimating these models, we controlled for prior achievement (Year 0 state test scores), student-level demographic factors, and teacher experience.
While using a cross-classified approach allowed us to accurately model the complex longitudinal structure of the data, we acknowledge that we are accepting three potential trade-offs. First, while a cross-classified model allows us to account for the fact that students will not have the same teachers from year to year, the teachers in the sample are not necessarily independent from year to year (i.e., some teachers will be present in both years). Second, there are reductions in statistical power due to the burden of additional estimation parameters needed to model the cross-classified teacher effects and to the exclusion of participants not present in the data set for two consecutive years. Third, cross-classified models preclude including a third (school) level of nesting, due to concerns about further reducing power and increasing the interpretive complexity of teacher effects. To explore these trade-offs, we also estimated other models (e.g., multilevel models regressing achievement only on Year 2 use and including school as a third level), with similar results to those found with cross-classified models. Thus, we are confident that we are not ignoring potentially significant effects due to our modeling approach.
Intercepts were modeled as randomly varying at the student level. Gender, ethnicity, economic status, and prior achievement were modeled as fixed across Level 2 units. Fixed teacher effects for SB938 use in Year 1 and Year 2 were included at the teacher level, along with fixed effects for teaching experience. We estimated eight models, with different combinations of school type (elementary or junior high), subject (reading or math), and SB938 use (prevalence or consistency). Following is an example of the specified models, for student i taught by teacher j1 in Year 1 and teacher j2 in Year 2:
Students (Level 1):
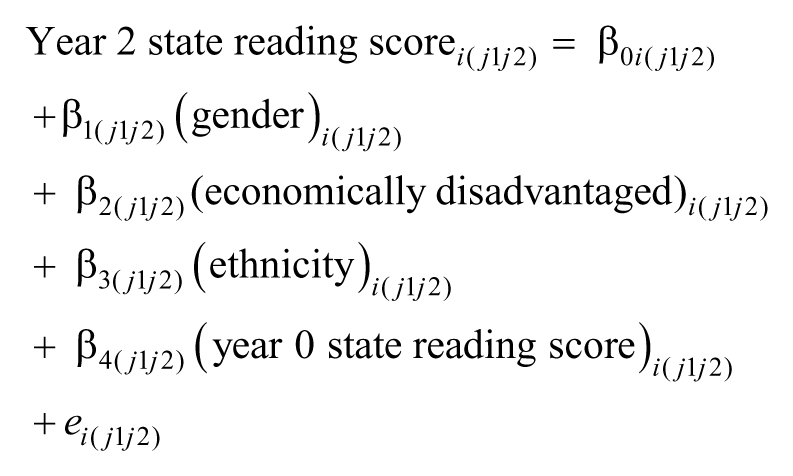
Teachers (Level 2):

Sample
The cross-classified models required student and teacher data from Year 1 and Year 2, as well as achievement data from Year 0. Since the focus of this question was on the contribution of consecutive teachers’ SB938 use toward achievement in Year 2, we delimited our analytic sample by mainstream teachers who taught in Grades 5–8 in Year 2 for whom we were able to obtain SB938 use and teaching experience data from Year 1 and Year 2. We did not include third- and fourth-grade teachers, because their students did not take state tests in Year 0 or Year 1. Junior high teachers were linked to a student if they were noted as the student’s primary reading or math teacher in Year 1 or Year 2. Students in Grades 5–8 were included in analyses if we were able to obtain state test data for Year 2 and Year 0 and demographic data for Year 2.
Additionally, 27 teachers were eliminated from the sample because their SB938 use was unusually high: >3 SD above average. We eliminated these teachers because we had reason to believe that use at this level is not valid use. Our previous work with this district indicated that when teachers logged unusually high SB938 use, it was typically because they are serving other teachers through their SB938 accounts (e.g., printing reports or examining students). Thus, we are more confident in the validity of our sample without these teachers.
These delimitations resulted in a sample of 610 teachers: 321 from Year 2 and 289 from Year 1 (Table 2). The teacher sample represented 39% of the full Year 2 teacher sample and 42% of the full Year 1 teacher sample. These delimitations also resulted in a sample of 5,581 students in Grades 5–8 (see Table 2); this represented 27% of the full student sample.
These delimitations do not appear to have biased the overall sample significantly for either teachers or students. The delimited teacher samples for both years approximated the full samples in terms of teaching experience. Teachers’ average SB938 use in both Year 2 and Year 1 was slightly higher among teachers in the sample versus teachers in the full Brock population. The delimited student sample was generally made up of a slightly higher percentage of non-Latino White and not economically disadvantaged students than the full Brock student sample. Students in the delimited sample scored slightly higher on Year 2 state tests and lower on Year 0 state tests than those in the Brock population.
Results
In this section, we present the results of our analyses. We first provide a section that describes the proportion of variability associated with Level 2 units (teachers). Next, we provide sections that describe relationships between Year 2 student achievement and teacher SB938 use over consecutive years.
Proportion of Variability Associated With Level 2 Units
The proportion of variability in Year 2 achievement that was associated with variability among Year 2 teachers was significant in each null model estimated, with larger amounts of achievement variability associated with variability among Year 2 teachers than Year 1 teachers (Table 3). For instance, 32% of the variability in Year 2 junior high math achievement was associated with variability among Year 2 teachers, while <5% of the variability in elementary reading and math achievement was associated with variability among Year 1 elementary teachers. The addition of explanatory variables at the student and teacher levels reduced the teacher-level variability in each model—most notably, a 16% reduction in Year 2 junior high math.
Teacher-Level Variability in State Reading and Math Test Scores

Note. Elementary: n = 3,360 students; n = 250 Year 1 teachers; n = 239 Year 2 teachers. Junior high school reading: n = 2,221 students; n = 29 Year 1 teachers; n = 24 Year 2 teachers. Junior high school math: n = 2,070 students; n = 42 Year 1 teachers; n = 26 Year 2 teachers.
Percentage of total variance at the teacher level. bProportion of variance explained at the teacher level by the introduction of predictors at the student and teacher levels.
In all models, variability in achievement associated with variability among Year 1 teachers was no longer statistically significant after explanatory variables were added. The same was true for junior high math teachers in Year 2, although statistically significant teacher-level variability remained after adding explanatory variables in other Year 2 models (Table 3).
Research Question: Did Teacher Data System Use Over Two Consecutive Years Correlate With Student Achievement?
In this section, we explore the longitudinal correlational effects of SB938 use on student achievement growth. For this question, we again nested students within teachers, but we accounted for Year 1 teacher SB938 use and Year 2 teacher SB938 use through cross-classified multilevel modelings. In doing so, we controlled for prior (Year 0) achievement. We controlled for student and teacher demographic factors; we estimated separate models for elementary and junior high students (for reading and math); and we examined teacher SB938 use in terms of prevalence and consistency.
In the following sections, we describe four pairs of achievement models: elementary reading, elementary math, junior high reading, and junior high math. SB938 measures and achievement measures were both standardized, so results are discussed in terms of standard deviation differences.
Elementary reading
Controlling for student- and teacher-level covariates, Table 4 shows that prevalence of teachers’ SB938 use in Year 1 and Year 2 was not significantly associated with elementary reading achievement (p = .71 and p = .13, respectively).
Cross-Classified Model: Elementary State Reading Test With Prevalence of SB938 Use
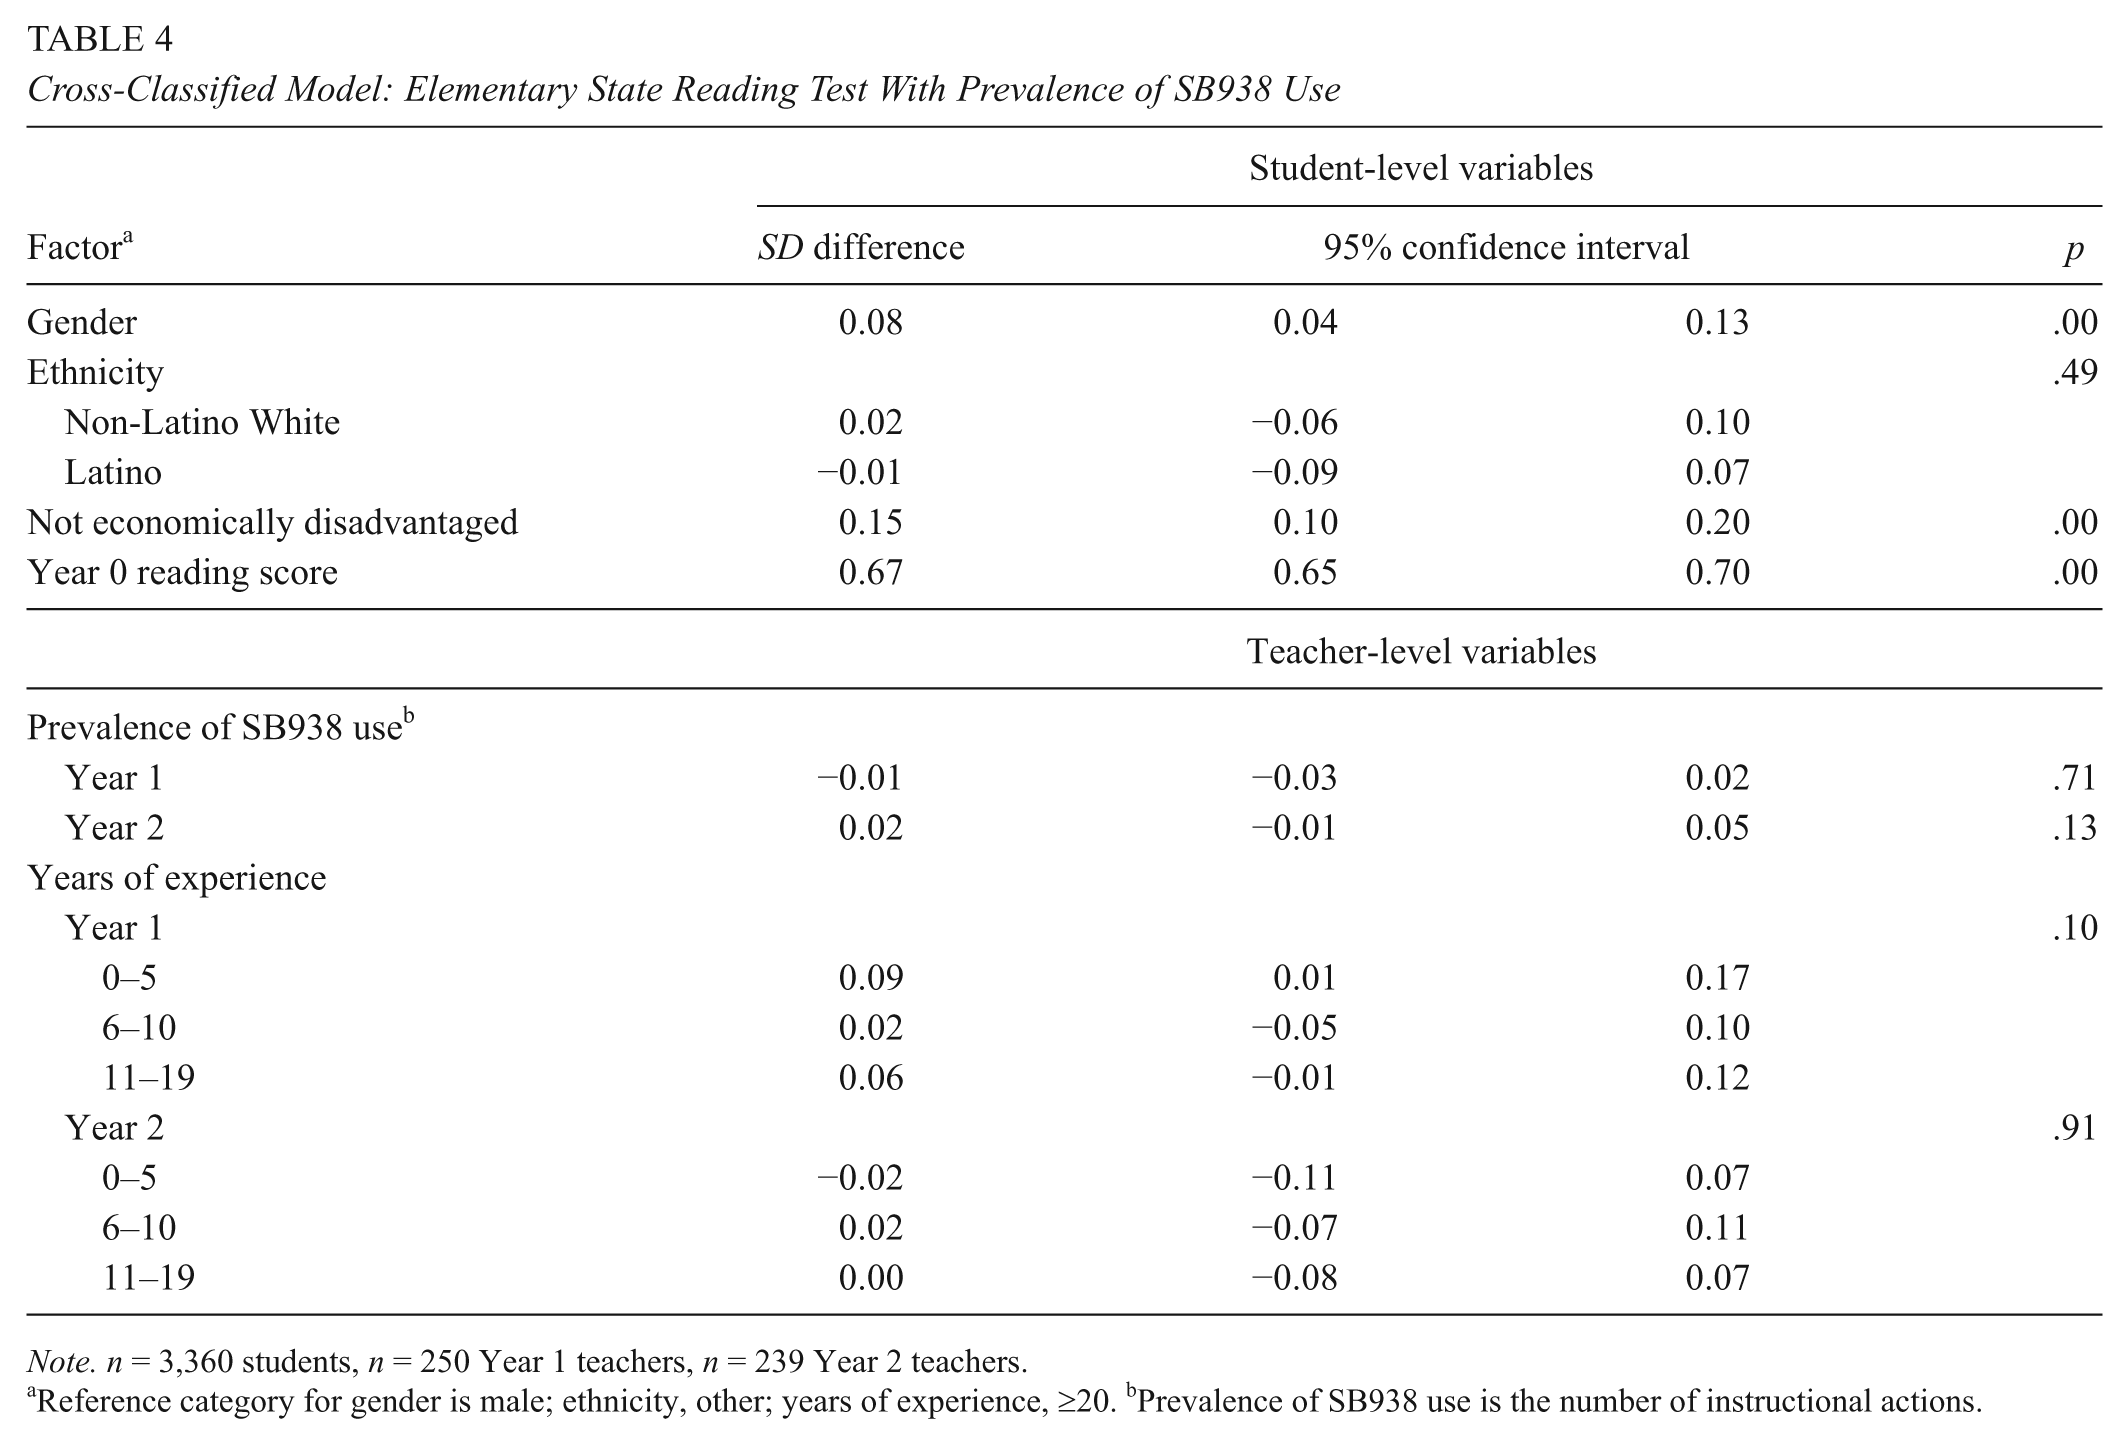
Note. n = 3,360 students, n = 250 Year 1 teachers, n = 239 Year 2 teachers.
Reference category for gender is male; ethnicity, other; years of experience, ≥20. bPrevalence of SB938 use is the number of instructional actions.
Controlling for student- and teacher-level covariates, Table 5 shows that consistency of SB938 use in Year 1 was not significantly associated with elementary reading achievement (p = .19) but that consistency of SB938 use in Year 2 was (p = .01).
Cross-Classified Model: Elementary State Reading Test With Consistency of SB938 Use
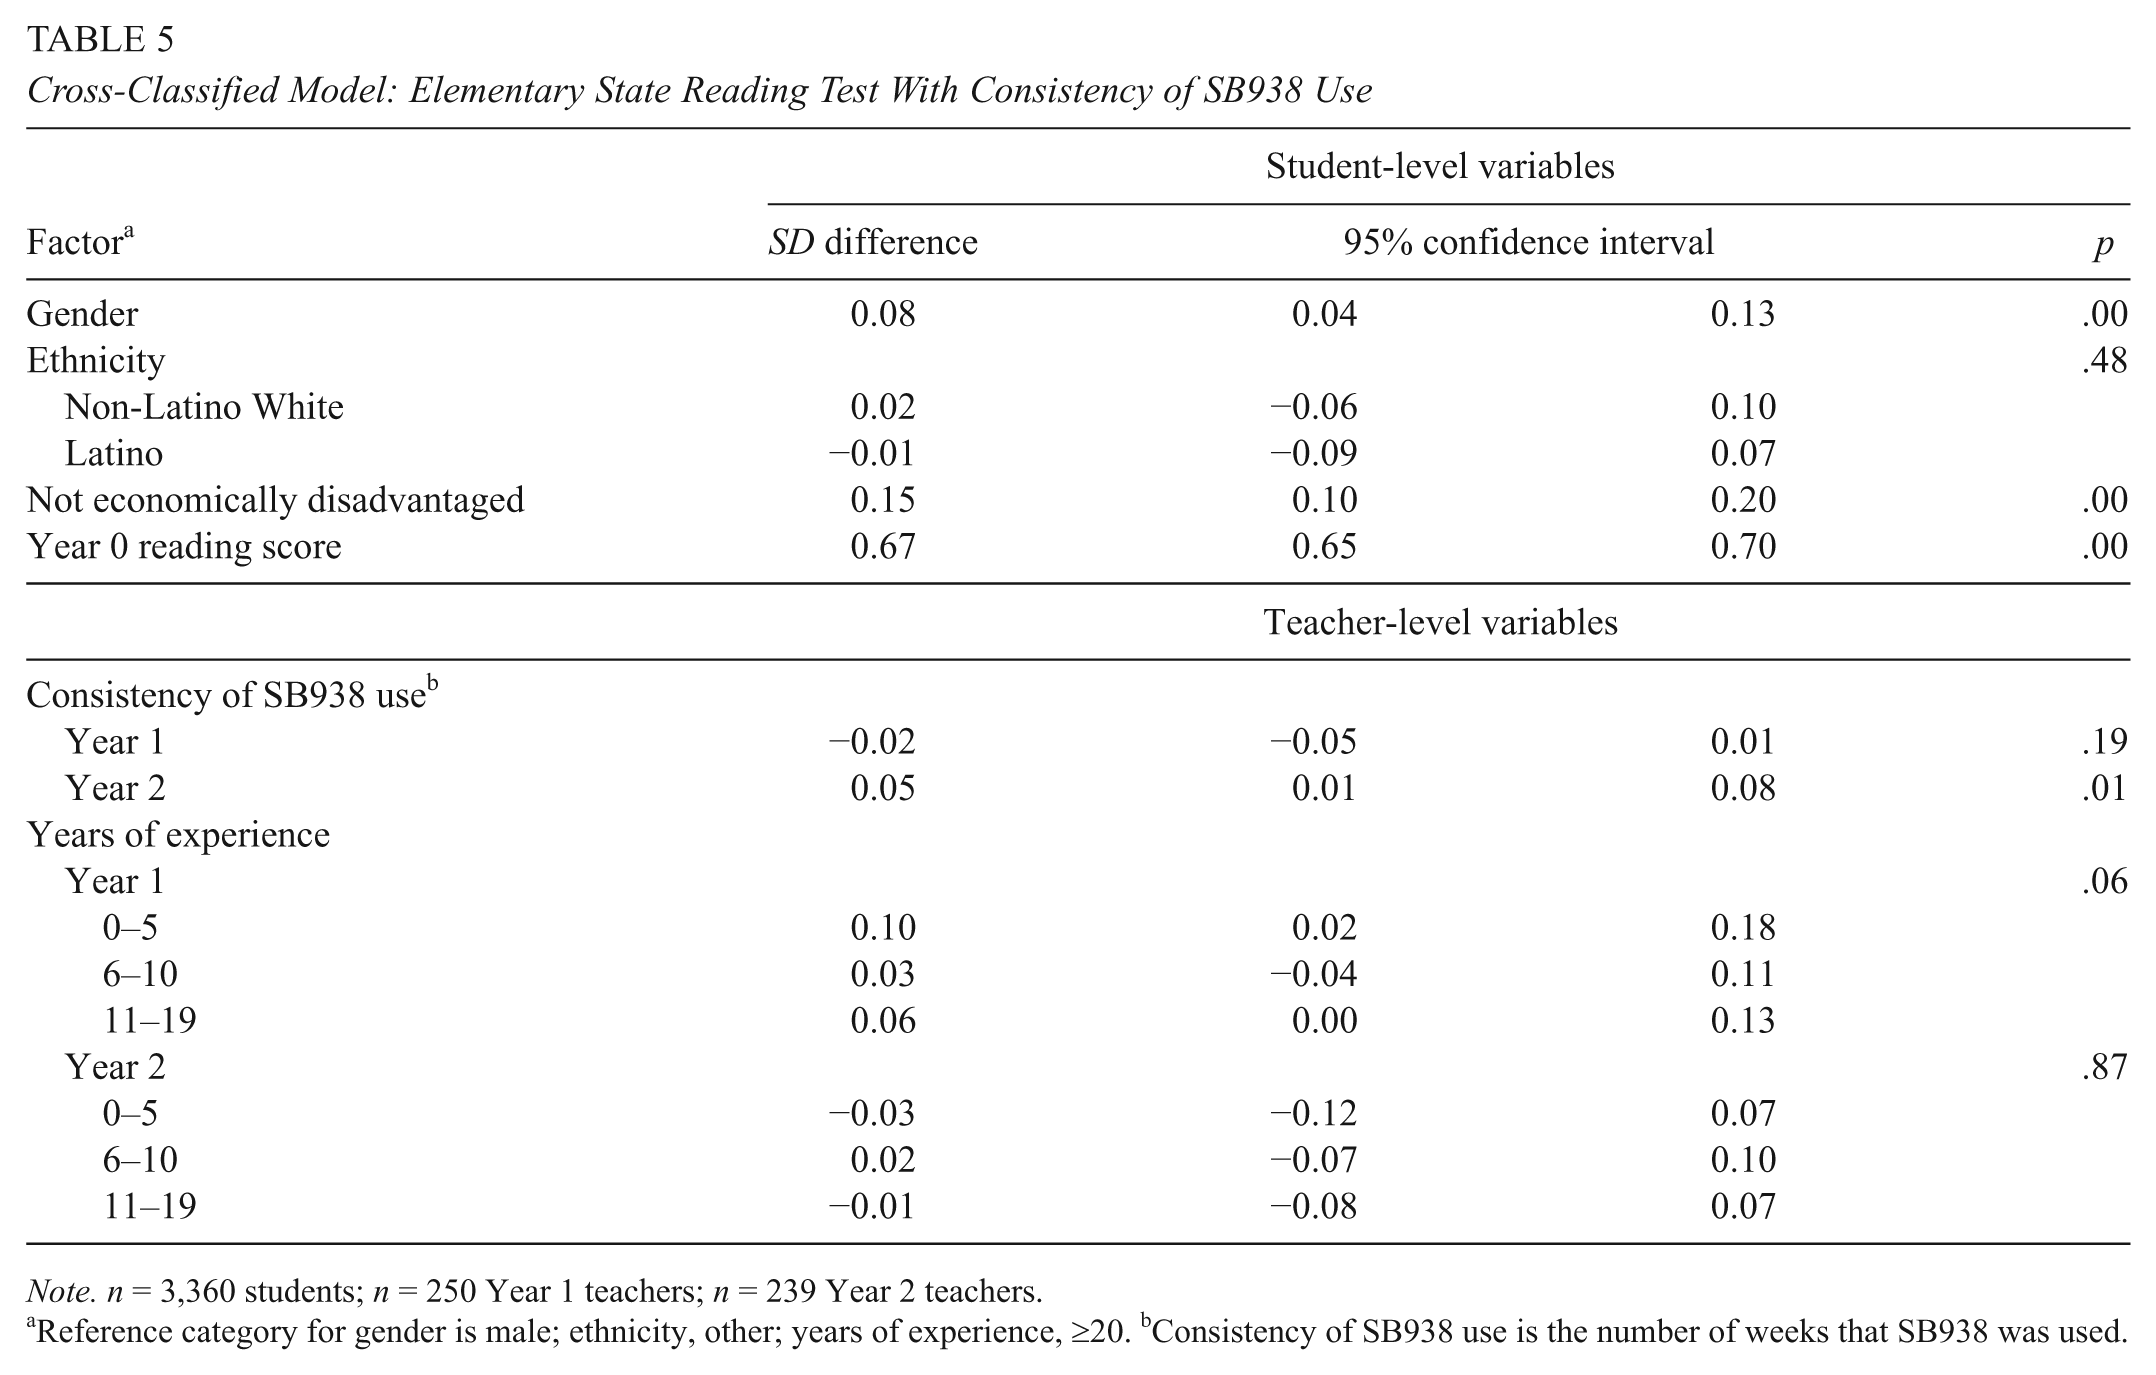
Note. n = 3,360 students; n = 250 Year 1 teachers; n = 239 Year 2 teachers.
Reference category for gender is male; ethnicity, other; years of experience, ≥20. bConsistency of SB938 use is the number of weeks that SB938 was used.
Elementary math
Controlling for student- and teacher-level covariates, Table 6 shows that prevalence of SB938 use was not significantly associated with elementary math achievement for the student’s Year 1 or Year 2 teachers (p = .79 and p = .49, respectively). Similarly, Table 7 shows that consistency was not significant for either year (p = .19 and p = .26, respectively).
Cross-Classified Model: Elementary State Math Test With Prevalence of SB938 Use

Note. n = 3,360 students, n = 250 Year 1 teachers, n = 239 Year 1 teachers.
Reference category for gender is male; ethnicity, other; years of experience, ≥20. bPrevalence of SB938 use is the number of instructional actions.
Cross-Classified Model: Elementary State Math Test With Consistency of SB938 Use

Note. n = 3,360 students; n = 250 Year 1 teachers; n = 239 Year 2 teachers.
Reference category for gender is male; ethnicity, other; years of experience, ≥20. bConsistency of SB938 use is the number of weeks that SB938 was used.
Junior high reading
Controlling for student- and teacher-level covariates, Table 8 shows that prevalence of SB938 use was not significantly associated with junior high reading achievement for the student’s Year 1 or Year 2 teachers (p = .96 and p = .75, respectively). Similarly, Table 9 shows that consistency was not significant for either year (p = .62 and p = .34, respectively).
Cross-Classified Model: Junior High State Reading Test With Prevalence of SB938 Use

Note. n = 2,221 students, n = 29 Year 1 teachers, n = 24 Year 2 teachers.
Reference category for gender is male; ethnicity, other; years of experience, ≥20. bPrevalence of SB938 use is the number of instructional actions performed.
Cross-Classified Model: Junior High State Reading Test With Consistency of SB938 Use
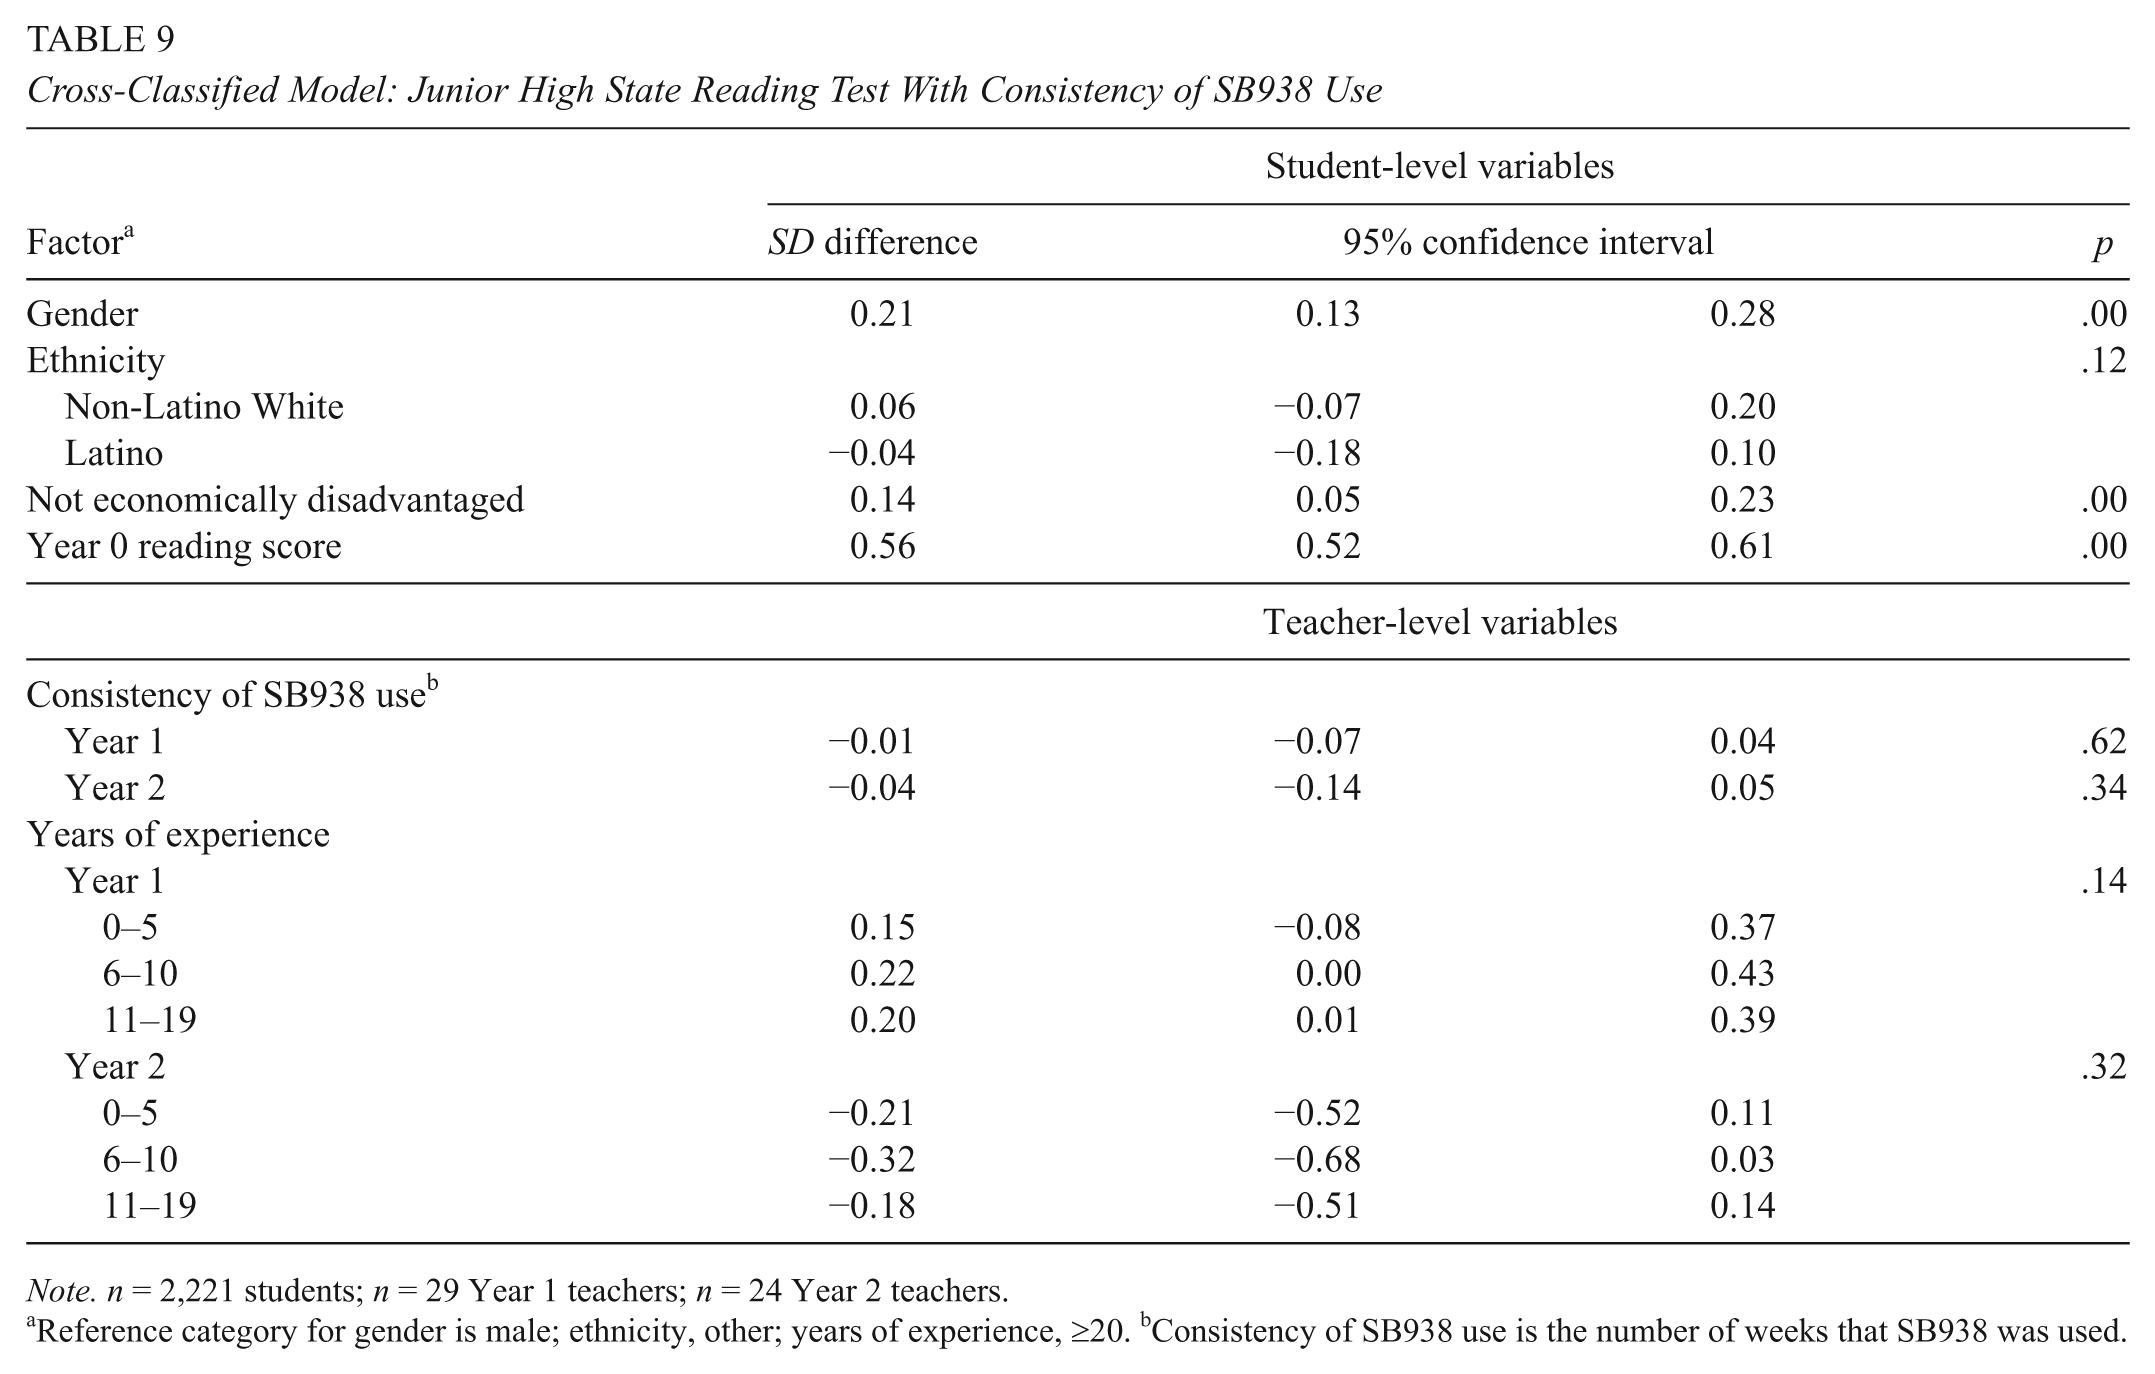
Note. n = 2,221 students; n = 29 Year 1 teachers; n = 24 Year 2 teachers.
Reference category for gender is male; ethnicity, other; years of experience, ≥20. bConsistency of SB938 use is the number of weeks that SB938 was used.
Junior high math
Controlling for student- and teacher-level covariates, Table 10 shows that prevalence of SB938 use was not significantly associated with junior high math achievement for the student’s Year 1 or Year 2 teachers (p = .33 and p = .65, respectively). Similarly, Table 11 shows that consistency was not significant for either year (p = .38 and p = .68, respectively).
Cross-Classified Model: Junior High State Math Test With Prevalence of SB938 Use

Note. n = 2,070 students, n = 42 Year 1 teachers, n = 26 Year 2 teachers.
Reference category for gender is male; ethnicity, other; years of experience, ≥20. bPrevalence of SB938 use is the number of instructional actions.
Cross-Classified Model, Junior High State Math Test With Consistency of SB938 Use
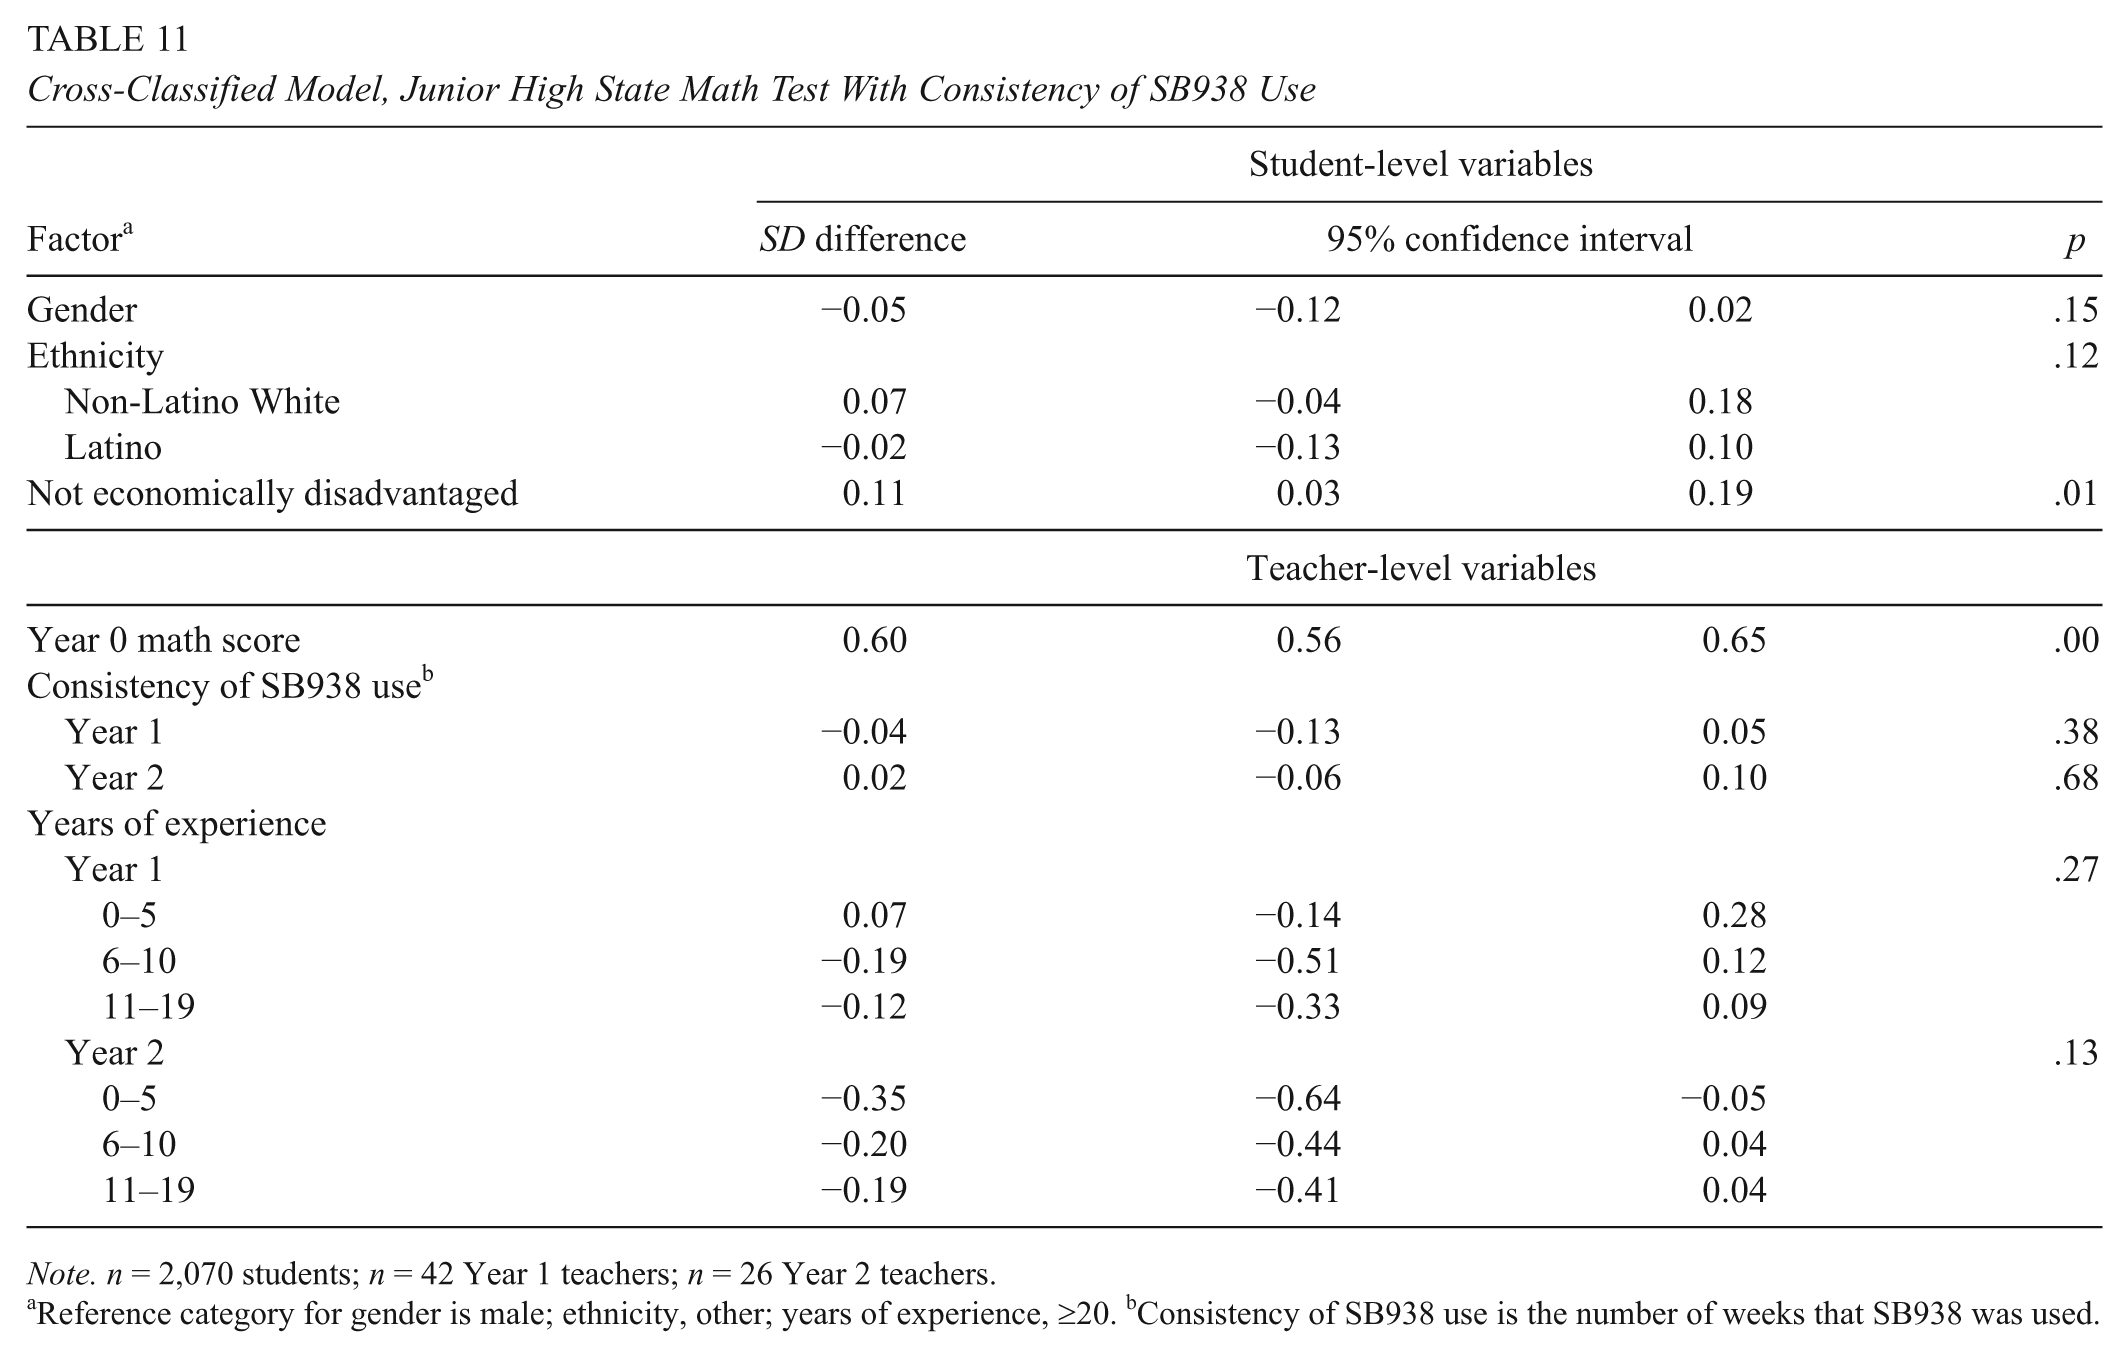
Note. n = 2,070 students; n = 42 Year 1 teachers; n = 26 Year 2 teachers.
Reference category for gender is male; ethnicity, other; years of experience, ≥20. bConsistency of SB938 use is the number of weeks that SB938 was used.
Discussion
The present study examined use of a computer data system designed to help educators understand how students are progressing relative to state standards. The study examined teacher use of this system over two consecutive years, linking detailed use logs to student achievement (as measured by the state achievement test). The only significant relationship found in this study was in elementary reading, where one measure of system use was significantly associated with reading gains but the other measure was not.
This study joins others (Konstantopoulos et al., 2013; Konstantopoulos et al., 2016; Tyler, 2013) in being unable to show consistent significant effects of the use of an interim assessment data system. An obvious question results: Are interim assessment data systems worth the investment? Casting our findings in light of prior research, we propose that it is yet too early to answer this question. Other factors may be influencing the potential impact of data system use on student achievement. In what follows, we organize our discussion of these potential factors in terms of two important questions that may be addressed through future research: What do we mean by “use,” and how may we better support people in using data systems?
What Do We Mean by “Use”?
The first question relates to how to specify and measure data system use. The assumptions that researchers make when answering this question have implications for the findings and conclusions that may be drawn from their work. We defined use by system clicks, as did Tyler (2013), while the Konstantopoulos studies defined it as the presence of a system (Konstantopoulos et al., 2013; Konstantopoulos et al., 2016). While our definition was more detailed than that of other studies, it still may be too limiting. Research about data systems is still fairly nascent, and there may be other ways to conceptualize and measure use.
Scholarship around data use has emphasized the importance of using a variety of data to inform decisions (Datnow, Park, & Wohlstetter, 2007; Hamilton et al., 2009; Wayman, Cho, et al., 2012). In contrast, research has studied the use of computer data systems in isolation, rather than as a part of a larger repertoire of activities. To assess the value of data systems, it may be necessary to expand the scope of data systems under study. Teachers have at their disposal many data systems at any given time (Means et al., 2009; Wayman, Cho, & Johnston, 2007; Wayman, Snodgrass Rangel, et al., 2010), but it is not known how their uses might interact. Just as a handyperson might choose one tool for a particular task, use multiple tools in conjunction, or use one tool and then another, teachers might engage in interpretive choices affecting how their work gets done. Future research on the effects of data systems might need to account for patterns in when and how tools are selected, as well as teachers’ sense of fit. Focusing on unique effects of single data systems might be missing the mark.
Also, there is the issue of depth of use. By employing use logs, the present study and Tyler’s (2013) represent the most detailed data that we could find on teacher use of a data system. But these measures were isolated purely to teacher interaction with the system, as a proxy for their interaction with information. As data use researchers have made clear (Cho & Wayman, 2014; Coburn, Russell, Kaufman, & Stein, 2012; Farley-Ripple & Cho, 2014), people may engage with knowledge resources at differing levels of intimacy. It is one thing to encounter information in a passing way and another to mull over information or to synthesize insights gleaned from various sources. Furthermore, one’s unique skill sets and areas of expertise may complicate the extent to which people engage with data in a meaningful way. The meaningful use of a system may require time to reflect, time to take a break and ask questions, or reassurances that one is clicking in the right place for data about the problem that one is attempting to solve.
Finally, in addressing use, traditional methodologies may be helpful, such as collecting qualitative interviews linked to use logs or conducting ethnographic studies of teacher work with data systems. There may be opportunities to develop new methodologies, too. For example, advancements in sensor technologies now make it possible to automatically capture a variety of multimodal data (e.g., facial expressions, posture, nonverbal gestures, skin conductivity). Employing these tools, Grafsgaard and colleagues (Grafsgaard, Wiggins, Boyer, Wiebe, & Lester, 2014) were able to use data relating to students’ affective states when using an online tutoring program (e.g., boredom, engagement, frustration, surprise) to predict learning outcomes. In this way, similar tools may be used to assess not only what people do but also the goals or intents behind particular activities (L. Chen, Hoey, Nugent, Cook, & Yu, 2012). A teacher who successively toggles back and forth between two displays of student learning might be engaging in a very different thought process than one who spends time with one display and then another. As L. Chen and colleagues (2012) describe, these methodologies require not only the use of sensing technologies but also new approaches to modeling the dense amount of data produced (e.g., dynamic Bayesian networks and hidden Markov models).
How May We Better Support People in Using Data Systems?
The second question recognizes that technologies such as data systems do not exist in vacuums. They depend on people in order to be used, but whether those people effectively use those systems is a social process (Cho & Wayman, 2014, 2015; Ertmer, 2005; Jimerson & Wayman, 2015; Leonardi, 2009). Thus, one potential explanation for the lack of positive results in the present study could be traced to the lack of supports that would lead to meaningful changes in instructional practice. After all, those studies that have shown positive correlations between data use and student achievement happened not in isolation but couched within initiatives to reshape teacher craft, such as coaching and targeted professional development (e.g., Lai et al., 2009; Marsh et al., 2010; Slavin et al., 2013). This type of job-embedded support is rarely provided for data systems, and where it is provided, it is often event based rather than linked to everyday practices (Wayman, Cho, & Shaw, 2009; Wayman, Snodgrass Rangel, et al., 2010; Wayman & Jimerson, 2014).
In other words, the present study examined teacher uses of a system, but this system’s implementation was not accompanied by strong focused attempts to reshape teacher craft. It is one thing for a teacher to use a system to access data and another for a teacher to know how to interpret the data and take the time to mentally process the data in ways that will produce desirable outcomes for students. Thus, we are optimistic that positive significant effects of data systems may be demonstrated if school and district leaders endeavor to provide proper supports around these systems. There is no way to know for sure, but it is possible that the results of this study may have been different if Brock implemented a comprehensive plan for supporting educators in the uses of this data system. Research suggest that such a plan would have the following four qualities.
Understand notions of teaching, learning, and data
Prior research has shown considerable variability in educators’ concepts of teaching, learning, and data and that this variability extends to the ways that data are used to support teaching and learning (Goertz, Olah, & Riggan, 2010; Ingram, Seashore Louis, & Schroeder, 2004). Similarly, research has shown that data system use is dependent on what teachers see as “data” (Cho & Wayman, 2014, 2015) and that such notions are influenced by leadership messages about what “data” are to be used for. These notions will cause teachers to utilize or ignore various features, even the system itself.
Recognizing this research—and research showing teachers’ negativity when data use conflicts with their personal or professional values (Ingram et al., 2004; Valli & Buese, 2007; Wills & Sandholtz, 2009)—leaders looking to support a data system such as SB938 may be well served to continuously engage educators in activities designed to share ideas about teaching, learning, and data (Farrell & Marsh, 2016; Wayman, Jimerson, & Cho, 2012; Wayman, Midgley, & Stringfield, 2006). Examples of such activities include discussion protocols for collaborative meetings, sharing data projects in a “science fair” format, and working on common problems important to the school that highlight features of the data system (City, Kagle, & Teoh, 2013; Johnson & Avelar La Salle, 2010; Wayman, 2014; Wayman et al., 2006). Our thinking is that teachers who have articulated and honed their ideas about data would possess more capacity to see how various data system features may support their practice.
Attend to knowledge and skills needed for effective system use
In our work with schools and districts, we commonly hear data system planners ask, “What features do we want in a system?” We rarely (if ever) hear, “What knowledge and skills do we need to use our system effectively?” Research suggests that leaders may get more value from their data systems if they move beyond merely providing good systems and focus on providing the knowledge and skills needed to make the best use of their systems. Attending to such knowledge and skills may have been a missed opportunity for the Brock district.
In citing the importance of knowledge and skills, we do not restrict to sheer system competence. We note the growing body of literature pointing to the need for educators to jointly employ data literacy and pedagogical skills in using data (Goertz et al., 2010; Mandinach & Gummer, 2016a, 2016b), and we suggest that these skills must be cultivated for teachers to use systems such as SB938 effectively (Cho & Wayman, 2014; Wayman, Jimerson, & Cho, 2012). This is also an opportunity for teachers to take charge of their own learning and speak up about what they need in order to be better data users (Cho, Allwarden, & Wayman, 2016; Wayman & Jimerson, 2014). Furthermore, leaders may identify new skills by observing the unintended practices that arise from system use (Cho & Wayman, 2014, 2015).
Create feedback loops
Open systems perspectives suggest that teachers will use data systems in ways that speak to their notions of data and practice and that these ways will sometimes be different from those ways imagined by system designers (Cho & Wayman, 2014, 2015; Scott & Davis, 2007). Not only should leaders plan and support the ways in which they envision the system supporting practice, but they should also organize for the inevitability that some uses will be completely different than planned (Cho & Wayman, 2015; Pfeffer & Sutton, 2006).
Cho and Wayman (2014) described avenues for implementing feedback loops, such as social formats (e.g., Edmodo, Twitter), proceedings of collaborative meetings, and working groups to promote best practices. In particular, the use logs employed in the present study may provide a centerpiece for capacity-building feedback about system use, when paired with information about the use of classroom strategies. In this vein, less may be more: Uses that fit strategies that the school or district are supporting are more important than sheer quantity of uses.
Two caveats are important to note about feedback loops. One is that use logs should be employed in feedback loops to inform and elevate problem solving, not to punish those with low levels of systems use. The other is that schools and districts are not always good at preserving knowledge specific to data use (Jimerson & Wayman, 2015; Wayman & Jimerson, 2014), so implementing information gained from feedback loops into organizational practice may be a challenge.
Recognize the professional costs of learning the system
Wayman, Cho, et al. (2012) found that negative attitudes about data were often related to what data use did to teachers, in terms of the barriers and problems that educators faced in trying to use data. Data systems are a prominent form of such barriers, even when system planners have carefully planned system design and implementation (Cho & Wayman, 2015; Means et al., 2009, Wayman, Cho, et al., 2012). Data systems are costly—not just in dollars but in the time and energy that they require from teachers to change their routines.
The problem is that planners often implement a system as if it is predetermined and obvious how the system will fit practice, an approach that conflicts when teachers have other ideas about how it fits their practice (Cho & Wayman, 2014, 2015). Professional development for system use often follows this same approach and is often characterized by long sessions that focus on demonstrating the functions of the system (Jimerson & Wayman, 2015; Wayman & Jimerson, 2014). Additionally, new technologies can lead to unexpected “spillover” into how people go about their jobs (Barley, 1990; Cho & Wayman, 2014; Cho & Snodgrass Rangel, in press). As air in a balloon moves when it is squeezed, so do teacher activities shift when new tasks or technologies are added.
To make effective use of SB938, teachers in the present study had to learn not only how to use the system but also how to incorporate the new assessments into their own assessment and teaching routines. Even though Brock provided system training, the result was a steep personal investment required of teachers to embed system use into their practice. SB938 represented a major shift in practice for Brock teachers, and even with district-sponsored training, it required a steep personal investment to incorporate into practice. Many teachers may have determined the costs to be too great—and the benefits too small—and thus may have taken a compliance approach to using the system and its assessments.
In contrast, research describes ways that teachers can learn about the system such that it is not too costly for them. For instance, learning how to apply the system to their craft can be more effective for teachers when it is done collaboratively, embedded in their work, and coherently linked to present and future practices (Garet, Porter, Desimone, Birman, & Yoon, 2001; Guskey & Yoon, 2009; Wayman & Jimerson, 2014). Research such as this has caused Wayman (2014) to suggest that system training focus entirely on the work to be done with the system, not on the system itself.
Conclusion
On the surface, the results of the present study may be discouraging. After all, schools and districts are spending heavily on data systems, and such an investment should pay off in terms of student achievement. We are slow to conclude that these systems are not worth the investment, however, because we recognize there are “people issues” that have not been attended to about these systems. That is, there are ways to conceive of “use” and system application that consider technology as a support for problems of practice, not a solution to problems of practice. Technology is never the agent of change—people are. When data systems are implemented and applied in this way, we are optimistic that they can pay off on the promise relative to the investment.
Footnotes
Acknowledgements
This study was funded by CTB/McGraw-Hill. By agreement, CTB/McGraw-Hill retained no influence or control over the results or reporting from this study.
Notes
Authors
JEFFREY C. WAYMAN is president of Wayman Services, LLC; email
SHANA SHAW is the research and evaluation manager at the Texas Center for Educator Excellence. She brings her expertise in quantitative methods and program evaluation to bear in exploring issues of educator quality and development. She has presented nationally on these topics and published peer-reviewed articles on modality effects in computer-based learning environments and the use of causal language in correlational research.
VINCENT CHO is an assistant professor at Boston College. His research focuses on issues of school leadership in the digital age. In addition to having authored empirical studies about 1:1 computing, administrators’ uses of social media, and districts’ implementation of computer data systems, he is coauthor of Supervision: A Redefinition, ninth edition, with Thomas J. Sergiovanni and Robert J. Starratt.