
Abstract
Many dimensions of teacher working conditions influence both teacher and student outcomes; yet, analyses of schools’ overall working conditions are challenged by high correlations among the dimensions. Our study overcame this challenge by applying latent profile analysis to school-level measures of school leadership, instructional agency, professional growth opportunities, rigorous instruction, managing student behavior, family engagement, physical environment, and safety. We identified four classes of schools: Supportive (61%), Unsupportive (7%), Unstructured (22%), and Structured (11%). The patterns of these classes suggest that schools may face tradeoffs between factors such as more teacher autonomy for less instructional rigor or discipline. Teacher satisfaction and their stated career intentions were predicted by their school’s working conditions class, and school contextual factors predicted class membership. By identifying formerly unseen profiles of school-level teacher working conditions and considering the implications of being a teacher in each, decision-makers can provide schools with targeted supports and investments.
Keywords
In order to close persistent achievement gaps along lines of race and ethnicity and socioeconomic status, all students must be taught by an effective teacher. Teachers represent the most significant school factor related to student achievement, and evidence suggests that teachers vary significantly in their effectiveness (Rivkin et al., 2005; Rockoff, 2004). However, solely focusing on what the individual teacher does in the classroom to improve teaching quality is missing something important—the school context defined by teacher working conditions (Johnson, 1990, 2019; Kennedy, 2010). Many school- and district-level working conditions influence teacher effectiveness. Most apparent, teacher skills are influenced by conditions such as the quality and availability of ongoing professional development (Kennedy, 2016), the day-to-day instructional support and mentoring they receive (Goddard et al., 2015), and a supportive professional environment (Kraft & Papay, 2014). These factors are within the control of school and district leadership and constitute important components of teacher working conditions.
Teacher surveys are a commonplace means of characterizing a school’s working conditions. Such surveys are useful for identifying which aspects of working conditions the school needs to improve, for tracking progress toward achieving improvements, and for connecting improvements to teacher and student outcomes. However, if the focus is on the higher-order construct of a school’s working conditions rather than the individual dimensions of working conditions (e.g., professional growth opportunities, school leadership), the analysis must confront high correlations among the dimensions. Prior research has examined individual components either in isolation (Buckley et al., 2005; Grissom, 2011), iteratively (Allensworth et al., 2009; Johnson et al., 2012), or simultaneously if a set of not-too-highly correlated dimensions could be identified (Boyd et al., 2011; Ladd, 2011). What is lost consequently is knowledge about how a set of working conditions coexist within schools (i.e., the forest rather than the trees), knowledge essential for improving working conditions.
In this paper, guided by an organizational perspective of schooling, we develop this needed holistic understanding by applying Latent Profile Analysis (LPA) techniques that rely on the mixture modeling framework to identify classes of school-level working conditions. The classes group schools based on response patterns across eight working conditions dimensions such that the working conditions at schools within a given profile (or class) are more like each other than they are like schools classified into any other class (Masyn, 2013). Said differently, LPAs can help identify sources of heterogeneity in the responses by examining whether different aspects of school working conditions form distinct multivariate normal distributions (profiles) rather than a single distribution. These analyses further account for heterogeneity by assuming that membership in the various latent classes—or, more plainly, working in a particular type of school—helps explain differences in item responses (aggregated at the school level, in our case). We are unaware of any other study of working conditions that has leveraged LPA, although many of the indicators of organizational capacity analyzed by Duff and Bowers (2021) are often viewed as working conditions.
There are many advantages to the LPA approach. First, the classes reflect how a complete set of working condition dimensions coexist on the ground in schools, thereby providing a more holistic and digestible view compared to the insights gained from a series of pairwise correlations. Second, the classes do not force schools into low, medium, and high groups as does averaging the dimensions together into a single continuous measure (Johnson et al., 2012; Kraft et al., 2021; Loeb et al., 2005). Instead, LPA is more flexible than other analytic approaches, allowing tradeoffs among dimensions of working conditions. For example, LPA can detect a class, should it exist, that is characterized by high values on one or more working conditions dimensions, medium values on some, and low values on others. Third, the classes do not suffer a significant limitation of averaging together dimensions into a single continuous measure that assigns the same value to two schools with very different sets of working conditions despite having an equivalent arithmetic mean. LPA will distinguish between the two. The LPA classes also allow us to develop a more comprehensive understanding of how a school’s full set of working conditions combine to influence teacher retention and equitable student educational outcomes.
Our exploratory analysis of teacher survey data collected in Virginia in the spring of 2021 answers the following three research questions: What are the working conditions classes for Virginia schools in the 2020–21 school year? What is the relationship between school-level working conditions and teacher job satisfaction and career intentions? Which school and district characteristics are associated with membership in each working conditions class? We demonstrate that teachers’ views of their working conditions can be used to classify their schools by a set of working conditions the schools provide. Teacher job satisfaction and retention intentions vary across the working conditions classes in ways the extant literature would predict.
Theoretical Framework and Background
An organizational approach to improving teacher outcomes—their recruitment, retention, and effectiveness—places the focus on the school context or workplace rather than on individual teacher-level factors (Ingersoll, 2017; Woulfin & Allen, 2022). A key feature of a school’s workplace are the working conditions it provides to teachers. Merrill (2021) defines teacher working conditions as “the nonpecuniary elements of the workplace that affect teaching” (p. 172). Ingersoll (2001), in his seminal analysis of teacher turnover, highlights schools’ working conditions as a chief driver of their excess demand for teachers, contributing to what he called the “revolving door.” Poor working conditions in which teachers felt unsupported resulted in too many teachers leaving schools too quickly. On the other hand, teachers who worked in schools with working conditions that supported them and their teaching had higher job satisfaction (Johnson et al., 2012), were more likely to remain teaching (Ladd, 2011), and became more effective (Kraft & Papay, 2014).
Although no definitive list of teacher working conditions exists, teachers and researchers agree that a school’s working conditions are multi-dimensional. Johnson (1990) grouped them into seven broad features such as physical, organizational structure, and psychological features. In her catalog of working conditions, Merrill (2021) identified 12 categories from the literature and grouped them into two meta-categories: Actors and Constructs. Categories under Actors were persons with whom teachers interacted and who influenced the school’s working conditions, such as leadership and teacher empowerment, faculty, and parents and community. Constructs included categories of things, rather than people, that affected teaching, such as professional development, time, and safety. School workplaces vary in the quality of their working conditions. How working conditions vary across workplaces has “profound implications not only for the worker but for the work that is done and for the service that is rendered” (Johnson, 1990, p. 9).
An important characteristic of teacher working conditions is that they are malleable (Viano et al., 2021). Stakeholders can act intentionally to improve the school’s working conditions and thereby create a “professional culture that is committed to improvement and systems of practice that stimulate and support it” (Johnson, 2019, p. 6). While teachers within the same school may perceive the professional culture of their workplace differently, school administrators do not craft an entirely separate set of working conditions for each teacher.
From an organizational perspective, school improvement policies focus on strengthening the school workplace rather than, from the individual perspective, policies that focus on teacher salary increases, retention bonuses, and entry and license requirements (Ingersoll, 2017). While agreeing that teachers are the most important school-based input to student outcomes, proponents of the organizational perspective assert that policies “that focus on the individual, ignoring the role of the organization, fail to recognize or leverage the potential importance of the school context in promoting teacher development” (Kraft & Papay, 2014, p. 494). Policy recommendations flowing from this perspective advocate for improving the school’s overall working conditions, not differentiating all dimensions of working conditions across individual teachers or groups of teachers.
Reflecting the theoretical basis of working conditions as a school-level construct, other research on working conditions has centered the school in their conceptual frameworks and methods, often by aggregating teacher responses to school-level measures. Ingersoll (2001), for example, averaged teacher survey responses to the school to create measures of administrative support, student discipline problems, and faculty influence. Kraft and Papay (2014) averaged teacher survey responses to the school level to capture each school’s professional environment. Aggregated responses provide two additional benefits. First, they have allowed researchers to avoid confirmation bias when measuring the relationship between working conditions and teacher outcomes. This bias arises when teachers systematically rate their working conditions in a way to justify or rationalize their reported job satisfaction or retention intention (Grissom, 2011; Kraft et al., 2021). Second, it has often been the case that researchers could not link individual teacher responses to individual teachers in the administrative data used to observe actual teacher retention and student outcomes but could link at the school level (Ladd, 2009, 2011).
We have included eight dimensions of working conditions in our LPA: school leadership, instructional agency, professional growth opportunities, rigorous instruction, managing student behavior, family engagement, physical environment, and feeling safe. These dimensions were drawn from the literature and reflect ten of twelve of Merrill’s (2021) categories of Actors and Constructs (see Table 1). While our working conditions measures, like all the research of which we are aware, do not encompass all the workplace categories cataloged by Merrill (2021), they cover most. Prior studies that have used aggregated teacher survey responses to measure the school-level working conditions we included in our LPA have found that supportive working conditions were predictive of teachers’ job satisfaction (Grissom, 2011; Johnson et al., 2012), job commitment (Johnson et al., 2012; Ladd, 2011), effectiveness (Goddard et al., 2015; Kraft & Papay, 2014), retention (Allensworth et al., 2009; Boyd et al., 2011; Grissom, 2011; Ingersoll, 2001; Kelly, 2004; Kraft et al., 2016; Ladd, 2011), and student achievement (Hallinger & Heck, 2010; Heck & Hallinger, 2009; Johnson et al., 2012; Ladd, 2009).
Alignment between Merrill’s (2021) Working Conditions Categories and the Current Studies Working Conditions Measures
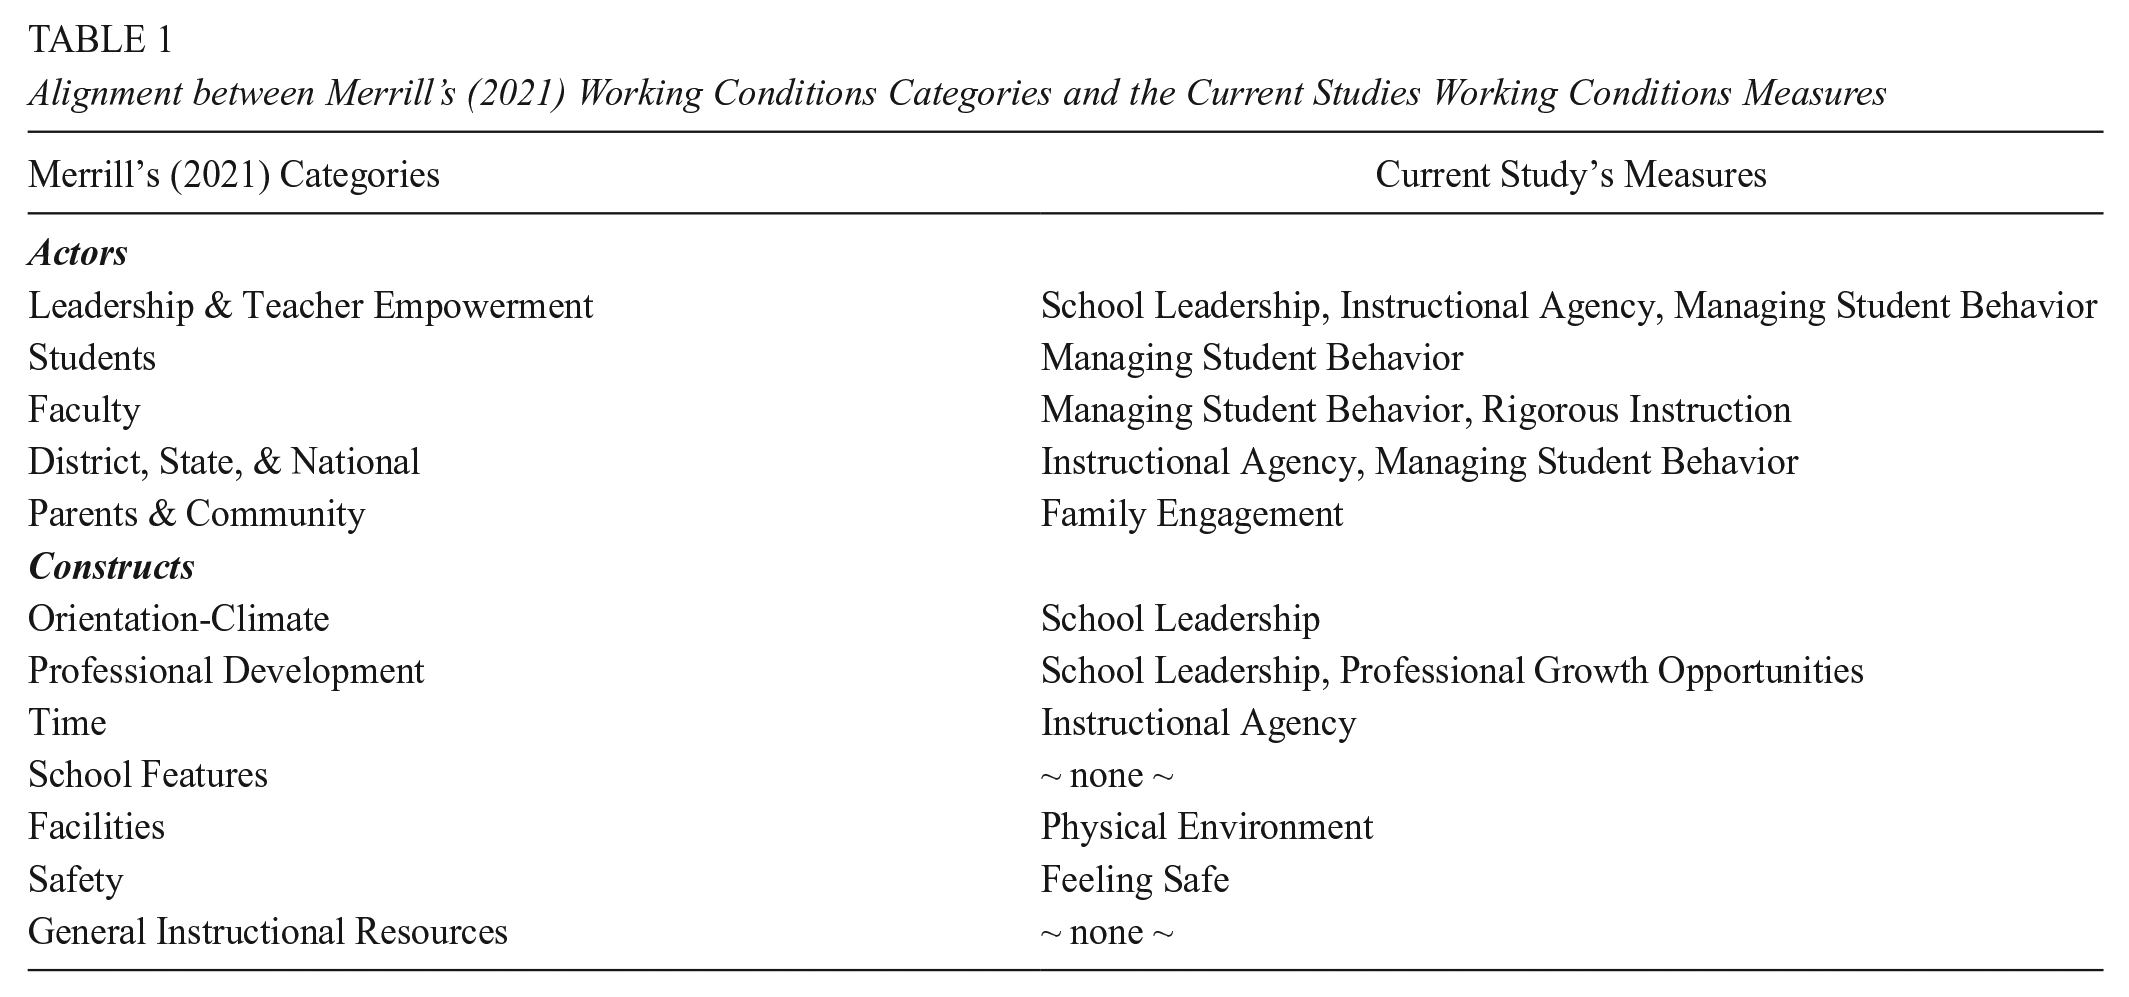
Furthermore, the mapping in Table 1 highlights the interconnectedness of workplace features. Components of four of Merrill’s categories mapped onto items in more than one of our measures and items in three of our measures aligned with components of more than one of Merrill’s categories. This is not, on the face of it, a source of concern. Merrill developed her catalog via a systematic narrative review of the literature, and, as we have described below, we confirmed our measures with factor analyses. This interconnectedness also raises the question of how these workplace features coexist with each other. For example, the quality of a school’s physical environment could be related to how safe teachers feel at school. Do they move in tandem with each other or do workplaces have more of some and less than others? Our LPA approach, motivated by the need to understand how working conditions coexist within school contexts, was designed to answer this question. We are aware of only one other study that sought to do the same.
Although Duff & Bowers (2021) used the term “school organizational capacity,” the school-level indicators they included in their mixture model (i.e., effective leadership, collaborative teachers, trust, rigorous instruction, supportive environment, and family-community ties) both map onto Merrill’s catalog of working conditions and align with our measures. Their analysis of teachers’ responses to the 2016 New York City school climate survey identified six classes of elementary and middle schools, which they named Versatile, Collaborative, Developing, Responsive, Controlled, and Demoralized. Versatile schools, the largest class, had the highest values across the indicators while Demoralized schools tended to have the lowest values. For the remaining classes, indicator values did not change uniformly across the classes such that one class had relatively high values of one indicator and relatively low values on another and another class had the opposite. While many schools provide teachers with supportive working conditions on some dimensions, they struggle with other dimensions, suggesting that something else at the school level has facilitated or hindered the provision of supportive working conditions.
Working conditions have never been randomly assigned to schools. Instead, they have resulted from decisions of local actors reacting to and reflecting other contextual factors of the school (Johnson, 1990, 2019). Schools, aware that teachers consider working conditions as part of their employment package along with salary and benefits, may offer more supportive working conditions to compensate teachers for less desirable school characteristics over which the school has no or little power to change or offer less supportive working conditions when more desirable characteristics are present (Horng, 2009; Viano et al., 2021). Understanding how working conditions and these other school characteristics covary can identify school features that can be leveraged or that need to be overcome as schools seek to improve and maintain supportive working conditions.
A review of research examining how other characteristics of the workplace varied with school-level working conditions revealed a common set of school characteristics. Duff and Bowers (2021), for example, found that other school characteristics varied across the six classes such as the percent of students with disabilities, the percent of students identified as English Learners, and how many years of experience its teachers have. Kraft et al. (2021) found that elementary teachers had better working conditions than secondary teachers. Other researchers have found differences between rural and suburban schools (Player et al., 2017) and smaller versus larger schools (Boyd et al., 2011). All of these analyses were motivated by the theory that other school features influence the set of working conditions schools provide teachers. However, Merrill (2021) included all of these school characteristics in her catalog of working conditions. How can this be reconciled? Are all school characteristics working conditions? For our analysis, we expanded Merrill’s definition of working conditions to highlight how they differ from other school characteristics. We define working conditions as “the nonpecuniary elements of the workplace that affect teaching which are malleable by persons within the school.” In determining the working conditions to offer teachers, school leaders take certain things as given (e.g., student characteristics, the grades served, community characteristics, available funding, etc.). We have called these contextual factors to distinguish them from other school characteristics such as working conditions.
One of the contextual factors we included was unique to our analysis: the district’s COVID death rate. We chose this measure to capture the pandemic’s local severity. As mentioned previously, our data captured teacher perceptions of their working conditions roughly one year into the COVID-19 pandemic. This raises two concerns: (1) how COVID changed school-level working conditions and (2) whether the dimensions we included were still relevant during the pandemic. As to the first concern, teachers, at the time of our survey, reported not much had changed. Forty-four percent indicated that the “working conditions for teachers in this school” had “stayed about the same” since prior to the pandemic, 17% said they had “become somewhat better” and another 17% said they had “become somewhat worse”. With respect to the second concern, while most Virginia schools, like those in other states, offered some remote instruction, the dimensions we included in our analysis remained relevant to teachers regardless of how they taught students. For example, school leadership still had an important role to play, and teachers still needed relevant professional development and support for engaging families. Furthermore, by the close of the survey administration, only 14% of students were being offered only remote instruction (Sachs et al., 2022). We return to the pandemic’s role in our findings later in the paper.
Methods
Sample
The 2021 Virginia School Survey of Climate and Working Conditions (the Virginia School Survey) was administered from January through April 2021 in all regular Virginia public schools to teachers, teacher aides, licensed staff, and non-licensed staff as well as middle school students. Here, we analyzed only the teacher responses. 1 All but eight eligible schools participated in the 2021 survey administration for a total of 1,847 schools (over 99%) across all school districts in the Commonwealth. There were 67,110 teacher responses, representing a response rate of 70.8%. The anonymous nature of the survey means that we did not have any information on the non-respondents. Although we could not, therefore, guarantee that the sample of survey respondents was representative of all Virginia teachers, this survey collection captured nearly every school and represented an opportunity to understand teacher working conditions in the Commonwealth.
Given our focus on schools, we restricted our analytic sample to schools with at least a 40% response rate. This excluded 126 schools with 2,339 responding teachers, leaving an analytic sample of 1,721 schools (92.8% of all schools) with 64,771 teachers (68.3% of all teachers, 74.7% of teachers at the included schools). As shown in Table 2, comparisons between the teacher respondents in the schools included and excluded from our analysis found few statistically significant differences (third column). The included teachers were more likely to be Black, less likely to teach English as a Second Language or English for Speakers of Other Languages, more likely to be a second-year teacher, and have more of their students receiving English Learner services.
Descriptive Statistics of Respondents to the Classroom Instructors Survey and by Inclusion in LPA

Note. Standard deviations in parentheses. Tests of difference from included respondents: ***p < .001, *p < .05, +p < .1.
Measures
Working Conditions
The teacher working conditions survey measured eight distinct dimensions: school leadership, instructional agency, professional growth opportunities, rigorous instruction, managing student behavior, family engagement, physical environment, and feeling safe. These dimensions were identified and defined based on existing literature related to teacher working conditions. All response categories were defined by six-point Likert scales, with response options ranging from strongly disagree to strongly agree (there was no impartial middle response category). Specific items can be found in Table A1 of the supplemental materials.
Teacher Job Satisfaction and Career Intentions
The survey also included measures to two teacher outcomes: job satisfaction and career intentions. Job satisfaction was captured by responses to the statement “overall, my school is a good place to work and learn.” We examined the average score of the 6-point scale as well as the percentage of teachers most satisfied (responded “strongly agree”) and the percentage of teachers dissatisfied (responded “strongly disagree,” “disagree,” or “somewhat disagree”). Teacher responses to the question “which of the following best describes your immediate professional plans” were mapped onto three career intentions: intent to stay at the current school, intent to transfer to teach at a different school, and intent to leave the Virginia teacher workforce. Our survey data do not allow us to observe individual retention decisions, and likely not all teachers followed through with their stated intent. However, prior research has shown that stated intentions are themselves an important measure of commitment to teaching (Nguyen et al., 2024; Zee & Kooman, 2016) and were, therefore, potentially associated with working conditions.
School Contextual Factors
Information on school contextual factors came primarily from publicly available sources. Most were obtained from the Virginia Department of Education’s (VDOE) website: student body characteristics (enrollment, race and ethnicity composition, and the percent of students identified as economically disadvantaged, as having a disability, and as being an English Learner) and school type (elementary or secondary). Using teacher-level data obtained from VDOE, we calculated the student-teacher ratio and the percentage of teachers with 3 or fewer years of experience. Each school’s locale (city, suburb, town, or rural) was pulled from NCES’s Education Demographic and Geographic Estimates data file. VDOE’s website also provided information on two district-level characteristics: the number of schools in the district and per-pupil expenditures. We constructed a measure of a district’s socio-economic status using principal component analysis on four district-level indicators: median household income, poverty rate, and the percent of adults with a bachelor’s degree or higher obtained from the U.S. Census Bureau and the unemployment rate obtained from the U.S. Bureau of Labor Statistics. We used data from fall 2019 to avoid the possibility of COVID impacting the contextual factors. Finally, we constructed the district’s COVID death rate per 100,000 persons from longitudinal data on COVID deaths from the Virginia Department of Health website and population data from the U.S. Census Bureau. We assigned the death rate as of the day each teacher took the survey and then averaged these up to the school level.
We provide descriptive statistics on the 1,721 schools’ contextual conditions in Table 3. The small number of excluded schools were statistically and substantively different from the included schools on a few contextual factors. The excluded schools were more likely to be suburban and less likely to be rural. They also, on average, were larger and had larger concentrations of non-White and non-Asian students and English Learners. The excluded schools were also in larger districts with higher per-pupil expenditures and socio-economic status.
Descriptive Statistics of Schools by Inclusion in LPA
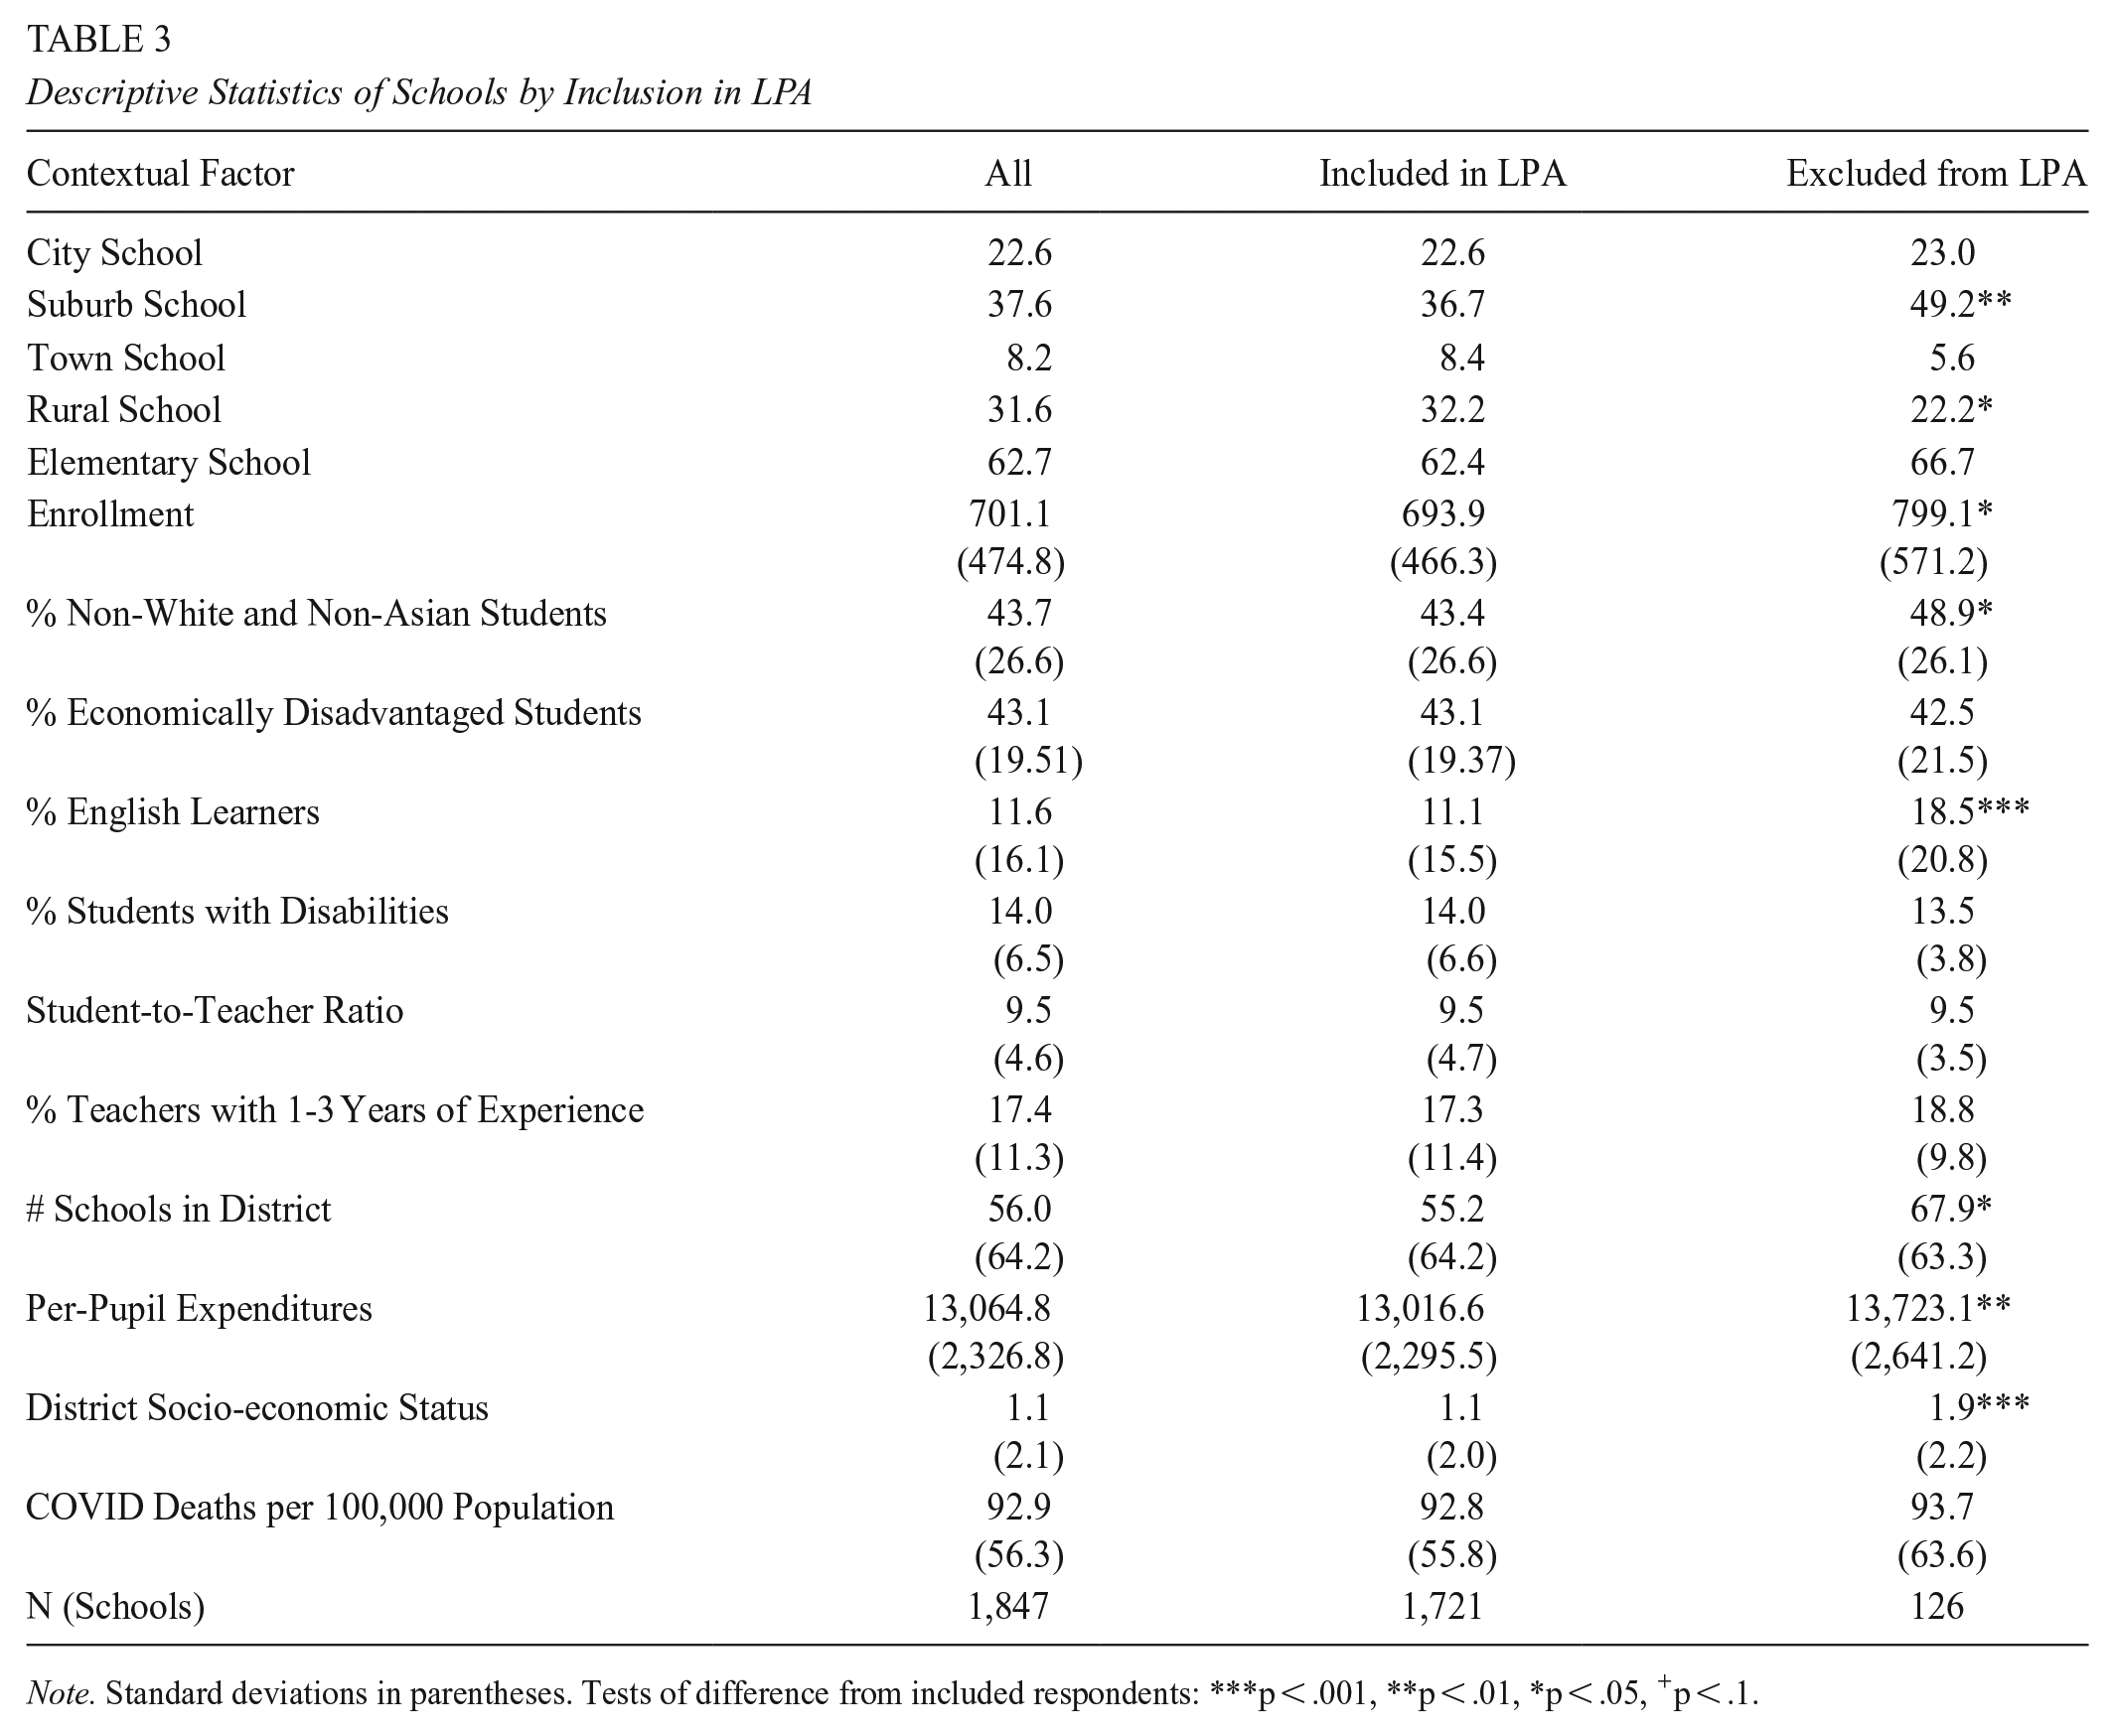
Note. Standard deviations in parentheses. Tests of difference from included respondents: ***p < .001, **p < .01, *p < .05, +p < .1.
Analytic Strategy
In this subsection, we detail how school-level scores were produced before enumerating methods used on a question-by-question basis to analyze those scores.
Scoring the Surveys
Producing scores by summing up the observed item responses is a common practice, yet one that often makes large, untenable assumptions that can bias subsequent analyses (Soland et al., 2022). We therefore used latent variable models that make much weaker assumptions to score the observed survey item responses (i.e., we used factor scores). One wrinkle in producing such scores was that, while teachers responded to the survey, the inferences we wanted to make were at the school level. Thus, we used multilevel confirmatory factor analytic (CFA) models to further examine the factor structure and produce scores. 2 All such models examined each construct individually and assumed that the construct was unidimensional at both the teacher and school levels. 3
To ensure that these models, which stemmed from the hypothesized factor structure based on the research, fit sufficiently, we used fit statistics including the Root Mean Squared Error of Approximation (RMSEA) and Comparative Fit Index (CFI). Sufficiency of the model fit was defined using cutoffs frequently used in the CFA literature (Hu & Bentler, 1999; Steiger, 1990), while also paying attention to some of the ways that item and model characteristics can affect the usefulness of those cutoffs (McNeish & Wolf, 2021). All eight of the models yielded sufficient fit, including at the school level, providing evidence that the hypothesized factor structure was indeed supported by the data (see Table A2 in the supplementary materials). 4
After examining the multilevel structure of the data, we used the models to produce factor scores. All analyses and scoring were conducted in Mplus Version 8.4 (Muthén & Muthén, 2019). Specifically, we used a plausible values approach. As described by Asparouhov and Muthén (2010), latent variables can be thought of as observed variables that have missing data for all observations. Using MCMC Bayesian estimation, we produced 300 imputed values for each latent variable. 5 If a sufficient number of imputed values are drawn, one essentially obtains the entire posterior distribution of the latent variables. We then used those plausible values to produce a school-level score for each construct. 6 This plausible value approach to scoring has several advantages (enumerated by Asparouhov and Muthén [2010]) and has been used commonly in both CFA and item response theory (IRT) applications, including to score achievement tests like the Program for International Student Assessment (PISA).
Identifying School-level Classes of Teacher Working Conditions
To examine how many latent classes appeared to define teacher working conditions, we used the school-level factor scores in our latent profile analysis. The multivariate normal finite mixture model assumed that the overall distribution of scores could be characterized as a weighted sum of multivariate normal distributions as shown in equation 1.

Here,
Classes were identified by fitting various specifications and assuming between one and six classes in light of theoretical considerations related to teacher working conditions. We fit five model specifications that varied in the restrictions placed on the mixture model. Given the large number of parameters of the fully unrestricted model, restricted specifications have been suggested to increase parsimony and simplify estimation (e.g., Steinley & Brusco, 2011). These more restricted specifications are common in mixture model applications (Collie et al., 2015; Perera et al., 2019; Pyhältö et al., 2021; Shukla et al., 2016). The five model specifications were (1) the fully unrestricted model (aka “free”), where all variances and covariances were freely estimated across groups; (2) the unrestricted variance model (aka “LPA”), which has variances freely estimated across groups but which does not estimate covariances; (3) the homoscedastic model (aka “Overall”), which requires equal variances and equal covariances across classes; (4) the homoscedastic variance model (aka “LPA overall”), which constrains indicator variances across classes to be equal and which does not estimate covariances; and, (5) the proportional model, which constrains indicator variances and covariances to be proportional to one another across classes, such that the indicator variance and covariance estimates in additional classes were some fixed amount larger or smaller than those of the first class. Thus, with these five model restrictions and classes ranging from one to six, we estimated and compared 30 models in total. To identify the best fitting model, we used information criteria (AIC and BIC). We also considered information on the separation of classes (for our purposes, the Entropy Index). Finally, once a preferred model was selected, we provided descriptive statistics for each of the factor scores by class to better understand the working conditions that defined each class.
Measuring Relationships with Working Conditions Classes
With the school-level working conditions classes identified, we assessed how they were related to teacher outcomes (job satisfaction and retention intentions) and school contextual factors. Our conceptual framework has working conditions classes influencing (i.e., a predictor of) teacher outcomes and influenced by (i.e., the outcome) school contextual factors. Selecting a preferred model for the latter relationships proved more straightforward, so we have discussed that first.
We estimated two types of exploratory models, each with its own strengths and limitations, to assess how the longstanding school contextual factors were related to the school-level working conditions classes. First, given uncertainty in class membership as reflected by our relatively low entropy, we estimated mixture models predicting class membership. Specifically, we followed the three-step approach proposed by Vermunt (2010), which prevents the inclusion of covariates from changing the composition of the classes. Vermunt’s three-step approach begins with the mixture model to identify the classes (described above) and then assigns schools to classes based on posterior probabilities. In the third step, the assigned class was treated as a nominal latent class indicator in a mixture model, which helped fully account for uncertainty in the class assignment. This approach was our preferred option.
A limitation of this approach, however, was that it does not account for the multilevel nature of the covariates. Some of the covariates we wished to examine were at the district level. Our second approach, therefore, was to fit a multilevel multinomial model of assigned class membership with schools nested in districts. Although this approach cannot account for uncertainty in class membership directly, as Vermunt’s three-step approach did, we weighted the schools by their posterior class probabilities to reflect the uncertainty. (These were the same weights—the inverse of their probability of being assigned to the class—that we have used in all analyses of the classes outside a mixture model, such as to produce figures showing how the working conditions measures varied across the class.) The multilevel models mainly served as a robustness check.
With both model specifications, we examined the contextual factors iteratively. The sole predictor variables models, compared to a multivariate model, were better aligned with the goal of our analysis—to describe how contextual factors vary across class membership.
Vermunt’s three-step approach, however, was not the preferred approach to measure the relationship between the classes and teacher outcomes. Ideally, there would have been a model that met four design principles: (1) fully capture the uncertainty in class assignment, (2) hold class assignments fixed, (3) model teacher outcomes at the teacher-level, and (4) analyze job satisfaction and career intentions as outcomes not predictors. As we mentioned earlier, Vermunt’s three-step mixture model satisfied the first two principles but required all variables be at the school-level (failed principle 3) and that classes were the outcome (failed principle 4). We considered a multilevel mixture model that, although it also required classes to be the outcome (failed principal 4), leveraged the teacher-level variation in job satisfaction and retention intentions. However, it reassigned some schools to different classes (failed principal 2). We chose multilevel regression with the same school-level weights discussed above as our preferred exploratory model. It satisfied the last three principles and, with the weights, partially met the first principle. We still performed analyses with the school-level Vermunt three-step approach to support the multilevel models results, aggregating teacher outcomes to the school level by averaging the teacher satisfaction scale and using an empirical logit to represent the proportion of teachers who were indicated in the other variables (see Veríssimo & Clahsen, 2014).
Results
We begin with a discussion of our results from the latent class analysis, where we identified four different classes of schools based on their teacher working conditions. We describe the broad trends among each of the eight working condition constructs for each class, and then explore how teachers’ general satisfaction and intentions to continue to work in their school varied among the four classes. Finally, we describe the contextual factors that were associated with each class. While institutional characteristics such as school level, geographic locale, and teacher experience were highly predictive of class membership, student demographics were sometimes predictive but on a smaller magnitude.
Four-Class Model of Teacher Working Conditions
Based on the results of the mixture models, we chose the four-class proportional model. Table 4 presents BIC and AIC values for each model’s fit (results using other information criteria were similar and therefore not reported). As the table shows, our preferred model had the second lowest BIC (9219.41), only slightly higher than the three-class proportional model (9216.23), and the second lowest AIC (8816.07), this time only slightly higher than the three-class free model (8732.22). Beyond having a higher AIC, the primary reason for rejecting the three-class proportional model was that it assigned 83% of schools to a single class, which did not match our a priori theory about the class structure based on the working conditions and LPA literature. We rejected the three-class free model because its BIC was higher than nine other models. The entropy for the preferred model was .61. While that entropy was somewhat low, models that improved on entropy often had worse fit and, given that entropy is not a fit statistic, we, therefore, preferred the models with better AIC and BIC values (Curran & Bauer, 2021; Henson et al., 2007). Models with higher entropy also tended to include five classes, with one of the classes representing a very small subset of schools, which raised concerns about overfitting. Substantively, we could see no theoretical justification based on the teacher working conditions literature for a model with that additional, very small class. Therefore, we preferred the models with the best fit, and ultimately the single model with a second lowest BIC and AIC that had the strongest theoretical justification, to the one with improved entropy. (As previously discussed, our three-step approach that used covariates to describe class membership fully accounted for this uncertainty in class membership.)
BIC, AIC, and Entropy Statistics of Latent Profile Analysis Models

Note. Statistics not shown if model produced an error warning indicating that the model was not supported by the data.
Describing the Classes
The largest class contained 1,040 schools (61%). These schools were consistently positive (above average) on all constructs, with mean responses above the overall average across the constructs (see Figure 1). 7 We named this class of schools Supportive. In contrast, Unsupportive schools, the smallest class with 120 schools (7%), were consistently negative (below average) on all constructs, and excessively negative, on two dimensions: physical environment and feeling safe (roughly −.75 SDs and −1 SD, respectively). In fact, there were no differences among the other three classes on either of these two dimensions.
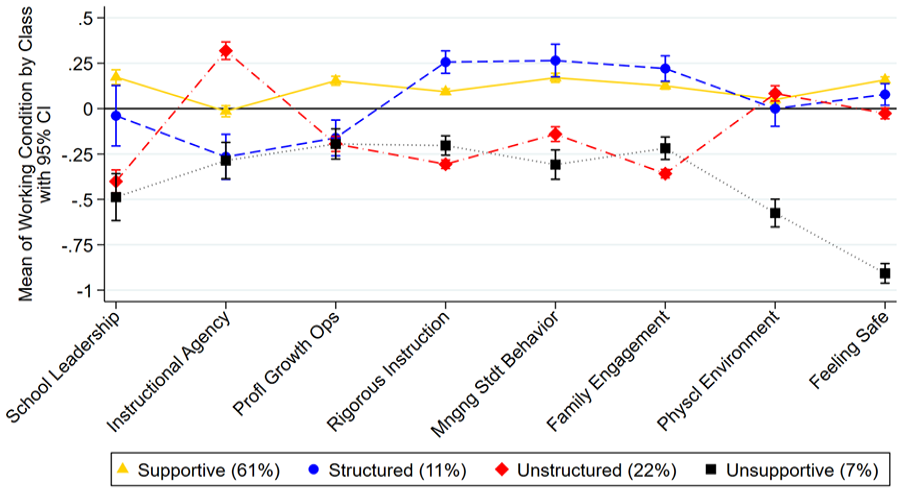
Dimensions of Working Conditions by Latent Class, Standardized Means, and 95% Confidence Intervals
The remaining two classes each had some positive (above average) and some negative (below average) dimensions of working conditions. What set the second largest class (365 schools, 22%) apart from the other classes of schools was that they were high on instructional agency. On five other dimensions—school leadership, professional growth opportunities, rigorous instruction, managing student behavior, and family engagement—they were quite similar to Unsupportive schools. We named this class of schools Unstructured as high values of instructional agency but low values on rigorous instruction, student behavior management, and family engagement seem to offer teachers flexibility and latitude but, based on the survey item questions (see supplementary materials Table A1), pointed to a lack of a structured, schoolwide approach to these workplace features. Finally, in comparison to all other classes, the last class of schools (196 schools, 11%) was highest on the dimensions of managing student behavior, family engagement, and rigorous instruction; and among the lowest for instructional agency and professional growth opportunities. We named this class Structured as, in many respects, it was the opposite of the Unstructured schools. Thus, there appeared to be some schools with standardized approaches to behavior management and instructional rigor at the expense of teacher autonomy, while other schools had higher autonomy, but lower valuations of the school’s instructional rigor and student behavior management.
Teacher Outcomes by Class
Although the survey did not explicitly ask teachers for their overall perceptions of working conditions, it did capture their job satisfaction and career intentions, two teacher outcomes that theory and research suggest are influenced by their working conditions. Teachers in Supportive schools—i.e., those who were comparatively positive on all dimensions—had significantly higher job satisfaction than teachers at schools in the other three classes (p < .01; see Table 5). On average, 45.4% of teachers in a Supportive school strongly agreed that “overall, my school is a good place to work and learn,” significantly more than in Unstructured and Unsupportive schools (36.0% and 22.3%, respectively, p < .001). Supportive schools also had significantly fewer dissatisfied teachers than the other classes (6.6% versus 7.4% and 13.2%, respectively, p < .01). Likewise, teachers in Supportive schools were significantly more likely to indicate an intention to remain teaching at their schools than teachers in Structured and Unsupportive schools (84.9% versus 82.8% and 77.1%, respectively, p < .05). The difference from Unstructured (83.9%) was significant at p = .05. Both Unstructured schools—i.e., those who were high on instructional agency, low on rigorous instruction, managing student behavior, school leadership, and family engagement—and Unsupportive schools—i.e., those who were comparatively negative on all aspects, excessively so on physical environment and feeling safe—also had more teachers intending to leave teaching than did Supportive schools (6.2% and 6.3% versus 5.5%, respectively, p < .01). The findings from Vermunt’s three-step school-level approach, which treats these teacher outcomes as a predictor of classes but fully accounts for the uncertainty of class assignment, revealed largely the same pattern among the four working conditions classes (see supplementary materials Table A4).
Predicted Margins of Teacher Job Satisfaction and Retention Intentions by School-level Working Conditions Classes

Note. Each row represents a separate multilevel regression in which class uncertainty was captured by weighting each school by the inverse of their probability of being assigned to the class. All predictions are significant at p < .001. All differences are statistically significant at p < .05 or better.
Different from Supportive.
Different from Structured.
Different from Unstructured.
Contextual Factors Associated with Class Membership
To help make the results of our predictive models more digestible, we produced predictive probabilities of class membership varying the values of the contextual factors (see Table 6). The preferred three-step mixture model approach, however, does not provide a straightforward way for us to conduct this post-estimation examination. We, therefore, turned to the multilevel multinomial models (discussed earlier) of assigned class membership with schools nested in districts which allow us to derive predicted probabilities. The limitation of this was that these models partially account for uncertainty in class membership (via the weights) whereas the three-step approach fully accounts for uncertainty. Fortunately, the results were very comparable between the three-step mixture model and the multilevel multinomial models (see Table A3 in the supplementary materials). 8 Given this high correspondence, purely for the purpose of making results more digestible, we used results of the multilevel multinomial models to predict class membership probabilities when the sole continuous contextual factor was set to values at the 25th and 75th percentiles or the sole binary contextual factor was set to one versus zero. We then tested whether these two probabilities were statistically different from each other (see Table A4 in the supplementary materials).
School and District Characteristics by Working Conditions Class

Note. Schools weighted by probability of being in their assigned class.
Prior to describing the results, we want to remind readers of the basic characteristics of the four classes of schools. Supportive schools were comparatively positive on all dimensions and highest on school leadership and professional growth opportunities. Structured schools were high on managing student behavior, family engagement, and rigorous instruction, and low on instructional agency and professional growth opportunities. Unstructured schools were high on instructional agency and low on rigorous instruction, managing student behavior, school leadership, and family engagement. Finally, Unsupportive schools were comparatively negative on all constructs, excessively so on physical environment and feeling safe.
School Contextual Factors
Membership in all four classes was predicted by school level (Figure 2). Being an elementary school was positively predictive of being a Supportive and Structured school and negatively predictive of being an Unstructured or Unsupportive school. The opposite was true of secondary schools although the positive likelihood of being an Unsupportive school was not significant.

Change in the Predicted Probability of Membership in Teacher Working Conditions Classes when Sole Binary Predictor Variable Is Set to 1 Versus 0
Geographic locale was a significant predictor for Supportive, Unsupportive, and Unstructured class membership (Figure 2). Being a suburban school relative to all other locales positively predicted Supportive class membership and negatively predicted Unsupportive and Unstructured membership. Town schools were less likely than others to be Supportive and more likely to be Unstructured. City schools were more likely than others to be Unsupportive and less likely to be Unstructured. Finally, rural schools were more likely than others to have Unstructured working conditions. School location was not a significant predictor of Structured class membership.
Membership in each of the four classes was significantly predicted by at least one of the six student body characteristics we examined (Figure 3). The concentration of disabled students was the only student body characteristic that did not predict class membership. Larger schools (in terms of student enrollment) were less likely to be Supportive and Structured, and more likely to be Unstructured. A school’s concentration of students classified as English Learners positively predicted Supportive class membership and negatively predicted Unsupportive and Unstructured membership. A school’s concentration of non-White and non-Asian students was not predictive of either Supportive or Structured class membership but was positively predictive of Unsupportive working conditions and negatively predictive of Unstructured working conditions. A school’s concentration of economically disadvantaged students was not predictive of Supportive or Unstructured working conditions, but positively predicted Unsupportive working conditions and negatively predicted Structured working conditions.

Change in the Predicted Probability of Membership in Teacher Working Conditions Classes when Sole Continuous Predictor Variable Set to the 75th Versus the 25th Percentile Values
Student-teacher ratios positively predicted membership in Supportive and Structured classes, but negatively predicted Unstructured class membership. A concentration of novice teachers positively predicted Unsupportive class membership, but not membership in the other three classes.
District and Community Contextual Factors
With respect to district and community contextual factors, district size positively predicted Supportive and negatively predicted Unstructured class memberships (Figure 3). Socio-economic status positively predicted Supportive and Structured working conditions and negatively predicted Unsupportive and Unstructured working conditions. While per pupil expenditures was not a significant predictor of Supportive working conditions, it positively predicted Structured working conditions and negatively predicted Unstructured working conditions. Finally, Supportive class membership was the only class negatively predicted by COVID death rates. Higher COVID death rates positively predicted Unsupportive and Unstructured class membership.
Discussion
In this study, we examined how teachers’ survey responses identify classes of schools with similar working conditions, how teacher job satisfaction and career intentions vary across those classes, and how contextual factors are associated with school membership in those classes. Identifying four unique classes of schools, we provided a model for a more holistic and dynamic view of working conditions. In particular, the LPA mixture models allowed for a description of each school’s working conditions that was richer than “high” versus “low.” Our models allowed us to identify classes of schools such that, within a class, they could have high values on some working conditions and average or low values on others. Demonstrating a more nuanced and dynamic approach to classifying schools based on their working conditions can help education leaders and policymakers shift more attention towards improving school context. With knowledge of how dimensions of working conditions coexist within and covary across schools, decision-makers can provide schools with targeted supports and investments.
We find it promising that many more schools fell into the Supportive class—the class that was positive on all constructs—than any other class. Despite many reports of teachers’ feeling unsupported in their work, a large set of Virginia schools were composed of teachers with relatively positive perceptions of their workplace. We do want to acknowledge the potential for response biases such as social desirability bias or acquiescence bias; however, we attempted to mitigate these biases by making clear that all survey responses would remain anonymous and that no one at the school or district level would have access to the survey results. The Unsupportive class—the class that was comparatively negative on all constructs, and excessively so on physical environment and feeling safe—was the smallest, which is also promising given that teachers in this class have the lowest job satisfaction and lowest retention intentions. That physical environment and feeling safe were incredibly low for Unsupportive schools—working conditions that typically require substantial financial resources such as adequate, clean learning spaces that are conducive to teaching and learning, and appropriate security features that help teachers and students feel safe—suggests that identifying schools where teachers feel unsafe and providing targeted supports to those schools could improve job satisfaction. Such approaches could hypothetically, in turn, reduce teacher turnover—a key approach to improving student-teacher relationships and academic outcomes.
Our preferred model produced classes that suggest that tradeoffs may exist among dimensions of working conditions within schools. One potential tradeoff is between instructional agency and three other dimensions—rigorous instruction, managing student behavior, and family engagement. This is clearest among Structured and Unstructured schools, which are mirror images of one another. Teachers want schools to provide them with sufficient time for and autonomy over their classroom instruction while establishing a clear and consistent approach to managing student behavior and engaging families (Johnson, 1990, 2019). The Unstructured schools class suggests this greater instructional agency resulted in more teachers adopting an instructional approach that does not encourage the traits that, according to Virginia’s Profile of a Graduate, all students need for future success (as captured by the rigorous instruction dimension). Within this environment where many teachers do not feel that all their peers are aligning their instruction to standards, there are also inconsistent approaches to managing student behavior and engaging families. In Structured schools, where teachers felt that instruction was more rigorous and that there was a more consistent, school-wide approach to student behavior management and family engagement, teachers had less instructional agency.
This apparent tradeoff emphasizes the importance of school leadership, as school leaders are central to establishing a unified approach to rigorous instruction, student behavior management, and family engagement. The school leadership construct was made up of survey items related to (1) trust in the school administration, (2) consistent and objective teacher evaluation, and (3) administration’s clear vision for the school and high expectations for all students. Thus, high instructional agency may come at the expense of teachers feeling less trust in administration, a weaker sense of a common vision for the school, and concern that their evaluation does not fairly capture their work. Other research has suggested that as teaching has grown more collaborative, many teachers have accepted this tradeoff, indicating they wanted to work in schools that have “achieved a sensible balance between order and autonomy” (Johnson, 2019, p. 239). Merrill’s (2021) grouping of school leadership and teacher empowerment into a single category reflected this tension.
These patterns were also evinced, though muted, in Supportive schools. Teachers in these schools had above average perceptions of school leadership, rigorous instruction, managing student behavior, and family engagement but only average perceptions of instructional agency. It could be that these schools are figuring out a school-wide approach to engaging families and managing student behavior and how to support teachers in aligning their instruction with the goals of Virginia’s Profile of a Graduate while still providing teachers with instructional agency.
Differences between Elementary and Secondary Schools
The level of a school (elementary or secondary) was strongly predictive of class membership, and this provides additional insight into working condition tradeoffs. Being a secondary school was predictive of Unstructured class membership, the class that was high on instructional agency and low on rigorous instruction, managing student behavior, school leadership, and family engagement. The nature of teaching in a secondary school, where teachers can sometimes be the only educator teaching a specific course, may contribute to this relationship. The rigorous instruction dimension is illustrative here. The questions that made up that dimension emphasize the teaching of skills that have become more controversial in recent years, such as expecting students to use facts and evidence to support their ideas, encouraging students to value and search for a diversity of opinions, and providing constructive feedback to others. Scoring lower-than-average on this construct at the school level suggests that teachers in Unstructured schools—many of which are secondary schools—may find it difficult, or perhaps more challenging in America’s current social and political context to engage in this type of instruction, especially without fear or risk of backlash from parents or school board members (e.g., Nocera, 2021). That Unstructured schools had lower than average scores on the student behavior and family engagement constructs aligns with evidence that, in secondary schools, family engagement is more limited and tends to decrease (Lawson, 2003; Noel et al., 2016) and managing student behavior becomes more complex (Obenchain & Taylor, 2005).
In contrast, that elementary schools were heavily represented among Structured and Supportive schools, both of which had relatively high scores on family engagement, instructional rigor, and student behavior management constructs, aligns with research showing relatively higher family engagement in the lower grade levels (Noel et al., 2016), fewer major student behavior issues (Lawson, 2003), and stronger emphasis placed on cross-grade and cross-content instructional alignment (Tanenbaum et al., 2017). Teachers in Structured schools—again, primarily elementary—reported lower levels of instructional agency. A potential practical connection to this is that elementary teachers are often certified as generalists and not, as is true in Virginia, certified in specific subjects. As such, elementary teachers often work in grade-level or content teams to develop structured and aligned curricular materials that cover required state standards.
Contextual Factors Associated with Teacher Working Conditions
While school level was highly predictive of class membership, student body characteristics, district per pupil expenditures, and geographic locale were also sometimes predictive, but often on a smaller magnitude.
The Role of Student Body Characteristics
Given that students with disabilities, students of color, students classified as English learners (ELs), and students living in low-SES households have been historically underserved by America’s public school system (Kozol, 2012; Walters, 2001), it is important to interrogate the teacher working conditions within schools serving those students. We find it promising that the concentration of students classified as ELs positively predicts Supportive class membership, as it is important that teachers of students classified as ELs have the resources they need to best improve academic outcomes and English language proficiency (Santibañez & Gándara, 2018). While initially it may appear promising that the concentration of students with disabilities does not predict class membership, it is imperative that students with disabilities are being equitably served by the public school system and attention should be paid to supporting and investing in schools where job satisfaction and intentions to leave are high—particularly in Unsupportive schools, which have the highest concentration of students with disabilities.
A school’s concentration of non-White and non-Asian students and economically disadvantaged students was not predictive of Supportive class membership. We see this as encouraging. The higher teacher turnover in schools serving students who have been historically underserved in K–12 public schools has been attributed to the poor working conditions at these schools (Horng, 2009; Simon & Johnson, 2015). Our findings showed that some schools serving these student groups have identified a way to provide teachers supportive working conditions. This, however, was not true of all schools, as the concentration of non-White and non-Asian students and economically disadvantaged students was positively predictive of Unsupportive working conditions. As such, it remains imperative that policymakers and leaders of school systems identify mechanisms to develop and sustain equitable access to supportive working conditions for teachers within these schools.
A Role for School Funding
Improving teacher working conditions cannot be done on the cheap (Ingersoll, 2017). While per pupil expenditures were not predictive of Supportive or Unsupportive class membership, they were positively predictive of Structured and negatively predictive of Unstructured class membership. Unlike in Unstructured schools, teachers in Structured schools felt that there was a more uniform approach to student behavior management, family engagement, and rigorous instruction, suggesting that expenditures may play a part in a school leader’s ability to cultivate these conditions. Moreover, while per pupil expenditures were not predictive of Unsupportive class membership, policymakers may consider other revenue sources beyond per pupil expenditures that may impact teachers’ working conditions. In particular, the starkest difference between Unsupportive schools and other classes of schools were the very low ratings on physical environment and feeling safe. One means of improving working conditions, particularly in schools where teachers may have negative perceptions of their physical environment, is through capital improvements. In Virginia, capital improvements require districts to secure the passage of local bonds. Compared to higher-income communities, low-income communities may find it more challenging to pass bonds that tax themselves at higher rates, and, when successful, must tax themselves at a higher rate in order to garner the same amount of revenue for improved physical space and safety. State policies and approaches to funding related to capital outlay and safety in schools may need to be reexamined with an eye toward equity in access to funds to improve physical environments in Unsupportive schools (Joint Legislative Audit and Review Commission [JLARC], 2023).
Teacher Working Conditions and Teacher Outcomes
Our analyses indicate that teacher job satisfaction and intentions to remain teaching were greater in schools with Supportive working conditions with the differences in job satisfaction being larger. When overall teacher perceptions of working conditions among teachers are positive, as they are in Supportive schools, teachers are significantly more satisfied with their career than teachers in the three other classes of schools. With respect to career intentions, we find Supportive schools have no differences from Unstructured schools, but significant differences from Structured and Unsupportive schools. While intentions to leave and actual teacher attrition are not always aligned, understanding teacher intentions to leave has value on its own terms (Nguyen et al., 2024). Teachers wishing to leave are likely to be less engaged with and feel less connected to their work and school. Intentions, therefore, are important given the body of research showing that teachers who have higher self-efficacy and feel connected to the school community perform better in the classroom (Zee & Kooman, 2016). We must acknowledge that the pandemic likely influenced the amount of job satisfaction and career intentions that the survey captured in early 2021. To the extent that COVID influenced these teacher outcomes independent of working conditions, our findings may understate the relationship that would have been observed outside the COVID pandemic.
The Potential Role of COVID
A growing body of research has highlighted the COVID pandemic’s impacts on many aspects of education. It may also have influenced the school-level classes of teacher working conditions. While it is impossible to fully test for this, we piloted the LPA approach with data from a survey administered in spring 2019. The eight dimensions of working conditions were largely the same between the two waves; however, roughly 20% of the items in each survey were unique. Nevertheless, comparing the 2019 and 2021 LPA results helped us assess the pandemic’s role in determining the 2021 class structure.
As it was with the 2021 data, the four-class proportional model fit the data the best (see supplementary materials Table A7). The largest class (class 1) was above average on all dimensions, comparable to the Supportive class, and the smallest class (class 4) was below average on all dimensions, similar to the Unsupportive class in 2021. A third class (class 3) was above average on many dimensions and had the highest values on the factors aligned with the 2021 dimensions of rigorous instruction, managing student behavior, and family engagement, as did the Structured class. The fourth class (class 2) was below average on all dimensions but not the lowest on any. On the whole, these findings suggest that the four class structure we observe in our 2021 analysis was largely consistent with the structure we identified in 2019 despite some differences in the survey measures and the potential influence COVID. Given the similarities between the 2019 and 2021 LPA results, combined with the fact that most of the 2021 teacher respondents reported little to no change in their schools’ working conditions, we are reasonably confident that we would not have identified a wholly different class structure in 2021 in the absence of the pandemic.
Limitations
The results from our analysis were derived from a single year of data on Virginia schools. This presented a set of limitations that should be remembered when interpreting the findings and extrapolating beyond our sample.
Our analysis was exploratory and as such was purely descriptive. The findings from this study represented patterns of correlation within and across schools and were not causal estimates. Our analysis included many tests of statistical significance. Since we viewed this as an exploratory study, we did not correct the statistical tests to account for the multiple comparisons. Therefore, readers should not interpret our findings causally and should be cautious about overinterpreting statistical significance alone.
Care must also be taken when generalizing the findings beyond Virginia and beyond this time when COVID conditions could have influenced teacher perceptions of working conditions. The survey was constructed using well-established measures of working conditions that are salient in other states, but contextual factors specific to Virginia mean that the four classes we identified are not necessarily the same classes that would be identified in other states. Similarly, changes to working conditions over time suggests that other years of data on these same schools could have produced different groupings. We encourage future research to explore working conditions classes in other states and over other timeframes.
The classes we identified here do not suggest that schools within a given class were homogeneous, nor that they were always completely distinct across classes. Schools were assigned to classes to which they had the strongest probability of membership, and the analyses accounted for that probability (i.e., uncertainty in class membership). This caveat was especially important here given the relatively low entropy of our preferred solution. A strength of the LPA approach was that it allowed us to generalize about groups of schools, but readers should keep in mind that delineation of the classes was not as clear as one might ideally hope for in a policy context where supports and interventions to improve working conditions might be evaluated.
The classes we identified likewise do not necessarily suggest that working conditions were experienced in the same way by all teachers within a school. There could be teacher-level characteristics, such as demographics, experience, or types of teaching assignments, that influenced how teachers experience their schools. Our research question chose to focus on school-level working conditions, but future analyses could explore within-school variation working conditions.
Conclusion
Teachers are critical to student success, and working conditions are important contributors to the recruitment, development, and retention of effective teachers. The purpose of this analysis was to investigate patterns in teacher working conditions at the school-level and to detect differences between classes of schools. Our findings identified patterns that painted a holistic picture of how levels of working conditions coexist within schools across Virginia.
A key advantage of our approach is that it allows working conditions to be more than just a single measure on the continuum from bad to good. Instead, we uncovered four classes of working conditions that described a much more nuanced picture. In most schools (61%), teachers had Supportive working conditions with above average scores on seven of the eight dimensions. Supportive schools, however, did not have the highest average scores across all dimensions. Structured schools were the most successful at ensuring that teachers delivered rigorous instruction characterized by a set of common traits, and Unstructured schools provided teachers the most instructional agency. Teachers from a comparatively small group of schools (7%) had unsupportive working conditions with below-average scores on all dimensions, yet some working conditions dimensions were more positive than those in Unstructured schools. These findings indicate that different dimensions of working conditions do not move in lockstep with each other.
The analysis presented here is an important step toward a fuller understanding of the working conditions experienced by public teachers in a diverse state. The results confirmed that dimensions of working conditions coexist within schools in nuanced ways and that there are important commonalities across schools within a working conditions class. By offering a more holistic picture of a school’s working conditions than that which can be provided by a set of scores for each dimension, the classes can serve as a framework for tailoring resources and supports to schools. State leaders can develop and fund assistance programs that meet schools where they are. Our analysis has shown that some schools will need more assistance (people and funding) than others. District leaders can use this framework to differentiate the ways they corral and distribute resources to schools, and school leaders can use it to advocate for themselves. Working conditions classes, however, should not be used to label schools as good or bad or be included in states’ accountability and accreditation systems. The value of the classes lies with motivating and facilitating improvement and not in publicly shaming or forcing improvement.
Supplemental Material
sj-docx-1-ero-10.1177_23328584251321454 – Supplemental material for Latent School-Level Classes of Teacher Working Conditions in Virginia: Description, Teacher Preferences, and Contextual Factors
Supplemental material, sj-docx-1-ero-10.1177_23328584251321454 for Latent School-Level Classes of Teacher Working Conditions in Virginia: Description, Teacher Preferences, and Contextual Factors by Luke C. Miller, James Soland, Daniel W. Lipscomb, Daniel W. Player and Rachel S. White in AERA Open
Footnotes
Declaration of Conflicting Interests
The author(s) declared no potential conflicts of interest with respect to the research, authorship, and/or publication of this article.
Funding
The author(s) disclosed receipt of the following financial support for the research, authorship, and/or publication of this article: The research reported here was supported by the Institute of Education Sciences, U.S. Department of Education, through Grant R305A200106 to the University of Virginia. The opinions expressed are those of the authors and do not represent views of the Institute or the U.S. Department of Education.
Notes
Authors
LUKE C. MILLER is a research associate professor in the School of Education and Human Development at the University of Virginia, 405 Emmet St. South, Charlottesville, VA 22904;
JAMES SOLAND is an associate professor of research, statistics, and evaluation at the University of Virginia School of Education and Human Development, 405 Emmet St. South, Charlottesville, VA 22904;
DANIEL W. LIPSCOMB is a research specialist at the University of Virginia School of Education and Human Development, 405 Emmet St. South, Charlottesville, VA 22904;
DANIEL W. PLAYER is an associate professor of public policy at the University of Virginia Batten School of Leadership and Public Policy, 235 McCormick Rd, Charlottesville VA 22903;
RACHEL S. WHITE is an associate professor of education leadership and policy at the University of Texas at Austin, George I. Sanchez Building, 1912 Speedway, Austin, TX 78705;
References
Supplementary Material
Please find the following supplemental material available below.
For Open Access articles published under a Creative Commons License, all supplemental material carries the same license as the article it is associated with.
For non-Open Access articles published, all supplemental material carries a non-exclusive license, and permission requests for re-use of supplemental material or any part of supplemental material shall be sent directly to the copyright owner as specified in the copyright notice associated with the article.