
Abstract
Many states and school districts are implementing reforms to reduce reliance on exclusionary discipline such as out-of-school suspension and expulsion. This article uses survey and administrative data to study the implementation of a state-level policy limiting elementary school out-of-school suspension and expulsions. While the results are limited in sample size and generalizability, we find that survey respondents from relatively disadvantaged schools reported greater difficulties and challenges with implementation and tended to comply at lower rates. Policy makers seeking more equitable implementation of these types of reforms should work with schools to better understand and attend to local preferences, buy-in, and capacity for implementation.
Keywords
Introduction
In recent years, many school districts and states have sought to reduce exclusionary discipline such as out-of-school suspension (OSS) and expulsion due to growing awareness of the academic and life consequences of excluding students from school (e.g., Anderson, Ritter, & Zamarro, 2019; Bacher-Hicks et al., 2019; Chu & Ready, 2018; Davison et al., 2021; Fabelo et al., 2011; Nicholson-Crotty et al., 2009; Wolf & Kupchik, 2017), as well as concern about disproportionalities in exclusionary discipline by race and disability status (e.g., Anderson, 2021; Anderson & Ritter, 2017; Liu et al., 2021; Losen et al., 2015; Shi & Zhu, 2021; Skiba et al., 2011; Skiba et al., 2014; Sullivan et al., 2013; Vincent et al., 2012).
In this article, we study the school-level implementation of an Arkansas state law restricting the use of exclusionary discipline in elementary schools. Act 1059 stated that districts “shall not use out-of-school suspension or expulsion for a student in kindergarten through grade five” except when the behavior “poses a physical risk” or “causes a serious disruption that cannot be addressed through other means.” We combine administrative data with survey responses from principals and counselors to ask the following research questions:
We use empirical evidence of similar discipline reforms, as well as theoretical perspectives on policy implementation to frame our study. Similar student discipline reforms have been incompletely implemented (Anderson, 2018; Steinberg & Lacoe, 2018) due to a variety of reasons that may include lack of staffing and space for in-school options (A. N. Gray et al., 2017), unawareness or impracticality of alternative approaches, or lack of buy-in due to local preferences and needs. School leaders and support staff are in a unique position to influence the implementation of discipline policy, so understanding their perspectives on reforms such as Act 1059 is important for assessing implementation.
While the results are limited in terms of sample size and generalizability, we find that survey respondents from relatively disadvantaged schools reported greater difficulties and challenges with implementation, and less success postpolicy. There is also suggestive evidence that relatively disadvantaged schools complied at lower rates. Our findings indicate inequities with respect to the policy implementation challenges schools were facing and the potential impact on the school community. Policy makers seeking more equitable implementation of these types of reforms should work with schools to better understand and attend to local preferences, buy-in, and capacity for implementation.
In the sections that follow, we discuss relevant literature on the issue of exclusionary discipline in schools, the research related to reforms in this area, as well as theories related to policy implementation that help frame our study. Then, we describe Act 1059 and the Arkansas policy context, the data and methods, our results, and the implications for policy and practice.
Literature Review and Theoretical Framework
Exclusionary Discipline in Schools
Exclusionary discipline removes students from the learning environment and is associated with worse academic outcomes, including lower achievement, grade retention, and dropout (Anderson, Ritter, & Zamarro, 2019; Balfanz et al., 2014; Chu & Ready, 2018; Cobb-Clark et al., 2015; Fabelo et al., 2011; Noltemeyer et al., 2015; Suh & Suh, 2007; Swanson et al., 2017). Students excluded from school for disciplinary reasons are also more likely to be arrested or involved in the criminal justice system (Davison et al., 2021; Fabelo et al., 2011; Mowen & Brent, 2016; Nicholson-Crotty et al., 2009; Wolf & Kupchik, 2017).
Black students in particular are at higher risk of being suspended (e.g., Anderson & Ritter, 2017; Losen et al., 2015; Skiba et al., 2011; Skiba et al., 2014; Skiba et al., 2002; Sullivan et al., 2013; Vincent et al., 2012). The racial gaps in student discipline are not simply due to differences in rates of misbehavior, as Black students tend to receive more exclusionary consequences, controlling for the type of infraction (Anderson & Ritter, 2017; Ritter & Anderson, 2018), and even when comparing outcomes for students involved in the same incident, such as a fight between students from different racial or ethnic backgrounds (Barrett et al., 2019; Liu et al., 2021; Shi & Zhu, 2021). One reason that Black students are disproportionately suspended is that they attend more punitive, exclusionary schools (Anderson & Ritter, 2017; Christie et al., 2004; Gopalan & Nelson, 2019; Payne & Welch, 2010; Sheldon & Epstein, 2002; Skiba et al., 2014; Welch & Payne, 2010). When students are assigned to high suspension schools, this harms their educational attainment and increases their likelihood of arrest and incarceration as an adult (Bacher-Hicks et al., 2019).
Of particular concern is the exclusion of young students, although there is a lack of causal evidence in this area. Exclusionary discipline may be developmentally inappropriate for young children still learning school norms (Jacobsen et al., 2019). If formal sanctions become stressors, they might result in behavioral problems, and younger students may be less able to cope appropriately (Agnew & Brezina, 2010). Furthermore, students suspended in elementary school are also more likely to be suspended in middle school (Raffaele Mendez, 2003).
Reforms to School Discipline Policy and Practice
Many states and school districts have made efforts to reduce reliance on exclusionary discipline and incorporate alternative approaches, with mixed results. Broadly, these efforts can be categorized as policy reforms or programmatic responses. Policy-based suspension reforms include reducing the length of suspensions, reducing the type of infractions for which suspension is legal, and eliminating mandatory suspensions. Some of these reforms have focused on elementary grades. As of 2018, at least 16 states, plus Washington D.C., limited the use of suspension or expulsion in early grade levels (Rafa, 2018). 1 In many cases, these laws allow exceptions, particularly for safety concerns. 2
A growing body of evidence indicates discipline policy reforms have had mixed effects depending on the outcomes and group of students assessed (Anderson, 2020; Anderson, Egalite, & Mills, 2019; Hashim et al., 2018; Hinze-Pifer & Sartain, 2018; Lacoe & Steinberg, 2018; Sartain et al., 2015; Steinberg & Lacoe, 2018). The way such policies are implemented is important for interpreting their effects. For example, a 2013 ban on OSS for truancy in Arkansas led to slight increases in attendance, with suggestive evidence of achievement gains and reductions in disciplinary referrals (Anderson, 2020), but schools with more non-White students were less likely to comply with the policy (Anderson, 2018). Steinberg and Lacoe (2018) studied a reform in Philadelphia that prohibited OSS for classroom disorder infractions and found that students who had previously been suspended had improved attendance and reduced classroom disorder OSS after the reform. Where the policy was implemented fully, nonsuspended peers did not experience spillover effects, but where the reform was not implemented fully, nonsuspended students experienced decreased attendance and math achievement.
There is still relatively little evidence on discipline reforms focused on elementary schools, a gap this study begins to fill. One exception is an analysis of Maryland’s 2017 law prohibiting suspension or expulsion in preK through second grade, with some exceptions (Maryland State Department of Education, 2020). The report showed, after this law, OSS was not eliminated, but decreased significantly, with declines in each grade PK–2 and for most groups of students. While most local school systems reduced their use of suspensions, a few showed no statistically significant difference postreform. The current study adds to the currently limited literature on the implementation and impact of school discipline reforms in elementary grades.
Administrator and Educator Roles and Perspectives on Student Discipline
A variety of individual-, school-, and system-level factors may influence school personnel’s perspectives on and implementation of student discipline reform. Our investigation into these potential relationships is informed by the role of individual school personnel in student discipline policy and practice, as well as the literature on policy change, dissemination, and implementation.
We seek to understand principal and counselor perspectives on Act 1059, as their role and perspectives are relevant to the fidelity of reform implementation. Teachers’ perspectives would also be informative, as they are often involved at the disciplinary referral stage, but gaining contact information for a representative set of teachers across the state was not feasible.
Principal perspectives are particularly important, as principals tend to be responsible for making decisions about how to respond to referrals, within the bounds of district policies (e.g., codes of conduct). As such, principals are in a unique position to influence school climate and discipline practices. For example, principals’ propensity to remove students for misbehavior has an impact on important outcomes; greater principal propensity to remove reduces the number of reported offenses—a possible deterrence effect—but increases use of exclusionary discipline conditional on referral, juvenile justice referrals, and student dropout (Sorenson et al., 2021). Also, principals with more favorable attitudes toward exclusionary discipline use it at higher rates (Mukuria, 2002; Skiba et al., 2014).
School counselors have training to prevent disruptive behavior and collaborate with other school personnel to establish policies or programs that prevent disruptive behaviors. Typically, for the purposes of maintaining positive relationships with students, school counselors are not involved with administering discipline, yet they may be a “significant contributor to the development of the prevention and intervention programs through which problem behaviors are managed and positive behaviors are nurtured” (American School Counselor Association, 2020). As a result, we include counselor perspectives on this reform as well.
Policy Adoption and Implementation
Literature on policy implementation is particularly relevant here. There may be local factors that prevent full implementation of state policy. Successful policy implementation requires resources and capacity, and if a policy’s demands outweigh the ability or will of local actors, implementation fidelity may suffer (Cohen et al., 2007; Hill & Hupe, 2003; Matland, 1995; McLaughlin, 1987). Disconnect between policy intent (at the state-level) and perception (at the local-level) may create implementation issues, as policy makers have been characterized as “ignorant of practice” (Cohen et al., 2007, p. 522). Top-down theorists have suggested that policies should have clear, consistent goals and limit the amount of change necessary from local actors (Mazmanian, & Sabatier, 1983; Van Meter & Van Horn, 1975).
Policy ambiguity—although sometimes necessary to build a coalition to get legislation passed (Baier et al., 1986; Matland, 1995)—may prevent policy from being implemented as intended (Baier et al., 1986; Cohen et al., 2007; Firestone, 1989; Sabatier & Mazmanian, 1979; Weatherly & Lipsky, 1977). Ambiguous policy language or goals may mean practitioners do not have a clear vision for implementation (Cohen et al., 2007; Matland, 1995). In the case of Act 1059, there is relatively ambiguous language about the allowable exceptions to ban, which creates an opportunity for misalignment between original intent and eventual implementation.
Finally, practitioner beliefs and attitudes, which may be highly context dependent, also play an important role in how policies will be implemented. Principals filter policy through their own beliefs and worldviews, affecting interpretation (Spillane et al., 2002). Given the relationship between administrator attitudes and exclusionary discipline use (Mukuria, 2002; Skiba et al., 2014), such beliefs and attitudes are nontrivial.
In addition to theories of policy implementation (discussed above), there are theories related to policy adoption and diffusion that are useful for exploring why certain laws are enacted in certain states at certain times. There are schools of thought related to whether policy is largely static, unchangeable, and path dependent, more dynamic and adaptable, or a combination, in which policy is slow to change at times, and very responsive to issues and pressure to reform in others, depending on contextual factors (see Cohen-Vogel & McLendon, 2012, for discussion). Within this third perspective, theories of punctuated equilibrium (Baumgartner & Jones, 1991, 1993), multiples streams (Kingdon, 1984), policy regimes (Skowronek, 1993), and policy innovation and diffusion (Berry & Berry, 1990; V. Gray, 1994; Mintrom, 1997; Walker, 1969), have all sought to explain the nature of policy change, and may be useful for understanding the enactment of state education policy. Even though a test of these theories is out of the scope of the current study, these theories would be useful for future research in this area.
Arkansas Act 1059
Arkansas Act 1059 of 2017 stated: The school district shall not use out-of-school suspension or expulsion for a student in kindergarten through grade five (K–5) except in cases when a student’s behavior: (A) Poses a physical risk to himself or herself or to others; or (B) Causes a serious disruption that cannot be addressed through other means.
Prior to Act 1059, Arkansas’ school districts had a high degree of flexibility regarding student discipline, 3 except that suspensions for truancy offenses were banned by Act 1329 of 2013. While Act 1059 did not completely ban OSS or expulsion, the apparent intent was to significantly reduce exclusionary discipline in grades K-5 except in extreme circumstances. Act 1059 did not limit in-school suspension (ISS) and did not specifically mention alternative approaches, although Act 1329 of 2013 encouraged the use of “evidence-based strategies” such as “positive behavior interventions and support systems” and “restorative justice.” Effective implementation of such approaches requires time and resources, and top–down policy reforms may conflict with local perspectives on how disciplinary issues should be handled based on local needs. As a result, it is important to understand how this law was perceived and implemented across different school contexts. This study is important given that a 2013 Arkansas law banning OSS for truancy was not implemented fully or equitably (Anderson, 2018), and as a result, had limited impact on student outcomes (Anderson, 2020).
Data and Survey Methods
We use data from three sources: (1) restricted-use data provided by the Arkansas Department of Education, (2) publicly available data from the National Center for Education Statistics (NCES), and (3) survey responses from elementary school principals and counselors.
Administrative and Publicly Available Data
The administrative data include 5 years (2014–2015 through 2018–2019) of student demographics, test scores, and infraction-level disciplinary incident records for Arkansas public school students in grades K–5, including charter schools. Student-by-year level data are used to create school-by-year level measures of demographic information (e.g., total school enrollment, school percent FRL (free or reduced-price lunch), school percent non-White students, and school percent special education). Similarly, student-by-year level test scores on state mathematics and reading/English language arts (ELA) test for students in Grades 3 to 8 for all tests administered without accommodations 4 are standardized by subject, grade level, and academic year to have a mean of zero and standard deviation of one (i.e., z-scores), and then averaged at the school-by-year level. We hypothesize that school size, student demographics, and achievement will be statistically related to our outcome measures, and these serve as our main variables of interest. School percent special education is used primarily as a control variable.
The discipline data include infraction and consequence types for each incident. Table 1 presents the frequency of each infraction and consequence type, by year. Beginning in 2016–2017, the state reported new categories that were previously included in an “other” category. 5 Over time, the number of “other” infractions and consequences, including these new groups, generally increased. This does not necessarily mean that these “other” misbehaviors were on the rise, as reporting of these incidents may have been increasing as well. Furthermore, there is uncertainty about what is included in this category, and it may still include relatively serious incidents. From 2014–2015 to 2018–2019, the most common infraction types were disorderly conduct (34.5% of K–5 infractions) and insubordination (16.3%). For our analyses, we group these together as “subjective” infractions. Given Act 1059’s exception for behaviors that pose a risk of physical harm, we expect to see more declines among these subjective infractions. Panel B shows the consequences reported during this period. Across all 5 years, the most common consequences were “other” (41.1%), ISS (28.4%), OSS (16.0%), and corporal punishment (13.9%).
Frequency of Infractions and Consequences, Grades K–5, by Type (2014–2015 to 2018–2019)

Note. Beginning in 2016–2017, some additional categories began being separately reported. About 1% of infractions resulted in more than one consequence type. The numbers reported indicate the most-exclusionary/severe consequence type. Thus, each category may include some incidents that resulted in the reported category plus some less exclusionary/severe consequences. Act 1059 was passed in April of 2017, near the end of the school year, so we include all years 2014–2015 to 2016–2017 as pre-Act 1059, and the years 2017–2018 and 2018–2019 as post-Act 1059. ALE = alternative learning environment.
Table 2 reports the types of infractions for which OSS and expulsion were given, in Grades K–5, by year. The first four columns indicate counts, by type. Most elementary OSS/expulsion is for subjective infractions like disorderly conduct (31.7% of OSS and expulsion over this 3-year period) and insubordination (12.5%), as well as fighting (19.6%), and “other” (24.0%). 6 The last four columns show the share of infractions resulting in OSS or expulsion, by infraction type. Violence/weapon infractions result in OSS/expulsion at a higher rate (35.8%), as do substances (49.5%), gang-related incidents (57.9%), and terroristic threats (53.0%). Subjective infractions only result in OSS/expulsion 13.6% of the time.
Types of Infractions for Which K–5 Students Are Expelled or Suspended (2016–2017 to 2018–2019)
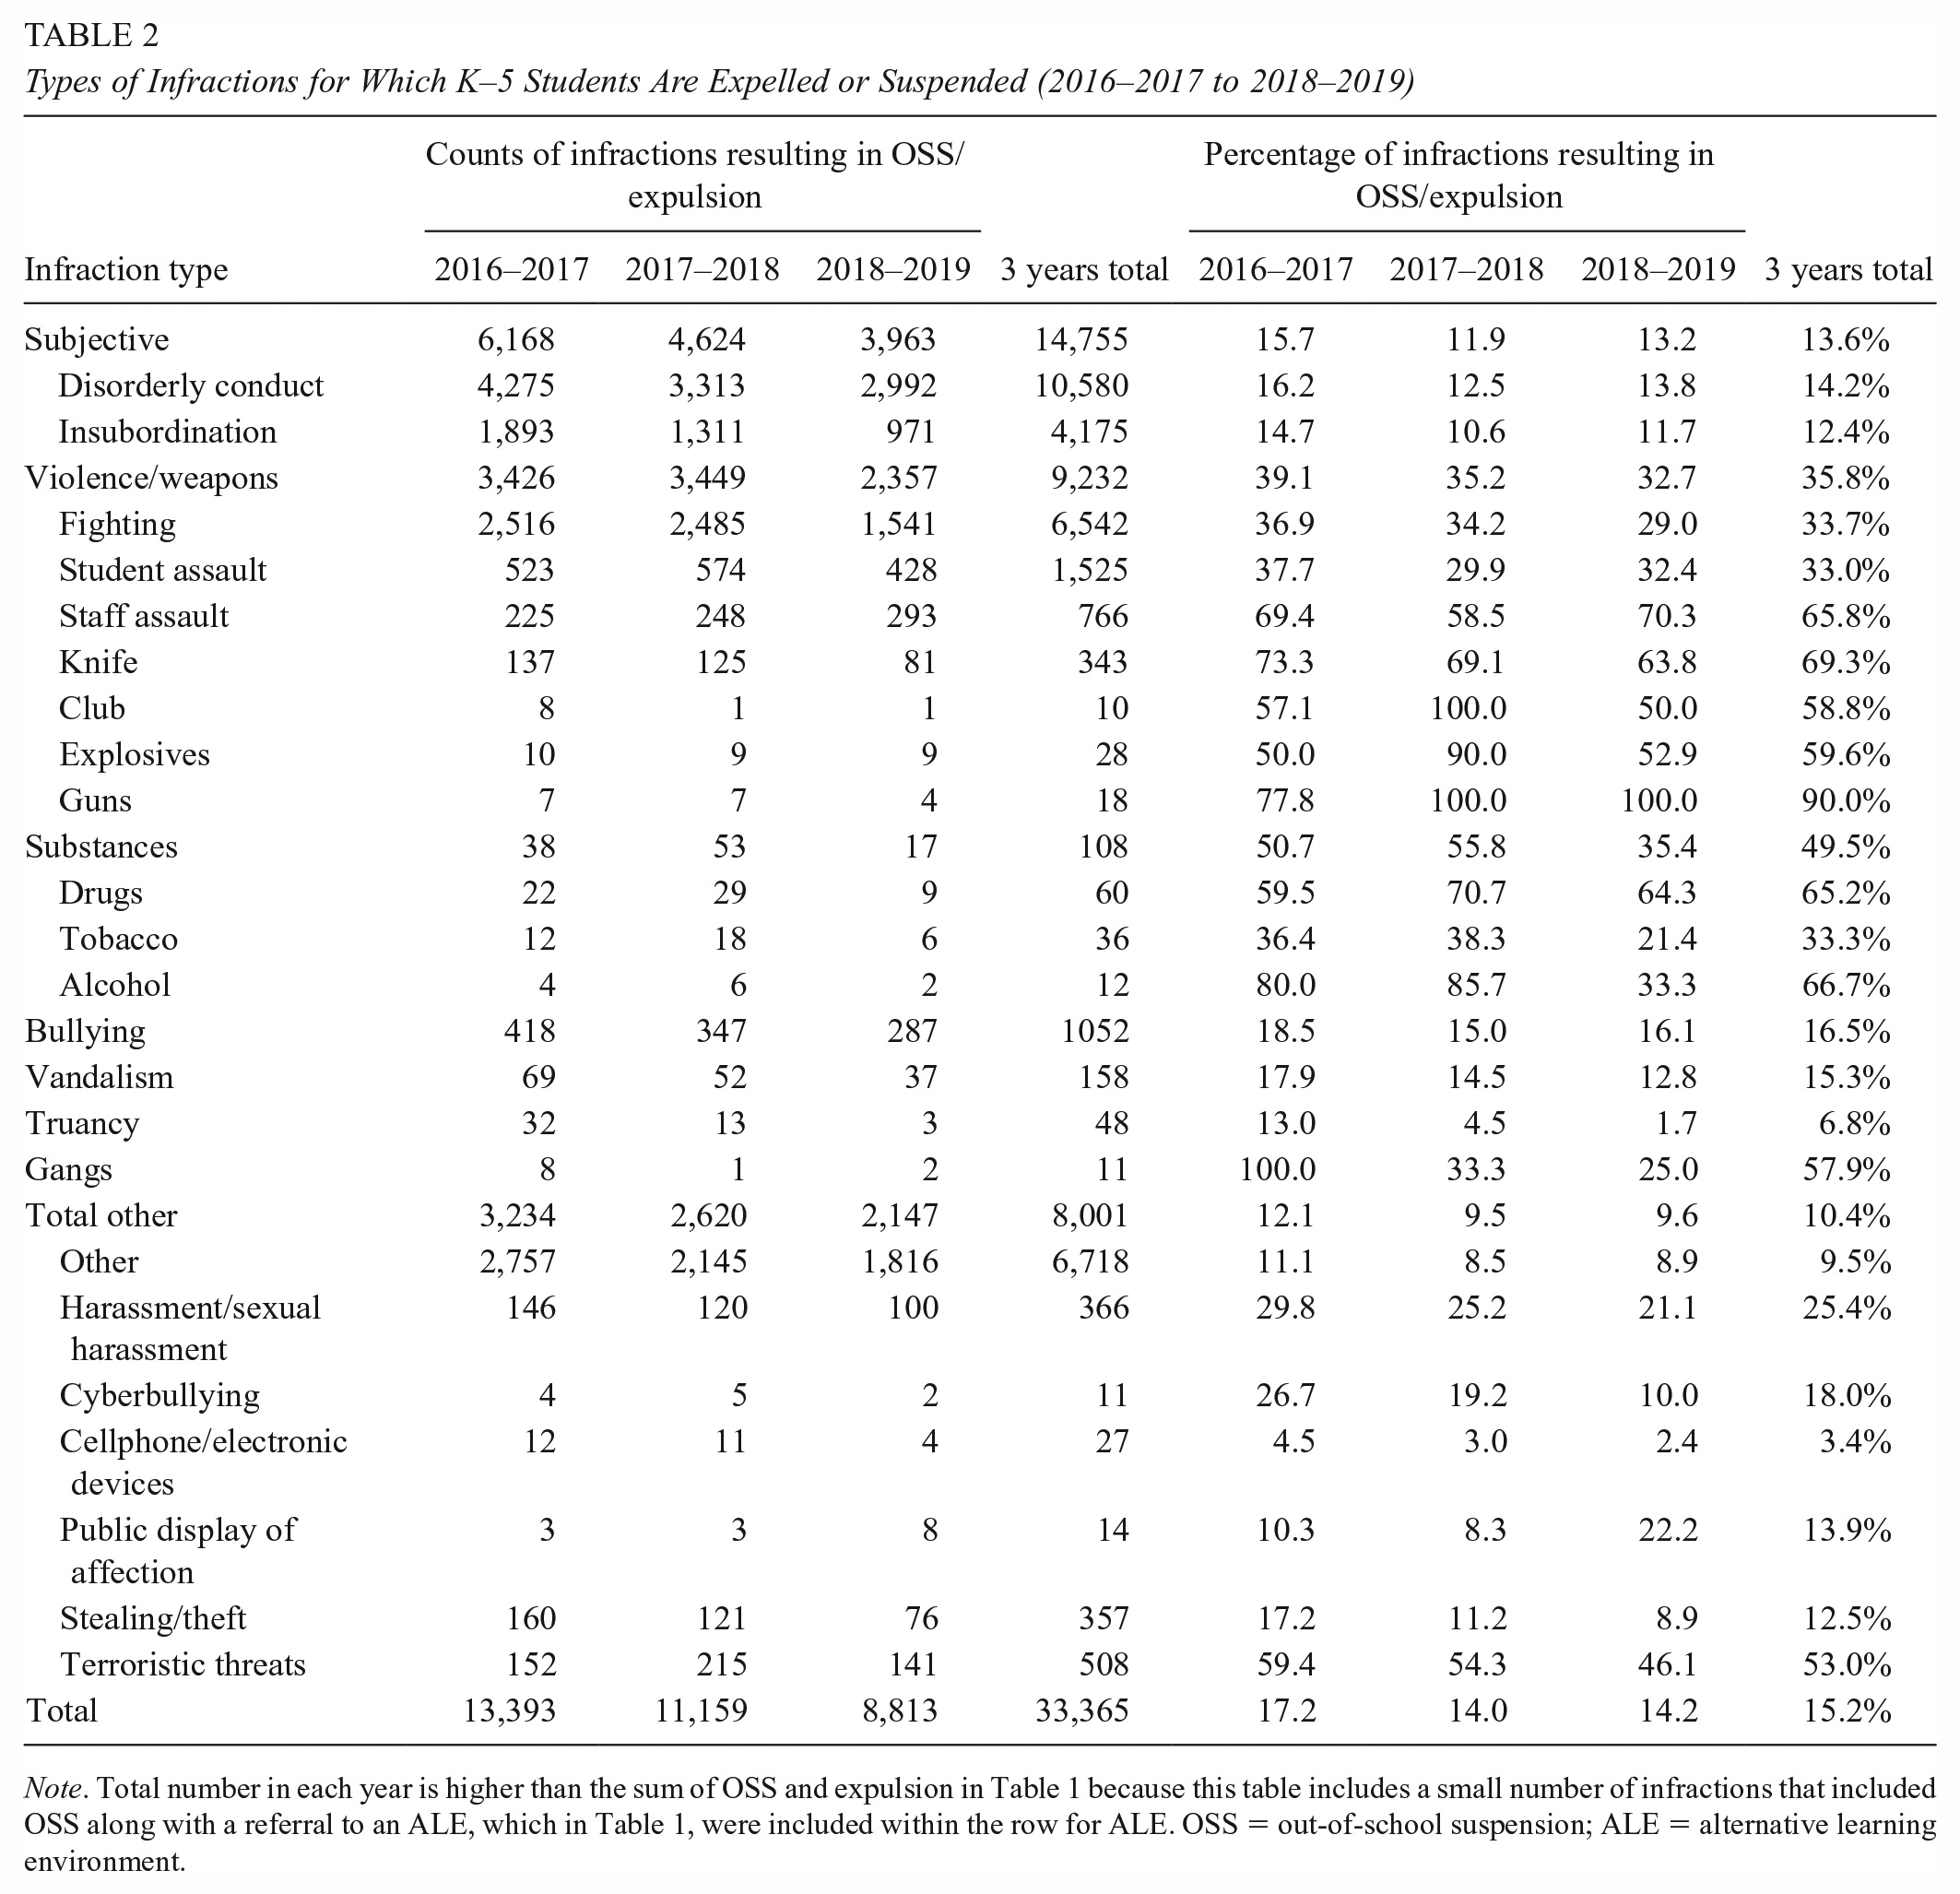
Note. Total number in each year is higher than the sum of OSS and expulsion in Table 1 because this table includes a small number of infractions that included OSS along with a referral to an ALE, which in Table 1, were included within the row for ALE. OSS = out-of-school suspension; ALE = alternative learning environment.
Despite the low OSS/expulsion rate for subjective infractions (13.6%), the sheer number of those infractions means they contribute a large share of OSS/expulsions (44.2%). These incidents may be relatively minor and could plausibly be handled through less exclusionary responses. Indeed, the use of OSS/expulsion for subjective categories declined from 15.7% in 2016–2017 to 13.2% in 2018–2019. We also see decreased OSS and expulsions for other infraction types, with increases only occurring for staff assault and public displays of affection (based on incident counts). Although overall, exclusionary discipline decreased postreform, OSS/expulsion were used in almost 9,000 incidents in 2018–2019, representing approximately 5,000 elementary-age students suspended or expelled at least once that year.
For our analysis, these incident-level data are used to create both predictors of interest (for Research Question 1), and outcome variables (for Research Question 2). For Research Question 1, we use 3 years of discipline data (2014–2015 to 2016–2017) to calculate two measures of school-level baseline discipline practices as predictor variables: (1) the average number of infractions, per 100 students, per year, averaged over the last three prepolicy years, and (2) the overall share of infractions reported during the 3-year baseline period that resulted in exclusionary consequences (OSS, expulsion, or referral to an ALE). Using 3 years of data creates more stable measures of baseline discipline use than a single year’s data. To alleviate the influence of outliers, these two measures are Winsorized (Dixon, 1960; Locker, 2001) to replace observations below the fifth percentile with the fifth percentile value. 7
For Research Question 2, we use the discipline data to create four outcome measures related to compliance with the law. We hypothesize declines in OSS/expulsion use will be concentrated among subjective infractions, so the four measures capture the 2016–2017 to 2017–2018 percentage change and the 2016–2017 to 2018–2019 percentage change in the share of infractions resulting in OSS/expulsion, both overall and for subjective infractions. Percentage changes relative to very small base rates (small denominators) are often outliers that could skew the data. As such, we Winsorize these variables, replacing values above the 95th percentile with the 95th percentile value.
We also incorporate publicly available NCES data on district-level per-pupil instructional expenditures as an additional independent variable of interest, as we expect funding will be related to capacity for compliance.
Survey Design and Measures
Administrative data are supplemented with survey measures, collected through a retrospective survey design, asking respondents to recall the year prior to the policy and to reflect on changes since that year. Retrospective surveys have limitations, such as memory distortion or recall (Pearson et al., 1992), and benefits, particularly with regard to measuring perceptions of change over time (Little et al., 2020). Nonretrospective baseline survey data are also imperfect, as response shift bias (Bray et al., 1984) may occur when an individual’s frame of reference or their internal rating system changes between the pre- and posttests. While retrospective data are subject to misremembering (Pearson et al., 1992), they are less subject to response shift bias.
Survey items were adapted from a variety of sources with the goal of assessing principal and counselor perspectives on Act 1059. We used principal components analysis (PCA) rather than factor analysis, because PCA does not assume an underlying causal relationship between the factors and the observed variables (Floyd & Widaman, 1995). Given that the included items are noncontinuous Likert-type items, we used polychoric correlations (Olsson, 1979) to estimate the correlation matrix used in the PCA. We follow the Kaiser–Guttman rule (Kaiser, 1991) to estimate the number of principal components (those with an eigenvalue of greater than one) and used oblique (promax) rotation to allow the identified components to be correlated (Crocker & Algina, 1986). Descriptive statistics for each individual item and summary construct are in the Supplemental Appendix Table A (available in the online version of this article). Next, we describe these constructs, and their related measures, used as outcomes in Research Question 1.
We asked respondents to indicate the extent to which they agreed or disagreed with 14 statements about this law (on a scale from 1 to 4). Seven out of 14 items loaded to a single component that reflected Support for the law (e.g., whether it’s reasonable, feasible, whether it will help students, and whether it will hurt school climate). The other seven loaded to a second component, Clarity for implementation. Items include, for example: “the wording of this law is ambiguous,” “expectations with respect to this law are clear to me,” and “I have a clear vision for how to successfully implement this law in my school.”
We combine two items indicating the school’s reported difficulty with implementation in each of the first two outcome years. We asked, “To what extent did your school experience difficulties implementing this law during the two most recent school years?” (in 2017–2018 and 2018–2019). Respondents responded on a scale from one (“no difficulties”) to four (“substantial difficulties).” For ease of interpretation, we created a single binary indicator of whether a respondent indicated at least a three (moderate or higher), on average, across these 2 years.
Two measures relate to challenges/barriers for implementation, based on a total of 11 items. Four items loaded to one principal component (Challenges related to politics, policies, and leadership), and seven to another (Challenges related to lack of resources and capacity). Both measures are on a scale from one to four, with four indicating greater challenges.
We use a measure of the change in reported school climate from 2016–2017 (prepolicy) to 2018–2019 (the second postpolicy year). We reviewed many school climate measures, but no existing scale perfectly met our needs, so we developed a brief instrument to incorporate many key components (see online Supplemental Appendix Table A). 8 Specifically, we asked items related to orderliness, teacher–student relationships, leadership, and school mission. We collected information on 14 items, separately, by year, and for each year, all items loaded to a single component, on a scale from 1 to 4, where 4 indicates more positive climate. For our analyses, we calculated the change in reported School climate from the baseline year to the second outcome year.
Our final measure, Postpolicy success, asked respondents “How has your school’s success with each of the following changed, as a result of this new law?” All seven items (reducing racial gaps in student discipline, reducing reliance on exclusionary discipline, improving attendance, reducing misbehavior, ensuring a safe and orderly environment, improving student achievement overall, and reducing student achievement gaps) loaded to a single component. These items were on a scale from 1 to 5 (where 5 indicates much more successful than before), which allowed for the inclusion of a middle category for about the same. As a result, the interpretation of the results for this outcome is slightly different than for the other outcomes.
Survey Data Collection
Between May 28 and November 4 of 2019, 9 we sent an email-based Qualtrics survey to all elementary school principals (611) and counselors (707) in Arkansas (some schools have more than one counselor). We received 235 responses from principals (an initial response rate of 38.5%), and 155 responses from counselors (an initial response rate of 21.9%).
For Research Question 1, our primary interest was to learn from individuals who at the time of the survey were working in the same school since the baseline year, 2016–2017, so we exclude responses from individuals who are not able to compare conditions pre- and postpolicy and make a few other sample restrictions. 10 There was nontrivial item-level missingness, so to make our samples comparable across models, we focus on a sample of 110 schools for whom we have data on all measures. We primarily use principal responses, only incorporating a counselor’s response where a principal response was not available (14 of the 110 cases). The results are generally robust to the exclusion of these counselor responses. Due to these sample restrictions, we have a sample of individuals with relative job stability and low item-level nonresponse. These individuals, and the schools they represent, may not be representative of the state.
Relatedly, for Research Question 2, the sample is restricted to schools for which we were able to calculate the outcome measures, requiring discipline infractions overall, as well as subjective infractions, to be reported in the baseline year, 2016–2017, as well as each of the first two outcome years, 2017–2018 and 2018–2019. As a result, Research Question 2 is only estimated among the set of schools who were regularly reporting disciplinary data, and specifically subjective infractions, across this time period.
In Table 3, we compare the characteristics of sample schools with other Arkansas elementary schools. The schools for which we have complete survey measures are less likely to be located in cities, have a greater share of White students, and lower shares of Hispanic and limited English proficient students. Infraction counts are higher in the responding schools. To address these differences, our Research Question 1 analysis weights the survey data by the inverse probability of response (see the Analytic Approach section). There may be unobservable factors not accounted for in the weights. For example, principals concerned about job security or accountability might be more reluctant to respond or more subject to social desirability bias. To minimize these concerns, we communicated that survey responses would be “kept confidential to the extent allowed by law and University policy,” that “all responses will be summarized . . . such that no individuals, schools, or districts can be identified,” and that participation was voluntary.
Characteristics of Sample Schools, Compared With Other Schools
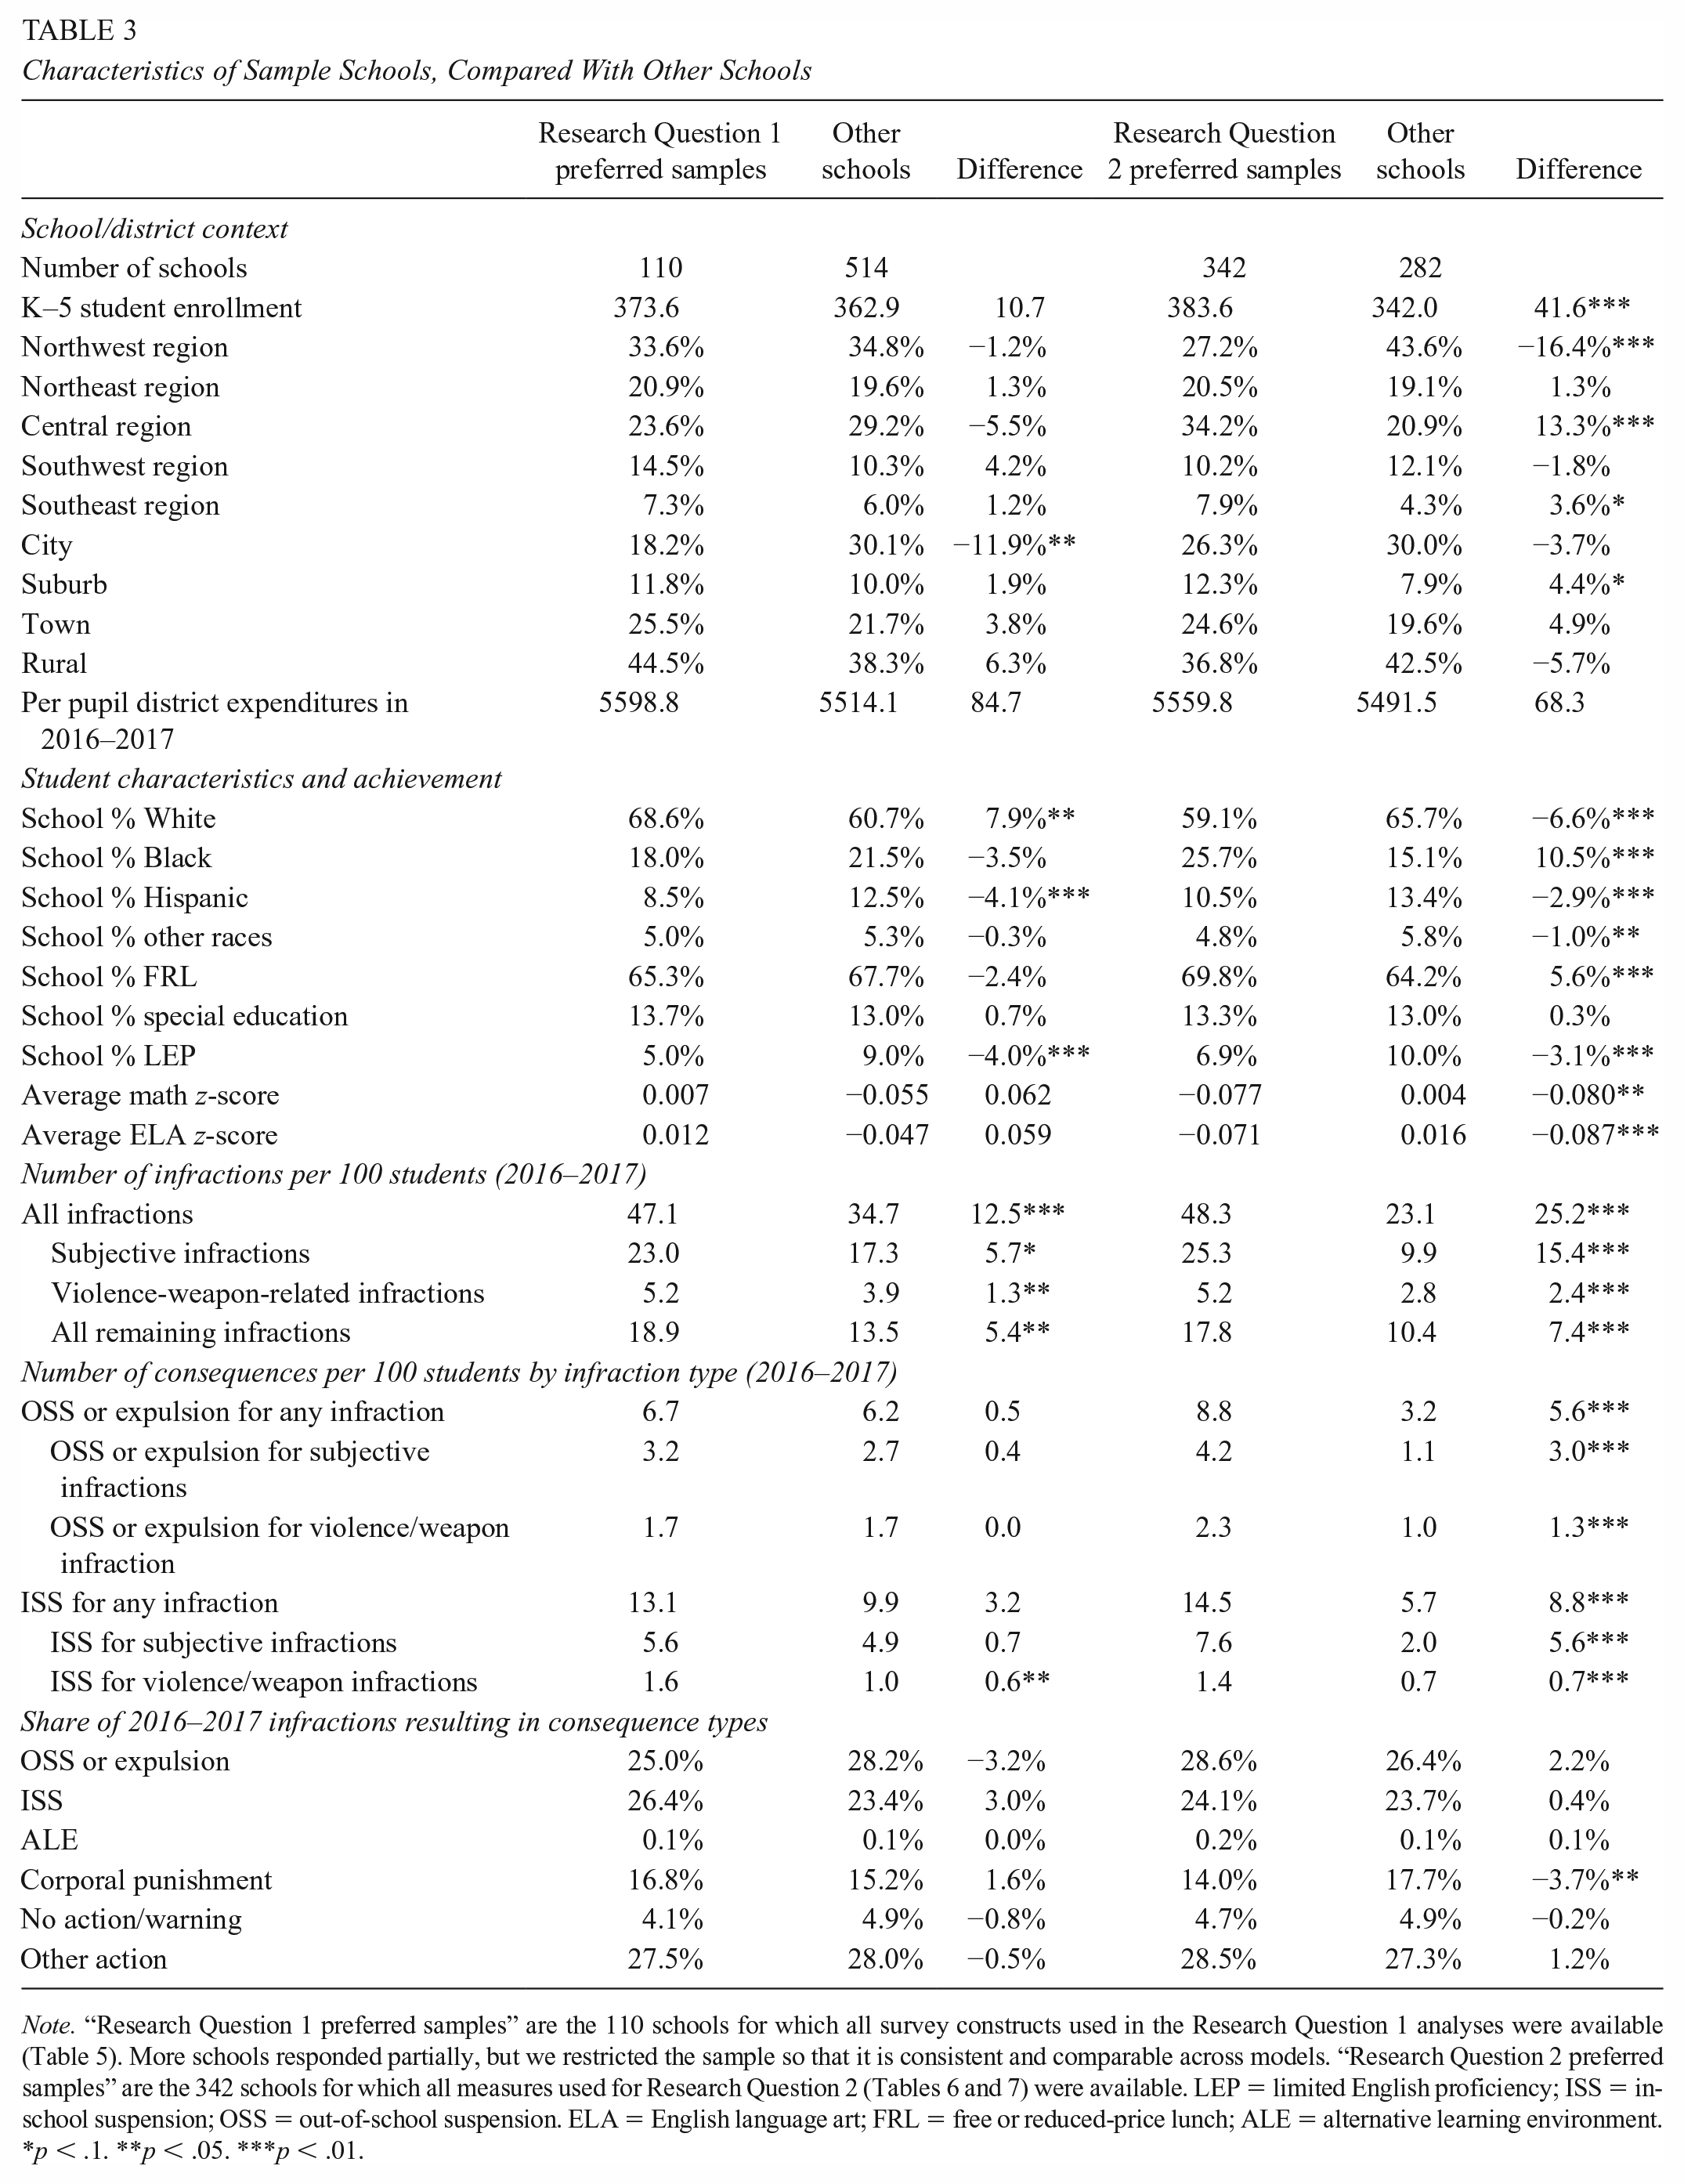
Note. “Research Question 1 preferred samples” are the 110 schools for which all survey constructs used in the Research Question 1 analyses were available (Table 5). More schools responded partially, but we restricted the sample so that it is consistent and comparable across models. “Research Question 2 preferred samples” are the 342 schools for which all measures used for Research Question 2 (Tables 6 and 7) were available. LEP = limited English proficiency; ISS = in-school suspension; OSS = out-of-school suspension. ELA = English language art; FRL = free or reduced-price lunch; ALE = alternative learning environment.
p < .1. **p < .05. ***p < .01.
Table 3 also shows that the schools in the Research Question 2 sample tend to be larger, are less likely to be in the Northwest, and more likely to be in the Central region. They tend to serve a greater share of Black and FRL students but fewer students of other races (i.e. not White, Black, or Hispanic) and limited English proficient students. Average achievement in the sample schools is slightly below the state average. Since the sample restriction is based on the availability of infraction reports across all 3 years, the schools included in this sample tend to report higher numbers of infractions and consequences of all types. The included schools use corporal punishment at lower rates than the excluded schools.
Analytic Approach
To address our research questions, we use a series of multivariate regression models. All findings are descriptive, not causal.
Research Question 1: What School and District Characteristics Are Associated With Principal and Counselor Perspectives About Act 1059 and Its Implementation?
For Research Question 1, we test which school- and district-level characteristics are associated with seven key measures based on survey responses. Two measures are attitudes/beliefs about the law (Support for the law and Clarity for implementation), one is a binary 11 indicator of moderate or substantial difficulties with implementation, two are reports of Challenges with implementation, one is a measure of change in School climate, and one is reported Postpolicy success. See online Supplemental Appendix Table A. We predict these outcomes as a function of observable baseline school characteristics, following:

where
Research Question 2: What School and District Characteristics Are Associated With Compliance With Act 1059 as Reported in the Administrative Data?
Next, we estimate a model similar to Equation (1), but where
Student discipline policy is often set at a district level through a district code of conduct. As a result, we estimate another set of results with district fixed effects (FE), rather than region FE, to explore whether our results differ when identifying the relationships using only within-district variation. The models with region FE remain our preferred analyses, as only 57 of the 175 districts represented in our preferred analyses had more than one elementary school represented, so within-district variation is limited and only available for a distinct set of larger school districts.
Results
Research Question 1: What School and District Characteristics Are Associated With Principal and Counselor Perspectives About Act 1059 and Its Implementation?
We report bivariate correlations in Table 4. School percent non-White is negatively correlated with Support for the law (r = −0.36), and Clarity for implementation (r = −0.24). Baseline use of exclusionary discipline is negatively correlated with Clarity for implementation (r = −0.27). Both types of Challenges with implementation are positively correlated with school percent non-White (r = 0.36 and r = 0.44, respectively) and baseline use of exclusionary discipline (r = 0.38 and r = 0.29, respectively). In other words, Whiter schools and schools that relied less on exclusionary discipline indicated more Support for the law, greater Clarity for implementation, and fewer Challenges. Support and capacity for implementation may be unevenly distributed in ways that exacerbate educational inequities for students of color, in particular Black students, who attend more exclusionary schools (Anderson & Ritter, 2017). In the set of results that follow, we assess the relationships between these and other variables using multivariate regression, controlling for observable school characteristics.
Correlations Between Survey Constructs and Observable School and District Characteristics at Baseline

Note. Correlation shown are for the set of 110 schools with complete survey-data used for Research Question 1. All administrative data are from the prepolicy baseline year (2016–2017), except for the disciplinary measures (Nos. 15 and 16), which are summarized across 3 baseline years (2014–2015 to 2016–2017). Administrative data are all school-level except for district-level per-pupil instructional expenditures. OSS = out-of-school suspension; ELA = English language art; FRL = free or reduced-price lunch; ALE = alternative learning environment.
In Table 5, we present the results of our preferred specifications investigating Research Question 1. Column 1 shows that smaller schools indicated greater Support for the law. A 10% greater school enrollment is associated with −0.026 unit (−0.04 SD) lower Support for the law. Furthermore, while imprecise and not statistically distinguishable from zero, the effect size on school percent FRL-eligible indicates that respondents from less advantaged schools reported less Support for the law.
Predicting Survey Responses as a Function of School and District Characteristics

Note. Includes region fixed effects for the five regions in the state. Heteroskedastic-robust standard errors, clustered at the district level, in parentheses. All models are weighted by the inverse probability of survey response. The number of infractions per year per 100 students and the share of infraction resulting in OSS, ALE, or expulsion are both based on a 3-year average (the last three years prepolicy). OSS = out-of-school suspension; ELA = English language art; FRL = free or reduced-price lunch; ALE = alternative learning environment.
p < .1. **p < .05. ***p < .01.
The outcome in column 3 is a binary indicator of Moderate or substantial difficulties with implementation (relative to minimal or no difficulties) in the first two outcome years. Larger schools, lower performing schools, more exclusionary schools, and schools in lower spending districts were more likely to report difficulties. Some of these estimates are imprecise. For example, a 10 percentage point higher baseline reliance on exclusionary discipline is associated with a 3.96 percentage point higher likelihood of reporting moderate or substantial difficulties, although the 95% confidence interval implies a relatively wide range from 0.3 percentage points to 7.6 percentage points. Similarly, the next two columns show how school characteristics related to implementation Challenges. Schools with a greater share of non-White students, schools with greater baseline use of exclusionary discipline, lower performing schools, and schools in lower spending districts indicated greater Challenges of various types, reiterating that relatively disadvantaged schools reported more difficulties.
Finally, column 7 indicates that schools serving more FRL students reported less Postpolicy success, although this estimate is relatively imprecise. None of the independent variables were significantly related to Clarity for implementation (column 2) or Improvement in School Climate (column 6), controlling for other factors.
Specification Checks
We test the robustness of our results to a variety of specifications: (1) using non-Winsorized versions of the baseline discipline use variables as well as the measures of change in exclusionary discipline use, (2) including district FE instead of region FE, (3) restricting the analysis to only principal respondents (see online Supplemental Appendix Table B), and (4) using all available data and allowing the sample size to vary by model (see online Supplemental Appendix Table C). The models with the non-Winsorized versions of these variables are nearly identical. 13 The district FE models indicate no statistically significant relationships, as there is little within-district variation among the 110 schools included in this sample (i.e., only 49 of these 110 schools were in a district with more than one school in the sample), and as a result, statistical power suffered. 14
The results in online Supplemental Appendix Table B are substantively similar to the main results in Table 5. In online Supplemental Appendix Table C, while the directional effects were generally similar, there are several cases in which statistical significance is different from Table 5, due to relatively imprecise estimates in both sets of models. In online Supplemental Appendix Table C, we find stronger evidence that high-FRL schools reported lower Support for the Law and that high exclusionary schools (at baseline), reported lower Clarity for implementation. In column 3, school size and baseline use of exclusionary discipline are no longer statistically significant. In column 4, baseline test scores and per-pupil expenditures are no longer significant. In column 5, per-pupil expenditures was no longer significant, and we find significantly higher Challenges for schools with greater baseline exclusionary discipline use. Finally, in column 6, we find that schools with greater baseline use of exclusionary discipline reported larger School climate gains (or smaller climate declines). Notably, all these differences were in terms of statistical significance, and not the direction of the relationship, so overall these generally support the main findings in Table 5: relatively disadvantaged schools (based on a variety of indicators), typically had greater difficulties and Challenges with implementation, and less Postpolicy success.
Testing Interactions Between School Demographics and District-Level Per-Pupil Expenditures
In general, we find that schools in districts with lower per-pupil instructional expenditures, schools with greater proportions of non-White or FRL-eligible students, and schools with higher baseline use of exclusionary discipline reported more Challenges. It is possible that there is a compounding or interaction effect of disadvantage for less well-resourced schools who also serve more low-income students and students of color, or those with higher baseline use of exclusionary discipline. We tested this by including interactions, one at a time, in the same models shown in Table 5, for the Challenges outcomes. The results are available in online Supplemental Appendix Table D. Most of these interactions were not statistically significant, but there is an interaction regarding Challenges related to lack of resources or capacity in which we find that schools serving more non-White students and located in lower spending districts reported these types of Challenges to a greater degree, providing some support for an interaction effect.
Research Question 2: What School and District Characteristics Are Associated With Compliance With Act 1059 as Reported in the Administrative Data?
We model compliance as measured by four measures of change in the use of OSS/expulsion from the administrative data (see the section on administrative data measures). To be included in the preferred sample (held constant across all models), schools had to report disciplinary incidents, including subjective infractions, in the baseline year and both postpolicy years. The results are in Table 6. The first four columns include region FE, and the final four include district FE. Positive coefficients indicate a factor is associated with increases in OSS/expulsion (i.e., a greater degree of noncompliance).
Predicting Compliance Based on Administrative Data as a Function of School and District Characteristics

Note. Heteroskedastic-robust standard errors, clustered at the district level, in parentheses. The outcome measures in columns 1 to 4 are percentage changes such that a one unit increase in the outcome corresponds to a 100% increase. The number of infractions per year per 100 students and the share of infraction resulting in OSS, ALE, or expulsion are both based on a 3-year average (the past 3 years prepolicy). OSS = out-of-school suspension; ELA = English language art; FRL = free or reduced-price lunch; ALE = alternative learning environment; FE = fixed effects.
p < .1. **p < .05. ***p < .01.
In columns 1 to 4 (with region FE), but not when only comparing within district (columns 5–8), we find that schools serving a greater share of non-White students complied at lower rates. Within district (columns 5–8), however, there is evidence that schools serving more FRL-students tended to comply at lower rates. The most consistently significant predictor of compliance in this table is higher reliance on exclusionary discipline at baseline. This result might reflect simply that high-exclusionary schools had more room for reducing this practice. Specifically, although the outcome variables were already Winsorized at the 95th percentile, we theorized that there could be a floor effect whereby schools with very low baseline use of exclusionary discipline have nearly no room to decrease their use, but could easily increase use at very high rates, due to the low base rate. Accordingly, we identified a set of 25 outliers with reported increases in use of OSS/expulsion of greater than 400%. These schools tend to have very low baseline use of exclusionary discipline. When these outliers are dropped, the coefficient on baseline exclusionary discipline use is not statistically significant, indicating this result was driven by these outliers, rather than by previously high-exclusion schools complying at higher rates. These results are available in Table 7. Another notable difference from Table 6, is that when dropping these outliers, we have less evidence that school percent non-White is negatively correlated with compliance, and more evidence that school percent FRL-eligible is negatively correlated with compliance in the district FE models. On the whole, the results indicate that relatively disadvantaged schools were complying at lower rates.
Sensitivity Analysis for Research Question 2: Dropping Outlier Schools With Extremely High Increases in OSS/Expulsion Use Postpolicy

Note. Corresponds to Table 6, but dropping 25 outlier schools with very high measures on one or more of the dependent variables. Heteroskedastic-robust standard errors, clustered at the district level, in parentheses. The number of infractions per year per 100 students and the share of infraction resulting in OSS, ALE, or expulsion are both based on a 3-year average (the past 3 years prepolicy). OSS = out-of-school suspension; ELA = English language art; FRL = free or reduced-price lunch; ALE = alternative learning environment; FE = fixed effects.
p < .1. **p < .05. ***p < .01.
Specification Checks
We test the robustness of our results in Table 7 (after dropping outliers) using alternative specifications. We loosen the restriction to keep the samples consistent across models, and the results (see online Supplemental Appendix Table E) are substantively similar to those in Table 7, with some differences in statistical significance. In particular, online Supplemental Appendix Table E more frequently finds a statistically significant relationship between school percentage of non-White and noncompliance, in the models with region FE. We also test the results to using non-Winsorized versions of baseline discipline use and the results are nearly identical. 15
Discussion
In this article, we investigated perspectives on a discipline policy reform, and its implementation, across varying school contexts. Although the results are often noisy and imprecise, we generally find that relatively disadvantaged schools and more exclusionary schools reported greater difficulties and challenges with implementation. Overall, about one third of survey respondents indicated moderate or substantial difficulties with implementation. The most commonly cited challenges were a lack of mental health supports/counseling resources, significant discipline challenges, a lack of feasible disciplinary alternatives, and a lack of resources and/or time.
This study identified some equity concerns regarding the outcomes of this policy. Schools with a greater share of FRL students were less likely to report postpolicy success, and schools with greater shares of disadvantaged students reduced their use of exclusionary discipline at lower rates, controlling for other factors. Notably, although more exclusionary schools reported greater difficulties and challenges with implementation, there was no evidence to suggest they were complying at lower rates. Still, with more support or training to address some of these challenges, the reductions in exclusionary discipline may have been even greater. Although exclusionary discipline decreased overall, OSS and expulsion was still the response to almost 9,000 incidents in 2018–2019, representing approximately 5,000 elementary-age students suspended or expelled at least once that year.
Policy makers seeking to reduce disproportionalities in student discipline should take these findings to heart. There are key equity concerns for low-income students and students of color who were concentrated in schools that were facing greater challenges with implementation. In particular, schools in lower spending districts with more students of color were reporting greater challenges related to capacity and lack of resources. Furthermore, there is not a clear mechanism for the state to apply pressure on districts to comply, particularly given the ambiguous language that continues to allow exceptions to the suspension and expulsion ban. As McLaughlin (1987) suggested, fidelity of policy implementation is supported by a balance of pressure (i.e., accountability) and support (i.e., resources and capacity). Policy implementation suffers when there is more conflict with local practice, or when requirements outweigh the capabilities/resources of local actors (Belansky et al., 2009; Cohen et al., 2007; Elmore, 1979–1980; Matland, 1995; Mazmanian & Sabatier, 1983; Van Meter & Van Horn, 1975). Our findings reiterate that policy makers should design policies with these potential challenges and conflicts in mind, which may mean using clear (less ambiguous) language regarding what schools are and are not allowed to do, communicating and collaborating with districts prior to policy change in order to prevent unintended consequences, providing resources, trainings, or support to find alternative approaches, and following up with schools and districts that continue not to comply.
This study has important limitations. First, all analyses are descriptive and do not indicate causal relationships. Second, this is a first look at the implementation of this policy and is not assessing its impact on more distal student outcomes. Third, the administrative data do not include the full extent of the information that likely was recorded at the time of the incident, so other than infraction type (e.g., disorderly conduct or fighting) we do not have textual descriptions to determine whether incidents met the exceptions outlined in Act 1059 related to posing a “physical risk” or behaviors that “cannot be addressed through other means.” Fourth, survey responses reported by principals and counselors may be subject to a variety of biases. The use of retrospective survey data may be subject to misremembering (Pearson et al., 1992), and the responses may be affected by social desirability bias (Nederhof, 1985), even when anonymity is assured. Fifth, several sample restrictions were necessary, resulting in a sample that is not fully representative of the state.
As a further limitation, we focused on principals and counselors as a convenience sample for which contact information was readily available to the researchers. The perspectives of teachers, students, families, and community members are missing from this study and would be a worthy population to include in future work. Broadly, questions remain about how implementation actually takes place in the field, and suggest that mixed-methods research would be an important direction for future research in this area.
Furthermore, our study was unable to dive deeply into the ecological factors that may influence those opinions or preferences, which could be explored in future work. For example, within a bioecological systems framework (Bronfenbrenner & Morris, 1998), the individual (i.e., biosystem) is located within a microsystem in which that individual regularly participates (e.g., home or workplace). At the mesosystem level, there are interactions between different microsystems. The exosystem encompasses formal and informal structures surrounding the respondents that have an indirect influence such as school boards, police and court systems, and community organizations. In the macrosystem, broader influences such as social and political ideologies or cultural beliefs can influence perceptions of reform. Finally, changes may occur over time due to life transitions or historical events, represented by the chronosystem (e.g., growing awareness of systemic racism in the United States). As such, future work might incorporate a more comprehensive view of the entire ecological system. Similarly, while it was out of the scope of the current study, future work might apply and test theories of policy adoption and diffusion (e.g., punctuated equilibrium, multiple streams) (see McLendon & Cohen-Vogel, 2012).
While descriptive, this study provides important findings about how school characteristics are related to principal and counselor perspectives on and implementation of discipline reform. High-level policies may be enacted without recognition of local needs and preferences. Greater attention to local needs, buy-in, and clarity for implementation are key. Policy makers seeking more equitable implementation need to communicate with schools and local communities about their discipline practices, the purpose of reform, and the resources and supports needed to make such reform feasible, practical, and impactful.
Supplemental Material
sj-docx-1-ero-10.1177_23328584221075341 – Supplemental material for Local Implementation of State-Level Discipline Policy: Administrator Perspectives and Contextual Factors Associated With Compliance
Supplemental material, sj-docx-1-ero-10.1177_23328584221075341 for Local Implementation of State-Level Discipline Policy: Administrator Perspectives and Contextual Factors Associated With Compliance by Kaitlin P. Anderson and Sarah McKenzie in AERA Open
Footnotes
Acknowledgements
We would like to thank Raquel Sosa for her contributions to this project.
Notes
Authors
KAITLIN P. ANDERSON is an assistant professor of educational leadership in the Department of Education and Human Services at Lehigh University. Her research interests focus on issues of equity in the implementation and impact of education policy.
SARAH MCKENZIE is an assistant professor in the Department of Education Reform at the University of Arkansas and Executive Director of the Office for Education Policy. Her research interests include assessment literacy, academic growth models, K–20 educational outcomes, and using data to drive changes in school systems in order to better serve all students.
References
Supplementary Material
Please find the following supplemental material available below.
For Open Access articles published under a Creative Commons License, all supplemental material carries the same license as the article it is associated with.
For non-Open Access articles published, all supplemental material carries a non-exclusive license, and permission requests for re-use of supplemental material or any part of supplemental material shall be sent directly to the copyright owner as specified in the copyright notice associated with the article.