
Abstract
Nationally, teachers have experienced major changes in how their performance is evaluated. Teacher satisfaction with the evaluation system likely influences whether they will use the evaluation data to make instructional improvements, yet we know little about teachers’ perceptions of their evaluations. Using survey data from Chicago Public Schools, we explore teacher satisfaction with the evaluation system and their perceptions of its fairness and accuracy. Sixty percent of teachers reported being satisfied with the district’s reformed teacher evaluation. However, satisfaction declined following the implementation of the district’s more rigorous evaluation system, driven by tenured teachers’ differentially negative impressions. Notably, teacher satisfaction was higher in schools with strong climates, particularly where teachers perceived instructional leadership as effective. These findings underscore the importance of school leaders in the implementation of teacher evaluation policies and suggest that some principals need support fostering school climates focused on instructional improvement and building strong relationships with staff.
Keywords
Introduction
In response to concerns that teacher evaluation systems failed to distinguish among low- and high-performing teachers, the federal Race to the Top grant competition incentivized states to reform the way they evaluate their teachers dramatically (U.S. Department of Education, 2009). These state-level reforms predominately established systems of teacher evaluation that rely on multiple measures of teacher quality, including, often for the first time, the incorporation of student growth metrics and the use of classroom observation rubrics to rate teaching practice (Swisher & Saenz-Armstrong, 2022). States and districts have spent significant time and resources on developing these new evaluation systems, and districts have encountered barriers to implementation. For example, conducting these evaluations can be resource-intensive for administrators (Sartain et al., 2011), which may mean that principals take shortcuts that reduce the quality of the evaluation (Neumerski et al., 2018). Further, there are concerns that aspects of the evaluation systems—particularly student growth measures—may not accurately represent teacher quality (e.g., see National Research Council, 2010), and even if they are accurate measures of teacher effectiveness, there may be little buy-in from teachers themselves due to these perceptions. Issues like these could prevent teacher evaluation reform from reaching its potential to improve teacher practice and, thereby, student learning.
Research suggests that teacher support is important for the successful implementation of any major education policy reform (Coburn & Stein, 2006; Croll et al., 1994; McLaughlin, 1987). With teacher evaluation reform, teachers are at the center of the policy change. Therefore, understanding the conditions that shape teacher perceptions of the evaluation process is critical for identifying schools where implementation of evaluations is likely going well and other schools where administrators and teachers may need more support. To understand better how teacher evaluations are being implemented, we also need to learn more about teachers’ satisfaction with their evaluations and how their perceptions relate to the unique school contexts in which they teach. In this paper, we address three key research questions:
How satisfied are teachers with their evaluation system? Do they believe evaluations are fair and accurate?
What characteristics of teachers’ jobs, such as their teaching assignment or their school context, are associated with positive perceptions of teacher evaluation?
How has teacher satisfaction with evaluation changed over time, particularly in the years after major teacher evaluation reform?
We answer these questions in the context of Chicago Public Schools (CPS), a large urban district with a diverse teaching population of about 18,000 teachers who work in the district’s approximately 500 schools. CPS overhauled the way it evaluates teacher performance in 2012, and the reformed system is still in place. The system has many features common to the teacher evaluation reforms that occurred nationwide at the same time. For the first time, CPS teachers are evaluated using multiple measures of teaching practice, including student test score growth and 4 classroom observations using a well-defined rubric. Before and after classroom observations, school administrators must hold structured conversations with teachers based on evidence they collected during the observation. Finally, teachers who receive low-evaluation ratings are at risk of losing their jobs if they cannot make improvements that meet the district’s standards for proficient teaching. The increased accountability via more frequent classroom observations and employment stakes represents a sizable change for teachers. In the past, school administrators used a short “checklist” to evaluate teachers, and administrators and teachers reported that the evaluations were not useful for improving teaching (Sartain et al., 2011).
In this paper, we characterize teachers’ satisfaction with the teacher evaluation system with responses to survey questions about how they are evaluated. These questions were part of the 5Essentials survey, a school climate survey developed, validated, and administered by the University of Chicago Consortium on Research. 1 The 5Essentials survey is given to the entire population of CPS teachers each spring, and the response rate is typically quite high at around 80–85% of all teachers.
In the 2017 survey, we found that 60% of teachers (N = 8,298 of 13,946 respondents) expressed satisfaction with teacher evaluation in the district, but about 50% of teachers (N = 6,917 of 13,946 respondents) reported that the system was not fair to all teachers because of the context in which they work. We also show that teacher reports of satisfaction with their evaluations are related to various teacher and school characteristics. For example, teacher satisfaction is highest in schools where teachers report effective instructional leadership, whereas teachers with more years of experience tend to report lower levels of satisfaction with the evaluation system than their more novice peers. Finally, we explore whether teacher survey reports of satisfaction with their evaluations had changed over time with a comparison of teacher attitudes (using repeated cross-sections of data) toward evaluations before and after the large-scale change in the district’s evaluation policy. Here, we show that the implementation of teacher evaluation reform was associated with steep declines in teacher satisfaction with evaluation in the years immediately following the reform with particularly large drops in satisfaction among tenured teachers. Taken together, these findings suggest that districts will need to support principals to build trust with their staff and to develop their coaching and mentoring skills, leading to greater teacher satisfaction to help evaluation reform meet its intended goal of improving teaching and learning.
Literature Review
The teacher evaluation reform movement that followed Race to the Top sought to improve instructional practice and, ultimately, student learning via two primary mechanisms: (1) by identifying and remediating or removing low-performing teachers, and (2) by providing all teachers with detailed data and feedback that could guide improvements to their practice. These mechanisms rely on teacher effectiveness data that the evaluation system generates (e.g., evaluation ratings, classroom observation scores and feedback, student test score gains) and require administrators and teachers to use those data points to inform labor market decisions and/or improvements to practice. Because teacher evaluation reform is primarily concerned with the collection and use of data about teacher effectiveness in order to improve instruction, we consider teacher evaluation reform to be a type of data-use policy. Ultimately, positive, data-driven practice change is more likely to occur if the end users trust the data and feedback—in this case, that teachers see the evaluation measures as fair and accurate and use the information to modify their teaching.
Our research sits at the intersection of three bodies of literature. First, we describe the theoretical literature on data use in schools to inform improvement efforts with a particular focus on the role of school principals as leaders of policy reform initiatives on the ground. We then discuss the importance of individuals’ perceptions in shaping policy implementation. In the teacher evaluation context, there is an assumption that principals and teachers will use the evaluation data to make changes to instructional practice. Whether teachers utilize teacher evaluation data to guide their decision-making hinges on their perceptions of that data, so we document their perceptions in this paper. Finally, our research takes place in the aftermath of a national movement that fundamentally changed how teachers are evaluated, and teachers’ perceptions of the evaluation system play a part in determining the magnitude of the impact of evaluation reform on teacher and student outcomes. Therefore, we end by describing findings from studies on the causal impacts of teacher evaluation reform.
School Leaders as Drivers of Policy Implementation
The literature assessing teacher evaluation reforms has largely focused on evaluating the impacts of the policy change on teacher labor market decisions, instructional quality, and student achievement, as well as issues related to measuring teacher quality (see Brooks & Springer, 2021, for a comprehensive review). Comparatively less has been written about the necessary conditions for successful implementation of teacher evaluation policy in school settings. While many education policies are developed top-down by various stakeholders and policymakers, whether a policy meets its intended goal is influenced by the context in which the policy is implemented. For many education-related policies, the context and culture of each individual school shape what policy implementation looks like and whether the policy change accomplishes its intended goals.
Coburn and Turner (2011) have outlined a framework for data use in schools 2 in order to inform decision-making and organizational change, which is helpful for understanding the implementation of policies that generate and rely on educator use of data like teacher evaluation reform. Their framework emphasizes the importance of the existing school context, culture, and norms in determining whether and how teachers use data to make change. 3 In particular, they point to the school principal as playing a central role in determining the importance of data in school improvement efforts. This claim is supported by extensive research establishing that school leaders set the groundwork for the organizational, cultural, and political norms within a school (see Leithwood et al., 2002, for a review). Further, effective school leaders are a critical part of determining whether school improvement efforts will be successful (Bryk et al., 2010). For example, due to their decision-making power over teachers’ priorities and time use, principals directly influence the degree to which teachers accept, make meaning of, and use new data (Sherer & Spillane, 2011; Spillane et al., 2011).
The implementation of teacher evaluation policy changes can be understood within the context of data-use frameworks like Coburn and Turner’s. While the details of teacher evaluation policies, as well as the teacher effectiveness measures and data, vary across different settings, school leaders are typically the individuals who introduce and frame the purposes of teacher evaluation policy to staff members, conduct classroom observations, and lead discussions about instruction with teachers during conferences. It makes sense, then, that research has established that principals are the key drivers of evaluation reform within schools, directly influen-cing whether teachers perceive the evaluation process as meaningful (Cohen et al., 2020; Donaldson & Woulfin, 2018; Mette et al., 2017; O’Pry & Schumacher, 2012).
At the same time, research suggests that principals vary in their abilities to implement teacher evaluation policies in ways that may lead to beneficial changes in instruction. For example, one study from New Orleans found that principals made different decisions about how to talk about evaluations with their staff, typically deciding to emphasize either the accountability function of the policy or the role of the policy in facilitating teacher growth and development (Marsh et al., 2017), which likely influences teachers’ attitudes toward evaluation. In New York City, principals who believed that they had a lot of agency over school staffing decisions were more likely to see teacher evaluation as a useful tool and implement the policy with fidelity (Cohen et al., 2020). Finally, principals in Connecticut who identified as being comfortable with evaluation were most likely to make adjustments to the policy in a way that they perceived would be beneficial to teachers (Donaldson & Woulfin, 2018). Principals also pointed to the importance of having established strong relationships with teachers in order to ensure that teachers were open to their feedback and make changes to practice (Donaldson & Mavrogordato, 2018).
This research points to the importance of the principal in the implementation of teacher evaluation policy. Therefore, we explored teachers’ reports of the quality of instructional leadership in their school and their relationships with the principal in order to understand the relationship between school leadership and teacher satisfaction with their evaluation process.
The Influence of Teacher Perceptions on Policy Implementation
Another consideration for the implementation of education policy within the Coburn and Turner data-use framework is teacher support for the specific policy change. Various theoretical frameworks suggest that successful implementation of any policy within schools hinges on generating buy-in from teachers (Coburn & Stein, 2006; Croll et al., 1994; McLaughlin, 1987). Specifically related to teacher evaluation policies, research from New Hampshire identified stakeholder capacity to implement and their support of the policy as necessary conditions for strong implementation of teacher evaluation reform (Riordan et al., 2015). While prior work in CPS showed that the majority of teachers indicated some satisfaction with evaluation reforms (Jiang et al., 2015), other research in CPS has shown that teacher satisfaction varied considerably across CPS schools and across teacher effectiveness measures (Sartain et al., 2020). In addition, user perceptions of evaluation data in Chicago and Arizona differed across measures of teacher effectiveness with principals and teachers more likely to see classroom observation ratings of teacher practice as more valid than test-score-based measures of teacher quality (Jiang et al., 2015; Ruffini et al., 2014). Taken together, the evidence suggests that teacher satisfaction with their evaluations is likely influenced by school context and by how teacher effectiveness is measured under the evaluation system.
From this line of research, we know that in order for teacher evaluation policies to have a positive impact on students, teachers must first show support for the evaluation policy. In this paper, we add to the literature by identifying the degree to which teacher satisfaction with evaluations varies along different teaching assignments and school-level factors, pointing to the school conditions that lay the groundwork for successful policy implementation.
Estimated Impacts of Teacher Evaluation Reform
We do not estimate the impacts of teacher evaluation in this paper, though based on the data-use literature we argue that teachers’ perceptions of and satisfaction with the evaluation system determines whether teacher evaluation reform results in improved teaching and learning. Therefore, we summarize the findings from the teacher evaluation impacts literature, noting that these estimated impacts are, at least in part, likely driven by teachers’ trust in the evaluation system.
One way teacher evaluation can lead to improved outcomes is through the feedback mechanism: principals observe teacher practice, principals and teachers engage in structured discussion of instructional practice, and teachers make changes that result in more student learning. The existing research about the impact of teacher evaluations on student outcomes is relatively limited and provides mixed results. One study in DC Public Schools showed that evaluation systems consisting of detailed feedback from classroom observations led to improvements in teacher instructional effectiveness (Dee & Wyckoff, 2015; Dee et al., 2021). Other researchers showed that teachers in Tennessee did not report increased or targeted professional development related to their evaluations (Koedel et al., 2019). There is also some evidence from Chicago and Cincinnati that rigorous teacher evaluation can positively impact student test scores (Steinberg & Sartain, 2015; Taylor & Tyler, 2012). However, these two studies predate the teacher evaluation reforms that happened in response to Race to the Top, and a more recent study looking at the rollout of teacher evaluation reform nationwide found no overall impact on student achievement or educational attainment (Bleiberg et al., 2023). Further, a pilot evaluation system in CPS designed to improve instruction through structured classroom observations and principal-teacher dialogue generated positive effects on test scores that were mostly driven by higher-achieving and lower-poverty schools (Steinberg & Sartain, 2015), suggesting that not all school contexts experienced improvements in student learning.
Another mechanism for improved teaching quality via evaluations is through the accountability function, particularly for teachers rated poorly under the evaluation system. Compared to research on student outcomes, evidence about the impact of teacher evaluation on teacher labor market outcomes has a broader base and suggests that teacher evaluation reform has improved teacher quality through strategic exits and hirings. For example, research from Chicago found that teacher evaluation reform increased the exit of low-performing teachers from the school system, who were then typically replaced by more effective teachers (Sartain & Steinberg, 2016, in Press). Other studies in different contexts have shown similar results—increased exit of low-rated teachers following evaluation reform, regardless of whether the system had high stakes for teachers (Cullen et al., 2021; Dee & Wyckoff, 2015; Dee et al., 2021; James & Wyckoff, 2020; Koedel et al., 2017; Rodriguez et al., 2020). Ultimately, though, the gains in teacher effectiveness from the removal of low-rated teachers are likely limited due to the fact that very few teachers have been identified as low performing (Cullen et al., 2021; Drake et al., 2019; Kraft & Gilmour, 2017; Sartain & Steinberg, In Press). In fact, one study suggests that rigorous teacher evaluation policies may have deterred prospective teachers from entering the profession, pointing to a potential unintended consequence of the policy reform movement (Kraft et al., 2020). However, these researchers also found that the remaining supply of new teachers, even if decreased, was of higher quality.
Evaluation Reform in Chicago Public Schools
CPS first implemented their reformed evaluation system, REACH, in the 2012–13 school year with nontenured teachers and was scaled to include tenured teachers in 2013–14. Under REACH, which is still the district’s evaluation system as of the time of this paper’s publication, teachers receive an evaluation rating (Unsatisfactory, Developing, Proficient, or Excellent) at the end of their evaluation cycle. Nontenured teachers are evaluated formally each year. Most tenured teachers receive ratings every other year, but tenured teachers with low (Unsatisfactory or Developing) ratings are evaluated annually until their practice is rated as Proficient or they exit. A teacher’s evaluation rating is determined by their final score, which is calculated based on classroom observations and student growth on assessments. First, teachers are observed four times in an evaluation cycle using a rubric based on the Danielson Framework for Teaching (Danielson, 2007) that delineates performance in different areas of classroom management and instruction. The classroom observation component is the most heavily weighted. Second, per state law, each teacher’s evaluation must include student growth. Teachers in grades 3–8 who teach reading and/or math (20 to 25% of teachers each year) have a value-added measure calculated using standardized test scores. All teach-ers also receive growth metrics based on district-developed subject-specific assessments (called Performance Tasks) that teachers themselves administer and grade at the beginning and end of the year. The scores on these assessments vary little across teachers (Jiang & Sporte, 2016).
The evaluation reform likely represented a large shift for many teachers compared to how teachers had previously been evaluated. With the old system, administrators used a short “checklist” to conduct classroom observations compared to a structured classroom observation rubric that delineates levels of performance across many dimensions of teaching. There was also no guidance on how the old checklist should relate to teachers’ summative evaluation ratings. However, with the reform, there is a clear mapping of how teacher performance on different components of the evaluation relates to the final rating. Another important difference is the reformed system requires more frequent observations during the evaluation cycle, so school administrators could potentially be in teachers’ classrooms more often. Finally, there was no student performance component, and teachers and principals did not find the information to be informative (Sartain et al., 2011). Almost all teachers received high evaluation ratings, which was consistent with national data (Weisberg et al., 2009) and motivated the evaluation reform.
School leaders play a critical role in implementing the district’s evaluation system. Not only do school leaders serve as the evaluators who conduct classroom observations, they also introduce the evaluation system to their staff and frame the messaging regarding the purposes of teacher evaluation. Principals set standards for what evaluation looks like at each school. For example, principals decide when conferences are held with teachers prior to observation and how much notice and dedicated time is given to the teacher to complete required elements of the evaluation, and they connect teachers with training and resources in areas of needed development. In other words, principals largely determine how teachers experience the evaluation process, the quality and usefulness of the feedback that teachers receive, and how integrated the evaluation process is with other instructional improvement efforts (Shyjka, 2022). It is reasonable to believe, then, that a principal’s skills in instructional leadership, coaching, and relationship development with teachers in the building likely influence whether teachers perceive the evaluation process and data as useful and valid. As such, we investigated the relationship between teacher satisfaction with the evaluation system and school leadership in this paper.
Data and Methods
Data Sources
Through a data sharing agreement between CPS and the University of Chicago Consortium on School Research, we accessed two primary data sources: teacher survey data and administrative data.
First, the CPS 5Essentials survey data captured teachers’ perceptions about the evaluation system and their characterizations of school climate. The UChicago Consortium administers the survey to all CPS teachers annually each spring starting in 2013 and in the spring of odd years before 2013. The outcome of interest was teachers’ reported satisfaction with the evaluation system on this item: “Overall, I am satisfied with the evaluation process,” which was asked in years before and after the evaluation reform. 4 Teachers indicated their level of agreement on a 4-point scale, from strongly agree to strongly disagree. When used as an outcome variable, we dichotomized the responses, coding strongly agree/agree as 1 and strongly disagree/disagree as 0.
The primary purpose of the survey is to measure various aspects of school climate that have been linked to school improvement (Bryk et al., 2010; Hart et al., 2020). The UChicago Consortium creates measures of school climate using a Rasch model to combine related items into a set of constructs. We were interested in measures related to the school’s leadership, though we also included measures related to collegiality and collaboration among teachers. Table 1 includes a full list of measures and items we used. The teacher survey data also provided information about teachers’ assignments and backgrounds. Teachers self-reported their years of experience teaching, the grade level(s) and subject(s) they teach, and whether they are special education and/or English learner teachers.
School Climate Teacher Survey Measures and Corresponding Items Used in the Paper

Notes. Items taken from the Spring 2017 5Essentials survey to characterize school climate.
While we restricted our analytic sample to teachers who responded to the questions about teacher evaluation, there were still some instances of missing data among survey takers on other items. Missingness to individual items was a relatively small problem. The question with the highest rate of missingness (whether a teacher was an English language teacher) was missing for 7% of survey takers, and responses to other questions were missing at lower rates. We used mean imputation to keep teachers in the analysis who responded to the survey and had near-complete data. For each survey taker missing an item response, we assigned the mean of the variable and generated a missing indicator that equaled one if the item response was missing and 0 otherwise.
The second source of data were the CPS administrative data, which include student-level background information like race/ethnicity and gender, free/reduced-price lunch status, and whether they had an individualized education plan (IEP). We aggregated the student data to the school level. The administrative data also include teacher evaluation results, which we used to calculate the percent of teachers in each school who received the highest evaluation rating. To further describe school context, we used publicly available school performance data. The accountability system in Chicago includes multiple measures like attendance rates, graduation rates and college enrollment rates (for high schools), and school climate indicators, as well as test-based measures of student growth and performance levels.
Sample Description
The primary analytic sample was CPS teachers in traditional, noncharter schools in the spring of 2017 because teachers in charter schools are not subject to the district’s evaluation policy. We then included all teachers who responded to the teacher evaluation items on the annual district-wide survey in that year. The final analytic sample included 13,946 CPS teachers in 509 schools. For analyses that used repeated cross sections of teachers from 2011 to 2017, we followed a similar approach. Across all years in our panel, the response rates ranged from 66% in 2011 to 81% of CPS teachers in 2014; most years the response rate was high at around 80%.
Table 2 shows descriptive statistics for teachers in the analytic sample. About 1 in 5 respondents were Black teachers, and another 1 in 5 respondents were Latinx (22% or N = 3,082 and 21% or N = 2,9844, respectively). Most of the sample was female (78% or N = 10,808 teachers). Nearly two-thirds of the sample reported having a graduate degree (65% or N = 9,107 teachers), and over half of the sample had taught for more than 10 years (56% or N = 7,796 teachers). About one-third of teachers were in the lower elementary grades K–2 (30% or N = 4,142 teachers), 35% in grades 3–5 (N = 4,895 teachers), 32% in the middle grades 6–8 (N = 4,519 teachers), and 24% were high school teachers (N = 3,389 teachers). We also include information about the school context. At the average school, 40% of teachers received the highest evaluation rating (N = 5,523). In addition, 37% of teachers worked in a school with a high accountability rating (N = 5,146). About one-quarter of teachers worked in a school with a predominantly Black student population (24% or N = 3,305), and another quarter of teachers worked in a school with a predominantly Latinx student population (25% or N = 3,500). Finally, about two-thirds of teachers worked in schools where more than 85% of students qualify for FRPL (69% or N = 9,595).
Characteristics of Teachers and Their Teaching Contexts
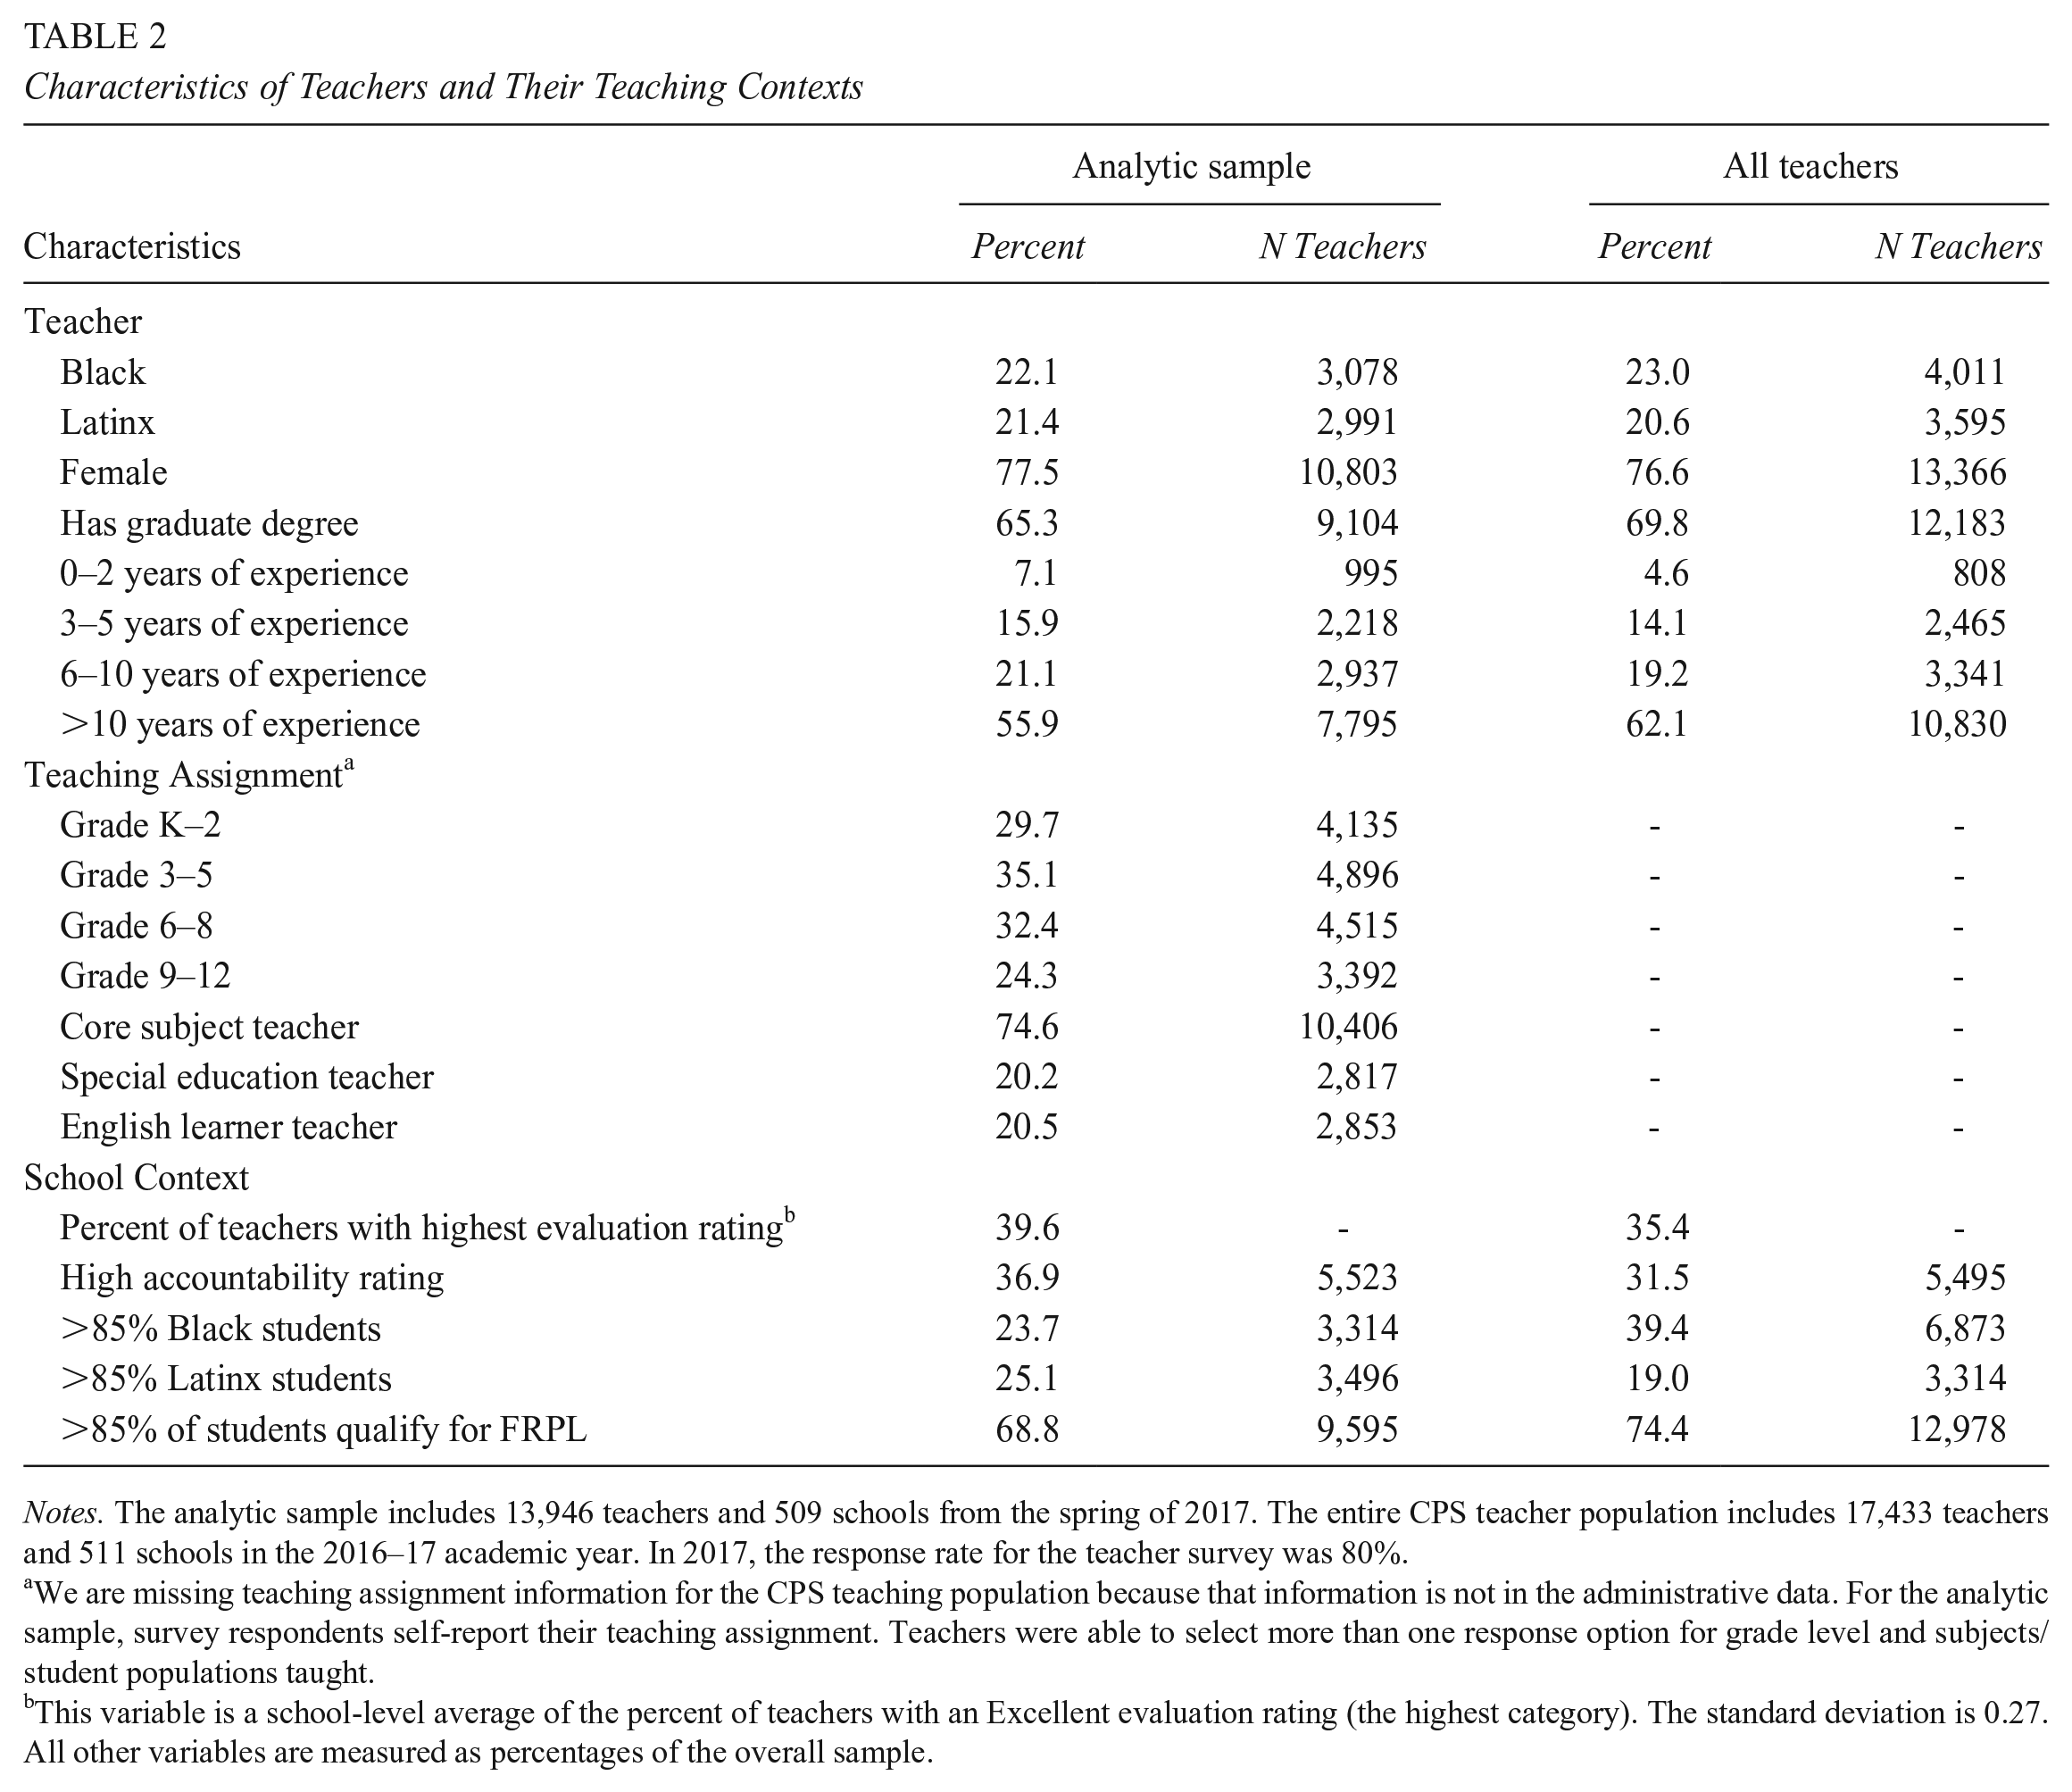
Notes. The analytic sample includes 13,946 teachers and 509 schools from the spring of 2017. The entire CPS teacher population includes 17,433 teachers and 511 schools in the 2016–17 academic year. In 2017, the response rate for the teacher survey was 80%.
We are missing teaching assignment information for the CPS teaching population because that information is not in the administrative data. For the analytic sample, survey respondents self-report their teaching assignment. Teachers were able to select more than one response option for grade level and subjects/student populations taught.
This variable is a school-level average of the percent of teachers with an Excellent evaluation rating (the highest category). The standard deviation is 0.27. All other variables are measured as percentages of the overall sample.
Analytic Approach
We employed various descriptive analyses with the administrative and survey data to answer our research questions. Most of the analyses relied on the spring 2017 survey administration because that year’s survey included the most comprehensive set of teacher evaluation items. For longitudinal analyses that describe how teacher perceptions of evaluation changed over time, we used data from survey administrations from spring 2011 to spring 2017 because all of those instruments included the teacher satisfaction item.
Research Question 1: Documenting Teachers’ Perceptions of Their Evaluations
We first show the distribution of survey responses to various items about teacher evaluation, including how accurately different evaluation measures represented their effectiveness, how influential the system had been on their practice, and the fairness of the system. We then focus on teacher reports of satisfaction with the evaluation system because (1) this item was asked consistently over time, including in the preevaluation reform period, and (2) this item captured teachers’ overarching attitudes about evaluation. We provide the distribution of teachers’ satisfaction in different teaching assignments and school contexts.
Research Question 2: Exploring Associations Between Context and Teacher Satisfaction With Evaluation
To understand how teaching assignment and school context are associated with teachers’ perceptions, we estimated a linear probability model with the preferred specification shown in equation (1):

where the outcome equals 1 if teacher i in school s (strongly) agreed that they are satisfied with the evaluation system and equals 0 if the teacher (strongly) disagreed. The estimated coefficients from model (1) indicate the relationship between teacher satisfaction with evaluation and predictor variables in five categories:
Teacher characteristics, including years of experience and whether the teacher held a graduate degree
Teaching assignment, including grade level(s) taught and whether the teacher taught a core subject in special education or English learners
Evaluation ratings in the school (the percent of teachers in the school who received the highest evaluation rating)
Student body characteristics, including racial/ethnic breakdown of the students, the percent of students who qualify for free/reduced-price lunch, and the percent of students with IEPs
School climate measures, including teacher-level survey reports of teacher collaboration, teacher-teacher trust, principal-teacher trust, and instructional leadership in the school; average years of teaching experience and the accountability rating were also included
Research Question 3: Identifying Trends and Changes in Teacher Satisfaction With Evaluation
Finally, we investigated how satisfaction with evaluation changed over time, focusing on changes in perceptions around the time the districts reformed the evaluation system. Satisfaction with any reform may initially be low solely due to feelings of uncertainty around how the policy might affect individual teachers, being unfamiliar with the new policy and its requirements and even reform fatigue more broadly. In this analysis, we explored how teachers’ satisfaction with the evaluation system changed with large-scale reform and if any initial decreases in satisfaction dissipated as administrators and teachers gained more experience with the new system.
We compared teacher reports of satisfaction in the post-reform period to the pre-reform period, using an interrupted-time-series approach with school fixed effects. The reform was rolled out first to nontenured teachers in CPS in 2012–13 and expanded to all CPS teachers in 2013–14, so we show results overall and by tenure status. This estimation approach relied on within-school variation in teacher satisfaction over time, though we also controlled for time-varying teacher and school characteristics to account for trends in these variables that may have also influenced reports of teacher satisfaction. Specifically, the preferred specification is estimated as the linear probability model shown in equation (2):

where Satisfaction equals 1 if teacher i in school s in year t indicated that they (strongly) agreed that they were satisfied with the teacher evaluation system. The model also includes the same covariates as in model (1) and school fixed effects ϕs. The year fixed effects ϕt are the coefficients of interest. We omitted 2012, which is the year prior to the teacher evaluation reform, so all the estimated year effects are relative to that pre-reform year and indicate post-reform deviations in satisfaction. In particular, ϕ2013 indicates the change in satisfaction in the first year of implementation with nontenured teachers relative to the year prior to the reform, and ϕ2014 shows how satisfaction changed in the second year of implementation, which included all nontenured and tenured teachers. We note that these estimates would be biased if there were other simultaneous but unobserved factors that influenced teachers’ perceptions about evaluations. Therefore, we describe these estimates as correlational but suggestive.
Results
Research Question 1: Teacher Attitudes Toward the Evaluation System
Table 3 shows the extent to which teachers agreed that different components of the evaluation accurately measured their effectiveness. Overall, teachers generally agreed that the various components of the teacher evaluation system accurately represented their effectiveness, though they were somewhat less positive about value-added scores than other components of their evaluations. Nearly 4 of 5 teachers (79% or N = 11,059) (strongly) agreed that classroom observation scores accurately represented their effectiveness compared to 62% of teachers with value-added scores (N = 8,633). Similarly, most teachers reported that each of the evaluation measures had influenced their practice. Teachers had more mixed opinions about the fairness of the evaluation system in different teaching and schooling contexts. About half of teachers agreed that the evaluation system was fair to all teachers regardless of the subjects or grades they teach (50%or N = 7,029). Relatively fewer teachers agreed that the evaluation system was fair to teachers regardless of the school where they work (44% or N = 6,226). Further, most teachers (69% or N = 9,567) felt the evaluation system ignores important aspects of teacher performance. Because many respondents identified the potential for evaluation to be unfair to teachers who work in different contexts, it is not surprising that about 2 of 5 teachers reported dissatisfaction with the system (41% or N = 5,648).
Distribution of Teacher Responses to Survey Items About the Evaluation System
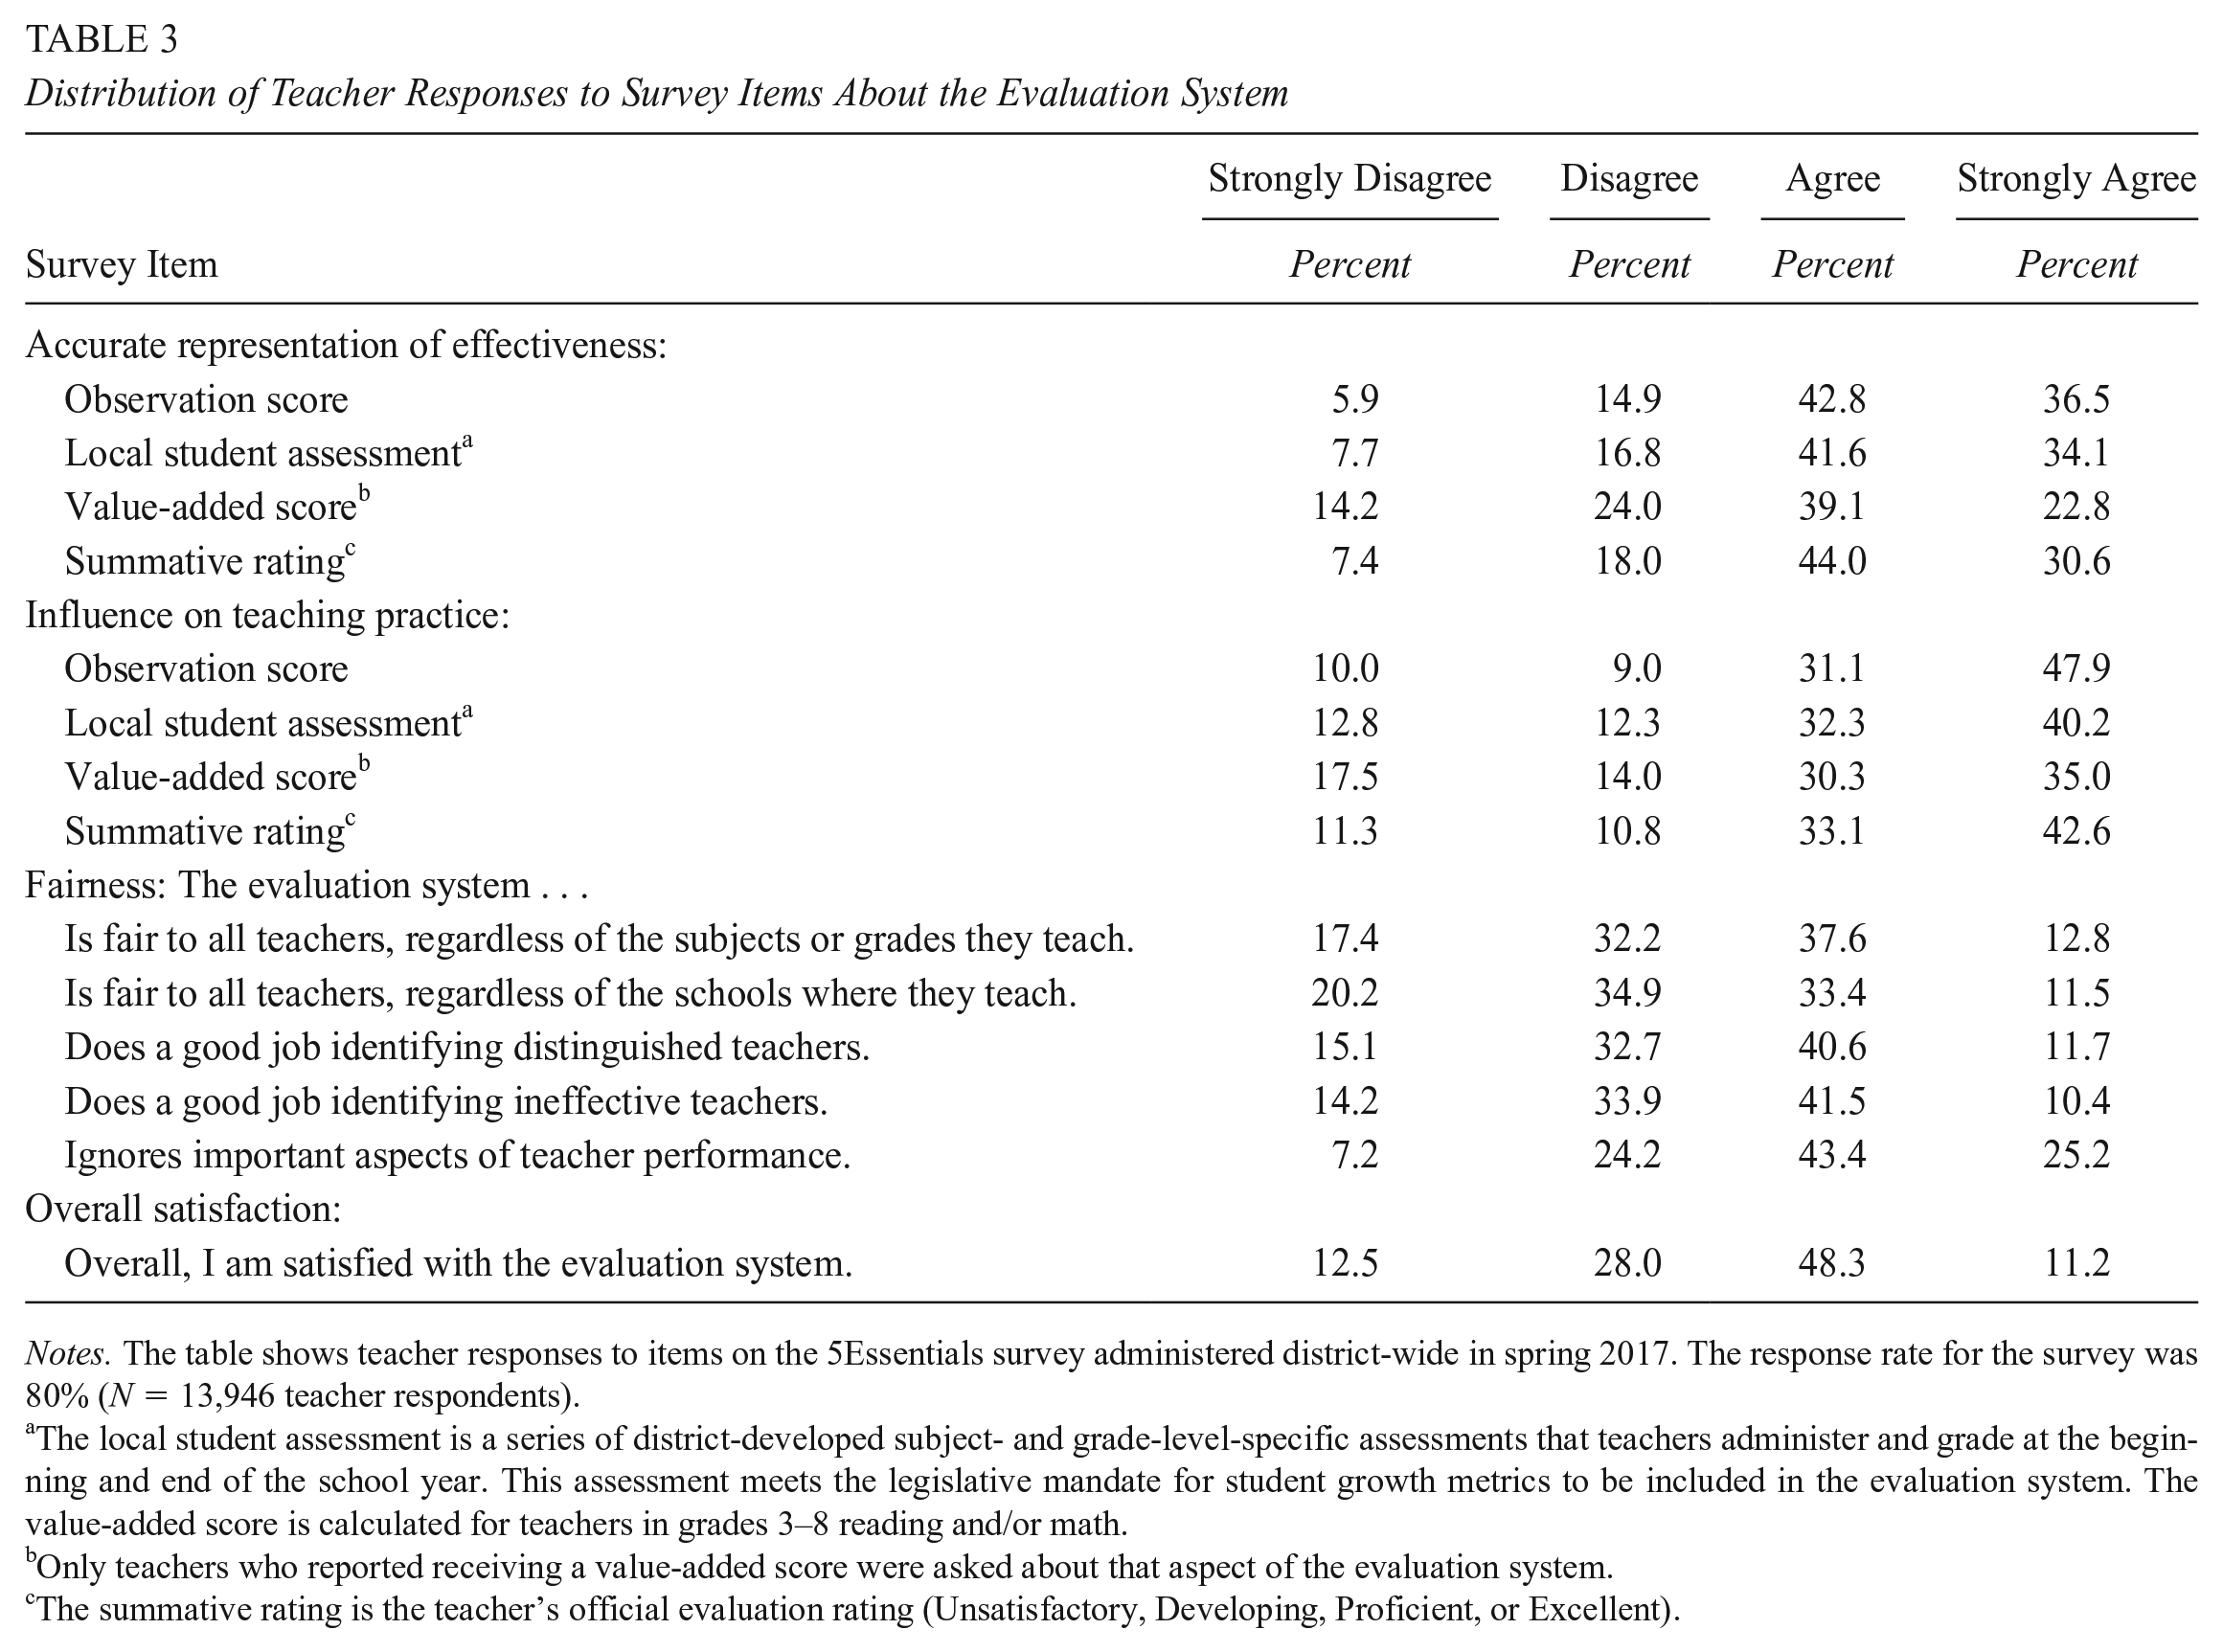
Notes. The table shows teacher responses to items on the 5Essentials survey administered district-wide in spring 2017. The response rate for the survey was 80% (N = 13,946 teacher respondents).
The local student assessment is a series of district-developed subject- and grade-level-specific assessments that teachers administer and grade at the beginning and end of the school year. This assessment meets the legislative mandate for student growth metrics to be included in the evaluation system. The value-added score is calculated for teachers in grades 3–8 reading and/or math.
Only teachers who reported receiving a value-added score were asked about that aspect of the evaluation system.
The summative rating is the teacher’s official evaluation rating (Unsatisfactory, Developing, Proficient, or Excellent).
Research Question 2: The Role of Teaching and School Context in Satisfaction With Evaluation
Table 4 shows the degree to which teachers’ self-reports of satisfaction with evaluation varied across dimensions related to teaching assignment and school context. For teaching assignment factors, there were differences in satisfaction across grade levels, with high school teachers being less satisfied with the evaluation system than teachers in lower grade levels (e.g., 55% or N = 1,855 high school teachers were satisfied compared to 64% or N = 2,630 K–2 teachers). Interestingly, teachers who indicated that a value-added measure was part of their evaluation reported similar levels of satisfaction as the overall population of teachers (61% or N = 2,123 versus 60% or N = 8,298).
Reported Levels of Satisfaction With the Evaluation System, Overall, by Teaching Assignment and School Context

Notes. The table shows teacher responses to the satisfaction item on the 5Essentials survey administered district-wide in spring 2017. The response rate for the survey was 80% (N = 13,946 teacher respondents).
Core subjects include English language arts, mathematics, science, and social science.
Teachers could choose more than one grade level, so the sample sizes total over 13,946.
Teachers indicated on the survey whether they received an individual value-added measure as part of their evaluation. The data shown in this row is for the teachers who said they did receive a value-added measure.
At the median school, 37.5% of teachers received the highest evaluation rating of Excellent.
Schools with high levels of principal-teacher trust are higher than 1 standard deviation above average, and schools with low levels of principal-teacher trust are lower than 1 standard deviation below average.
At the median school, 88% of teachers had attained tenure.
There were larger differences in teacher reports of satisfaction with evaluation among teachers working across different school contexts. We found considerable gaps in teacher satisfaction at schools with high and low school accountability ratings (64% or N = 6,080 teachers versus 50% or N = 752 teachers, respectively), as well as between schools where teachers generally received higher and lower evaluation ratings (63% or N = 4,496 indicated satisfaction versus 56% or N = 3,815). However, the largest gaps were between schools where teachers reported high and low levels of principal-teacher trust. Over 70% of teachers in schools with higher reports of principal-teacher trust agreed that they were satisfied with the evaluation (N = 5,557), compared to 47% of teachers in schools with lower levels of trust (N = 2,870).
Because of the substantive differences in reported perceptions across teachers’ assignments and school contexts, we utilized regression analysis to understand the degree to which these variables predicted satisfaction with evaluation individually and whether some factors were more predictive of teacher satisfaction than others. (See Appendix Table A1 for descriptive statistics and correlations of the school-level variables). Table 5 provides the results of this analysis. Each column shows the association between a group of teaching or school context factors and teacher satisfaction with the evaluation system, while the fully specified model (column 6) includes all factors simultaneously. In discussing the results, we focus on this model.
The Relationship Between Satisfaction With Evaluation and Teaching and School Context

Notes. All models include N = 13,946 teachers in the analytic sample. All continuous variables are standardized in order to compare the magnitude of coefficients. Standard errors are clustered at the school level. ***Indicates statistical significance with p-value <0.01; **p-value <0.05; *p-value <0.10.
More than 10 years of teaching experience is the reference category for years of experience.
Grades 9–12 is the reference category for grade level of teaching assignment.
Accountability points are from the district’s school accountability system.
In the full model, several variables were statistically significant predictors of teacher satisfaction with the evaluation system. Teaching experience was one of the strongest predictors of teacher satisfaction, as teacher satisfaction with evaluation monotonically decreased with years of experience such that newer teachers were much more satisfied than veteran teachers. For example, after holding other teaching and school context factors constant, new teachers with 0–2 years of experience were 20 percentage points more likely to be satisfied than their peers with more than 10 years of experience. There are also differences in satisfaction for teachers in different grade levels with teachers in middle grades 7 percentage points less likely to be satisfied than teachers in grades K–2 and 4 percentage points less likely than high school teachers. In addition, special education teachers were slightly less likely (3 percentage points) to be satisfied than non–special education teachers.
We also considered a variety of school context factors. (For robustness, Appendix Table A2 provides results from alternative constructions of the school climate variables, including at the teacher and school level and with lagged and contemporaneous measures.) In schools where teachers were more likely to receive high evaluation ratings, teachers were more likely to report being satisfied with the system. A one-standard-deviation increase in teacher evaluation ratings in the school was associated with a 3-percentage point increase in teacher satisfaction. Student body characteristics had a weaker relationship with teacher satisfaction, though teachers in schools serving higher shares of Black students were more positive. However, the strongest correlations between teacher satisfaction and school context factors were with measures of school leadership, specifically the level of trust between principals and teachers in the school and teacher reports of the strength of instructional leadership in the school. Teachers who reported levels of principal-teacher trust that were a standard deviation above the mean were 10 percentage points more likely to be satisfied than teachers in schools with average levels of trust. The same standard deviation increase in teacher perceptions of instructional leadership in the school was associated with a 6-percentage-point increase in teacher satisfaction. Taken together, schools with both strong relationships between principals and teachers and strong perceptions of instructional leadership were places where teacher satisfaction with the evaluation system was quite high.
Research Question 3: Changes in Satisfaction After Evaluation Reform
Finally, we describe how satisfaction with teacher evaluation changed over time following the introduction of the district’s reformed system in fall 2012. Table 6 shows the results. The reported coefficients represent the percentage-point change in the likelihood of teachers indicating satisfaction with the teacher evaluation system relative to the pre-reform year of 2011 when 78% of teachers reported being satisfied. Each column of the table includes different sets of control variables, building up to column (4), which is our preferred specification with school fixed effects as well as time-varying teacher and school characteristics.
The Relationship Between Evaluation Reform and Satisfaction With the Evaluation System
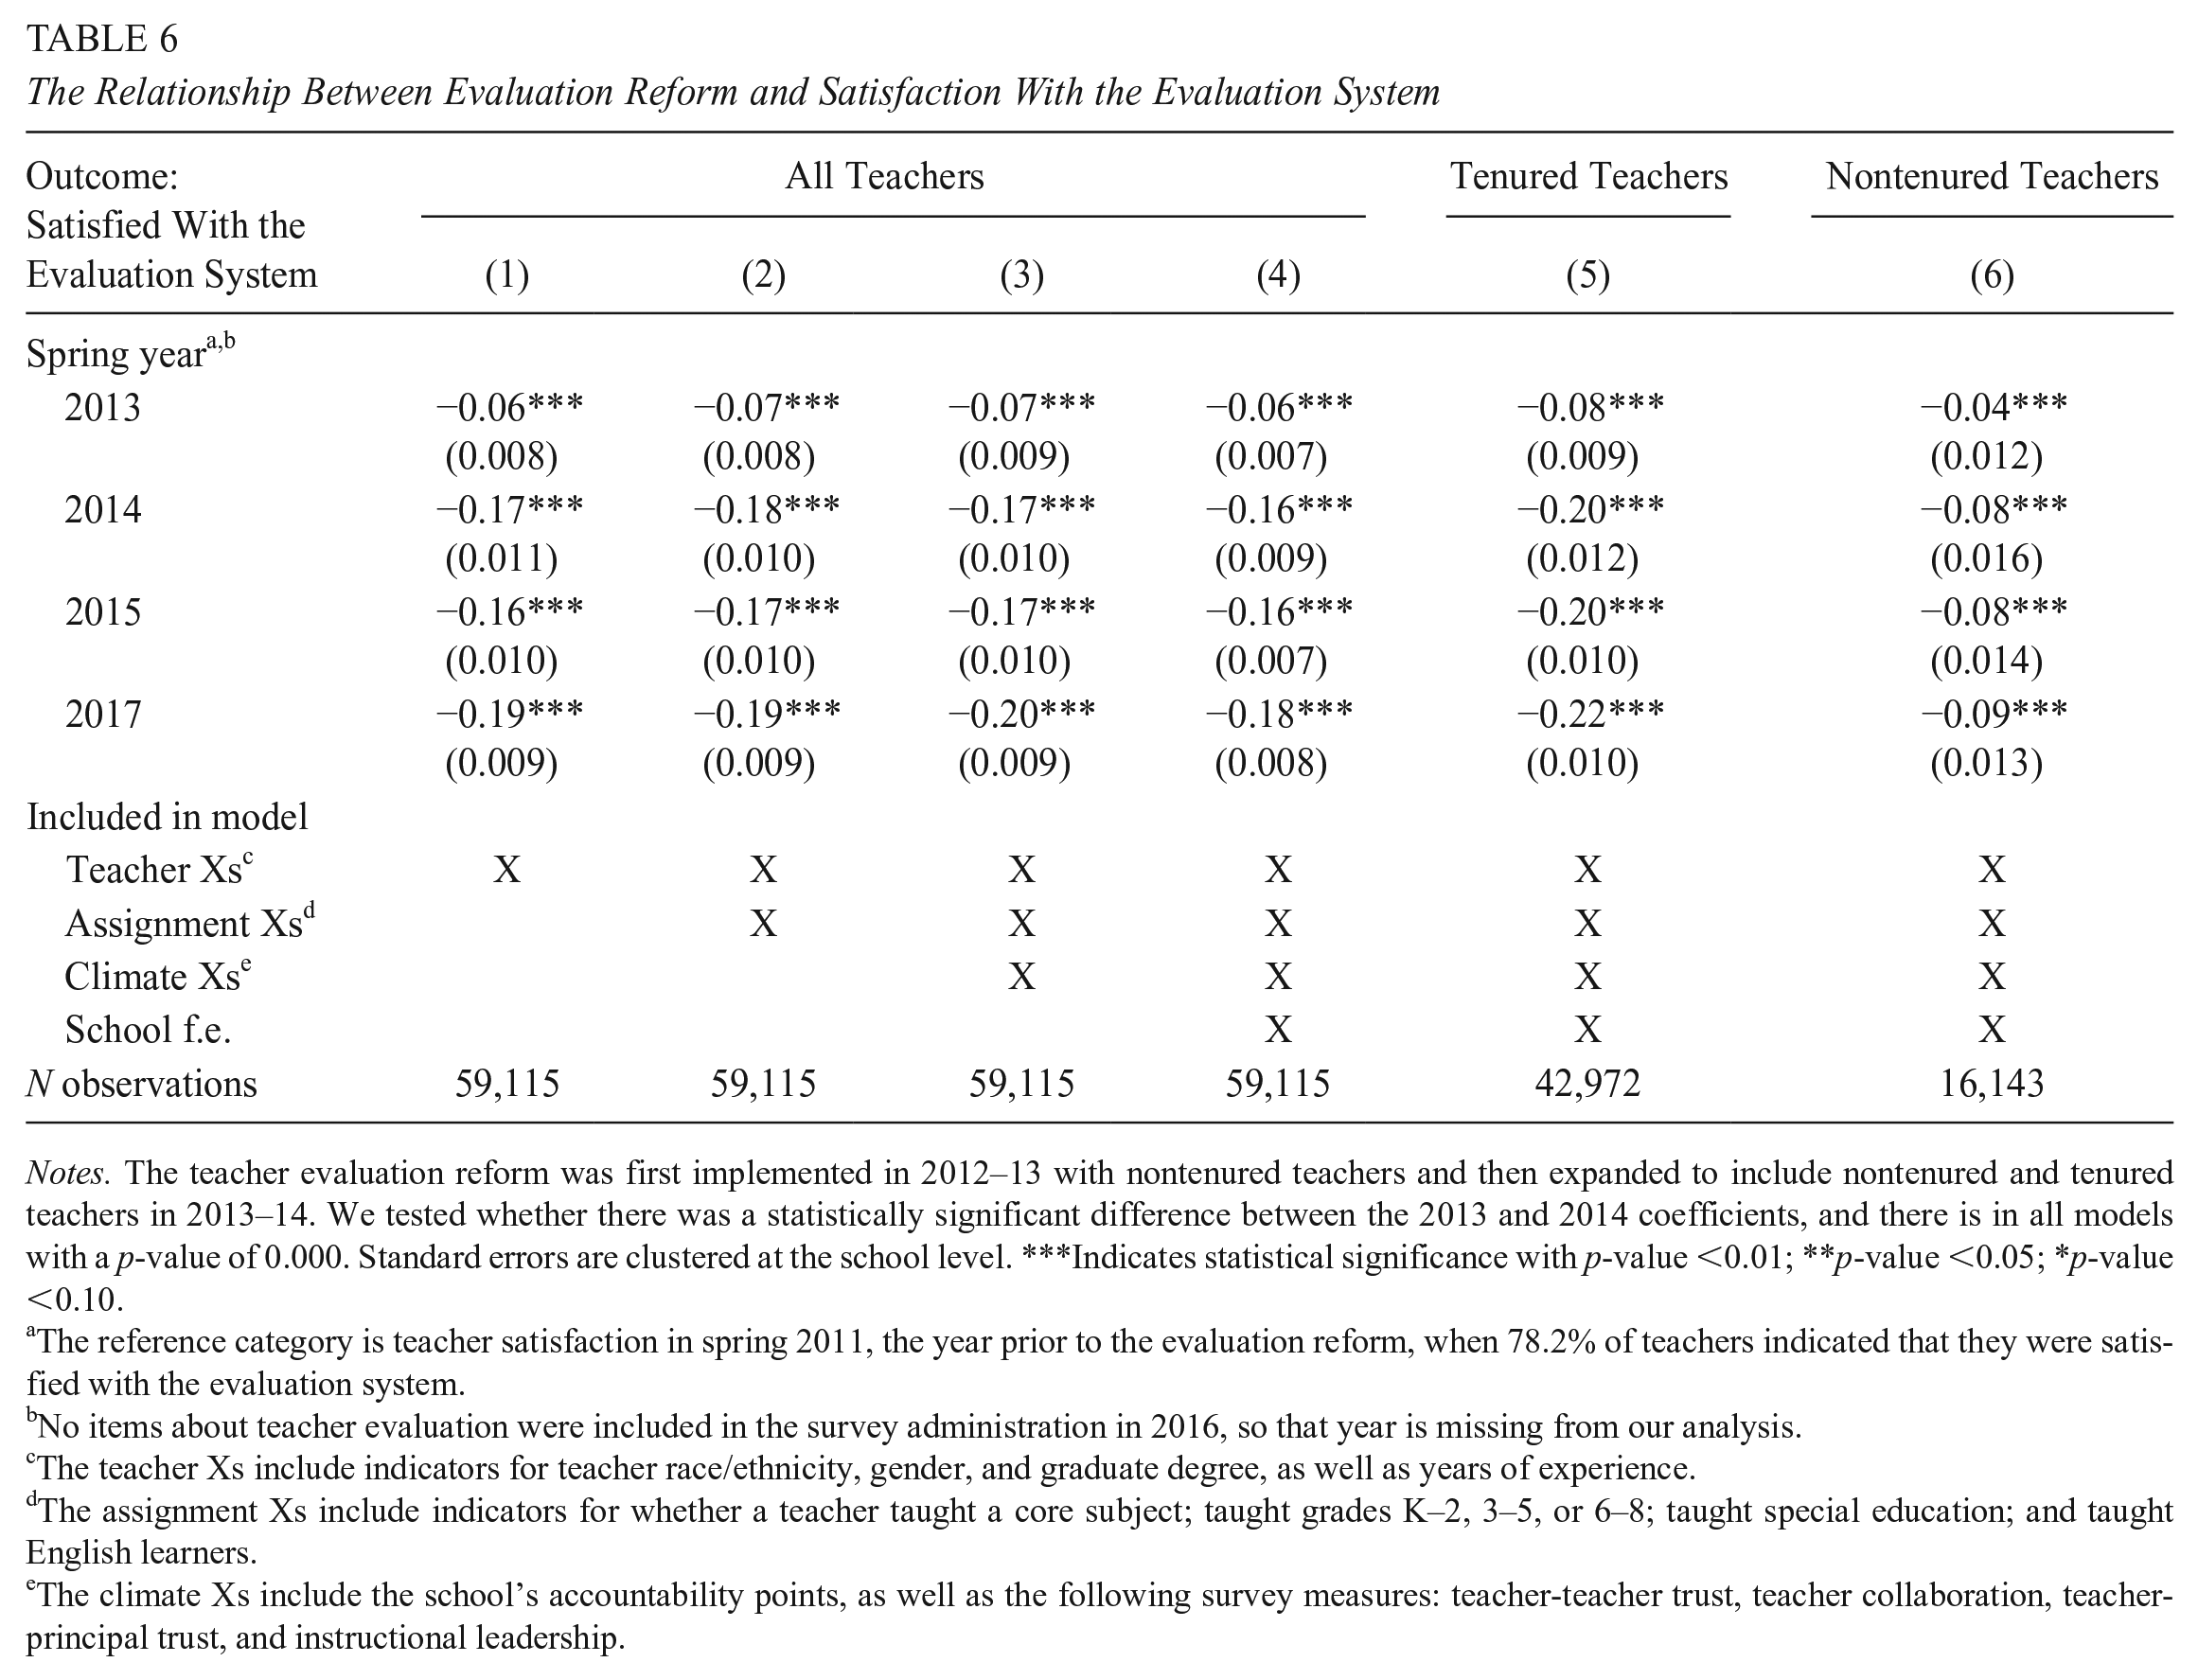
Notes. The teacher evaluation reform was first implemented in 2012–13 with nontenured teachers and then expanded to include nontenured and tenured teachers in 2013–14. We tested whether there was a statistically significant difference between the 2013 and 2014 coefficients, and there is in all models with a p-value of 0.000. Standard errors are clustered at the school level. ***Indicates statistical significance with p-value <0.01; **p-value <0.05; *p-value <0.10.
The reference category is teacher satisfaction in spring 2011, the year prior to the evaluation reform, when 78.2% of teachers indicated that they were satisfied with the evaluation system.
No items about teacher evaluation were included in the survey administration in 2016, so that year is missing from our analysis.
The teacher Xs include indicators for teacher race/ethnicity, gender, and graduate degree, as well as years of experience.
The assignment Xs include indicators for whether a teacher taught a core subject; taught grades K–2, 3–5, or 6–8; taught special education; and taught English learners.
The climate Xs include the school’s accountability points, as well as the following survey measures: teacher-teacher trust, teacher collaboration, teacher-principal trust, and instructional leadership.
The results were stable across specifications. In the pre-reform period, 78% of teachers reported that they were satisfied with the evaluation system. In 2013, after the reformed system was implemented with nontenured teachers, there was a 6-percentage-point decline in teacher satisfaction relative to the pre-reform period. In 2014, when all teachers used the new system, there was another noticeable shift in teacher satisfaction: a decline of 16 percentage points relative to 2011. The increased drop in teacher satisfaction that occurred between 2013 and 2014 was also statistically significant. The decline remained in the subsequent years, so teacher satisfaction with evaluation did not return to pre-reform levels. However, again we note that since our model does not employ a comparison group who did not experience evaluation reform, there may have been other co-occurring events or policy reforms that drove the change in teacher reports of satisfaction.
Table 5 also provides results disaggregated by teacher tenure status 5 shown in columns 5 and 6. The regression model was specified identically to column 4 but run separately on the samples of tenured and nontenured teachers. In 2013, the initial year of implementation that started with nontenured teachers, there was an 8 percentage-point decrease in reported satisfaction among tenured teachers who were anticipating the reform and a 4 percentage-point decline for nontenured teachers who experienced the reform. In 2014, after REACH was implemented with tenured teachers, there was a much larger decline in satisfaction among tenured teachers (20 percentage points) than nontenured teachers (8 percentage points). This result is consistent with tenured teachers generally being less satisfied with the evaluation process than were nontenured teachers.
Discussion
Since the first Race to the Top competition in 2009, systemic policy reform efforts have changed the way teachers are evaluated. As did many school districts and states across the country, CPS underwent a major overhaul of their teacher evaluation system, leaving behind a long-used “checklist” for a more robust multimeasure system in 2012–13. A growing body of research has estimated the impacts of teacher evaluation on teachers’ labor market outcomes, the quality of teaching, and student outcomes (Anderson et al., 2022; Cullen et al., 2021; Dee & Wyckoff, 2015; Dee et al., 2021; Koedel et al., 2017; Kraft et al., 2020; Sartain & Steinberg, 2016; Steinberg & Sartain, 2015). This research showed that low-rated teachers were more likely to exit teaching because of these reform efforts; though, even under these new systems, relatively few teachers were identified as low-performing. Further, the research on how evaluation reform has affected student test scores has shown mixed results. Teachers’ perceptions of the evaluation system, the data it generates, and evaluator feedback likely influenced the magnitude and sign of the estimated impacts. For this reason, we document teachers’ perceptions of the evaluation process in this research.
We show that teacher satisfaction with the evaluation system declined in the years after Chicago overhauled their evaluation system with 60% of teachers indicating satisfaction with the new process. Still, with about 2 of every 5 teachers reporting dissatisfaction, there are likely aspects of the evaluation system that could be improved. Satisfaction with any reform may initially be low solely due to feelings of uncertainty around how the policy might affect individual teachers, being unfamiliar with the new policy and its requirements, and even experiencing reform fatigue more broadly. We hypothesize that when teachers are more satisfied with the evaluation system, they will be more open to feedback and make meaningful changes to their teaching practice with the end goal of benefiting students. Therefore, as teacher evaluation systems continue to evolve, understanding the school’s contexts where teacher evaluation data are most likely being used for improvement is important.
We point to the teacher and school characteristics most strongly associated with teacher satisfaction with their evaluation system. Veteran teachers had lower reports of satisfaction than newer teachers, and tenured teachers also experienced large declines in satisfaction after the evaluation reform in Chicago. Novice teachers who were trained more recently may have already used the types of structured classroom observations and rubrics featured in reformed evaluation systems. Newer teachers may also be more open to taking risks and trying new things because they have spent less time in the classroom. And because 29% of nontenured teachers received Unsatisfactory or Developing ratings relative to 16% of tenured teachers (Sartain & Steinberg, in press), they may have been able to improve their practice based on the feedback process compared to veteran teachers. On the other hand, it is likely that tenured teachers had grown accustomed to the old, minimalist evaluation approach where ratings were high. They likely had more at stake with the transition to more rigorous evaluations than newer teachers. These findings suggest that school and district leaders should work intentionally to build trust in the system, especially with more experienced educators. For experienced teachers who have proven track records as quality educators, district and school leaders may want to reframe their messaging about teacher evaluation to focus on the benefits of instructional improvement rather than on the accountability mechanism. In fact, research has shown that very few teachers receive low ratings and are subject to removal because of their evaluations (e.g., see Kraft & Gilmour, 2017). Because very few teachers are even at risk of evaluation-related sanctions, emphasizing the evaluation components most related to growth and support, as well as acknowledging teacher strengths, may go a long way to improve the nature of the dialogue around evaluations.
We also identified the school conditions that are most conducive to fostering teacher satisfaction with their evaluation system—namely, schools where teachers perceive instructional leadership as strong. This makes sense given that teacher evaluation systems rely heavily on principals to be evaluators and coaches. Further, in Chicago, principals were expected to align evaluative conversations with other school and district initiatives around instructional improvement. It is easy to imagine that those conversations would be more productive with a principal who is comfortable mentoring teachers. In addition, the likelihood that a principal is successful at these tasks certainly depends on the already-existing relationships among adults in the building. Our research suggests that supporting principals in improving climate and building trusting relationships with their teachers would strengthen the implementation of policies like teacher evaluation reform.
High school teachers were generally less positive about the evaluation reform than teachers in elementary grades. Because high schools are typically larger with bigger teaching staff, evaluating teachers with fidelity and providing them with good feedback can be an especially onerous task. Previous research has documented that the Race to the Top–era teacher evaluation reforms are very time-consuming for evaluators (typically school administrators) to implement because of the high numbers of required observations and the associated emphasis on data collection and documentation (Goldring et al., 2015; Hill & Grossman, 2013; Kraft & Gilmour, 2016; Sartain et al., 2011). Because evaluations can be so time-intensive for principals, and high schools have larger teaching staff than elementary schools, perhaps high school teachers reported lower levels of satisfaction because they received less feedback or had shorter or fewer conversations about instruction with their principals. The same logic applies to any school with a large teaching staff. In cases like these, districts may need to consider how to expand the number of evaluators in a school so that all teachers receive high-quality feedback about their teaching practice.
States and districts are revising their evaluation policies, with many deemphasizing or eliminating the use of test-based measures, which are generally unpopular with teachers (Swisher & Saenz-Armstrong, 2022). In our study, teachers felt like value-added measures were less representative of their teaching than classroom observation ratings. In Chicago, the district has not included any measures based on standardized tests in its evaluation since the pandemic disruption in 2020. At the same time, CPS is making efforts to shift its teacher evaluation system from a culture of compliance to a culture of improvement. In the initial implementation period of teacher evaluation reform in CPS, and likely other contexts, district training for principals focused on compliance: applying classroom observation rubrics and ensuring that principals rated teacher practice accurately. There was typically less support for principals about how to use the evaluation data to guide critical conversations and make instructional decisions. The culture shift from accountability to support and improvement may occur more easily in schools with effective principals who feel comfortable in the instructional leader role, which also tend to be the same schools where teachers are generally more positive about evaluations. Even with a reframing of the purposes of teacher evaluation systems, districts will need to support principals who have struggled to build supportive and trusting school climates, including training on developing strong coaching and mentoring skills and/or strategies for delegating instructional leadership responsibilities to other leaders in the building.
The collective body of research on teacher evaluation reform has implications for education policy implementation more broadly. Principals, and especially those in schools that are already struggling with climate issues, will need support around the implementation of any policy reform, including how to communicate about the policy, how to make the reform work meaningful to teachers, and how to connect reform efforts with ongoing school programs and initiatives to improve instructional quality. For newer school leaders who may not have experience with implementing new reforms or gathering teacher buy-in, any policy change will be challenging. Ultimately, schools without effective leadership or high levels of trust among adults in the building may not have the capacity to implement large-scale policy changes with fidelity, which could hinder policies that center the principal as the key implementer from meeting their intended goals.
Supplemental Material
sj-docx-1-ero-10.1177_23328584231221539 – Supplemental material for Are Teachers Satisfied With Their Evaluations? The Importance of Teaching Context and Trends Over Time
Supplemental material, sj-docx-1-ero-10.1177_23328584231221539 for Are Teachers Satisfied With Their Evaluations? The Importance of Teaching Context and Trends Over Time by Lauren Sartain and Wesley T. Morris in AERA Open
Footnotes
Acknowledgements
The authors thank the staff at Chicago Public Schools, particularly in the Talent Office, and the UChicago Consortium for providing access to the data and helping us better understand the policy context. We also thank seminar participants at the Association for Education Finance and Policy annual conference. This paper also benefited from conversations with John Q. Easton, Peter Halpin, Ayesha Hashim, Andria Shyjka, and Matt Springer. Finally, this work would not have been possible without the generous funding of the Spencer Foundation. Any errors are ours.
Open Practices Statement
Notes
Authors
LAUREN SARTAIN is an assistant professor at the University of North Carolina at Chapel Hill, School of Education, 107 Peabody Hall, CB 3500, Chapel Hill, NC 27599, and an affiliated researcher at the University of Chicago Consortium on School Research; email:
WESLEY T. MORRIS is a Ph.D. student at the University of North Carolina at Chapel Hill, School of Education, 107 Peabody Hall, CB 3500, Chapel Hill, NC 27599; email:
References
Supplementary Material
Please find the following supplemental material available below.
For Open Access articles published under a Creative Commons License, all supplemental material carries the same license as the article it is associated with.
For non-Open Access articles published, all supplemental material carries a non-exclusive license, and permission requests for re-use of supplemental material or any part of supplemental material shall be sent directly to the copyright owner as specified in the copyright notice associated with the article.