
Abstract
Using statewide administrative data from a sample of children enrolled in public prekindergarten (pre-K) programs in Massachusetts, I examined heterogeneity in children’s absenteeism patterns from pre-K to Grade 3 and linked these patterns to their Grade 3 academic outcomes. After latent class growth analysis, six absenteeism patterns emerged. The vast majority of children (85%) had consistently low absenteeism, and only a small percentage of children (1%) demonstrated consistently high absenteeism. Four patterns showed variation in absenteeism over time, with two characterized by high absenteeism in only the pre-K year, another with a peak during kindergarten, and a final one with rising absenteeism across grades. Children with always low absenteeism had higher average English language arts and math scores than did children in the other patterns, and children in the two high pre-K absenteeism patterns and peak in kindergarten pattern had higher math scores than those with rising and always high absenteeism patterns.
Keywords
Introduction
Each year, about 7 million children in Grades K–12—one in every six—miss more than 3 weeks of school (U.S. Department of Education, 2019), representing a collective loss of 100 million days of learning. High absenteeism is associated with a host of negative consequences, such as lower academic achievement and social-emotional outcomes (Ansari & Gottfried, 2021; Ansari & Pianta, 2019; Ansari & Purtell, 2018; Cattan et al., 2023; Connolly & Olson, 2012; Ehrlich et al., 2018; Fuhs et al., 2018; Gershenson et al., 2017; Gottfried, 2014; Gottfried & Ansari, 2021; Liu et al., 2021). In recent years, increased attention has been given to the prevalence and negative implications of high absenteeism, particularly during the prekindergarten (pre-K) years. The pre-K absenteeism literature has previously examined how absenteeism in one year relates to child outcomes within the same school year (e.g., Ansari & Purtell, 2018; Gottfried, 2014) or used absenteeism in one year to predict future outcomes (e.g., Ehrlich et al., 2018; Morrissey et al., 2014). Yet less is known about the stability and changes in absenteeism from pre-K through the early elementary school years, the heterogeneity in patterns that different children may experience, and whether and how these patterns are associated with child outcomes.
I used statewide administrative data from the Massachusetts Department of Elementary and Secondary Education (MA DESE) to address these gaps through the following aims: First, I examined whether subgroups of children in the sample exhibited differing patterns of absenteeism from pre-K to Grade 3. Specifically, I used latent class growth analysis (LCGA) to group children into longitudinal patterns of absenteeism. I focused on these grades because Grade 3 is the first year children are administered the state test, and examining associations between patterns of absenteeism and Grade 3 outcomes may highlight another potential indicator for identifying children who may need additional support before more formal benchmarks. Within this aim, I also described and compared the sociodemographic characteristics and educational experiences of children across different absenteeism patterns. Second, I explored whether children’s absenteeism patterns were associated with their academic outcomes in Grade 3. Results from this study could support the development of more targeted and timely interventions for reducing absenteeism beginning in the early years.
School Absenteeism From Pre-K to Early Elementary School
When children are absent from school, they miss out on key opportunities to learn and develop social skills through interactions with their peers (Arbour et al., 2016; Gottfried, 2014; Gottfried & Ansari, 2021). Prior research has shown that absenteeism across the K–12 years negatively affects academic, social-emotional, and other education outcomes in the short and long terms (Cattan et al., 2023; Gershenson et al., 2017; Gottfried, 2011, 2014, 2017; Liu et al., 2021). Specifically during elementary school, high absenteeism is consistently associated with worse academic outcomes, such as reading and math skills, lower levels of social-emotional skills, and higher absenteeism in subsequent years (Ansari & Gottfried, 2021; Connolly & Olson, 2012; Gershenson et al., 2017; Gottfried, 2011, 2014, 2017).
In recent years, the research literature has focused on absenteeism during pre-K. For many children and families, pre-K is the first year of formal schooling and establishes formal school-going routines. These foundational experiences in pre-K have long-term implications for children’s learning and development (Gormley et al., 2008; Pre-Kindergarten Task Force, 2017; Yoshikawa et al., 2013). Although federal, state, and local investments have considerably expanded access to and enrollment in pre-K, studies have shown that absenteeism is typically highest during the pre-K year before declining through the elementary school years (Connolly & Olson, 2012; Dubay & Holla, 2015, 2016; Ehrlich et al., 2018; MA DESE, 2019b; Rhoad-Drogalis & Justice, 2018)—thus limiting the potential benefits of enrollment. For example, a cross-sectional analysis in Chicago revealed that more than 35% of pre-K children were chronically absent (i.e., missing more than 10% of the school year) compared to 20% of children in kindergarten and 10% of children in Grade 3 (Ehrlich et al., 2018). Similar patterns have been documented in such cities as Baltimore and Washington, DC, and in the state of Massachusetts (Connolly & Olson, 2012; Dubay & Holla, 2016; MA DESE, 2019b). Moreover, children of color and those from low-income households tend to be disproportionately represented among children who exhibit high absenteeism (Chang & Romero, 2008; Dubay & Holla, 2015; Ehrlich et al., 2018; Gottfried & Gee, 2017). Similarly, children with disabilities, children without prior early education and care experiences, and English learners are at greater risk for chronic absenteeism (Ansari & Gottfried, 2020; Ehrlich et al., 2018; Gottfried, 2015).
As in older grades, pre-K absenteeism is negatively associated with short- and long-term academic and social-emotional outcomes. In the short term, children with higher pre-K absenteeism exhibit smaller gains in early academic skills and executive function skills across the pre-K year than do their peers with lower absenteeism, after controlling for a host of sociodemographic characteristics (Ansari & Purtell, 2018; Ehrlich et al., 2018; Fuhs et al., 2018; Rhoad-Drogalis & Justice, 2018). Although evidence is limited, higher pre-K absenteeism is associated with lower academic performance during elementary school (Connolly & Olson, 2012; Ehrlich et al., 2018), providing support for the potential longer-term consequences of early absenteeism. Combined with findings related to who is more likely to be absent, differences in early absenteeism may be one contributor to the early disparities in academic outcomes observed between children from different racial/ethnic and socioeconomic groups (Reardon, 2011; Reardon & Portilla, 2016) and therefore important to consider.
Moving Beyond Snapshots of Absenteeism
The person-process-context-time model (Bronfenbrenner, 1995) highlights the importance of temporal dynamics and how experiences over time matter for children’s learning and development. Examining the shape of absenteeism for individual children over time can provide understanding for the duration of high absenteeism as well as the timing of when high absenteeism was experienced (only preschool versus only elementary school versus all years) and how these temporal factors may overall relate to children’s outcomes. As such, studying patterns of absenteeism can illuminate whether absenteeism remains stable, increases, and/or decreases over time and whether these patterns are associated with children’s later developmental outcomes. To the best of my knowledge, only one study has included the pre-K year when examining patterns of absenteeism and linked absenteeism to children’s outcomes (Anderson & Romm, 2020).
Prior research has found that pre-K absenteeism in one year is associated with absenteeism in subsequent years, suggesting stability in absenteeism from year to year (Anderson & Romm, 2020). For example, one longitudinal study using data from children enrolled in public pre-K programs in Tulsa looked at the average pattern of absenteeism from pre-K to Grade 3 for all children and found that absenteeism remained the same (Anderson & Romm, 2020). This stability could be attributed to individual and family factors that are consistent across multiple years, such as regular access to transportation to school or poor child or parent health, that may contribute to absenteeism. Other research has suggested that stability in absenteeism may not be representative of all children’s experiences. As mentioned earlier, cross-sectional studies have shown that a smaller percentage of children was chronically absent in kindergarten relative to pre-K (Connolly & Olson, 2012; Dubay & Holla, 2016; Ehrlich et al., 2018; MA DESE, 2019b). Building on these findings, one study following a cohort of pre-K children in Chicago found that children’s absenteeism declined from year to year (Ehrlich et al., 2018), suggesting general trends in reduced absenteeism from pre-K to elementary school.
Various explanations could account for these decreases in absenteeism during the transition from pre-K to kindergarten. At the child level, children are highly susceptible to illnesses during preschool, when their immune systems are relatively weaker than in older years (Ball et al., 2002). At the family level, different types of logistical barriers may also contribute to higher pre-K absenteeism, such as the lack of access to transportation and/or mismatch between pre-K hours of operation (e.g., part-time programs) and parents’ work schedules (Katz et al., 2015; Sugrue et al., 2016; Susman-Stillman et al., 2018). Finally, at the systems level, attendance has not been compulsory in most pre-K settings, whereas statewide mandates dictate attendance in Grade 1 and above in public schools. These policies may communicate differing messages to school staff and families about the importance of being present at school for children in earlier versus later grades. For example, parents may view pre-K more as childcare than as an enriching environment where children are learning and developing critical skills for their long-term success and, therefore, may view pre-K absenteeism as less consequential relative to absenteeism in K–12 (Ehrlich et al., 2014; Katz et al., 2015).
Two studies have examined stability and change in absenteeism among elementary school-age children (Schoeneberger, 2011; Simon et al., 2020). Using LCGA, an approach that identifies groups of children sharing similar patterns of characteristics, these two studies identified four patterns of absenteeism among children enrolled in an urban school district in the southeastern United States (Schoeneberger, 2011) and those in the nationally representative Early Childhood Longitudinal Study-Kindergarten (ECLS-K) Class of 1998–1999 (Simon et al., 2020). Specifically, two “stable” (i.e., one always high and one always low) and two “changing” (i.e., one increasing and one decreasing over time) patterns emerged in both samples. In the southeastern school district, 17% of children experienced either increases or decreases in absenteeism over time (Schoeneberger, 2011), whereas 46% of children experienced these changes in the nationally representative ECLS-K study (Simon et al., 2020). As such, a substantively meaningful percentage of children did not exhibit stability in absenteeism over time. Additionally, these studies revealed that some children who were not chronically absent in earlier years of schooling demonstrated rises in absenteeism over time.
These two studies also examined how patterns of absenteeism were differentially linked to children’s outcomes. Whereas children with always high absenteeism exhibited the worst outcomes and those with always low absenteeism exhibited the best outcomes, the outcomes of those with changing levels of absenteeism varied by study (Schoeneberger, 2011; Simon et al., 2020). In the southeastern school district, children with the rising absenteeism pattern experienced a similar high school dropout rate as children with the always high absenteeism pattern (Schoeneberger, 2011). In the ECLS-K study, the outcomes for children with the two changing absenteeism patterns fell in between those of the always high and always low absenteeism patterns and were similar to one another (Simon et al., 2020). These results suggest the need to address patterns of change in absenteeism rather than examining absenteeism at only the start or end of the period observed because it has meaningful associations with children’s outcomes. As a substantial number of children are enrolled in public pre-K programs and as states and local education agencies are considering the expansion of pre-K (Friedman-Krauss et al., 2021), further research including the pre-K year is warranted—particularly in relation to identifying children who may be frequently absent for many years starting from the pre-K year. The present study built on the prior research by identifying multiple patterns of absenteeism from pre-K to Grade 3 and exploring how each related to academic outcomes.
The Pre-K Context in Massachusetts
The present study drew on administrative data from children enrolled in school district–provided public pre-K programs in Massachusetts (MA) between 2012–2013 and 2014–2015 and followed them through Grade 3. This sample was a subset of all pre-K-aged children, as pre-K is not required in MA and children this age attend various types of early care and education programs, such as Head Start, state and locally funded pre-K programs, private center–based care, and family child care programs (Jones et al., 2020). Approximately 25% of children in each public kindergarten cohort were previously enrolled in district-provided public pre-K programs.
In MA, children with and without individualized education programs (IEPs) are enrolled in the public pre-K programs under different criteria. If an IEP plan determines that a child will receive services in the public schools, then this child is guaranteed a slot in the public pre-K setting provided by the local school district (MA DESE, 2018). On the other hand, children without IEPs enroll in public pre-K programs based on the rules determined by their local school districts. As a result of this prioritization, children with IEPs account for a larger percentage of the public pre-K population as compared to the K–3 population (30% vs. 18%). Other than prioritizing enrollment of children with IEPs, districts can then decide how to fill the remaining slots (e.g., lottery), and therefore, enrollment policies vary from district to district. In addition to differences in how children with and without IEPs are enrolled in public pre-K programs, the prevalence and reasons for absenteeism differ (Ansari & Gottfried, 2018; Ehrlich et al., 2018; Gee, 2018; Gottfried et al., 2019). For example, children with IEPs are more likely to be absent than are children without IEPs, and they are more likely to be absent for health-related reasons beyond common colds (Attendance Works, 2015; Gottfried et al., 2019). For these reasons, I have chosen to focus specifically on children without IEPs in this paper. Nevertheless, a strength of this sample is that it included children from across the state rather than a single community or region, as is the case in much of the extant pre-K absenteeism literature, and it was representative of children without IEPs who began pre-K in and progressed through the public school system statewide.
Current Study
In the present study, I used statewide administrative data from three cohorts of children enrolled in public pre-K in Massachusetts to examine patterns of absenteeism from pre-K to Grade 3 and their associations with Grade 3 academic outcomes. Specifically, this study addressed the following aims:
Aim 1a: What patterns of absenteeism emerge for different groups of children?
Aim 1b: Do children’s sociodemographic characteristics and educational experiences vary across these patterns of absenteeism?
Aim 2: How do academic outcomes (e.g., standardized test scores on English language arts and math) in Grade 3 vary by children’s patterns of absenteeism from pre-K to Grade 3?
To address these research questions, I employed LCGA, a person-centered approach that grouped children into similar patterns of absenteeism exhibited from pre-K to Grade 3. I also conducted descriptive analyses to examine which children were more likely to exhibit certain absenteeism patterns and multilevel regression analyses to link these patterns to children’s academic outcomes. Rather than focusing on associations between absences and outcomes within the same year or absences at one time point and outcomes at another, LCGA captured nuances in children’s absenteeism patterns, which could then be used to explore whether changes across time were associated with academic outcomes. This study was the first to apply LCGA to absenteeism patterns from pre-K to Grade 3, thus illuminating patterns of absenteeism that span the pre-K to kindergarten transition and the early elementary years. Moreover, from a practice and policy perspective, other than academic grades provided by teachers, few benchmarks—particularly at the state and district levels—exist for documenting children’s learning prior to Grade 3. If these patterns are correlated with later academic outcomes, school and district leaders may be able to use absenteeism to more quickly identify students who need intervention.
Methods
Data and Sample
Data for this study came from MA DESE. I linked several administrative data sets to address the research questions specified above: (a) the Student Information Management System (SIMS) data, (b) the Massachusetts Comprehensive Assessment System (MCAS) data, and (c) the publicly available school and district-level Profiles data reports. The SIMS data included child-level records of children enrolled in the MA public school system, including the school and district of enrollment, their attendance over the academic year across all grades (pre-K to Grade 3), and sociodemographic characteristics. The MCAS data included children’s statewide standardized achievement scores in Grade 3. Finally, the Profiles data included sociodemographic characteristics at the school and district levels across all academic years. These student and school records data were collected by the state as part of common recordkeeping and accountability requirements.
The analytic sample comprised three cohorts of children enrolled in district-provided public pre-K programs between the 2012–2013 and 2014–2015 academic years. A breakdown of the grade and year for each cohort is provided in Table 1. Although some children were enrolled in pre-K for more than one year (38%), I focused only on children’s absenteeism in the pre-K year directly preceding kindergarten. Across the three cohorts, 53,153 children were enrolled in public pre-K and transitioned to kindergarten in the subsequent year. Children were then excluded based on the following criteria: having an IEP in pre-K (n = 14,465, 27% of full sample), not being enrolled in a public school setting in pre-K (n = 458, 1% of full sample), and not being enrolled in a MA public school in Grade 3 (n = 3,594, 7% of full sample), yielding a total of 34,636 children who were included in analyses focused on describing children’s absenteeism patterns, sociodemographic characteristics, and educational experiences. I referred to this group as the “absenteeism patterns sample.” For analyses focused on associations with academic outcomes, an additional 1,442 children (3% of full sample) were excluded due to missing both English language arts (ELA) and math MCAS scores in Grade 3, yielding a total of 33,194 children enrolled in 978 schools in 318 districts in Grade 3; I referred to this group as the “MCAS analytic sample.” In general, children in each of these analytic samples looked similar in terms of sociodemographic characteristics to (a) children who were excluded from the analytic sample, except for child gender (boys are overrepresented among children with IEPs in pre-K) and (b) the children enrolled in Grade 3. See Table S1 for comparisons.
Analytic Sample by Cohort, Year, and Grade

Note. Some children may have been enrolled in 2 years of pre-K. Although this study did not incorporate the first year of pre-K in the absenteeism patterns, the first of these two pre-K years is noted in gray.
The final absenteeism patterns sample was racially and ethnically diverse (8% Asian, 11% Black, 22% Hispanic/Latinx, 56% White, and 3% Multiracial/Other) and reflected the overall composition of children enrolled in public schools in the state. Nearly half of the sample (49%) were boys, and one-third of children (31%) were economically disadvantaged. Additional descriptive characteristics of sample children are presented in Table 2.
Sample Descriptive Characteristics (N = 34,636)

Note. For the 2014–2015 school year, MA DESE changed the definition for the variable indicating economically disadvantaged status, which occurred in the middle of the study period. Therefore, data using the new definition of economically disadvantaged for the early grades in the first two cohorts are missing. To address this change, I constructed a new economically disadvantaged variable that averaged children’s economically disadvantaged status across years in which data were available. Averages were generated from 3 (Cohort 1, minimum), 4 (Cohort 2), and 5 years (Cohort 3, maximum) of data. ELA = English language arts; IEP = individualized education program; MA DESE = Massachusetts Department of Elementary and Secondary Education; MCAS = Massachusetts Comprehensive Assessment System.
Measures
Absenteeism
Absenteeism was measured as the percentage of days children were absent in each school year, and these data came from state-collected administrative records from the end of the school year. Absenteeism was calculated by dividing the number of days absent during the school year by the number of days they were enrolled. One advantage to using the percentage of days absent was that it accounted for the actual days enrolled, which could vary across children and districts.
Academic Outcomes
Academic outcome variables came from the English language arts (ELA) and math sections of the MCAS standardized achievement test. The MCAS is administered annually in the spring of each academic year. After completing assessments, children receive scaled scores for ELA and math, which range from 440 to 560. A score of 500 is the benchmark used to indicate whether students have met grade-level expectations. In the spring of 2018, 52% of students in Grade 3 statewide met or exceeded expectations on the ELA section, and 50% of Grade 3 students met or exceeded expectations on the math section of the MCAS (MA DESE, 2019a). In this study, I included ELA and math scores in Grade 3, which corresponded to the final year in the patterns of absenteeism and the first year that the MCAS tests were administered.
Covariates
For analyses predicting child academic outcomes, I included a set of child- and school-level covariates to account for potential confounding variables. Child-level covariates included gender, race/ethnicity, economically disadvantaged status (i.e., whether a child participated in state-administered programs, such as the Supplemental Nutrition Assistance Program, Temporary Assistance to Needy Families, foster care, and Medicaid, as defined by MA DESE), English language learner status in pre-K, IEP status in Grade 3, the number of school moves a child experienced between pre-K and Grade 3, an indicator for whether a child was enrolled in public pre-K program for 2 years (1 = enrolled for 2 years), and the type of school in which a child was enrolled (indicator for whether the school was only pre-K or connected to kindergarten and older grades). School-level covariates included the percentage of children who were economically disadvantaged and the percentage of children with IEPs in Grade 3.
Analytic Approach
To group children with similar patterns of absenteeism (Aim 1a), I used LCGA, a person-centered approach, which assumed that there was heterogeneity in patterns of absenteeism and grouped children with similar patterns into “classes.” As such, children within each class were assumed to have the same pattern, whereas children in different classes were assumed to have different patterns. Specifically, LCGA fixed the slope and intercept variances within each class to zero (i.e., assumed the same baseline and growth trajectory), which made the model computationally less intensive, supported model convergence, and increased interpretability (Jung & Wickrama, 2008).
To identify the final set of patterns, I followed the steps outlined in several LCGA papers (Berlin et al., 2014; Jung & Wickrama, 2008; Ram & Grimm, 2009). I first confirmed whether selecting the piecewise model as the functional form of the growth curves adequately fit the data. I chose to model an unconditional, single-pattern piecewise model with a knot at kindergarten: one estimated slope from pre-K to kindergarten and a second estimated slope from kindergarten to Grade 3. The knot at kindergarten was conceptually important due to observed differences between the pre-K and kindergarten years that may have contributed to differences in absenteeism (e.g., parental beliefs, attendance policies; Ehrlich et al., 2014; Katz et al., 2015; Susman-Stillman et al., 2018). Adequate model fit for the functional form of the model was determined based on the following statistical criteria: root mean squared error of approximation (RMSEA) ≦ .08, Comparative Fit Index (CFI) ≧ .90, and standardized root mean square residual (SRMR) ≦ .08 (Hu & Bentler, 1999; Kline, 2016). (I also tested the piecewise model against two alternative functional forms—the linear and quadratic models—to examine relative model fit.)
I then determined the number of patterns present in the sample by using LCGA with the following criteria (Masyn, 2013; Nylund et al., 2007): (a) model fit indices, including Akaike’s information criterion (AIC), Bayesian information criterion (BIC), and sample-adjusted BIC, with lower values representing better fit; (b) model testing using the Vuong-Lo-Mendell-Rubin likelihood ratio test (VLMR-LRT), with a significant VLMR-LRT (α < .05) suggesting better fit relative to the model with one fewer pattern and a non-significant VLMR (α > .05) suggesting no difference in overall fit; (c) model characteristics including entropy, with values closer to 1 being more desirable and indicating higher levels of separation among children into patterns; and (d) the theoretical relevance of the identified patterns. LCGA analyses were conducted in Mplus 8.1 (Muthén & Muthén, 1998) and employed a maximum likelihood estimator with robust standard errors. LCGA yielded estimated probabilities of membership for each child, and children’s assigned absenteeism pattern was the one in which they had the highest estimated probability of membership.
After identifying the model reflecting the optimal number of patterns, I then conducted descriptive analyses to explore how child-level sociodemographic characteristics and educational experiences varied across these patterns of absenteeism (Aim 1b). These variables are described in the covariates section above.
To examine whether children’s identified absenteeism patterns were associated with their academic outcomes in Grade 3 across the broader sample of children in the state (Aim 2), I used multilevel regression analyses with children nested within schools within districts based on Grade 3 enrollment. These multilevel analyses were conducted in Stata 17.0 (StataCorp, 2019). Specifically, I estimated two models predicting children’s ELA and math achievement outcomes in Grade 3 for child i in school j in district k:

Here,
Results
Descriptive Results
Children’s absenteeism was highest in pre-K (M = 5.81% of days in the school year, SD = 6.14; 18% of children who were chronically absent) and steadily declined until Grade 1 (M = 4.32%, SD = 3.70; 7% of children who were chronically absent), and then it remained steady through Grade 3. The average ELA and math scores for children met grade-level expectations (ELA: M = 503.99, SD = 20.41; math: M = 501.51, SD = 21.80). See Table 2 for additional descriptive statistics of the sample.
Aim 1a. Patterns of Absenteeism
First, I found that the unconditional, single-pattern piecewise model with a knot at the kindergarten year showed adequate model fit (RMSEA = .05, CFI = .99, SRMR = .02), suggesting that the piecewise model was an appropriate functional form to represent the data (see Table S2 for model fit statistics of the piecewise functional form as well as those of the linear and quadratic functional forms). Second, in comparing results from the LCGA two- to seven-class piecewise models, I determined that the six-class solution best fit the data for statistical and substantive reasons (see Table S3 for relative model fit statistics). Although reductions in the AIC, BIC, and SSABIC suggested diminishing returns after the four-class solution, the VLMR-LRT showed that the five-class solution had better model fit than the four-class solution (p < .001) and that the six-class solution had better model fit than the five-class solution (p < .001), suggesting the six-class solution’s superiority in model fit over the four-class solution. Moreover, the emergence of the two additional absenteeism patterns were conceptually relevant: one pattern showing moderately high levels of preschool absenteeism that subsequently declined in elementary school and a second pattern representing children who exhibited always high levels of absenteeism, or a particularly “risky” pattern. In particular, this “risky” pattern has emerged in prior studies of absenteeism (Benner & Wang, 2014; Schoeneberger, 2011; Simon et al., 2020) and is also a group of children who are highly relevant to policy and practice. Finally, the six-class solution’s entropy was also adequate at .94, which suggests high levels of separation among children into absenteeism patterns.
The final six absenteeism patterns are visualized in Figure 1. First, most children (n = 29,495, 85%) exhibited low levels of absenteeism from preschool to Grade 3 (Always low). Across all grades, children in this pattern were absent 5% of or fewer days in the academic year. The next two patterns exhibited similar patterns, wherein children were chronically absent in the preschool year, followed by a sharp drop and stable levels of absenteeism from kindergarten to Grade 3. Although both patterns included levels of absenteeism during the preschool year that exceeded the commonly used 10% threshold for chronic absenteeism, the High pre-K pattern (n = 2,697, 8% of sample) showed lower levels of absenteeism than did the Very high pre-K pattern (n = 658, 2% of sample; 16% vs. 31% of days absent). Children in the fourth pattern, Peak in K (n = 675, 2%), were characterized by a peak in absenteeism during the kindergarten year, and children in the fifth pattern, Rising (n = 812, 2%), had non-chronically absent levels of absenteeism in the preschool year but a steady rise through Grade 3. Children in the final pattern, Always high (n = 299, 1%), exhibited steadily declining although always high levels of absenteeism from preschool to Grade 3.
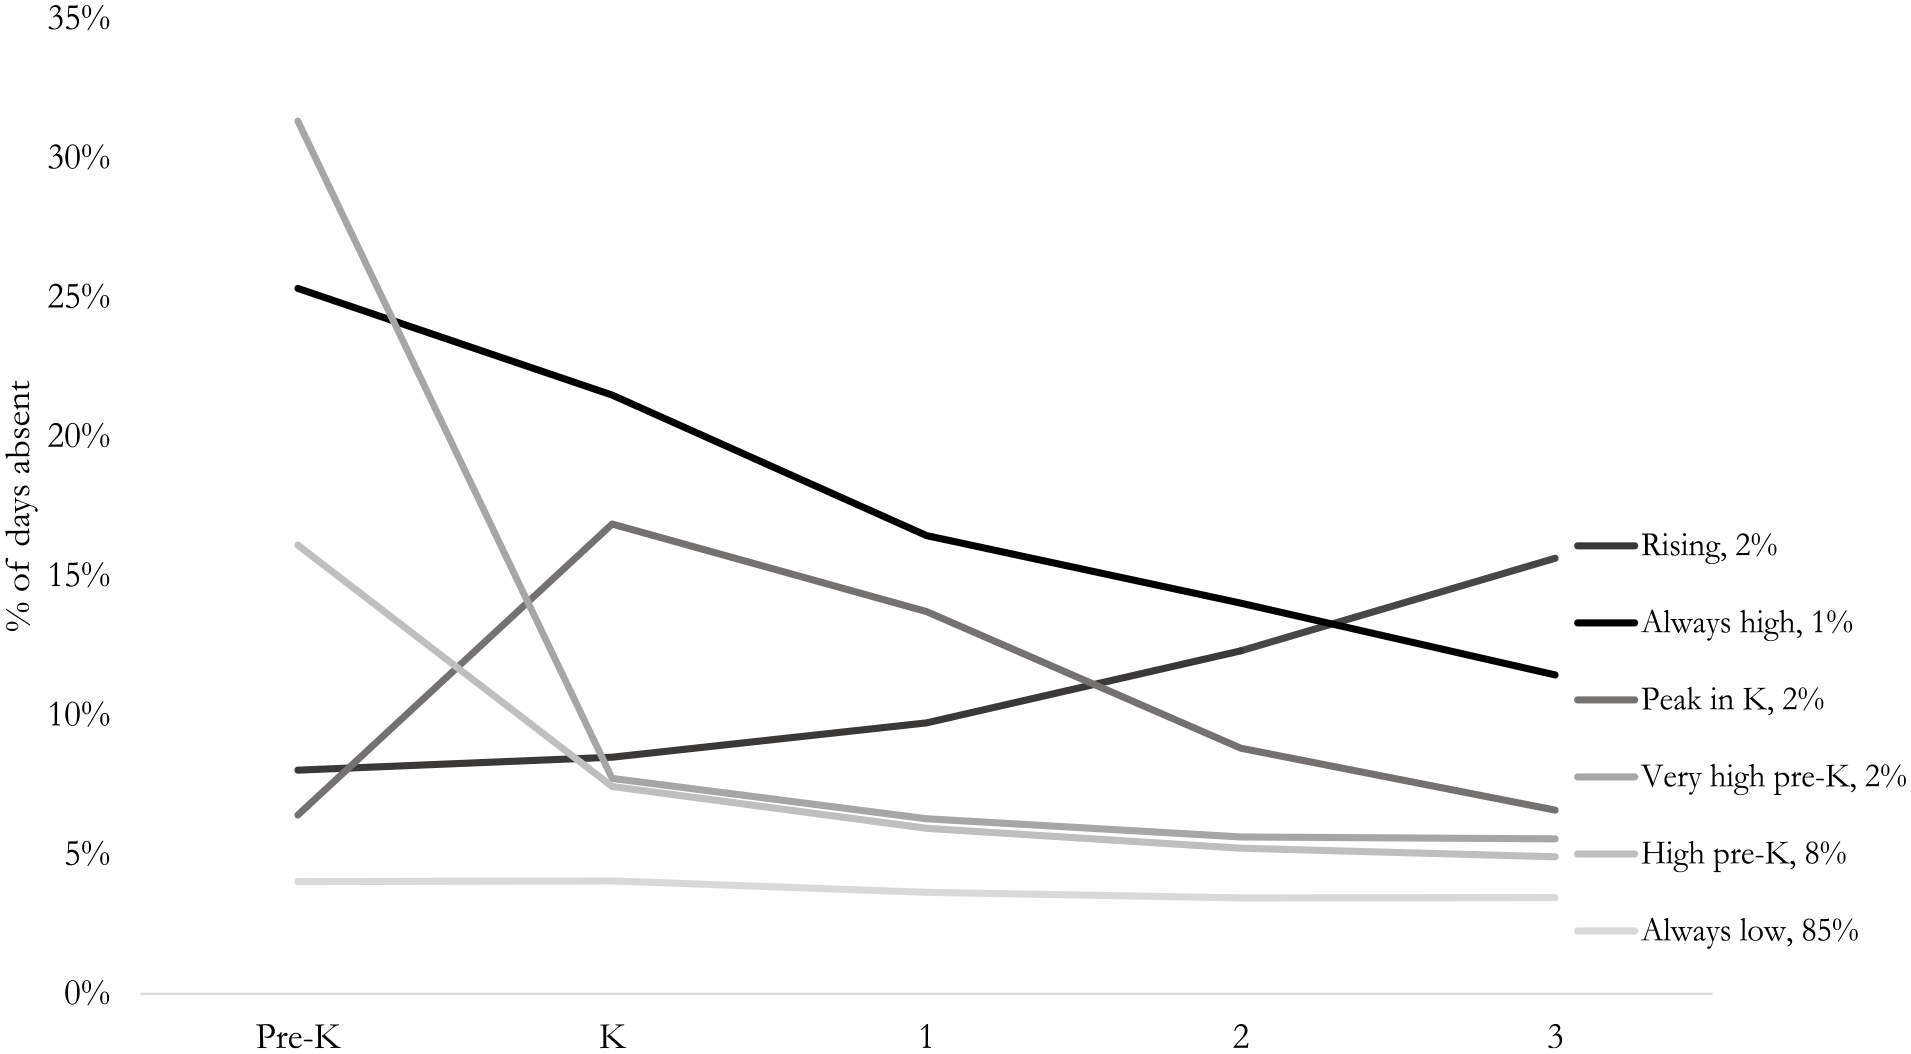
Absenteeism patterns from pre-K to Grade 3 (N = 34,636).
Aim 1b. Children’s Sociodemographic Characteristics and Educational Experiences by Absenteeism Pattern
Due to the large sample size, nearly all differences in sociodemographic characteristics and educational experiences across absenteeism patterns were statistically significant. In this section, I focus on substantively meaningful differences, which I considered to be a difference of 10 percentage points or more from the overall sociodemographic composition of the sample.
Regarding children’s sociodemographic characteristics, White children were far less likely to be in all non-low absenteeism patterns than expected (32%–47% in each pattern, compared to 57% in the full sample). Black children were overrepresented in Peak in K (21% in the pattern, compared to 11% in the full sample), and Hispanic/Latinx children were more likely to be in all non-low absenteeism patterns than expected (32%–49% in each pattern, compared to 22% in the full sample). No substantive differences by child gender emerged. Children who were economically disadvantaged were overrepresented in all non-low absenteeism patterns. Indeed, 50%–73% of children in each of the non-low absenteeism patterns were economically disadvantaged—a high number compared to the sample-wide percentage of 31%. Notably, 73% of children in the Always high pattern were economically disadvantaged. See Figure 2 for children’s sociodemographic characteristics by absenteeism pattern.

Sociodemographic characteristics of sample children by absenteeism pattern (N = 34,636).
Regarding children’s educational experiences, the percentage of children who were English learners was fairly similar across absenteeism patterns (10%–16% in each pattern). However, children with IEPs in Grade 3 were overrepresented in the Rising pattern (24% in the pattern, compared to 13% in the full sample), and children with 2 years of pre-K were generally underrepresented in the non-low absenteeism patterns (19%–32% in these patterns, compared to 38% in the full sample). Similarly, enrollment in a pre-K-only school was less likely to occur among children in the Always high pattern (6%) than expected in the sample (19%). See Table 2 for all comparisons of children’s educational experiences by absenteeism pattern.
Aim 2. Associations Between Absenteeism Patterns and Grade 3 Academic Outcomes
Figure 3 and Table S5 show results from multilevel regression analyses using children’s assignment to the different absenteeism patterns to predict children’s Grade 3 academic outcomes. Except for the difference in ELA scores between children in the Always low and Peak in K patterns, statistically significant differences in ELA and math scores emerged between children in the Always low and those in all other absenteeism patterns, with outcomes favoring children in the Always low pattern. Effect sizes for these differences in ELA outcomes ranged from 0.08 to 0.19 SDs, and those for math outcomes ranged from 0.11 to 0.35 SDs. Additionally, children in the High pre-K and Peak in K patterns outperformed those in the Rising pattern in ELA (d = 0.09 and 0.10 SDs, respectively), and children in the High pre-K, Very high pre-K, and Peak in K patterns had higher math scores than did children in the Rising and Always high patterns (range: 0.21–0.25 SDs).

Mean ELA and math scores by absenteeism pattern (N = 33,194).
The following four sensitivity analyses were conducted to test the robustness of associations between absenteeism patterns and academic outcomes. To account for the possibility of district- and school-level confounding, I reran predictive analyses, replacing (a) district random effects with district fixed effects to make comparisons of children within districts and (b) school and district random effects with school fixed effects to make comparisons of children within schools. Due to the possibility of endogeneity, I replicated predictive analyses with a model that included only time-invariant characteristics (e.g., gender, race/ethnicity), which were theoretically unlikely to have been affected by absenteeism. Given that some children without an IEP in pre-K received an IEP later in elementary school, I reran predictive analyses using a sample of children who never had an IEP across the five grades (n = 29,830). Results from all sensitivity analyses revealed findings consistent with the main results. Differences between mean outcomes across absenteeism patterns were more pronounced in the models including only time-invariant characteristics. See Table S6 for full results.
Discussion
Despite increased attention toward the prevalence and negative implications of pre-K absenteeism, little is known about how absenteeism changes from pre-K through the early elementary years, as well as whether and how these patterns matter for children’s outcomes. Using statewide administrative data from Massachusetts and person-centered approaches, I sought to address this gap by exploring heterogeneity in absenteeism from pre-K to Grade 3, examining which children were more likely to exhibit certain absenteeism patterns and then linking these patterns to children’s Grade 3 academic outcomes.
Identifying and Describing Patterns of Absenteeism From Pre-K to Grade 3
In the first aim, I explored whether discrete subgroups of children exhibited different patterns of absenteeism from pre-K to Grade 3 and found heterogeneity in children’s absenteeism. Despite not having compulsory attendance policies for pre-K, the vast majority of children (85%) exhibited Always low absenteeism (< 5% of days absent on average). The emergence of this pattern was consistent with findings from prior studies, where absenteeism levels in the corresponding absenteeism patterns were below 5% of the school year across all grades (Schoeneberger, 2011; Simon et al., 2020). However, the percentage of children exhibiting generally low absenteeism from pre-K to Grade 3 was more similar to that found in a study using a sample of children from the Southeastern urban school district (79%; Schoeneberger, 2011) than that found in a study using the nationally representative ECLS-K sample (46%; Simon et al., 2020). Also consistent with these prior studies, a small percentage of children (1%) exhibited Always high absenteeism (>20% of days absent on average) across all years. Collectively, these findings build on the body of literature showing that absenteeism is stable from pre-K to Grade 3 and suggest that these patterns may be shaped during the early grades for a substantial percentage of the population (Anderson & Romm, 2020; Dubay & Holla, 2016).
Despite a fairly low percentage of children in the other absenteeism patterns (14%), the absolute number of children exhibiting other patterns was still substantial given the use of statewide administrative data and cannot be ignored (n = 4,842). Specifically, 10% of the sample belonged to patterns where absenteeism was high in pre-K and exceeded the chronic absenteeism threshold and subsequently declined in kindergarten before leveling off through Grade 3 (High pre-K, Very high pre-K). The emergence of this absenteeism pattern is unique from those in prior studies (Schoeneberger, 2011; Simon et al., 2020) and highlights the importance of (a) including the pre-K year in research examining absenteeism over time and (b) using a piecewise model to allow for the discontinuity in absenteeism between pre-K and kindergarten. Although this study was unable to examine the mechanisms that could explain these sharp declines, explanations from qualitative research offer some ideas, such as differences in parental beliefs, logistics, and absenteeism policies between pre-K and K–3 settings that make it easier to get to school in older grades (Bauer et al., 2018; Ehrlich et al., 2014; Katz et al., 2015; Sugrue et al., 2016; Susman-Stillman et al., 2018). Finally, two other patterns made up the remaining 4% of children: Peak in K and Rising. Collectively, these findings highlight the value of using a person-centered approach to examine heterogeneity in children’s absenteeism over time. In particular, using this approach with longitudinal data revealed the divergent patterns of absenteeism over time for children who initially had more similar absenteeism in pre-K. These patterns might otherwise have been masked if point-in-time estimates were used (e.g., High pre-K versus Always high, Peak in K versus Rising).
I then examined whether absenteeism patterns varied by sociodemographic characteristics and educational experiences. Similar to findings in prior research, children of color and from low-income households were more likely to be in the non-low absenteeism patterns (Dubay & Holla, 2015; Ehrlich et al., 2018; Gee, 2018, 2019; Gottfried & Gee, 2017; Morrissey et al., 2014; Susman-Stillman et al., 2018). However, the majority of children (74%) who were identified as economically disadvantaged in this sample actually exhibited low absenteeism; this finding was also true for Hispanic/Latinx (77%) children. This finding calls for a need to move beyond examining only sociodemographic characteristics or educational experiences as explanations for child absences. A focus on these characteristics may advance current understandings of who is more likely to be absent but is insufficient for knowing how to address the specific barriers for regular school attendance or contextualizing changes in absenteeism over time.
Associations Between Absenteeism Patterns and Children’s Academic Outcomes
ELA and math scores were highest for children who exhibited Always low absenteeism across all years. These findings were consistent with those from the nationally representative ECLS-K study (Simon et al., 2020) and suggest the benefits of regular school attendance across all grades—including pre-K. Although fewer differences emerged among ELA scores, differences in math scores were more prominent, with children who had Rising and Always high absenteeism across all years earning the lowest math scores. This result was consistent with those in one southeastern U.S. district (Schoeneberger, 2011), which found that children whose absenteeism rose over time and those whose absenteeism was always high had similarly high dropout rates (25% and 21%, respectively). In conjunction with findings that children of color and those who are economically disadvantaged are more likely to be in the non-low absenteeism patterns, these findings provide evidence for the role absenteeism plays in opportunity gaps between racial/ethnic groups and between children from high- and low-income households (Reardon & Portilla, 2016).
Moreover, the associations between absenteeism patterns and math outcomes tend to be stronger and more pronounced than those with ELA outcomes. This finding has been consistent with studies examining ELA and math outcomes for elementary school-aged children (Ansari & Gottfried, 2021; Ansari & Pianta, 2019; Gottfried, 2009, 2011, 2014; Gottfried & Kirksey, 2017). These findings suggest that school contexts may be a particularly critical setting for children’s exposure to math instruction and supporting early math skill development, whereas other settings (e.g., home, community resources like libraries) are more adequate for supporting language and literacy skills. For example, advocacy efforts and research that promote reading and use of varied language at home, such as the Thirty Million Words Initiative (Suskind, 2015), may have contributed to increases in exposure to books and reading at home over time (Bassok et al., 2016). The higher levels of enriched language in home environments could be responsible for offsetting part of the negative implications of missing school on children’s ELA skills. Indeed, one study has documented how enriching household contexts may offset the negative consequences of absenteeism for children’s literacy but not math skills (Wei, 2022).
These results underscore the need for research that considers absenteeism across multiple years and its associations with academic outcomes rather than testing associations between pre-K absenteeism and academic outcomes a few grades later. This emphasis was particularly relevant for math outcomes, but similar trends were observed for ELA outcomes. Specifically, although children in the High pre-K and Always high absenteeism patterns exhibited extremely high absenteeism early on, children in the High pre-K and Very high pre-K patterns whose absenteeism subsequently declined performed better in math in Grade 3 than did those in the Always high pattern. Similarly, despite exhibiting similar absenteeism rates in pre-K, children in the Peak in K pattern performed better in math than did those in the Rising pattern. A focus on only the pre-K year would have obscured these divergent paths and may have misidentified some children who were at greater risk than others.
Results from testing associations between absenteeism patterns and children’s academic outcomes also suggest the role that more proximal absenteeism plays in children’s performance on point-in-time academic assessments (Ansari & Pianta, 2019; Ehrlich et al., 2018)—that recent absenteeism may be more detrimental for learning than chronic absenteeism further in the past. Specifically, children’s absenteeism in Grade 3 was predictive of their math outcomes in the same grade. Despite having very different absenteeism from pre-K to Grade 1, children in the High pre-K and Peak in K patterns had more similar absenteeism in Grades 2 and 3 and, subsequently, similar mean outcomes in math in Grade 3. Nevertheless, it is possible that unobserved factors contributed to absenteeism and poorer academic outcomes; further research is necessary to directly address questions related to the timing of absenteeism and its associations with academic outcomes.
Although these results suggest that examining only Grade 3 absenteeism and outcomes would be sufficient for predictive purposes for academic outcomes in the same year, these findings show that absenteeism patterns were generally similar from year to year or steadily trended in one direction (i.e., rising, falling) following either pre-K or kindergarten. As such, examining absenteeism starting as early as the pre-K year and across multiple years is important for identification and intervention before the end of Grade 3, the first year of statewide benchmarks of academic performance. One practical implication from these findings is to work toward developing systems that also include the pre-K year to support the identification of children who are (a) frequently absent from as early as the kindergarten year (e.g., chronically absent for 2 years) or (b) experiencing rising absenteeism across the early years. For example, including a chronic absenteeism marker could support the identification of children in the Always high absenteeism pattern, and including a marker of year-over-year change in absenteeism could support the identification of children in the Rising absenteeism pattern. In doing so, programs and schools could identify children as early as possible and work with children and families to understand and reduce barriers to regular school attendance.
Limitations and Future Directions
Although this study had numerous strengths, it also had limitations and presents opportunities for future research. First, despite the use of control covariates and fixed effects in robustness checks to reduce the possibility of confounding variables, causal inferences could not be drawn in the absence of an experimental or quasi-experimental research design. The covariates used in the study were limited in scope and did not capture children’s experiences that may have been more directly relevant to absenteeism. Moreover, selection bias was an issue because many factors that were related to absenteeism may have also been related to children’s academic outcomes. For example, children in the Always low absenteeism pattern may have come from households that experienced fewer barriers to attendance on average (e.g., household stability), which may also have been related to their academic outcomes. Future research that can estimate associations between patterns and outcomes by using a causal approach is needed.
Second, although this study used data from a larger geographic area than did prior studies of pre-K absenteeism, the sample comprised children without IEPs enrolled in pre-K programs within the public school system. It is unclear whether these findings would generalize to children with IEPs, those enrolled in other types of pre-K settings in Massachusetts, or those in public pre-K settings in other states. For example, the study sample had a higher proportion of Hispanic/Latinx and economically disadvantaged children than pre-K-aged children statewide (Jones et al., 2020). Future research should consider replicating this study with different subpopulations of children, such as those with IEPs, children in a wider range of early care and education programs, and children in other states.
Third, one challenge in conducting absenteeism research has been identifying a data set that provides (a) rich contextual data on children’s experiences (e.g., housing, health, daily routines) and outcomes and (b) accurate attendance data. In the present study, the administrative data used did not capture such information as whether children were enrolled in part-time versus full-time pre-K, why children were absent, or whether absences were excused or unexcused—thereby limiting the extent to which changes in absenteeism over time could be contextualized or understanding why specific patterns were associated with varying academic outcomes. Additional research should seek to find ways to merge these contextual data (e.g., reasons for missing school, excused or unexcused absences, health/illness, access to transportation, parent beliefs, barriers to attendance) to school administrative records and conduct qualitative studies to provide deeper insight on the mechanisms underlying different patterns of absenteeism. For example, further research on why some children’s absenteeism may be increasing across the earlier grades is needed.
Fourth, it is possible that the LCGA’s constraints on slope and intercept variances produced more classes than in the sample. For example, in a less constrained model, it is possible that the High pre-K and Very high pre-K children would have been combined into a single class, given differences only in their initial baseline levels of absenteeism but similar overall shape. Future research should seek to replicate this study with more flexible modeling approaches that do not constrain these variables, such as growth mixture modeling. 1
Finally, this study demonstrated how the shape of absenteeism patterns was related to academic outcomes in Grade 3. It did not illuminate how absences in one year related to academic outcomes in that same year and how these associations may have accumulated over time. Although one recent study has found that absences matter for gains in learning outcomes every year of elementary school and that cumulative effects exist (Ansari & Gottfried, 2021), no study has examined these cumulative effects including the pre-K year. This study also did not capture social-emotional outcomes, which have been shown to be related to absenteeism in the pre-K and early elementary school periods (Fuhs et al., 2018; Gottfried, 2014; Gottfried & Ansari, 2021). Given these limitations, future research should consider the short- and long-term outcomes in multiple developmental domains when studying absenteeism longitudinally.
Conclusions
The results of the present study illuminated the heterogeneity in children’s absenteeism from pre-K to Grade 3 and how this heterogeneity matters for children’s academic outcomes. Specifically, one positive finding was that the vast majority of children demonstrated low absenteeism across all grades, beginning in pre-K, and that only a small percentage of children demonstrated consistently high absenteeism across all years. At the same time, four of the six absenteeism patterns showed variation in absenteeism rates over time. In other words, for some children, absenteeism changed, sometimes drastically, from pre-K to Grade 3, and chronic absenteeism in one year did not necessarily mean that the student would be chronically absent again the next year. Nonetheless, patterns of absenteeism show potential as an early indicator for targeting interventions to children who are at greatest risk for poor academic outcomes by Grade 3. Finally, these findings also shed light on the need for future research that better contextualizes the changes in absenteeism over time and differentiates between children who exhibit one pattern over another.
Supplemental Material
sj-docx-1-ero-10.1177_23328584241228212 – Supplemental material for Exploring Patterns of Absenteeism from Prekindergarten Through Early Elementary School and Their Associations With Children’s Academic Outcomes
Supplemental material, sj-docx-1-ero-10.1177_23328584241228212 for Exploring Patterns of Absenteeism from Prekindergarten Through Early Elementary School and Their Associations With Children’s Academic Outcomes by Wendy Wei in AERA Open
Footnotes
Acknowledgements
I thank the Massachusetts Department of Elementary and Secondary Education for providing the administrative data for this study and Dana McCoy, Stephanie Jones, and Carrie Conaway for their feedback on earlier drafts of this manuscript.
Declaration of Conflicting Interests
The author declared no potential conflicts of interest with respect to the research, authorship, and/or publication of this article.
Funding
The author disclosed receipt of the following financial support for the research, authorship, and/or publication of this article: This research was conducted with support from the Institute of Education Sciences (IES), U.S. Department of Education (R305B150010). The opinions expressed are those of the author and do not represent the view of IES or the U.S. Department of Education.
Open Practices Statement
The student-level data are not publicly available due to provisions in the data-sharing agreement with the Massachusetts Department of Elementary and Secondary Education. The programming files that support the findings of this study are available online with the supplemental materials.
Notes
Author
WENDY WEI is a researcher at Abt Associates, 10 Fawcett Street, Cambridge, MA 02138; email:
References
Supplementary Material
Please find the following supplemental material available below.
For Open Access articles published under a Creative Commons License, all supplemental material carries the same license as the article it is associated with.
For non-Open Access articles published, all supplemental material carries a non-exclusive license, and permission requests for re-use of supplemental material or any part of supplemental material shall be sent directly to the copyright owner as specified in the copyright notice associated with the article.