
Abstract
Leveraging achievement data measured in the fall and spring of kindergarten through eighth grade for 840,000 students attending 8,800 public schools, we report novel evidence on how achievement and growth patterns differ between rural and nonrural schools. Rural students start kindergarten slightly ahead of nonrural students but fall behind by middle school. The divergence is driven by larger summer losses for rural students. In both rural and nonrural schools, we provide additional evidence that Black–White achievement gaps widen during the school year. These findings highlight the importance of seasonal learning patterns in interpreting rural school performance.
Approximately one in five students in the United States attend schools in a rural locale (National Center for Education Statistics [NCES], 2018). Furthermore, more than half of all operating regular school districts and about one third of all public schools are in rural areas, which means that a large proportion of the country’s educational infrastructure serves rural students. However, the needs of rural schools and students are often overlooked by education policy because rural students are geographically dispersed across their state and the nation, making it difficult to target and effectively change their learning circumstances. Many rural school districts are very small, with a median enrollment of under 500 students. The majority of rural students attend school in a state where they make up less than 25% (in some cases, less than 15%) of overall enrollment (Showalter et al., 2019). Rural schools are diverse in terms of demographics, resources, and student needs (Greenough & Nelson, 2015; Strange, 2011) and represent contexts with unique challenges and opportunities relative to schools that are not rural (see Arnold et al., 2005 for a review). Aspects of this unique context almost certainly affect academic skills among students attending rural schools, likely in both positive and negative ways.
Relative to other locales, rural students, schools, and communities have unique challenges that may deflate academic achievement and growth. For example, students in rural locations often travel considerable distances to get to school, contributing to fatigue and reduced learning time. Furthermore, the costs of operating those transportation systems can affect school/district budgets, oftentimes draining resources (Arnold et al., 2005). The remoteness of many schools can also create real difficulties for recruitment and retention of teachers, which could suggest that teacher quality is lower among rural schools (Arnold et al., 2005; Lee & McIntire, 2000). Among teachers who do get hired and stay, professional training is less abundant, and thus, teachers in rural schools tend to be less credentialed, further raising questions about teacher quality (Lee & McIntire, 2000). These teacher labor supply issues, including shortages, can also affect students’ access to curriculum. For instance, there is evidence that advanced coursework is much less abundant in rural schools, including reduced access to algebra in middle school to advanced math courses in high school (Anderson & Chang, 2011; Lee & McIntire, 2000). Course offerings are also hampered by a lack of resources. In general, rural schools often lack the facilities, infrastructure for operation and maintenance, course materials, and educational programs that typify larger districts (Lee & McIntire, 2000). This is partly due to limited access to funding. Some federal and state formulas distribute funds based on enrollment or concentration of low-income students, which can put rural districts at a disadvantage (Brenner, 2016; Showalter et al., 2019). While such issues are specific to schooling, students in rural locations can also be affected by challenges outside of school, including fewer cultural resources such as libraries and museums (Miller et al., 2019) and potentially greater exposure to the effects of the opioid pandemic (Rigg et al., 2018; Showalter et al., 2019).
Yet there are also certain advantages from which rural students, schools, and communities likely benefit that could positively affect achievement. For example, research indicates that smaller, rural communities are often tight-knit, which could mean that educators have closer relationships with students and their families, leading to a better understanding of individual learning needs (DeYoung, 1987; Mid-continent Regional Educational Laboratory [McREL], 1990). In general, evidence suggests that there tends to be a supportive ethos in smaller communities and their smaller schools (Stern, 1994). Given that school bears institutional and economic importance to the community, school programs and activities have high visibility within the community and generate multigenerational involvement (Azano & Biddle, 2019). Relatedly, researchers have found that effective schools tend to have a strong collective identity and that rural schools often have a consistent and clearly defined identity conducive to effective teaching and learning (Lee et al., 1993; Louis & Kruse, 1995). In terms of environmental factors that affect learning, evidence from NCES indicates that schools in rural locales are often safer and less affected by violence than schools in urban centers (Rampey et al., 2009).
As a result of the Every Student Succeeds Act (ESSA, 2015), attention has shifted toward ensuring rural students are receiving high-quality learning experiences in their schools. To do so, we need to understand the status of achievement and learning in rural schools; however, knowledge in that area is limited. The limited nature of the data and analyses on this topic occurs in part because evaluation and intervention studies often take place in large urban districts, and the vast majority of published research does not report heterogeneity by geographic locale (Thier & Beach, 2019). Virtually everything we know about achievement in rural locales comes from a handful of journal articles that are more than a decade old and policy reports that rely on simple summary statistics (e.g., NCES, 2014; Provasnik et al., 2007). One reason why we do not know more is that data sets focusing on rural schools are often unavailable or limited (e.g., they only include a single state). The only exceptions are data from the National Assessment of Educational Progress (NAEP) and the Stanford Education Data Archive (SEDA), which are both cross-sectional. These limitations in the available data do not allow the study of within-student growth over time or seasonal analysis of learning that distinguish academic years from summers.
Without longitudinal data, little is known about how students in rural schools grow academically during elementary and middle school. Our lack of information on growth has at least two implications relevant to supporting and funding rural schools. First, no evidence of which we are aware shows how summer learning loss affects students in rural schools. Considerable research has highlighted seasonal patterns of learning, with gains during the school year followed by flattening or dropping of test scores over the course of summer breaks (e.g., von Hippel & Hamrock, 2019). One could certainly imagine summer loss affecting rural locales differentially relative to urban and suburban locales. On one hand, the lack of teaching and programmatic resources in rural schools and limited access to cultural resources (e.g., libraries, zoos, and museums) could mean that fewer academic options are available to students during the summer, leading to greater learning loss. On the other hand, tight-knit rural communities may provide better supports for students during the summer, and agricultural activities could contribute to the development of academic skills related to subjects like math. Yet, to date, summer loss has not been examined in rural schools.
Second, growth over time, including summer loss, can affect race-based achievement gaps, especially whether they narrow or widen as students move through school (Kuhfeld et al., 2021). Currently, few studies examine how achievement develops differentially by race in rural communities. Though unstudied, one might hypothesize that all the academic challenges and opportunities that characterize rural schools affect students differentially by race. Furthermore, evidence suggests that segregation is at least as substantial in rural communities as in metropolitan communities (Lichter et al., 2007; Showalter et al., 2019) and that racial discrimination may be different by locale and more variable in rural locations (Lichter, 2012). These societal factors that extend beyond schooling could affect rural students’ opportunities to learn. Current literature on rural education generally provides little evidence on gaps. Furthermore, given that most existent studies are not longitudinal in nature and do not include multiple time points within a year, they cannot speak to how achievement gaps develop in rural locales. Understanding the development of gaps can be essential to reducing them.
Our own study substantially expands the limited current literature on academic achievement and growth in rural schools. The intent of the study is to provide a descriptive overview of academic achievement and growth among rural schools that can be used by educators and policymakers to understand the potential needs of such schools, including how sources of educational inequality compare with those sources among all U.S. schools. Our unique data set includes achievement measured at up to 12 time points for each of about 840,000 students in 8,798 public schools across the United States, including 180,000 students attending 2,377 rural schools. We report novel evidence on how achievement patterns between kindergarten and eighth grade differ between rural and nonrural public schools nationwide, including the first growth estimates for school years and summers. Our research questions are
How does achievement compare between rural and nonrural schools in each grade between kindergarten and eighth grade?
How do school year and summer growth rates compare between rural and nonrural schools?
Are achievement gaps between minoritized (Black or Hispanic) students and White students similar between rural and nonrural schools, and how do those gaps develop during school years and summers?
Schools and Achievement in Rural America
There is not much peer-reviewed research on achievement in rural schools across the United States. One exception to this pattern is a small body of early research that explored rural student achievement with cross-state NAEP scores (see Howley & Gunn, 2003 for a review). For example, studies by Lee and McIntire (1999, 2000) used 1992 and 1996 NAEP scores and found that rural schools outperformed nonrural schools in math, but there was substantial variation by state. Based on teacher surveys, the authors attributed rural schools’ higher performance to better teacher training and school climate but pointed out that rural instructional conditions and curricular rigor needed improvement. Using test scores from 2003–2004, Provasnik et al. (2007) also found that a larger percentage of rural public school students scored at or above the proficient level on reading, math, and science compared with city public school students (Provasnik et al., 2007).
Though few recent peer-reviewed publications have taken up the topic of rural achievement, several policy reports have made use of NAEP data for that purpose. For example, a report by the Rural School and Community Trust (Showalter et al., 2019) found that, although rural students outperformed nonrural students on NAEP, achievement was highly variable such that achievement favored nonrural students in several states. The authors of that report (Showalter et al., 2019) highlighted inconsistencies in funding formulas for rural schools across states as a possible contributor to that variability and pointed out that socioeconomic achievement gaps in rural locales were large. NCES also produces reports (e.g., NCES, 2014) on rural education in America that break down NAEP scores by school locale. According to those studies, in fourth-grade reading, 35.6% of students in rural locales were deemed proficient on the 2015 NAEP compared with 34.8% overall. In eighth grade, the same numbers were 32.2% in rural schools and 32.7% overall. Similarly, in mathematics, rural and overall percentages of students deemed proficient differed by less than a percentage point, with 39.7% of rural fourth graders above proficient and 31.4% of rural eighth graders above proficient.
These studies using NAEP data provided insights into rural student achievement but faced limitations. Most important, NAEP was designed to provide national- and state-level inferences about student performance in a set of subjects for students in the fourth, eighth, and 12th grade. By design, NAEP results cannot provide insights on the critical issues of (a) academic growth and (b) achievement for students of ages not assessed by NAEP. In short, one cannot say much about rural achievement beyond aggregate proficiency rates at select time points and for select grades using NAEP, and few analyses of the NAEP data have been performed beyond reporting those proficiency rates.
Like NAEP, SEDA disaggregated data by locale. For example, SEDA data showed that students in rural schools were performing at a higher grade level (5.29) in fifth grade than students in nonrural schools (4.84; Reardon et al., 2021). The school grade slope of mean test-based achievement empirical Bayes estimates in these data (which SEDA refers to as “learning rates”) was not significantly different across rural and nonrural schools. But even these estimates are based on cross-sectional data and do not distinguish between academic year and summer learning.
Academic Growth
The near total absence of evidence on growth in achievement among students attending rural schools is an especially large blind spot in our understanding of rural education. Academic growth among rural students is important for several reasons, including that students’ academic trajectories are less reflective of underlying socioeconomic inequalities and more under a school or district’s control than students’ achievement at a point in time (Atteberry & McEachin, 2020; Reardon, 2019). To the best of our knowledge, only a report by Graham and Provost (2012) explored math achievement trajectories for rural schools and compared them with schools in other locales. They used data from the Early Childhood Longitudinal Study, Kindergarten Cohort (ECLS-K) and projected trajectories from kindergarten to eighth grade by race/ethnicity, school locale, and geographical region. The report stated that achievement differences of rural, urban, and suburban students differed by race/ethnicity. Furthermore, they showed that growth estimates for rural students were lower than for urban and suburban students for nearly all racial/ethnic subgroups.
However, this study was limited in both the grades it was able to examine (spring achievement was measured every couple of years in the later grades), and in that it did not provide evidence of whether there were statistically significant differences among locales for racial/ethnic gaps in achievement levels or projected trajectories.
No studies of which we are aware used data that allow for unpacking how gaps (both rural vs. nonrural and by student subgroup) may form during the school year versus summer break. These so-called seasonal comparison designs (Downey & Condron, 2016) can help isolate how rural schools contribute to or ameliorate inequalities in students’ educational outcomes.
Studies using national seasonal data, including ECLS-K and the NWEA MAP Growth data, have found that student learning slows or declines during the summer, though there are discrepancies across studies in the magnitude of drops (Kuhfeld et al., 2021; von Hippel & Hamrock, 2019). However, there are still some consistent patterns across data sets. Achievement gaps by socioeconomic status appear to widen during the summer, whereas gaps between White and Black students appear to primarily widen during the school year (von Hippel & Hamrock, 2019). If these patterns hold true in rural schools is yet to be seen.
Heterogeneity in Achievement and Growth by Remoteness
There are certainly commonalities among rural schools that warrant examining their overall performance, just as there is merit in examining the performance of urban schools. For example, rural schools share assets that include strong family involvement and close partnerships with local churches, businesses, and the broader community, as well as a clear value of place that informs curriculum and pedagogy (Hargreaves et al., 2015). Furthermore, the needs of students and staff in rural schools are uniquely affected by geographic isolation and limited access to educational materials, staff resources, and/or student and family support services (Johnson, 2009). However, there is also evidence of diversity within the rural locale, especially in terms of how remote schools are, which can affect provision of resources and economies of scale (Greenough & Nelson, 2015). For instance, rural schools closest to urbanized areas tend to have enrollment sizes, poverty rates, and eighth grade math course access and math proficiency rates similar to suburban schools, while the most remote rural schools have much smaller enrollment, higher poverty rates, and lower levels of advanced math access and proficiency rates. In this section, we try to cover what is already known about achievement disaggregated by remoteness while noting that the literature is sparse.
Using NCES designations, “Rural-Fringe” schools, which are closest to urbanized areas, have the highest percentage of students meeting NAEP proficiency thresholds (NCES, 2014). NAEP data show that compared with rural schools closer to urbanized areas (i.e., schools categorized as Rural-Fringe and Rural-Distant), the most remote schools (i.e., Rural-Remote) had the lowest percentage of students who were at or above proficient across grades and subjects (NCES, 2014). For example, for fourth-grade reading, 38% of students in rural schools closest to urbanized areas were at or above proficiency, compared with only 29% of students farthest from urbanized areas; for fourth-grade math, the corresponding percentages are 43% and 35%.
There are several possible explanations for such findings. For one, these Rural-Fringe schools tend to have lower poverty rates, higher percentages of students of color, and larger total enrollment compared with more remote schools (Greenough & Nelson, 2015). Furthermore, as discussed previously, remote schools tend to face greater challenges related to transportation, recruitment/retention and training of teachers, and building economies of scale more generally (e.g., Lee & McIntire, 2000). Though heterogeneity in academic growth by remoteness has not yet been studied, one might expect these factors that affect achievement to also affect how fast students grow in mathematics and reading.
Data
Data for this study come from the NWEA Growth Research Database (GRD), which includes achievement data for about 20% of schools across the nation. School districts and schools choose to administer MAP Growth assessments for a variety of reasons, including monitoring student achievement and growth, school accountability, and teacher evaluation. While the GRD includes private and international schools, we focus only on U.S. public schools in this study. Additionally, we exclude schools in U.S. territories and schools that enrolled fewer than 10 students between Grades K and 8. The resulting sample contains 8,798 public schools out of the population of 74,080 schools serving K–8.
The NCES Common Core of Data includes 12 codes for locale (City-Large, City-Medium, City-Small, Suburb-Large, Suburb-Medium, Suburb-Small, Town-Fringe, Town-Distant, Town-Remote, Rural-Fringe, Rural-Distant, Rural-Remote). We flag schools as rural if they have any of the last three codes (Rural-Fringe, Rural-Distant, and Rural-Remote) and refer to these schools as “rural schools” and all other schools as “nonrural schools.” Within the rural locale, Rural-Fringe is closest to an urbanized area (within 5 miles), Rural-Distant is farther (between 5 and 25 miles), and Rural-Remote is the farthest from an urbanized area (25–50 miles).
We compare rural schools with the pooled group of nonrural schools without distinguishing city, suburb, or town for theoretical and empirical reasons. First, rural schools are the primary interest of this article, and contrasts between other locales is beyond its scope. Second, rural schools in our data are distinct in terms of student demographics and enrollment size, while city, suburb, and town schools are similar to one another. Third, the urban–rural dichotomy, in particular, has been suggested by extant literature to be counterproductive, as the needs of city and rural schools in confronting challenges are distinct (Azano & Biddle, 2019; Greenough & Nelson, 2015; Johnson, 2009). As a sensitivity check, we conduct our analyses separately for the three nonrural locales and report the findings in Supplemental Appendix E (available in the online version of this article).
A comparison of summary statistics of public schools in our sample and the population of public schools in NCES Common Core of Data (NCES, 2017) is presented in Table 1. Schools in the overall sample served a lower percentage of Hispanic students (18% vs. 23%), a higher percentage of White students (57% vs. 53%), and a lower percentage of free or reduced-price lunch (FRPL)–eligible students (51% vs. 55%) than all public schools in the nation. Compared with the population, a higher percentage of schools in the sample are in the Midwest (46% vs. 25%), and a lower percentage are from the Northeast, South, or West. Rural schools in the sample serve a slightly higher percentage of White (77% vs. 75%) and lower percentages of Hispanic (8% vs. 11%) and FRPL-eligible (51% vs. 53%) students than the population of rural schools in the United States. A higher percentage of rural schools in the sample are in the Midwest (41% vs. 32%) or West (19% vs. 17%), and a lower percentage are in the South (27% vs. 39%). As these statistics indicate, the sample is not nationally representative, and the findings should be interpreted with this consideration.
Schools in the Sample Versus Population of Public Schools Serving Grades K–8

Note. Population includes operational public schools in 2015–2016 NCES Common Core of Data that enrolled at least 10 students in Grades K to 8 in the 50 U.S. states and District of Columbia. Midwest, North, South, and West refer to regions in the United States. Enrollment reports the average total enrollment in the school. N = number of schools; FRPL = free or reduced-price lunch.
We use student-level assessment data from school years 2013–2014 to 2018–2019 and follow two cohorts of students for this study: one cohort from kindergarten to fifth grade (about 300,000 students), and the other from third to eighth grade (about 540,000 students). Students are included in the sample if they were assessed in fall 2013 in either kindergarten or third grade. 1 The demographic composition of the rural and nonrural students in the sample are in Table 2a and 2b. Approximately 71% of rural students were White, 7% Black, 2% Asian, 7% Hispanic, and 51% male. In comparison, 51% of nonrural students were White, 15% Black, 5% Asian, 16% Hispanic, and 51% male. The GRD does not have a student-level measure of socioeconomic status, and so we are unable to compare the socioeconomic characteristics of students in our sample with public school students in the nation.
Sample Summary Statistics (Math)

Note. Sample includes all students who had test scores in Fall 2013. Starting RIT is RIT in fall of kindergarten for the K–5 cohort and RIT in fall of third grade in the Grades 3–8 cohort. Midwest, North, South, and West refer to regions in the United States. RIT = Rasch unIT score; FRPL = free or reduced-price lunch; N = number of unique students.
Sample Summary Statistics (Reading)

Note. Sample includes all students who had test scores in fall 2013. Starting RIT is RIT in fall of kindergarten for the K–5 cohort and RIT in fall of third grade in the Grades 3–8 cohort. RIT = Rasch unIT score; FRPL = free or reduced-price lunch; N = number of unique students. Midwest, North, South, and West refer to regions in the United States.
Supplemental Appendix Tables A1 and A2 (available in the online version of this article) report the number of students with test scores at each time point and the total number of time points with available test scores per student. About 70% of the students in the sample had test scores for seven or more time points, and about 30% of the students had test scores for all 12 time points (fall, winter, and spring of six total grade levels). We use data for all students in the sample for the main analysis but check the sensitivity of our findings restricted to the subsample of students who had scores for all 12 time points (see Supplemental Appendix Figure D2 and Tables D3 and D4).
Achievement Measures
Students were assessed using the MAP Growth assessments in math and reading up to three times (fall, winter, and spring) during the school year. We focus on just the fall and spring assessments in this study. The MAP Growth assessments are computerized, adaptive tests that are aligned to state content standards. Each test takes approximately 40 to 60 minutes to administer. Achievement scores are reported on the Rasch unIT (RIT) scale, where RIT is a linear transformation of the logit scale units of the Rasch item response theory model. The assessment is vertically scaled to allow for the analysis of growth within and across grades. We report fall and spring mean test scores for six consecutive years (Grades K–5 or Grades 3–8) for each student.
Analysis
Question 1. Rural Versus Nonrural Achievement
To answer Question 1, we report the mean achievement level of students at each grade and time point (e.g., kindergarten fall, kindergarten spring). These scores are plotted to show average achievement across grades levels for students in rural and nonrural schools using both original RIT scores and standardized gaps. We first calculate the RIT score mean, standard deviation (SD), and sample size (N) by grade/term/subject/cohort separately for rural and nonrural students. The mean and SD estimates are reported in the Supplemental Appendix Table C1.
We calculate the standardized mean difference (d) between rural and nonrural students within a cohort/subject/grade/term as

where

Question 2. Rural Versus Nonrural Growth Rates in School Year and Summer
To answer Question 2, we estimate growth separately for rural and nonrural students using a multilevel piecewise model that is widely applied with interim assessment data (e.g., Downey et al., 2004; Downey et al., 2008; Kuhfeld et al., 2021; von Hippel et al., 2018). An important advantage of the piecewise multilevel model is its ability to allow for separate growth terms for school year and summer (e.g., Quinn et al., 2016) and account for variation in test administration dates within the school year. In terms of the latter, students were not tested on the first and last days of school each year; even within a school, students’ test dates varied depending on the availability of electronic devices used for testing. Thus, exposure to school in each grade and each summer on the test day varied for students. The model accounts for variations in test dates and estimates students’ academic growth as a linear function of their “months of exposure” to instruction during the year and the absence of instruction during the summer. Months of exposure are calculated based on school start and end dates and the test administration dates (see Supplemental Appendix B for details). For example, a student testing at the end of August in first grade may have 9.7 months of exposure to kindergarten, 2.3 months exposure to summer following kindergarten, and 1 week of exposure to first grade.
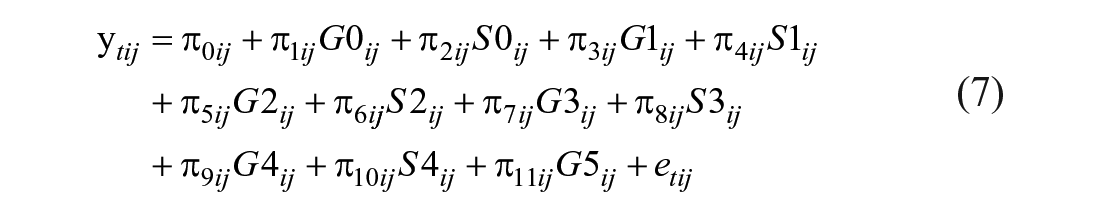
We use an unconditional model (Model 1). At Level 1, we model achievement conditional on exposure to school during the academic year for each grade level (e.g., G0 ij = kindergarten academic year) and exposure to summer after each grade level (e.g., S0 ij = summer after kindergarten). Supplemental Appendix B details the coding of each of the Level-1 predictors, which were the same for the two cohorts (G0 ij –G5 ij for the K–5 cohort; G3 ij –G8 ij for the 3–8 cohort). For brevity, we describe the Level-1 model for the K–5 cohort below.
Level 1 (time t within student i within school j):

Each test score
At Level 2, we include a random intercept to allow students’ starting achievement in fall of kindergarten to vary by student; slopes are treated as fixed. No student covariates are included.
Level 2 (student i within school j):

At Level 3, a random intercept allows starting achievement in the fall of kindergarten to vary by school; slopes are treated as fixed. No school-level covariates are included.
Level 3 (school j):
Variance component specification:


Models are estimated using HLM 8.0 software (Raudenbush et al., 2019). For each subject and cohort, we apply the three-level model to all rural students and then to all nonrural students.
In addition to estimating growth overall for rural and nonrural schools, we also report rural growth rates separately by NCES designation (Rural-Fringe, Rural-Distant, Rural-Remote). Prior research indicated that rural schools differ by distance from an urbanized area in terms of both school characteristics and student achievement (Greenough & Nelson, 2015; NCES, 2014). We take this approach to test the hypothesis that the remoteness of a given school affects available resources (e.g., transportation budgets, ability to recruit and retain teachers, etc.), with the assumption that more remote schools may evince less growth among their students. For example, such factors might hypothetically lead to greater summer loss, a notion we discussed briefly in the introduction to this study.
Question 3. Gaps in Achievement and Growth by Race
Then, to answer Question 3, we calculate standardized achievement gaps and estimate differences in growth rates between Black and White students and between Hispanic and White students. The growth rate differences between student groups are examined by adding race/ethnicity covariates to our models from Question 2. Both approaches are detailed below. Due to sample size limitations (e.g., the number of Native American students in nonrural schools), we are unable to examine achievement gaps between Native American and White students or between other minoritized groups and White students.
Standardized Achievement Gaps
To understand racial/ethnic gaps within each set of schools (rural and nonrural), we calculate standardized mean difference in test scores between minoritized groups (Black and Hispanic) and White students. The standardized mean difference at a given time point between White students and each subgroup S’s scores is

where
Differences in Growth Rates
To estimate racial/ethnic differences in monthly growth rates, we run a model that builds on the unconditional Model 1 and additionally includes student-level covariates Asian, Black, Hispanic, and OtherRace (Model 2), with White students being the omitted category.
Level 1 (time t within student i within school j):
Level 2 (student i within school j):

At Level 3, we add %FRPL, which is a grand-mean-centered school-level covariate for the first school in which the student enrolled.
Level 3 (school j):
Variance component specification:


Again, for each subject and cohort, we separately apply the three-level model to all rural students and then to all nonrural students.
Findings
Question 1. Rural Versus Nonrural Achievement
Figure 1 shows average achievement scores across grades levels for students in rural and nonrural schools and point-in-time standardized gaps between the two. 2 The standardized mean differences and standard errors are reported in the Supplemental Appendix Table C1. Rural achievement in both math and reading started slightly higher than nonrural in kindergarten (initial difference = 0.03 SDs for math, 0.02 SDs for reading); but the difference disappeared in third grade, and nonrural students increasingly outperformed rural students between third and eighth grade (final difference = −0.09 SDs for both subjects). Disaggregated data for Rural-Fringe (closest to an urbanized area), Rural-Distant (farther), and Rural-Remote (farthest from an urbanized area) schools are reported in Supplemental Appendix F. As shown in Supplemental Appendix Table F2, Rural-Fringe schools, the closest to urbanized areas, consistently had the highest achievement scores among rural schools across subjects, grades, and terms. In most grades and academic terms, Rural-Distant schools had the second highest achievement scores in math and reading, and Rural-Remote schools had the lowest achievement scores among the rural locales.

Rural versus nonrural standardized achievement gaps 2013–2014 to 2018–2019, by cohort.
Question 2. Rural Versus Nonrural Growth Rates
Figure 2 shows monthly growth rates (in RIT units) in math and reading achievement in rural and nonrural students broken down by grade and school year versus summer. The figures also include the 95% confidence interval for each estimate. Significant rural–nonrural differences are marked by an asterisk. Growth rates were estimated using the unconditional model (Model 1), and the corresponding coefficients and standard errors are reported in Supplemental Appendix Table C2. In both math and reading, rural students tended to grow more than nonrural students during the school years, though the differences were fairly small in magnitude. However, rural students showed significantly more summer learning loss than nonrural students in almost all summers, eliminating any advantage from having slightly higher school-year monthly growth. Thus, the shift from the initial kindergarten gaps favoring rural schools to the middle school gaps favoring nonrural schools in Question 1 are likely driven by larger learning loss for rural students during the summer, not within school-year growth patterns. There is no clear school-year growth pattern by distance from an urbanized area (see Supplemental Appendix Table F3). Among the three rural locales, Rural-Distant schools tended to have the largest summer learning loss rates in both math and reading across grades. 4

School year and summer growth rates in rural and nonrural schools.
Question 3. Black–White and Hispanic–White Gaps
Achievement Status Gaps
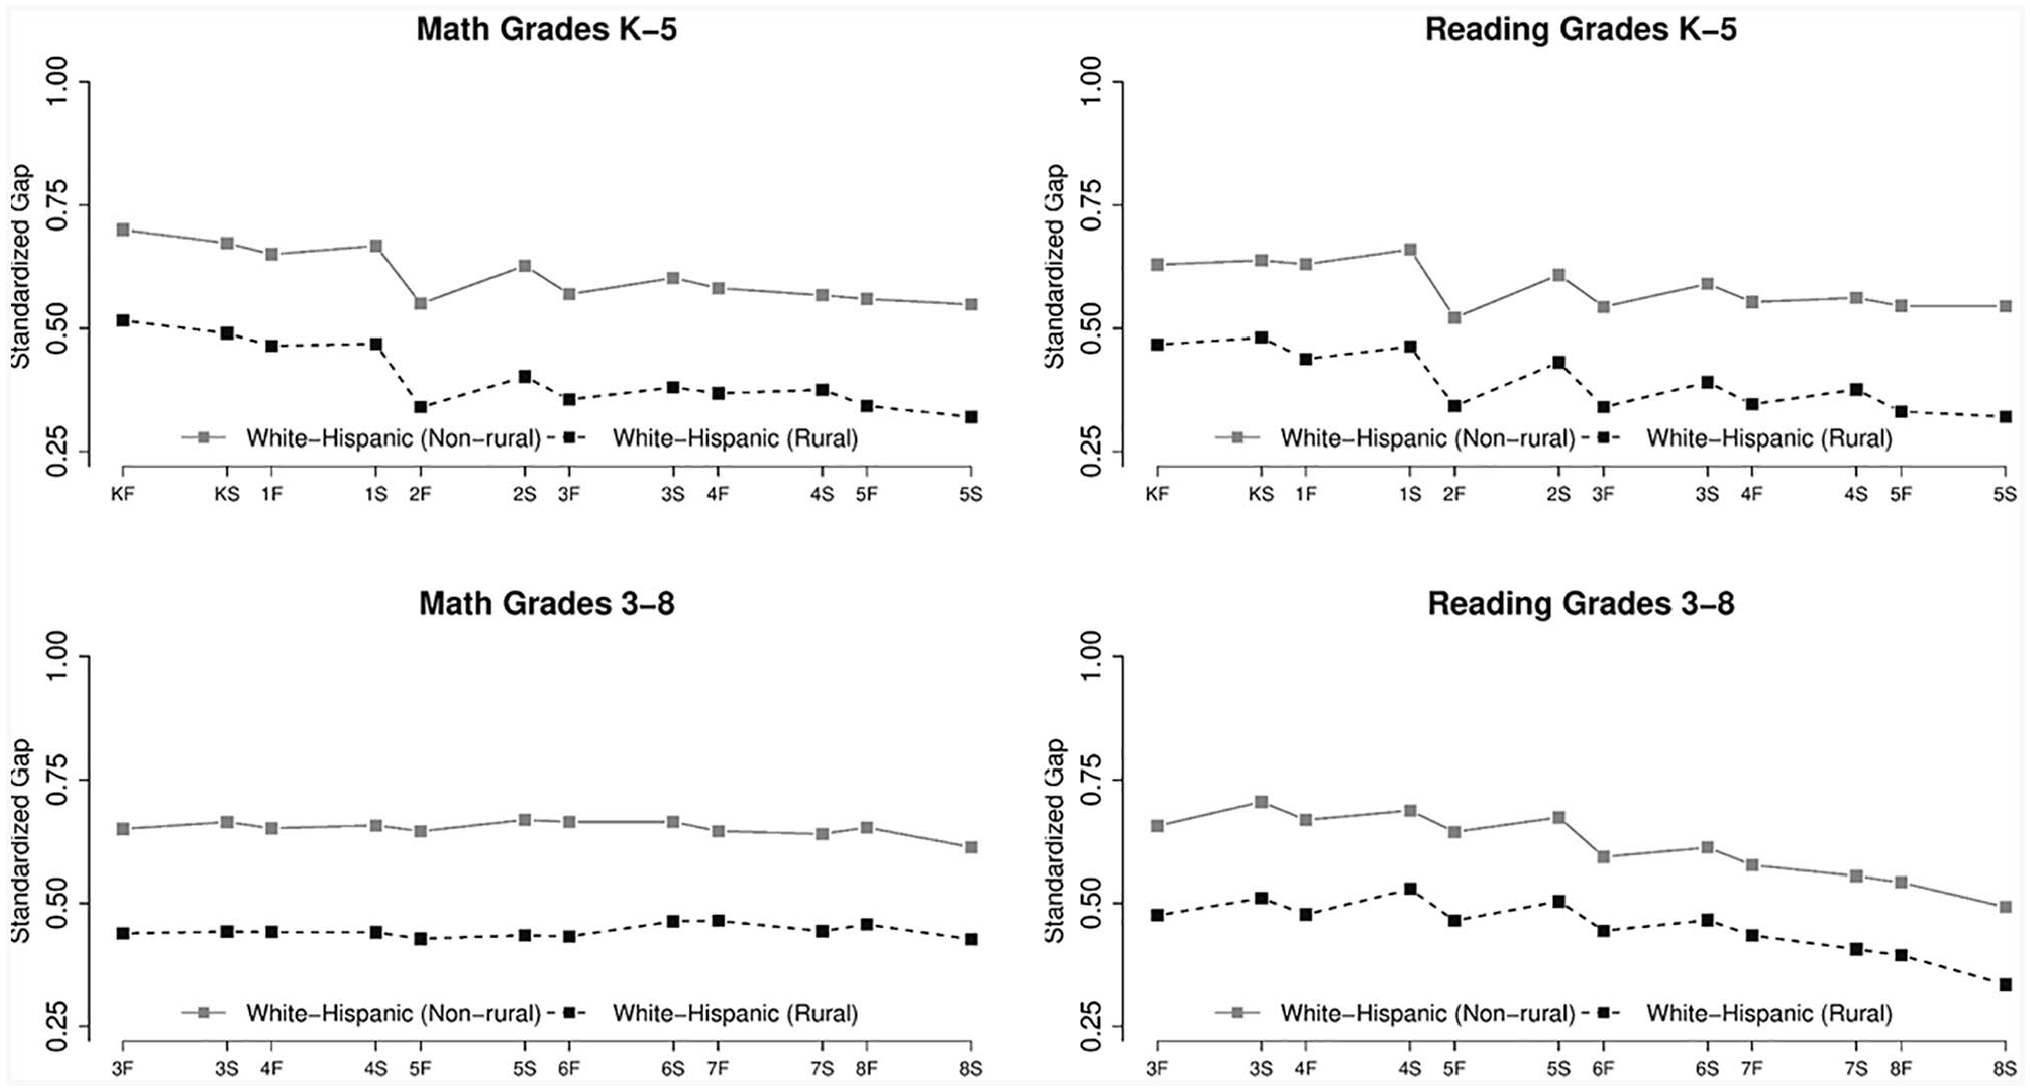
Achievement gaps at specific points in time between Black and White students in rural and nonrural schools are shown in Figure 3a. 3 In all grade levels, gaps between Black and White students were larger in nonrural schools. In both rural and nonrural schools, Black–White achievement gaps in math and reading were sizable at school entry and widened between kindergarten and eighth grade. Figure 3b displays Hispanic–White achievement gaps. As with the Black–White gaps, the Hispanic–White gaps were consistently larger in nonrural schools than in rural schools. However, these gaps shrank moderately as students progressed through school in both rural and nonrural contexts.

Standardized achievement gaps between White and Black students across grades.
Standardized achievement gaps between White and Hispanic Students across grades.
Black–White gaps in both rural and nonrural schools also showed a clear seasonal pattern, widening between fall and spring and then narrowing again during the summer (Figure 3). That is, patterns in how gaps develop seem fairly consistent between rural and nonrural schools, with gaps tending to widen during the academic year. While this last result may be surprising, the pattern of Black–White gaps widening primarily during the school year has also been reported in several other studies (e.g., Kuhfeld et al., 2021; Quinn et al., 2016; von Hippel et al., 2018).
Growth Rate Gaps
Figure 4 plots the monthly growth rate gaps in each school year to show differences between rural and nonrural schools. Each bar represents the Black–White or Hispanic–White difference in monthly growth rates, with positive values indicating that Black or Hispanic students had higher fall–spring monthly growth rates than White students. Confidence intervals for each growth rate gap estimate are also plotted. Asterisks denote a significant difference between the rural gap and the nonrural gap. Growth rate gaps were estimated using Model 2, and the coefficients are presented with their standard errors in Supplemental Appendix Table C4. Rural and nonrural gap estimates tended to be statistically similar. We describe below the gaps in growth rates in academic years. Summer estimates tended to be imprecise—for brevity, we do not describe them but plot them in Supplemental Appendix Figure C5.

Gaps in school-year growth rates between White and Black students across grades.
In math, Black students tended to grow less than White students in most school years in both rural and nonrural schools. This is represented by bars with negative values in the left panels of Figure 4a. In reading, Black students in both rural and nonrural schools grew less than White students from kindergarten to fourth grade, but Black students grew at a similar or higher rate than White students from fifth to eighth grade.
In math, nonrural Hispanic students grew less than nonrural White students, and rural Hispanic students grew at rates similar to rural White students (see Figure 4b). In reading, both rural and nonrural Hispanic students grew less than their White counterparts during kindergarten to second grade, but they grew at similar or higher rates than White students in third grade and later.

Gaps in school-year growth rates between White and Hispanic students across grades.
Discussion
This study is the first to report achievement and growth for a large number of rural U.S. schools. Several findings bear mention. First, rural students started out slightly ahead of nonrural students in math and reading in kindergarten. For example, in math, rural students began kindergarten 0.03 SDs ahead of nonrural students; however, they were behind their nonrural peers by 0.08 SDs by the time middle school started. In other words, there were achievement gaps favoring nonrural students in middle school, but those gaps had not existed (and were in fact reversed) when students entered kindergarten.
Second—and perhaps more important from a policy perspective—most of the eventual gap between rural and nonrural students in middle school occurred due to larger declines in achievement during summer break for rural students. Prior to our study, no evidence existed on summer loss in rural schools. Our results indicate that rural schools experienced mean declines in achievement during the summer—those months out of school may explain why rural students lost ground and eventually had lower achievement than their nonrural counterparts. Growth rates during the school year between rural and nonrural schools were remarkably similar in many grades. Thus, finding ways to address summer loss may be instrumental in making education more equitable for students attending rural schools.
There is also variability in achievement and growth dependent on how remote rural schools are. Among rural schools, Rural-Fringe schools, which are closest to urbanized areas, had the highest achievement scores across subjects, terms, and grades. This finding is not surprising. Prior research found Rural-Fringe schools to have the highest percentage of students who met NAEP proficiency thresholds (NCES, 2014). The Rural-Fringe schools in our sample also had the lowest poverty rate, highest percentages of students of color, and larger total enrollment compared with more remote schools, which is consistent with extant literature (Greenough & Nelson, 2015). Adding the first growth estimates to this body of evidence, we report that Rural-Distant schools, which are farther from urbanized areas than Rural-Fringe schools, had the highest summer learning loss rates among all rural schools. These findings confirm that the needs of rural schools differ by school characteristics, including distance. That remote schools face the challenge of lower achievement scores and larger summer learning loss may suggest that interventions are needed throughout the year to improve access to resources and expand learning opportunities for students far from urban centers.
Third, achievement gaps are always larger in nonrural schools than in rural schools. For example, Black–White gaps can be as much as 0.25 SDs larger in urban schools than in rural schools. Moreover, we provide additional evidence that Black–White achievement gaps widen during the school year and narrow during the summer in both rural and nonrural schools. While perhaps surprising, this result has been shown in other studies (e.g., Kuhfeld et al., 2021; Quinn et al., 2016; von Hippel et al., 2018). Prior research has documented multiple within-school practices that likely disadvantage Black children, including lower teacher expectations for students of color (Delpit, 2012) and biases in disciplinary practices toward minoritized students (Gordon, 2018; Skiba et al., 2011). The relation between these school practices and students’ achievement patterns is beyond the scope of this study. Further research is needed to understand the school processes that may contribute to systemic inequities in rural schools.
Altogether, our results underscore the importance of tracking student progress in rural schools to help policymakers make decisions about resource allocation. Our data allowed for the estimation of separate growth trends within the school year and during the summer. We highlighted that the summer period could be an important time for interventions to help rural students and that achievement gaps change differentially within versus between school years. Access to high-quality summer programs continues to be a challenge for rural students, with parents reporting unmet demand for programs in rural communities (Afterschool Alliance, 2016). Our results highlight the larger summer learning loss among rural students, indicating the possible need for investment in summer enrichment programs in rural communities. Specifically, rural schools, especially those farther from urbanized areas, should be supported with resources to develop summer programming to help students maintain and build on academic skills acquired during the school year. Resources should also be provided to local communities to engage students in activities that apply and supplement their in-school learning. For example, prior research has found library outreach programs such as bookmobiles to have positive impacts on the academic development of economically disadvantaged rural children and suggested the expansion of services that deliver cultural resources to rural families (Miller et al., 2019). Future research should investigate the effects of such programs on summer learning across various rural contexts.
Limitations
Despite the potential usefulness of our findings to educators and policymakers, our results should be interpreted in light of a few study limitations. First, as previously noted, the analyses are descriptive and not intended to establish causal links between rural education and achievement. Second, schools in the sample self-selected into administering the MAP Growth assessments, though some concerns around selection bias might be alleviated by the fact that the GRD covers a substantial portion of rural students and the sample closely resembles rural schools in the nation in terms of demographic composition. Third, we were unable to compare achievement or growth by student-level socioeconomic status, English Learner status, and other factors that might affect student outcomes because such variables were not available in our data. Fourth, uncertainty in the summer learning loss gap estimates reduced our capacity to interpret the seasonal patterns of achievement gaps in rural schools with these data.
Conclusion
Nearly one in five U.S. students attends a rural school, yet we know very little about achievement, achievement gaps, and academic growth in those schools, especially differences between school year and summer changes in achievement. This lack of evidence is troubling given that the federal government and states are making considerable and increasing financial investments in rural schools. Our findings provide educators and policymakers with a rare, extensive view of achievement in rural schools and may suggest opportunities for targeted investment in those schools. In particular, we show that rural/nonrural gaps appear to be growing more during the summer as students in rural schools are losing more ground. However, the mechanisms driving achievement and growth in rural schools remain unexplored. Mixed-methods studies could be especially fruitful in understanding such mechanisms going forward. The current literature on rural education consists of separate and rarely intersecting strands of (a) student outcome analyses, mostly using NAEP data; (b) surveys studies; and (c) qualitative research on teachers and school leadership. The results of this study would be well complemented by qualitative research that explores the potential factors driving rural student success, such as teacher practices and place-based curricula. Similarly, it would be important to identify barriers to summer learning, especially in more remote rural areas, through interviews with student families and community members. For example, future research should combine quantitative analyses of student outcome data (e.g., Barrett et al., 2015) with teacher surveys (e.g., Glover et al., 2016) and qualitative studies of teacher and student experiences in various rural locales. Well-designed mixed-methods inquiries that add educator and student stories to the analyses of growth data will add to our understanding of the strengths and needs of rural schools through an open and critical lens (Burton et al., 2013).
Supplemental Material
sj-docx-1-ero-10.1177_23328584211052046 – Supplemental material for The Forgotten 20%: Achievement and Growth in Rural Schools Across the Nation
Supplemental material, sj-docx-1-ero-10.1177_23328584211052046 for The Forgotten 20%: Achievement and Growth in Rural Schools Across the Nation by Angela Johnson, Megan Kuhfeld and James Soland in AERA Open
Footnotes
Acknowledgements
The authors are grateful for helpful feedback from Nate Jensen and Andrew McEachin.
Notes
Authors
ANGELA JOHNSON is a research scientist at NWEA. Her research interests include education policy and multilingual students.
MEGAN KUHFELD is a senior research scientist at NWEA. Her research seeks to understand students’ trajectories of academic and social-emotional learning and the school and neighborhood influences that promote optimal growth.
JAMES SOLAND is an assistant professor of quantitative methods at the University of Virginia. His research interests include understanding how measurement decisions affect estimates of treatment effects and psychological/social–emotional growth, as well as detecting and quantifying test/survey disengagement.
References
Supplementary Material
Please find the following supplemental material available below.
For Open Access articles published under a Creative Commons License, all supplemental material carries the same license as the article it is associated with.
For non-Open Access articles published, all supplemental material carries a non-exclusive license, and permission requests for re-use of supplemental material or any part of supplemental material shall be sent directly to the copyright owner as specified in the copyright notice associated with the article.