
Abstract
The Tennessee Voluntary Pre-K Program (TN-VPK) is statewide full-day program that gives priority to children from low-income families. A regression-discontinuity design with a statewide probability sample of 155 TN-VPK classrooms and 5,189 children participating across two pre-K cohorts found positive effects at kindergarten entry with the largest effects for literacy skills and the smallest for language skills. The results contribute to the growing body of regression-discontinuity studies of state and local pre-K programs and affirm the statewide generalizability of analogous prior findings from a more specialized subsample in the parent Tennessee Pre-K Study. Furthermore, the respective effect sizes compared favorably with those found in other regression-discontinuity studies of public pre-K on the same outcome measures, providing one index of the quality of the TN-VPK program.
Prior to 1980, only two states funded pre-K programs; currently 44 states and the District of Columbia do so (Friedman-Krauss et al., 2020). The objectives of the advocacy groups and state legislatures promoting this expansion vary, but a common theme is enhancing the school readiness of children prior to kindergarten entry, especially children from economically disadvantaged families. Alongside that short-term goal, however, is an expectation that pre-K will have longer term effects on cognitive and academic skills that will help close the achievement gap between children from low-income families and their more advantaged counterparts (Phillips et al., 2017).
Unfortunately, questions about both short- and long-term educational effects are difficult to address in a methodologically rigorous way for contemporary state-funded pre-K programs. A randomized study would require assembling a sample of pre-K eligible children before the beginning of the school year whose parents consented to having them randomly assigned to attend the state pre-K or not. Few families would allow researchers to make that decision for their children as they consider the available range of options, for example, Head Start, private preschool, and home-based care in addition to state pre-K. As a result, most studies of the immediate effects of state pre-K programs, and all but one study of their longer term effects, have used nonrandomized designs despite the inherent parental discretion involved and the associated potential for selection bias (Farran & Lipsey, 2016).
One notable circumstance amenable to a randomized design, however, is when a number of pre-K sites receive more applicants than they are able to serve, and thus of necessity must turn some away. Randomization in this situation provides an equitable and transparent way to allocate the available seats. This approach was used in the Head Start Impact Study (Puma et al., 2012) and in the Tennessee Pre-K Study that is the topic of this article.
The Tennessee Pre-K Study
The Tennessee Pre-K Study is an evaluation of the Tennessee Voluntary Prekindergarten Program (TN-VPK) designed to assess effects on cognitive skills and academic performance at the end of the pre-K year, and the extent to which those effects are sustained after the pre-K year. This study had several components, the primary one being a randomized control trial (RCT) in which nearly 3,000 applicants to oversubscribed program sites were randomized to offers of admission or a wait list control. A second component (the intensive substudy [ISS]) used a subsample of consented children to compare pre-K participants and nonparticipants on a battery of researcher-collected outcome measures to track achievement indicators in the years before scores on the third-grade state achievement tests became available.
These two components of the study produced two especially noteworthy findings relevant to the present article (Lipsey et al., 2018). First, the ISS showed moderately large positive effects at the end of the pre-K year on Woodcock–Johnson literacy, language, and math measures and on kindergarten teachers’ ratings at the beginning of the kindergarten year for various school readiness skills and behaviors. In this regard, the results of the Tennessee study mirrored the finding of other studies of state pre-K programs that, almost without exception, have shown positive effects on cognitive and early achievement measures at the end of the pre-K year (Duncan & Magnuson, 2013).
Second, the positive effects favoring pre-K participants diminished after the pre-K year and, by the end of kindergarten, there were no significant differences on any of the outcomes measured for the ISS sample. The full RCT sample, in turn, showed that there was also no advantage for pre-K participants on the state achievement tests administered in third grade. This “fadeout” of sustained effects on cognitive and academic performance outcomes after positive pre-K impact is well known as a typical finding of pre-K studies with longer term follow-up (Bailey et al., 2017).
A striking and unexpected finding of the Tennessee study, however, was a negative effect on the follow-up cognitive and achievement outcomes. Through third grade this pattern was seen in the direction of effects on the measures used in the ISS and in the state achievement test scores analyzed for the full RCT, where they were large enough to reach statistical significance for math and science. Further follow-up has revealed that this pattern has continued through sixth grade with scores on the reading achievement test now also showing statistically significant negative effects.
The Regression-Discontinuity Study Component
The component of the Tennessee study that is the focus of this report used the pre-K age-cutoff version of the regression-discontinuity (RD) design first described by Gormley et al. (2005) in their evaluation of the pre-K program in Tulsa. This design compares outcomes for two cohorts of pre-K participants differentiated by an age cutoff for eligibility to enroll during a given school year. Children in the first cohort are old enough to enroll in the program during that school year and, as the treatment group, have their outcomes measured at the beginning of the next school year shortly after they enter kindergarten. Children in the second cohort are too young by a year or less and are not enrolled in the pre-K program during that given school year. They constitute the control group and their outcomes are measured at the beginning of the next year shortly after they enter the pre-K program for which they are then eligible. These two cohorts, of course, differ on age, but at the age cutoff that difference is negligibly small. The comparison of outcomes can be extended to children whose age is further away from the cutoff by using age as a statistical control on the assumption that only age has differentiated the two cohorts. To further match the children, statistical controls with demographic and other relevant variables are often used. Of importance in this context, well-executed RD designs generally yield intervention effect estimates with relatively high internal validity (Cook & Wong, 2008).
The results of the RD component augment the findings of the ISS and full RCT components of the Tennessee study in three ways that motivate the analyses and interpretations reported here.
First, the RD results contribute estimates of school readiness effects on widely used measures for another state with a state-funded pre-K program. State programs vary on many dimensions and characterizing their effectiveness requires, at minimum, a body of research in which many state programs are represented. The age-cutoff RD design is uniquely appropriate for building that body of research. It is widely applicable to state programs, virtually all of which have an age eligibility cutoff, and has in fact already been used in quite a number of studies of such programs (citations and a summary of findings are in online Supplemental Appendices G1 and G2). These studies not only have a common design, but most use the same or very similar literacy, language, and math outcome measures. The present report adds Tennessee results to this growing body of RD evidence about the school readiness effects of state pre-K programs.
Second, recall that the ISS found positive effects on cognitive and achievement outcomes at the end of pre-K. Those are important findings both in the context of research on the immediate effects of state pre-K programs and the objective of such programs to enhance school readiness for kindergarten. But the ISS sample was limited to children whose parents consented to their participation and, further, as a subsample of the RCT, to applicants to oversubscribed program sites. These limitations raise questions about external validity—the extent to which the findings of the ISS for immediate pre-K effects generalize to the statewide population of TN-VPK program sites. The RD component of the Tennessee study addresses this issue by using a statewide probability sample of that population.
Third, by virtue of the comparability of the pre-K effects across states found in age-cutoff RD studies, the Tennessee RD results bear on the null and unexpectedly negative effects found on the achievement outcomes in the years after participation in TN-VPK. Among the attempts to explain those effects by pre-K advocates is the claim that the Tennessee program is of distinctly poorer quality than those of states that have shown longer term positive results in their studies (e.g., Meloy et al., 2019). There is no universally recognized measure of pre-K quality, and none that has been widely applied across state pre-K programs in a way that allows meaningful comparison. Arguably, however, a direct measure of quality is the magnitude of the program’s effects on representative school readiness outcomes. The general comparability of effects found in age-cutoff RD studies on such outcomes across state programs provides an opportunity for a comparative assessment of the Tennessee program on at least this one indicator of program quality.
The Tennessee Prekindergarten Program
Launched in 2005, TN-VPK is a relatively typical state-funded full-day program that operates on the same calendar as the public schools. By statute, it gives priority to 4-year-old children eligible for the federal free or reduced-price lunch (FRPL) programs. Second priority goes to other at-risk children, for example, English language learners, those in state custody, or at risk due to circumstances of neglect or abuse.
The program requires a licensed teacher and an aide in every classroom, a maximum of 20 children per class, and a curriculum chosen from a state-approved list. Contracts from the state support VPK classrooms in the participating school districts. Some districts choose to partner with community agencies and/or Head Start, but the majority of classes are housed in public schools. In 2008–2009, when the evaluation reported here first began, nearly every school district in Tennessee offered at least one full-day VPK classroom with a total enrollment statewide of about 18,000 children.
Method
In the age-cutoff RD design, a prespecified age determines which children are eligible to enroll for the coming school year. For TN-VPK, children had to be 4 years old by September 30 of a given year and eligible for kindergarten the following year to enroll. The outcome variables on which VPK participating and nonparticipating children were compared included six tests from the Woodcock–Johnson III Achievement Battery (Woodcock et al., 2001). Children in the treatment cohort who had participated in TN-VPK the prior year were assessed shortly after they entered kindergarten. Their counterparts in the control cohort who were not yet four years old by the cutoff date were also assessed at the beginning of the next year, which for them was shortly after they entered TN-VPK and thus before much exposure to the program.
Sample
Children in the treatment and control cohorts came from classrooms chosen via two-stage probability sampling to represent TN-VPK classrooms across the state. With assistance from Tennessee Department of Education (TN-DOE) staff, four geographic regions (West, Central West, Central East, and East) were designated with the school districts and VPK programs within each identified. To be eligible for selection into the sample, a classroom had to have been in place for two successive school years and staffed by the same teacher both years. These criteria were imposed to increase the likelihood that the children in the treatment and control cohorts would be comparable with regard to their community or neighborhood locations and school preferences.
Within each region, VPK classrooms were differentiated by their profiles on four variables related to program administration that were identified by TN-DOE staff as important distinctions between program sites: (1) urban versus nonurban location, (2) operated in a school or partner community agency, (3) an original pilot program or one added when TN-VPK went to scale, and (4) whether in a high-priority school designated as among the lowest performing in the state. Based on these characteristics, the 942 TN-VPK classrooms found statewide were assigned to a specific stratum consisting of some combination of these four program characteristics.
Disproportionate random sampling from these regions and strata was then conducted with sampling fractions created to sample larger proportions of classrooms from smaller strata to ensure that those strata contributed sufficient numbers of classrooms to allow adequate representation in the analysis. Across the four regions, this sampling strategy resulted in a total of 155 classrooms located in 154 schools (one school had two classrooms) spread across 73 school districts and 62 counties. Sampling weights were assigned that allow the data from the sampled classrooms to be weighted back to the proportions of the full statewide population of classrooms (online Supplemental Appendix A provides more detail about the sampling procedure). As a practical matter, it was not possible to collect the child- and classroom-level data required by the design for all the sampled classrooms within the same school year. The data collection therefore was spread over 4 school years with the sampled classrooms within one of the four regions participating in that process each year (Figure 1 is a schematic of the design).

Structure of the regression-discontinuity design.
Once the sample of classrooms was chosen, the children enrolled in those classrooms were identified. The region chosen for the first wave of data collection was Central West. The TN-VPK (treatment) cohort in this region began pre-K in the fall of 2009. After they completed that pre-K year, they were then assessed within the first 6 weeks of kindergarten the next fall (2010) as long as they were still in the Tennessee public school system (see Figure 1). The corresponding entry years for treatment group pre-K participation in the other regions were fall 2010 (West), fall 2011 (Central East), and fall 2012 (East). The control cohorts of children entered those same pre-K classrooms in the fall of the following year—2010 for Central West, 2011 for West, 2012 for Central East, and 2013 for East. Those children were assessed within the first 6 weeks after they began pre-K, thus during the same school year as the treatment cohort.
To make the two cohorts as comparable as possible, identical eligibility criteria for the treatment and control cohorts were applied to select the children to be included in the analysis. Those criteria require that children be:
VPK age-eligible; that is, 4 years old by September 30 of the respective school year.
Enrolled in a participating VPK classroom within the first 6 weeks of the system-specific school start date for the respective pre-K year and remain in that classroom until at least the last 6 weeks of the system-specific school end date. 1
Enrolled in a Tennessee public school kindergarten the year following pre-K within the first 6 weeks of the system-specific school start date.
These criteria resulted in some children being excluded from the analysis sample because they withdrew from pre-K early, enrolled too late, or moved to a classroom that was not in the sample. Five classrooms in the original sample were dropped: one changed from 4-year-old to 3-year-old over the two study years; one was discontinued after the end of the first study year; one was moved to a nonparticipating school; and the teachers in two classrooms moved to a school that served a different population of children in the second study year. Overall, 16% of the children in the originally sampled classrooms became ineligible, including 17% of the treatment and 15% of the control children. Figure 2 diagrams the flow of children through the study.

Consort chart for the achieved sample of children.
The final sample consisted of 5,189 children from successive cohorts attending 155 classrooms—2,622 in the treatment cohort and 2,567 in the control cohort. On average, these samples included 17 children from the treatment cohort and 17 children from the control cohort moving through each selected classroom in successive years.
Outcome Measures and Data Collection
A selection of measures from the Woodcock-Johnson III Achievement Battery (McGrew et al., 2007; Woodcock et al., 2001) was used to estimate the effects of TN-VPK on cognitive and achievement skills, which are as follows:
Early literacy ○ Letter-word Identification: Ability to identify and pronounce alphabet letters and read words by sight. ○ Spelling: Ability to trace letter shapes and write orally presented letters and words.
Language ○ Oral comprehension: Ability to listen to an oral passage and provide a missing key word. ○ Picture vocabulary: Extent of expressive vocabulary in response to pictures of objects and actions.
Early mathematics ○ Applied problems: Ability to apply an appropriate strategy to solve numerical and spatial problems. ○ Quantitative concepts: Ability to understand number identification and sequencing, shapes, and symbols.
An overall index of achievement (WJ Composite) also was constructed by averaging scores across these six scales. All analyses used the Woodcock-Johnson W scores, which are equal-interval scores constructed using Rasch modeling to represents both a child’s ability and the difficulty of the items. The W scores are viewed by the test authors as those most suitable for statistical calculations (Jaffe, 2009).
These measures were administered to the children in the VPK treatment cohort within the first 6 weeks of kindergarten and, during that same fall, to the children in the control cohort within the first 6 weeks of pre-K. Trained assessors administered the measures individually to students at their classroom sites in English, the language of instruction for VPK. In addition, demographic information obtained from TN-DOE records included birthday, gender, race/ethnicity, native language, eligibility for FRPL, and whether the child had an Individual Educational Plan (IEP) during the pre-K year. There were no missing data in the analytic sample except for FRPL eligibility for one child, which was imputed as eligible in alignment with the status of a large majority of the other children in the sample.
Final Analytic Sample
Of the 5,189 children who met the original sample criteria, 4,144 (79.9%) were FRPL eligible—2,078 in the treatment cohort and 2,066 in the control cohort. The primary analytic sample was restricted to these children for two reasons. First, these economically disadvantaged children constituted the priority target population for TN-VPK. Second, the analytic sample for the RCT component of the overall Tennessee study included only FRPL-eligible children, so this selection facilitated comparison of the results from the RD with those from the RCT. Four classrooms had no FRPL-eligible children, reducing the number of classrooms in the sample from 155 to 151.
Data Analysis
For the RD design to produce valid estimates of treatment effects, at least three conditions must be satisfied (Jacob et al., 2012). First, there must be a clear cut point on the assignment variable, that is, a distinct value that determines whether a child is in the treatment or control group. Second, there should be no categorical differences between the treatment and control groups across the cut point on any characteristics other than treatment versus control status that might be related to the outcomes. Finally, the functional relationship between the assignment variable and the outcome variable must be correctly specified. Each of these is examined below for the TN-VPK data.
A Clear Assignment Variable
The exogenous determinant of eligibility for TN-VPK was age—whether a child was 4 years old by September 30. Even 1 day on either side of that cutoff was defined by TN-DOE as sufficient to differentiate eligible from ineligible children at the beginning of the school year. No violations of this requirement were found in the sample data.
Equivalence Between Treatment and Control Groups
Our application of the age-cutoff RD design required that children in each of the two cohorts enroll in the same pre-K classrooms with the same teacher in the same schools, as well as in a Tennessee public school kindergarten the next year. This was to increase the probability that children in the two age cohorts would be comparable on characteristics related to the local context of the respective VPK programs. This requirement was adhered to when constructing the analytic sample with one exception—the teacher changed between cohorts prior to outcome measurement in 25 (16.6%) of the 151 classrooms in the analytic sample. There were no other changes in the location and student population and these classrooms were kept in the sample.
To compare the cohorts on their baseline characteristics, each of the available baseline variables was used as the sole dependent variable in multilevel models with different bandwidths (±months around the cut point) and with children nested within classrooms and cohort. As Table 1 reports, for the 12-month and 6-month bandwidths, the two cohorts were similar with regard to gender, race/ethnicity, language spoken at home, and IEP placement, but the control cohort did have a slightly larger and marginally significant proportion of Hispanic children in the 12-month bandwidth (0.054 vs. 0.044). 2 Age, of course, differed as an intrinsic feature of the RD design. The cohorts also differed on the timing of the outcome assessments, with the time between the start of school and administration of the WJ tests averaging a few days longer for the treatment cohort. Children in the control cohort were all located in their known pre-K classrooms while the kindergarten classrooms the treatment cohort children attended after pre-K had to be located via information from teachers and TN-DOE records.
Comparison of TN-VPK and No Pre-K Cohorts on Baseline Characteristics: 12-, 6-, and 3-Month Bandwidth Samples

Note. Only children identified as eligible for free or reduced lunch were included in the analysis. Analyses were weighted to project the estimates to the statewide population of VPK classrooms. The race/ethnicity categories are not mutually exclusive; mixed race children are coded in all the categories for their respective mix. IEP indicates special education placement; test lag is time between start of school and testing. TN-VPK = Tennessee Voluntary Prekindergarten Program; IEP = Individual Educational Plan.
Estimated means from the multilevel models with children nested within classrooms; membership in the treatment group as the only predictor with the respective baseline variable as the dependent variable. bFor binary variables, odds ratios were converted into effect sizes, using Chin’s (2000) method. For continuous variables effect sizes were calculated by dividing the TN-VPK versus No pre-K difference by the pooled standard deviation of the two groups.
The 3-month bandwidth sample differed not only on test lag but also on race/ethnicity and primary language spoken at home. The proportion of Black children was larger in the treatment cohort whereas the proportions of Hispanic children and those from non-English speaking households were larger in the control cohort. All the variables shown in Table 1 were included as covariates in the analyses of VPK effects to adjust for any differences between the cohorts on these variables.
Specification of the Relationship Between Age and Outcome
To determine the appropriate functional form, the approach outlined by Jacob et al. (2012) was used. First, graphs of the relationship between scores on each outcome measure and age (days before and after the cutoff date) were examined for discontinuity at the cut point and any other place (Lee & Lemieux, 2010). Second, a variety of functional forms (e.g., linear, cubic, linear interactions) for the relationships between the assignment variable (age) and the outcome variables were tested. Following Lee and Lemieux (2010) and Jacob et al. (2012), two regressions were run for each outcome. The first regressed the outcome on treatment condition, the assignment variable, and the respective term(s) for the functional form being tested. The second used these variables plus indicator variables for the intervals used in the graphical displays. The F-test procedure from Jacob et al. (2012) was used to compare the two models with results that were not statistically significant, indicating no unexplained variability in the simple model that was captured by the more complex model. These explorations established that simple linear models for the age assignment variable predicting each of the outcome measures were adequate to account for their relationships.
Estimation of TN-VPK Effects
Analyses were conducted via SAS Proc Mixed with weighted multilevel regression models that had children nested in classrooms. The weighting function was based on the sampling fractions from the stratified sample and adjusted the classroom representation to the statewide proportions. The formal representation of the analytic model is

where Yij is an outcome variable measured for child i in classroom j; Aij is age at the cutoff date in days before (minus) and after (plus); Tij is the treatment variable (Cohort 1 vs. Cohort 2); Xkij are covariates, uj is the Level 2 (classroom) residual, and rij is the Level 1 (child) residual. The covariates are shown in Table 1 (online Supplemental Appendix B describes how these variables were coded). These analyses were run for ±12-month, ±6-month, and ±3-month bandwidths around the cutoff date. As a robustness check, the effects were reestimated after excluding the outermost 1%, 5%, and 10% of the data points with the highest and lowest age values. If the functional form was not misspecified, the impact estimates should not markedly change with these outermost data points dropped (Jacob et al., 2012).
Effects for Subgroups
Of particular interest were differences in the effects on any outcome measures related to gender, race/ethnicity, or primary language. To investigate such differential effects, the multilevel models were repeated for the Woodcock–Johnson composite measure while including the respective subgroup membership variable and the term for its interaction with the treatment condition.
Results
Effects on Literacy, Language, and Math Skills
Figures 3 to 9 show graphs of the relationships between the observed outcome measures and the age span before and after the pre-K eligibility cut point for the FRPL analytic sample. These data are not adjusted for covariate influence nor weighted to represent the statewide population of VPK classrooms. For each outcome variable, these plots show the mean of the outcome at the midpoint of equal-sized intervals on the age-based assignment variable. The interval size was determined via the statistical tests recommended by Jacobs and colleagues (2012). The assignment variable represents the number of days from when the child turned 4 years old, centered on the cutoff of September 30th for the respective year. The general linearity of the age-outcome relationships is evident in these graphs as well as discontinuities at the cut point for all the outcome measures except Oral Comprehension.

Unadjusted Woodcock–Johnson (WJ) Composite score by days from age eligibility cutoff.
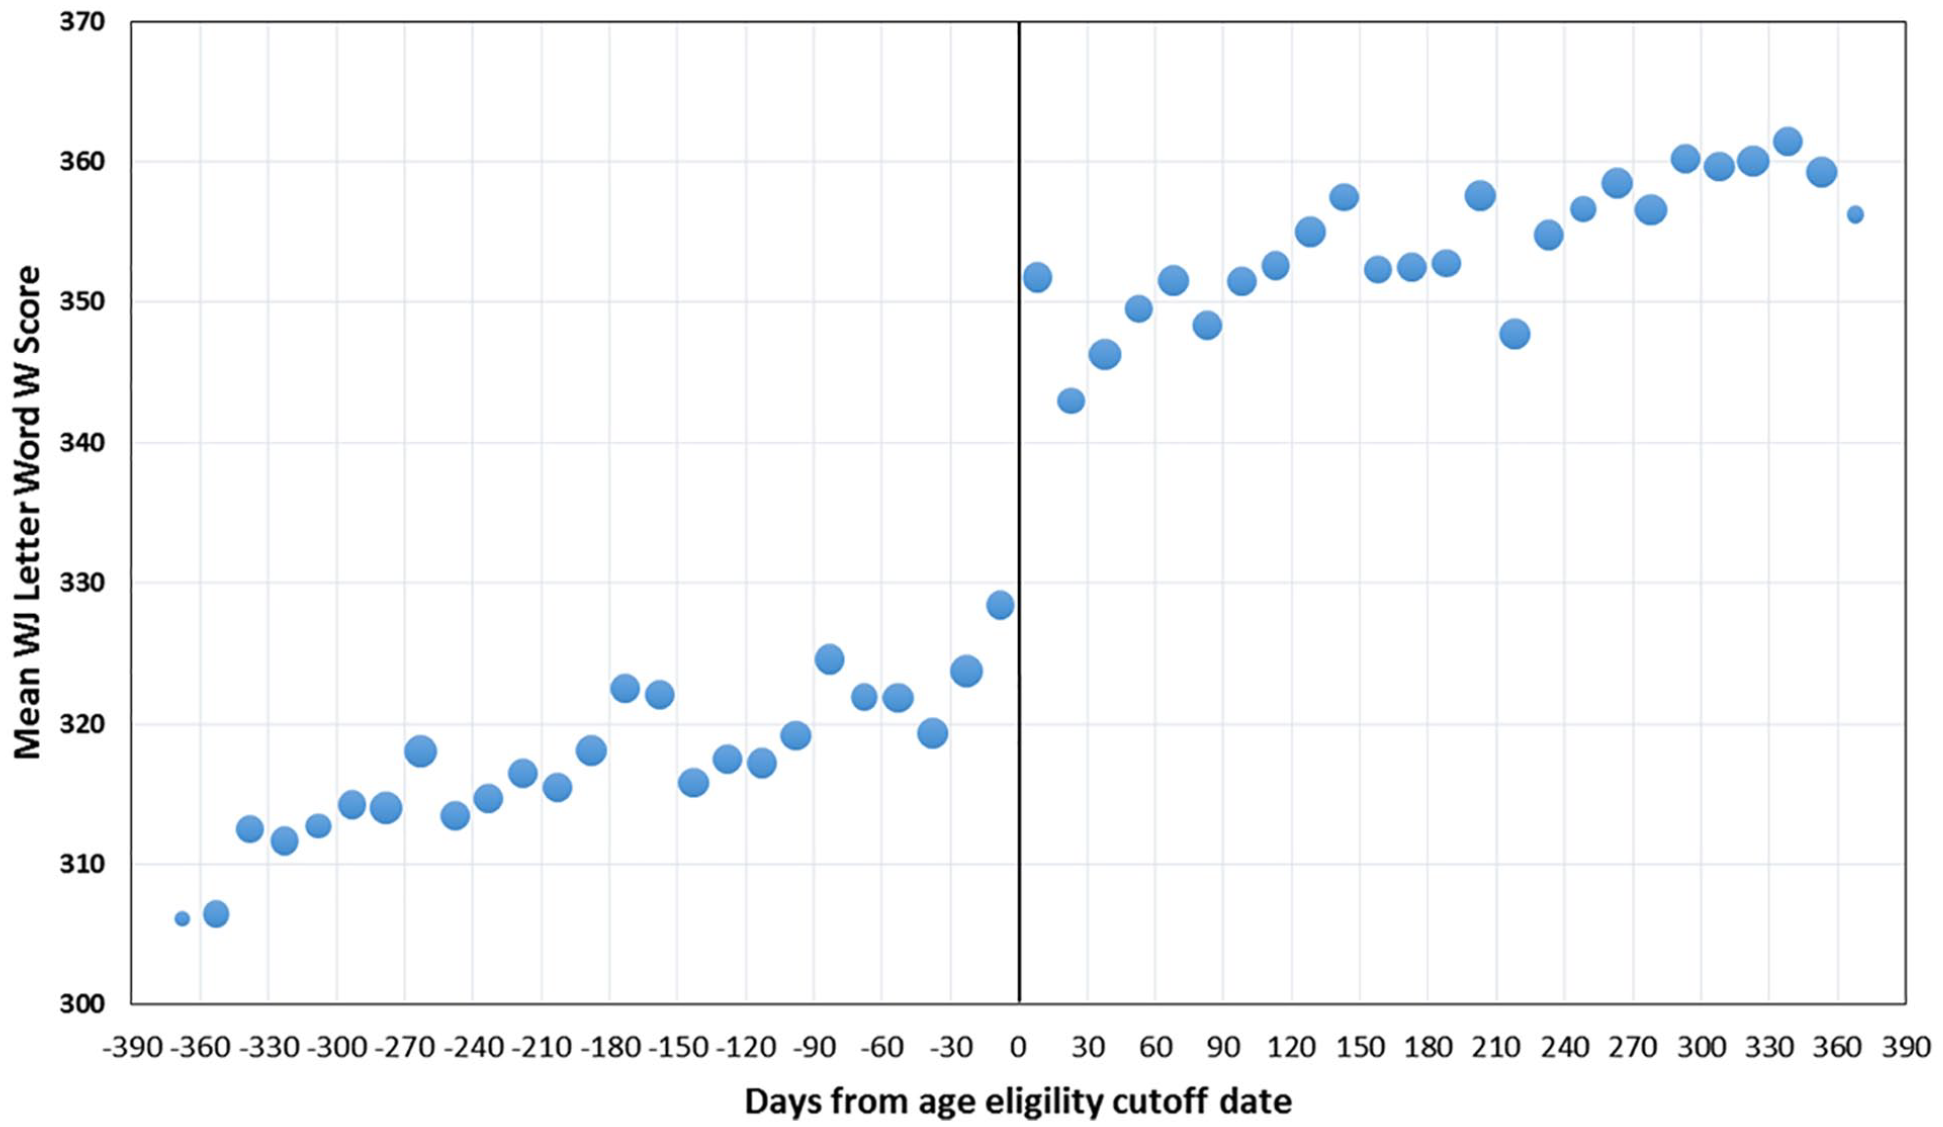
Unadjusted Letter-Word score by days from age eligibility cutoff.
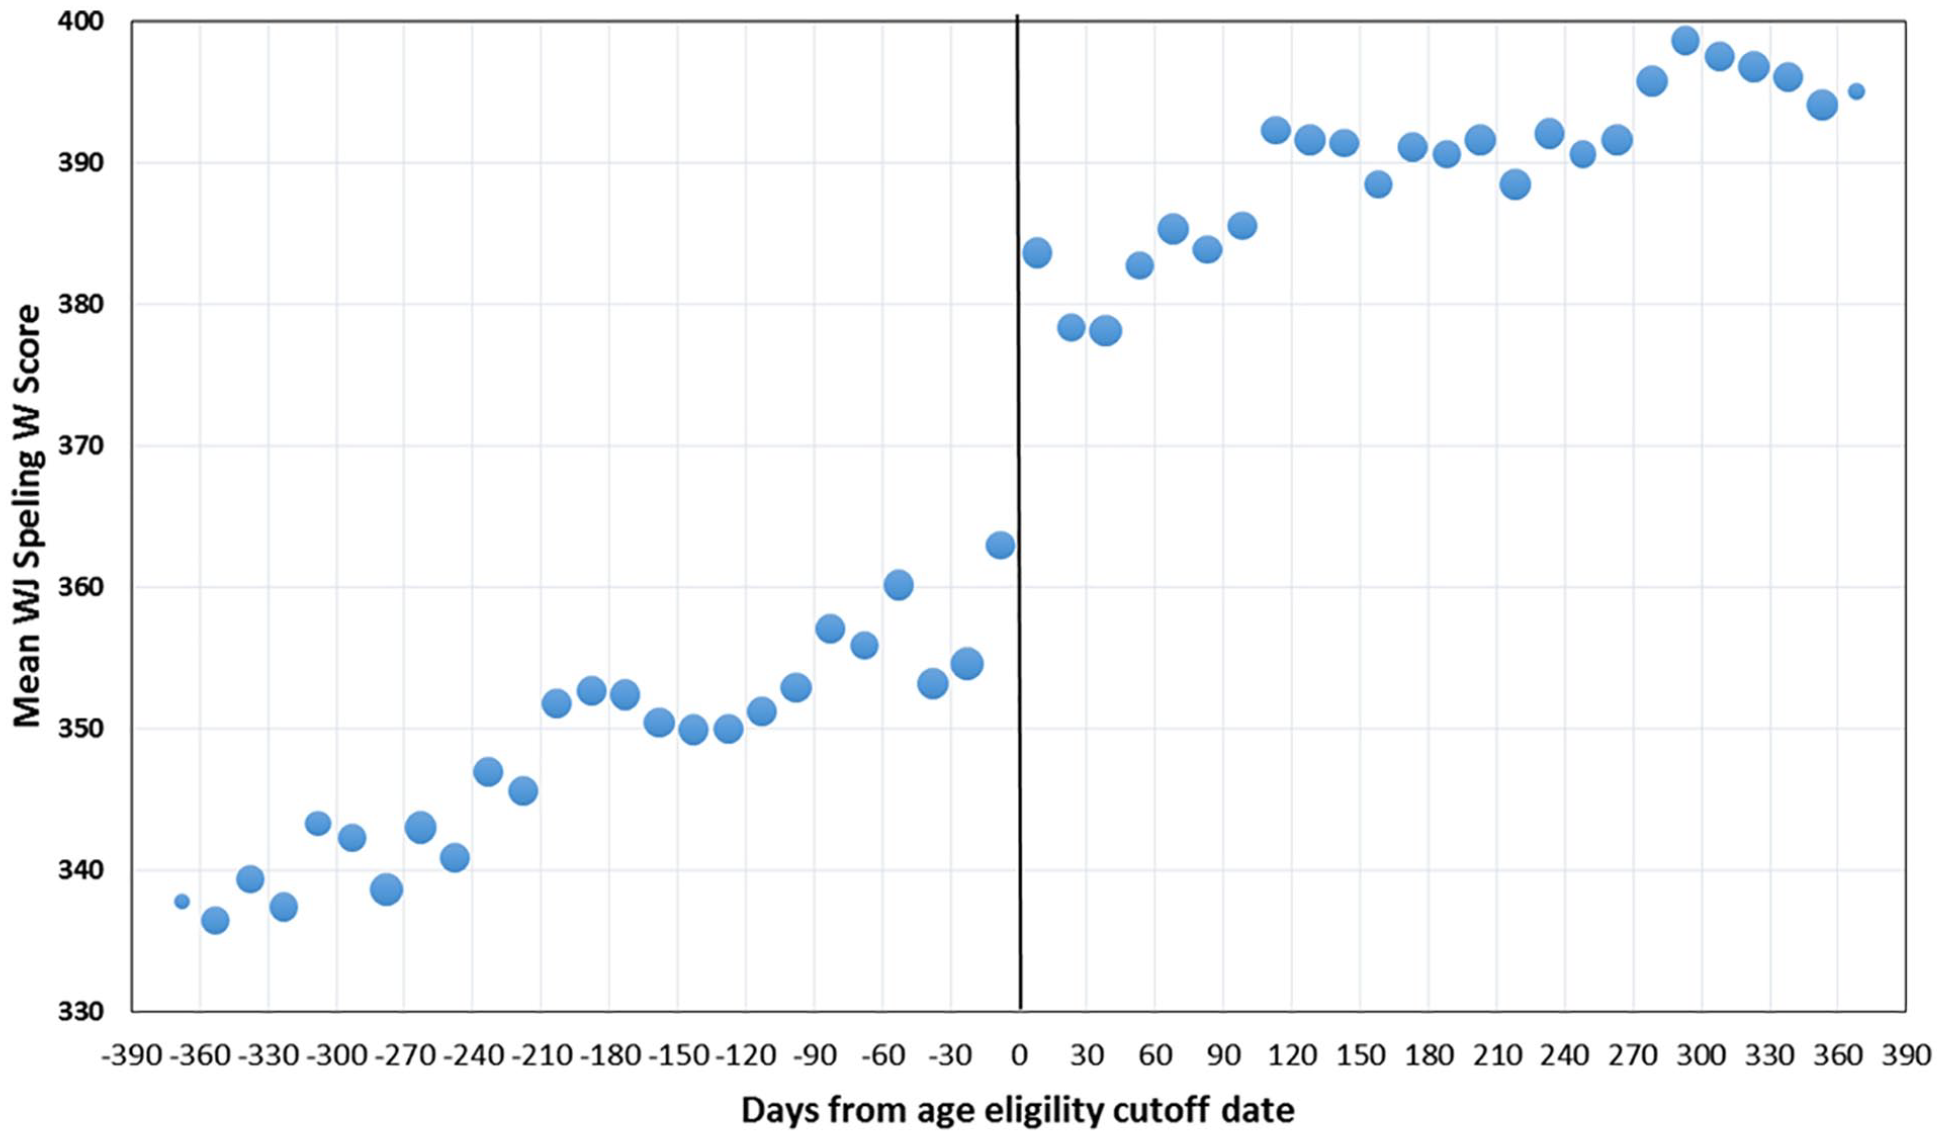
Unadjusted Spelling score by days from age eligibility cutoff.

Unadjusted Oral Comprehension score by days from age eligibility cutoff.

Unadjusted Picture Vocabulary score by days from age eligibility cutoff.
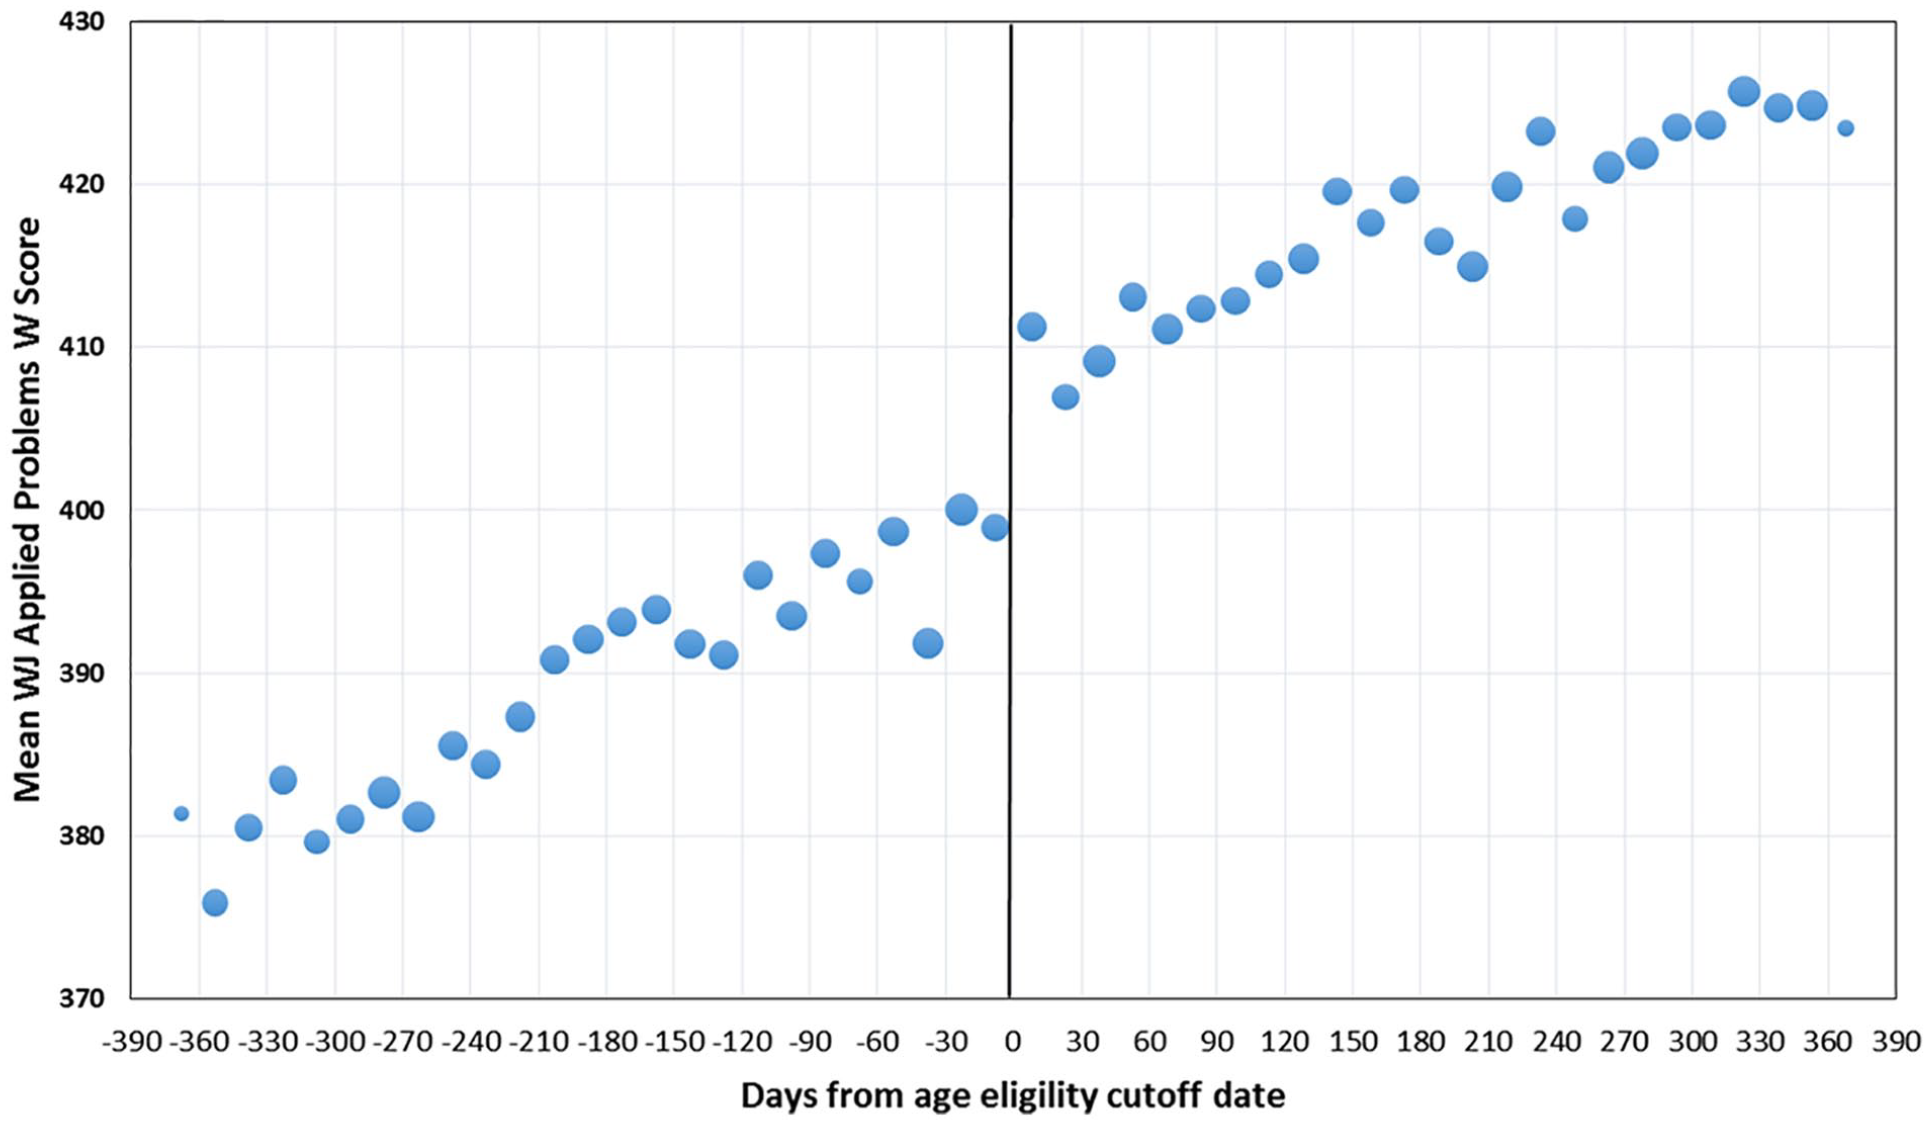
Unadjusted Applied Problems score by days from age eligibility cutoff.
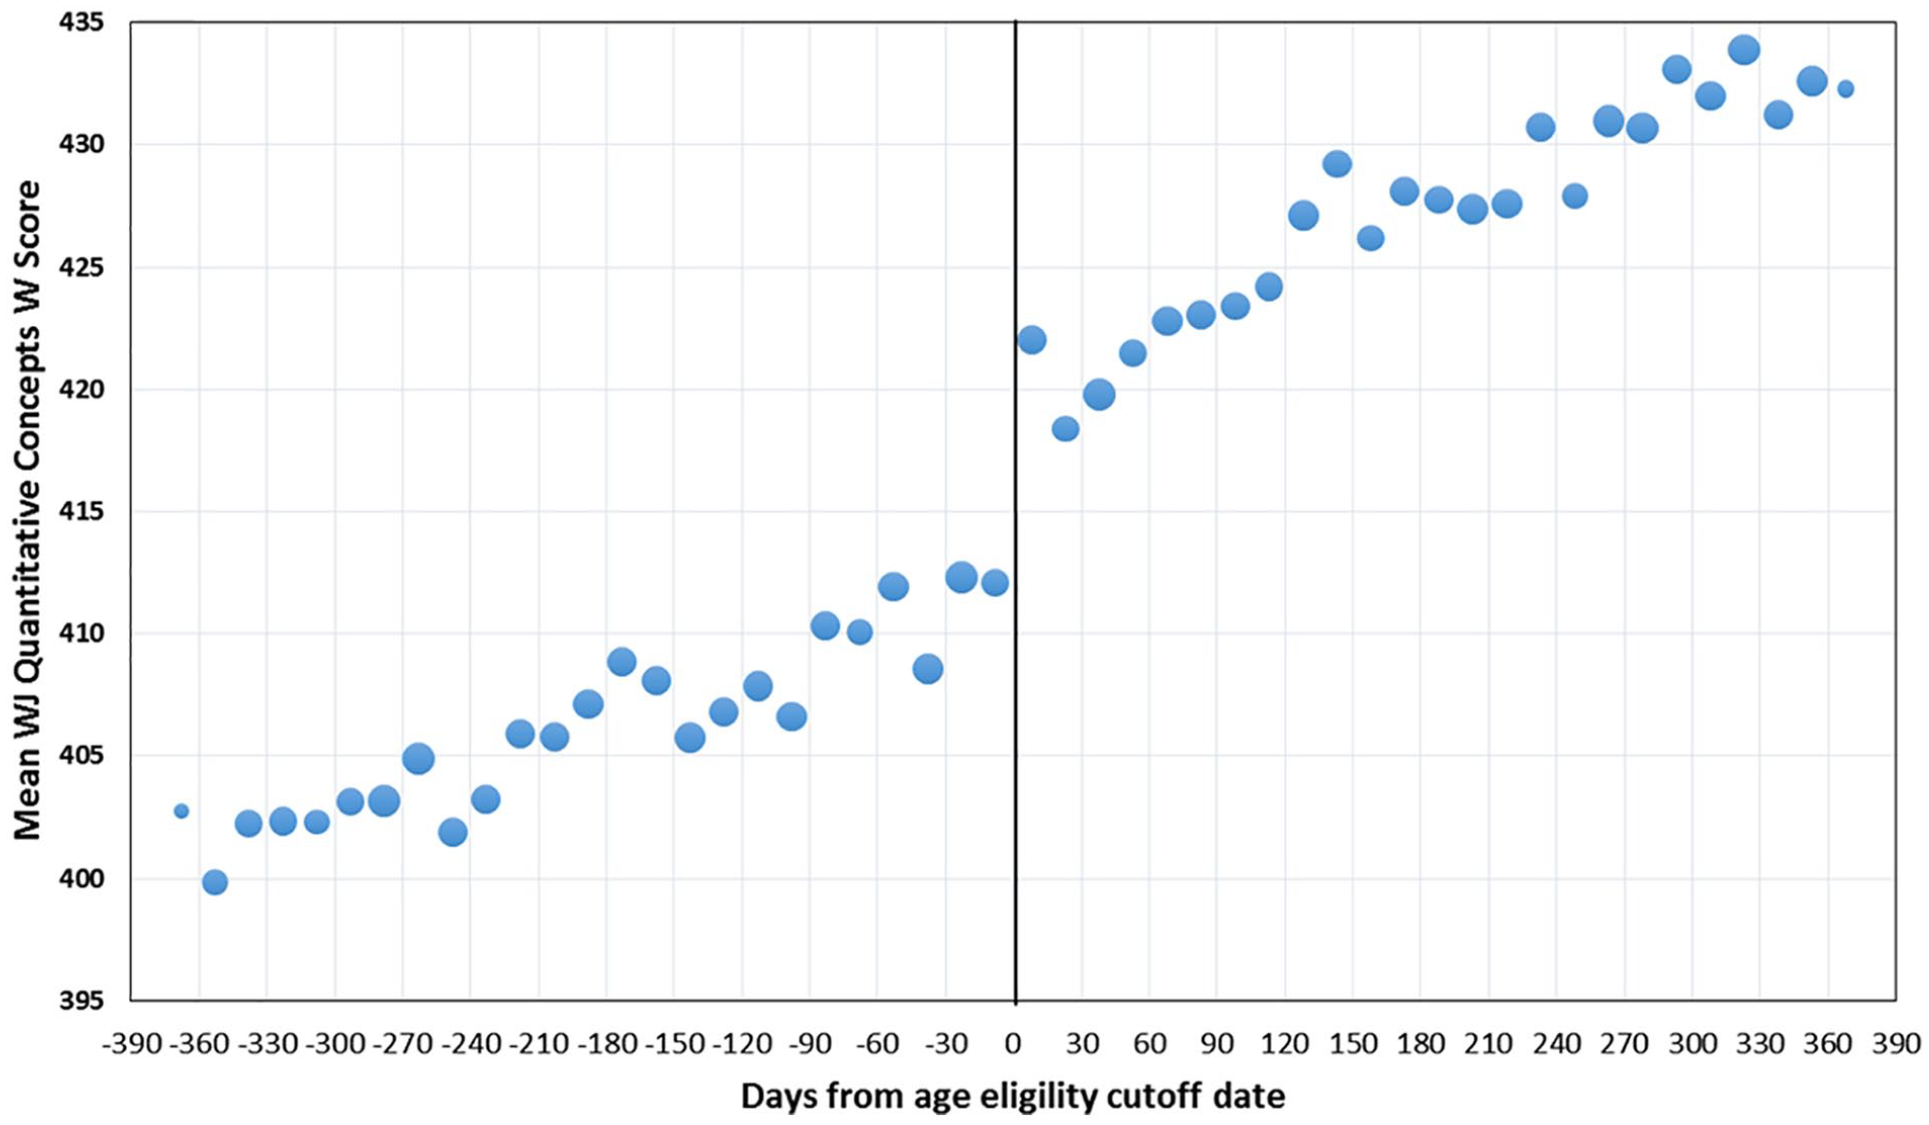
Unadjusted Quantitative Concepts score by days from age eligibility cutoff.
Table 2 summarizes the results from the weighted multilevel analysis models fit to these data (full results in online Supplemental Appendix Tables C1 to C7). Participation in TN-VPK showed statistically significant effects at all three bandwidths for the WJ composite and all the individual Woodcock–Johnson tests except the 3-month bandwidth for Picture Vocabulary. The effect sizes for the composite measure were relatively large—0.85, 0.83, and 0.91 for the 12-, 6-, and 3-month bandwidths, respectively. The largest effects were found for early literacy (Letter-Word and Spelling; effect sizes from 0.94 to 1.11). The smallest effects were for language skills (Oral Comprehension and Picture Vocabulary; effect sizes from 0.22 to 0.34). The effect sizes for mathematics were in between (Applied Problems and Quantitative Concepts, effect sizes from 0.47 to 0.71.). Across the bandwidths, the effect size estimates for each measure were generally similar. Notably, those for the 3-month bandwidth, where the estimates should be best, were comparable to or larger than those for the wider bandwidths except for Picture Vocabulary.
Estimates of the Pre-K Effect for the Woodcock–Johnson (WJ) Composite and Individual Tests

Note. The sample sizes for the TN-VPK and No Pre-K groups were 2,078 and 2,066 for ±12 months; 1,009 and 1,058 for ±6 months; and 519 and 531 for ±3 months. Only children eligible for free or reduced-price lunch were included. All analyses were weighted to project the estimates to the statewide population of TN-VPK classrooms. TN-VPK = Tennessee Voluntary Prekindergarten Program.
Estimated marginal means from the multilevel analysis model. bEstimates based on multilevel models with children nested within pre-K classrooms. In addition to condition and days from the age cutoff (centered at zero), covariates included (1) region, (2) whether the child was male, (3) whether the child was Black, (4) whether the child was Hispanic, (5) whether the child’s native language was not English, (6) whether the child had a special education placement (IEP), and (7) the number of days between the WJ testing date and the start of school (centered at the grand mean). Previous analyses showed that the functional form for all models was linear. Online Supplemental Appendix Tables C1 to C7 present the results for the full models for each outcome and bandwidth. cStandardized mean difference effect sizes calculated by dividing the TN-VPK versus No Pre-K difference by the standard deviation of the TN-VPK treatment group, recognizing that group as more analogous to the posttest outcomes typically used to compute effect sizes.
As a further robustness check, each of these analyses was repeated with the outermost 1%, 5%, and 10% of the youngest and oldest children excluded. The resulting effect sizes did not vary greatly from those for the untrimmed samples (online Supplemental Appendix Table D1). The average difference for the most trimmed sample was 0.019 for the 12-month bandwidth (ranging from 0.004 to 0.038), 0.078 for the 6-month bandwidth (0.041 to 0.118), and 0.084 for the 3-month bandwidth (0.033 to 0.131).
Effects for Subgroups
Differential effects were estimated with the same models used for the main effects analyses but with interaction terms for the treatment condition and the respective subgroup of interest. Statistically significant differential effects were found for only two of the subgroup comparisons. As Table 3 reports, the effects of TN-VPK on the overall WJ composite measure were larger for Hispanic children and for children whose primary language was not English (online Supplemental Appendix Tables E1 to E4 report results on the individual tests for the different subgroups). Because the majority (76%) of children whose primary language was not English were also Hispanic, these comparisons overlap. To better disentangle these two variables, the analyses were repeated with the addition of the three-way interactions that differentiated Hispanic and non-Hispanic children according to their native language. These interactions were statistically significant for the 12-month and 6-month bandwidths, though not for the 3-month one (reported in the lower rows of Table 3 for the WJ Composite; results for the individual tests in online Supplemental Appendix E5). The patterns across the marginal means show that, although the effects of TN-VPK were positive and relatively large in magnitude for all subgroups, the smallest impact appeared for children who were not Hispanic and whose primary language was English. The largest impact was for the small group of children whose primary language was not English but who were not Hispanic.
TN-VPK Effect Estimates on the Woodcock–Johnson (WJ) Composite for Hispanic and Native Language Subgroups of Children
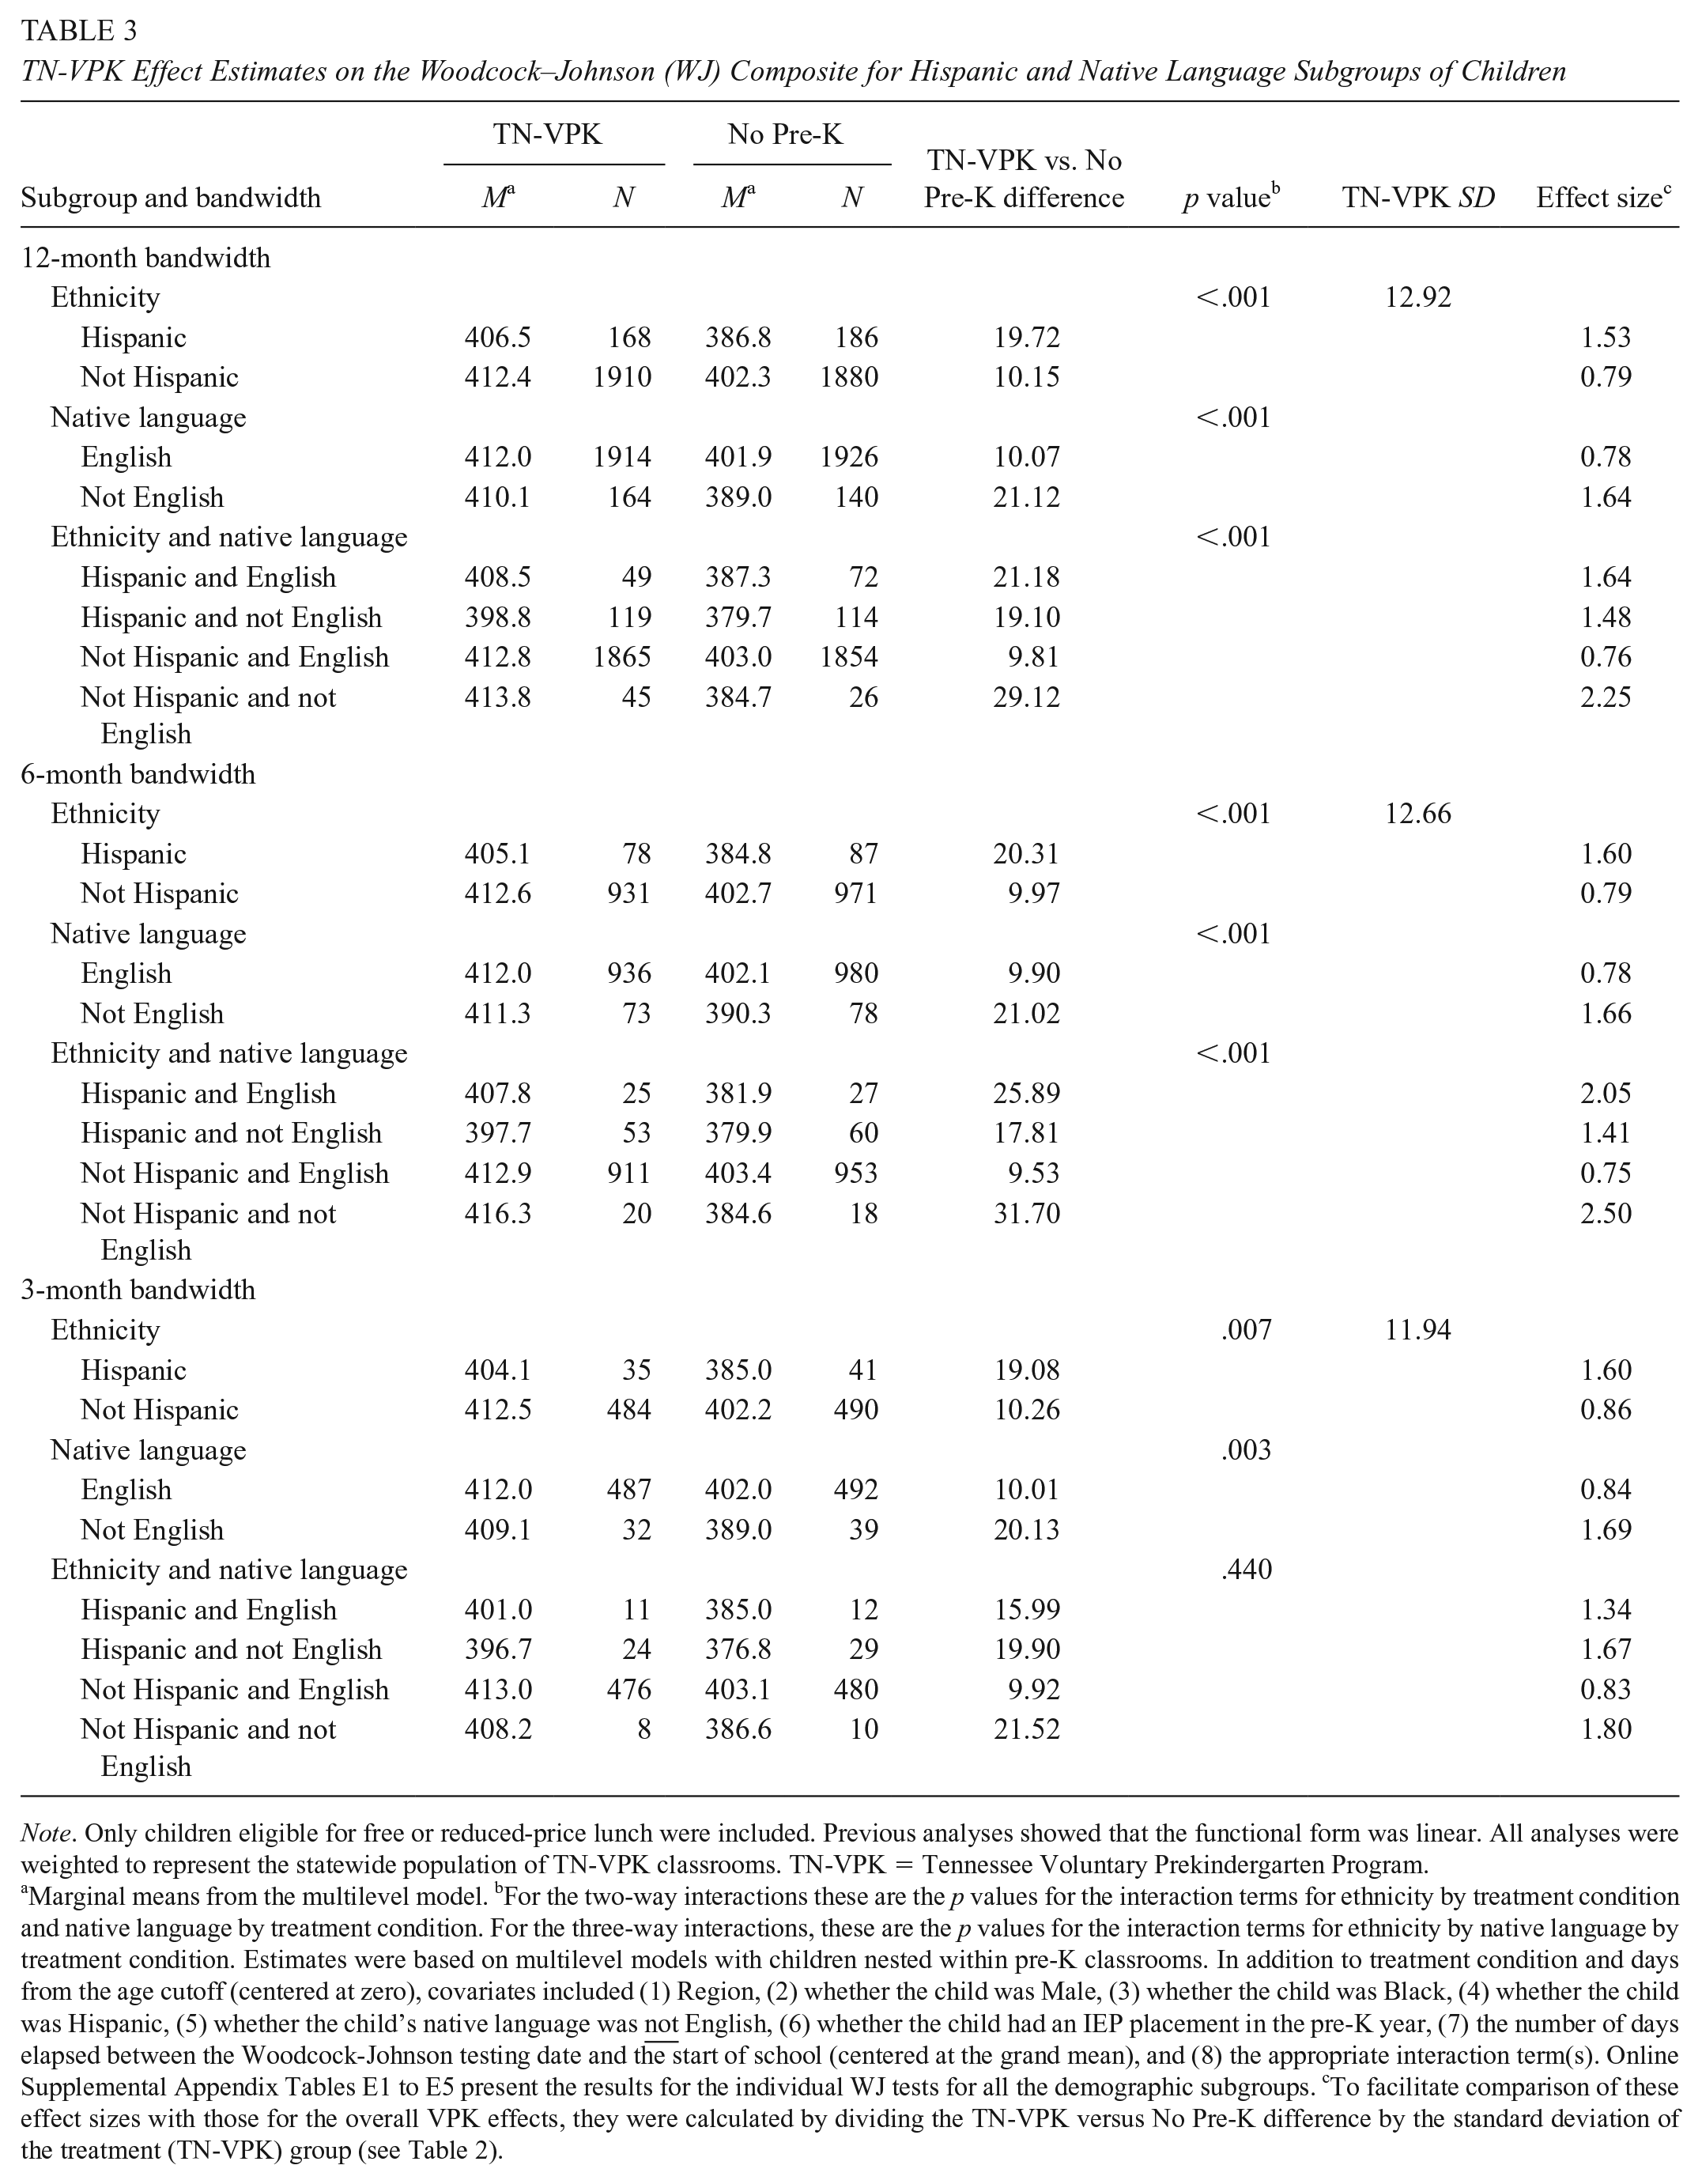
Note. Only children eligible for free or reduced-price lunch were included. Previous analyses showed that the functional form was linear. All analyses were weighted to represent the statewide population of TN-VPK classrooms. TN-VPK = Tennessee Voluntary Prekindergarten Program.
Marginal means from the multilevel model. bFor the two-way interactions these are the p values for the interaction terms for ethnicity by treatment condition and native language by treatment condition. For the three-way interactions, these are the p values for the interaction terms for ethnicity by native language by treatment condition. Estimates were based on multilevel models with children nested within pre-K classrooms. In addition to treatment condition and days from the age cutoff (centered at zero), covariates included (1) Region, (2) whether the child was Male, (3) whether the child was Black, (4) whether the child was Hispanic, (5) whether the child’s native language was
Effects for Non-FRPL Eligible Children
As described earlier, the analytic sample for the results reported above includes only children eligible for the federal FRPL. This departs from some previous pre-K RD studies that included children regardless of FRPL status. There were some differences between FRPL-eligible and noneligible children in the overall sample (Table 4). FRPL-eligible children were more likely to be Black or Hispanic and have a non-English primary language. Although these differences were relatively small, further analyses explored their influence on the VPK effects. Multilevel models were first estimated for the full sample with FRPL eligibility as a covariate. Table 5 summarizes the results (full model results are in online Supplemental Appendix Tables F1 to F7), which were quite similar to those obtained for only FRPL-eligible children. Statistically significant differences favoring VPK were found regardless of bandwidth or outcome measure with the exception of picture vocabulary with the 3-month bandwidth.
Comparison of Baseline Characteristics by Eligibility for Free or Reduced-Price Lunch (FRPL): 12-, 6-, and 3-Month Bandwidth Samples

Note. Children regardless of their FRPL eligibility were included in the analysis. Analyses were weighted to represent the statewide population of TN-VPK classrooms. The race/ethnicity categories are not mutually exclusive; mixed race children are coded in all the categories for their respective mix. IEP indicates special education placement; test lag is time between start of school and testing. TN-VPK = Tennessee Voluntary Prekindergarten Program.
Estimated means from the multilevel models with children nested within classrooms, eligibility for FRPL as the only predictor, and the respective baseline variable as the dependent variable. bFor binary variables, odds ratios were converted into effect sizes, using Chin’s (2000) method. For continuous variables, effect sizes were calculated by dividing the Eligible versus Not Eligible difference by the pooled standard deviation.
Estimates of the Pre-K Effect for the Woodcock–Johnson (WJ) Composite and Individual Tests: Sample of All Children Regardless of Eligibility for Free or Reduced-Price Lunch (FRPL)

Note. The sample sizes for the TN-VPK and No Pre-K groups were 2,621 and 2,567 for ±12 months; 1,280 and 1,322 for ±6 months; and 661 and 673 for ±3 months. Analyses were weighted to represent the statewide population of TN-VPK classrooms. Full results of the multilevel models are reported in online Supplemental Appendix Tables F1 to F7. FRPL = free or reduced price lunch; TN-VPK = Tennessee Voluntary Prekindergarten Program.
Estimated marginal means. bEstimates based on a multilevel model with children nested within pre-K classroom. In addition to days from the eligibility cutoff date (centered at zero), covariates included (1) Region, (2) Male, (3) Black, (4) Hispanic, (5) non-Native English, (6) IEP placement, (7) FRPL eligible, and (8) days between the WJ testing and the start of school (grand mean centered). cEffect sizes are the TN-VPK versus No Pre-K difference divided by the standard deviation of the TN-VPK treatment group.
A second set of models added the interaction of FRPL eligibility and treatment condition with results reported in Table 6. For the 12-month bandwidth, those interactions showed that the VPK effects were significantly larger for FRPL-eligible children on the WJ composite and the individual tests for literacy and math skills. However, no differences reached statistical significance in the analyses with the narrower bandwidths.
TN-VPK Effect Estimates for Woodcock–Johnson (WJ) Scores by Children’s Free or Reduced-Price Lunch (FRPL) Eligibility

Note. Children regardless of their FRPL eligibility were included in the analysis. Analyses were weighted to represent the statewide population of TN-VPK classrooms. TN-VPK = Tennessee Voluntary Prekindergarten Program; IEP = Individual Educational Plan.
Estimated marginal means from the multilevel analysis model. bp value for the interaction term for condition (TN-VPK vs. No Pre-K) and FRPL eligibility. Estimates were based on a multilevel model with children nested within pre-K classroom. In addition to days from the eligibility cutoff date (centered at zero), covariates included (1) Region, (2) Male, (3) Black, (4) Hispanic, (5) non-native English, (6) IEP placement, (7) FRPL eligible, and (8) days between the WJ testing and the start of school (grand mean centered), and (9) the interaction term. cEffect sizes are the TN-VPK versus No Pre-K difference divided by the standard deviations of the TN-VPK treatment groups pooled for the Eligible and Not Eligible subgroups.
Discussion and Conclusions
A strength of the age-cutoff RD design is the relative ease of implementing it in pre-K settings, but it does have limitations. Most notably, this design is essentially a wait-list control that limits assessment of pre-K effects to those appearing shortly after the end of the pre-K year, so the question of sustained effects cannot be investigated. Furthermore, although RD designs in general are capable of yielding unbiased causal impact estimates, a host of methodological criteria must be satisfied for this to be accomplished. In addition, the pre-K age-cutoff version of the RD design has some distinctive characteristics that impose additional demands (Lipsey et al., 2015). These stem primarily from the comparison of two discrete cohorts separated by time as well as age. This circumstance opens the door to cohort differences that may bias the effect estimates, most obviously the possibility of changes in the demographic mix of the children who enroll in pre-K in successive years. Other differences may also be in play, for example, the consistency with which outcome measures are operationalized and administered across the two cohorts, one tested in pre-K, the other in kindergarten, and the possibility of differential attrition in obtaining those measures.
In this RD study, we attempted to address these issues to the extent possible within the practical limitations of field-based research. Meeting the widely recognized formal criteria for RD designs was relatively straightforward. The strict age cutoff for VPK eligibility provided a well-defined and exogenously imposed cut point for differentiating pre-K participants from nonparticipants. A thorough exploration of the functional form of the relationship between age and the outcome measures identified a simple linear model as a good fit for all outcomes. The effect estimates were repeated with different bandwidths around the cut point and varying amounts of data trimming at the extremes of the age range to assess their robustness and neither showed enough variation to call the overall findings into question.
More challenging was the need to ensure the equivalence of the children compared across the cohorts on characteristics potentially related to the outcomes of interest. We were limited to the small set of baseline demographic variables available in the state data system but included those as covariates in the analytic models to statistically adjust for any differences between cohorts on those variables. In addition, we tried to maximize the comparability of the treatment and control cohorts by imposing identical study eligibility criteria. Children were only included in the analytic sample if they were in the same VPK classrooms with the same teacher the year before for the treatment cohort and at the beginning of the current year for the control cohort, save for a few exceptions that arose for practical reasons. Moreover, the children in both cohorts had to have been enrolled within the beginning weeks of their pre-K year, remain enrolled through nearly the end of that school year, and attend a Tennessee public school the year after their pre-K year. The administration of the outcome measures was made as systematic and consistent across cohorts as possible and the elapsed time between the start of the school year and testing was used as a covariate in the analyses. Despite these efforts, a threat to the internal validity of the effect estimates remains in the form of unobserved and uncontrolled differences between the cohorts that would be capable of biasing those estimates.
Immediate Effects of TN-VPK
The findings reported here add to the accumulating body of research on the effects of state pre-K programs on cognitive skills and early educational achievement measured shortly after pre-K participation. Overall, that research has shown almost universally positive effects (Duncan & Magnuson, 2013) with age-cutoff RD designs especially common. The results of the present study fall in line with that overall pattern. The effect size estimates on the WJ Composite measure that averaged scores from the individual tests ranged from 0.83 to 0.91 across the different bandwidths. Effect sizes in standard deviation units can be easily translated into percentile differences when the outcome data are normally distributed, as these are. With the mean of the control group score set at the 50th percentile, an effect size of 0.85, the middle value across the bandwidths, places the mean for TN-VPK participants at the 80th percentile. This represents a rather considerable relative improvement in the measured cognitive skills of the children who participated in TN-VPK program.
The TN-VPK effects, however, varied across the tests measuring literacy, language, and mathematics skills. The largest effects were found for literacy (WJ Letter-Word and Spelling tests). The smallest effects by a substantial margin were found on the language measures (WJ Oral Comprehension and Picture Vocabulary). The effect sizes for the mathematics measures (WJ Applied Problems and Quantitative Concepts) fell in between. In addition, moderator analysis revealed that VPK effects were larger for Hispanic children than non-Hispanic children, and for children whose primary language was not English. The largest effects were found for the relatively small subgroup of children who were not Hispanic but also did not have English as their primary language. The smallest, but still positive effects were found for non-Hispanic native English-speaking children.
While the focus of this study was on children who qualified for FRPL and were thus the priority target group for TN-VPK, the full sample of both FRPL and non-FRPL eligible children included about 25% more children than the FRPL-only sample. Nonetheless, the pattern of results was similar for that more inclusive sample, although the magnitude of the effects was somewhat smaller than for the FRPL-only sample. Taken altogether, the subgroup analyses indicated that VPK effects were larger for children from low-income families (FRPL-eligible) and notably larger for Hispanic children and the overlapping group of children for whom English was not their native language, whether Hispanic or not.
Comparison With the Effects Found in the Parallel RCT
As noted earlier, the RD design was one component of the larger Tennessee Pre-K Study that also included a RCT of outcomes for FRPL-eligible applicants offered admission to oversubscribed VPK program sites compared with those for children waitlisted and ultimately not offered admission. One part of that RCT, the ISS, used the same Woodcock–Johnson achievement measures as the RD study with a sample of consented children tested at the beginning and end of the pre-K year. The ISS was analyzed as a quasi-experiment but had the advantage of an extensive set of baseline measures used as covariates to adjust for the few initial differences between the treatment and control groups. However, as a consented subsample of applicants to oversubscribed program sites, the external validity of those results is uncertain, i.e., their generalization to the statewide population of VPK program sites.
An important feature of the RD component of the Tennessee study is that it is based on a probability sample of the full population of TN-VPK program sites as it existed at the time the study began. In addition, the same Woodcock-Johnson outcome measures used in the ISS were used in the RD study. These circumstances make it possible to directly compare the effect estimates from the two study components. A similar pattern of positive results would be indicative of the external validity of the ISS estimates and any such convergence across the two distinct study components would also be an indication of the robustness of that pattern.
The effect sizes on each of the WJ measures common to the ISS and the RD are compared in Table 7, with the 12-month bandwidth shown for the RD. Because the RD samples represent children who actually participated in VPK, the ISS effect estimates are from the treatment-on-the-treated analysis that defines treatment and control groups in terms of actual participation irrespective of the condition to which the children were originally assigned. Both the RD and ISS samples showed positive VPK effects on all the measures, although that for Oral Comprehension in the ISS is quite small and not statistically significant. Moreover, the effect estimates in both samples are largest for the literacy outcomes with those for the language outcomes among the smallest, and the math outcomes in between. There is thus notable mutual confirmation of the generally positive VPK effects and their pattern across outcome measures between these two study components.
Effect Sizes From the RD Compared With Those From the ISS
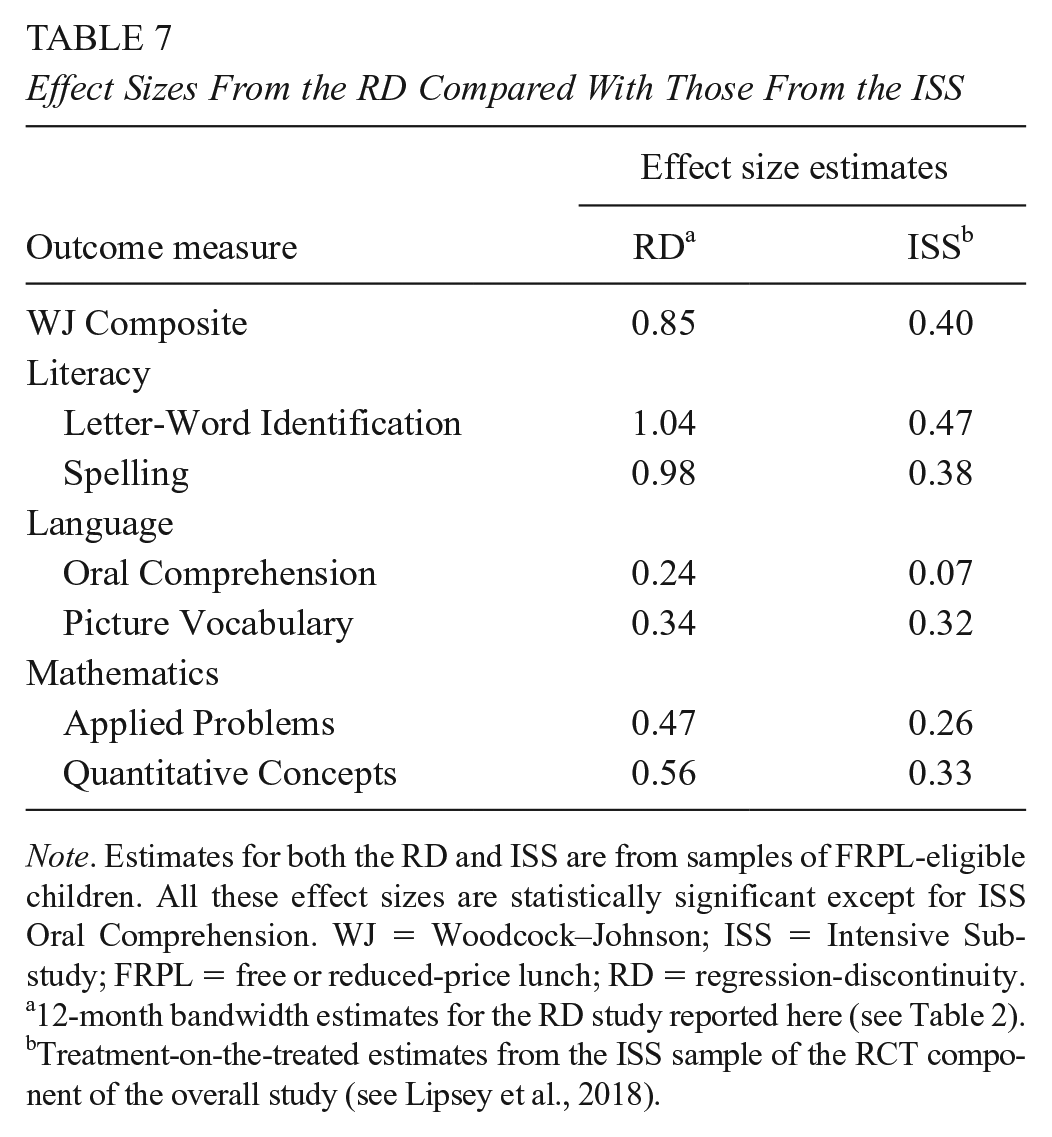
Note. Estimates for both the RD and ISS are from samples of FRPL-eligible children. All these effect sizes are statistically significant except for ISS Oral Comprehension. WJ = Woodcock–Johnson; ISS = Intensive Substudy; FRPL = free or reduced-price lunch; RD = regression-discontinuity.
12-month bandwidth estimates for the RD study reported here (see Table 2). bTreatment-on-the-treated estimates from the ISS sample of the RCT component of the overall study (see Lipsey et al., 2018).
At the same time, there is a rather large difference between the RD and the ISS results in the magnitude of the effect estimates. The RD effect sizes are larger on every measure—more than twice as large for the WJ Composite and some of the individual tests. It is difficult to interpret that contrast given the differences between the sources of the respective estimates. The RD used a probability sample of statewide TN-VPK programs whereas the ISS used a consented subsample of the overall RCT. Also, outcome assessment in the RD occurred at the beginning of the kindergarten year, approximately 12 months after initial pre-K enrollment but at the end of the pre-K school year in the ISS, approximately 9 months after initial enrollment. Moreover, outcome measurement for the control group in the RD came at the beginning of the pre-K year, making the prior 3-year-old period the counterfactual condition. In contrast, outcome measurement for the ISS control group at the end of the pre-K school year made the 4-year-old period the counterfactual condition. The implications of these and other relevant differences between the RD and ISS for the magnitude of the respective effect size estimates are being explored in a separate report.
TN-VPK Effects Compared With Those From Other Pre-K RD Studies
The findings of this RD study, as well as those from the ISS, demonstrate that TN-VPK has been effective in improving the cognitive skills and early achievement of the low-income students it serves in preparation for their entry into kindergarten. As described in the introduction to this report, however, the longer term effects found in the ISS and RCT components of the Tennessee study were not so positive—indeed, they diminished sharply after pre-K, becoming null or even somewhat negative. While the pre-K age-cutoff RD design is limited to estimating immediate pre-K effects, its results do bear on the issue of longer term effects in one important way. In contrast to TN-VPK, studies of the effects of other state pre-K programs have generally found that the positive immediate effects of pre-K were often sustained into the early elementary school years, and even further in some cases (Camilli et al., 2010; Elango et al., 2016).
There are many possible explanations for this contrast, including methodological differences. The longer term findings in the studies of other state programs are based on nonrandomized designs with only the Tennessee study using a randomized control. One plausible explanation, however, is that the quality of the TN-VPK program is distinctly poorer than that of the pre-K programs in other states. There is no consensus on the definition of pre-K program quality and no measures with strong predictive validity for longer term effects (Keys et al., 2013; Sabol et al., 2013), so the comparative quality of the Tennessee program is difficult to judge. TN-VPK is substantially similar in structure to most state programs and, at the time this study began, met 9 of the 10 NIEER standards for pre-K programs (Friedman-Krauss et al., 2020).
One revealing way to view the quality of a pre-K program is in terms of its effectiveness at producing gains over the pre-K year on the cognitive and achievement outcomes widely assessed in pre-K research. The relatively large number of studies of pre-K programs that have used the age-cutoff RD design with some of those widely used outcome measures make it possible to compare their effects. We have identified 18 other pre-K RD studies that can serve as a basis for comparison (details in online Supplemental Appendices G1 and G2). These include evaluations of the state-wide programs in Arkansas, California, Georgia, New Mexico, Michigan, New Jersey, North Carolina, Oklahoma, South Carolina, Virginia, and West Virginia; a county-wide program in Michigan; and city-wide programs in Boston, San Francisco, and Tulsa. The studies vary in how the RD design was implemented and analyzed, and in the nature of the programs and samples of children included. Nonetheless, it is informative to examine the distribution of effect sizes found across these similarly designed studies and, in the present context, to observe where the TN-VPK effects fall in that distribution.
Overall, these RD studies show overwhelmingly positive effects for the pre-K programs studied, especially in the commonly measured outcome domains of literacy, language, and math skills. Figure 10 shows the comparison of the VPK effects with those from these other studies for WJ Letter-Word Identification, Figure 11 for Peabody Picture Vocabulary Test or WJ Picture Vocabulary, and Figure 12 for WJ Applied Problems. The TN-VPK effect sizes shown in these distributions are for the full sample, not the somewhat larger ones for the FRPL-eligible sample that was the focus of this study. Not all the programs represented in these distributions prioritize FRPL-eligible children like TN-VPK does and, indeed, some are universal programs open to all age-eligible children.

Effect size estimates for Woodcock–Johnson (WJ) Letter-Word Identification from age-cutoff regression-discontinuity studies of pre-K programs.
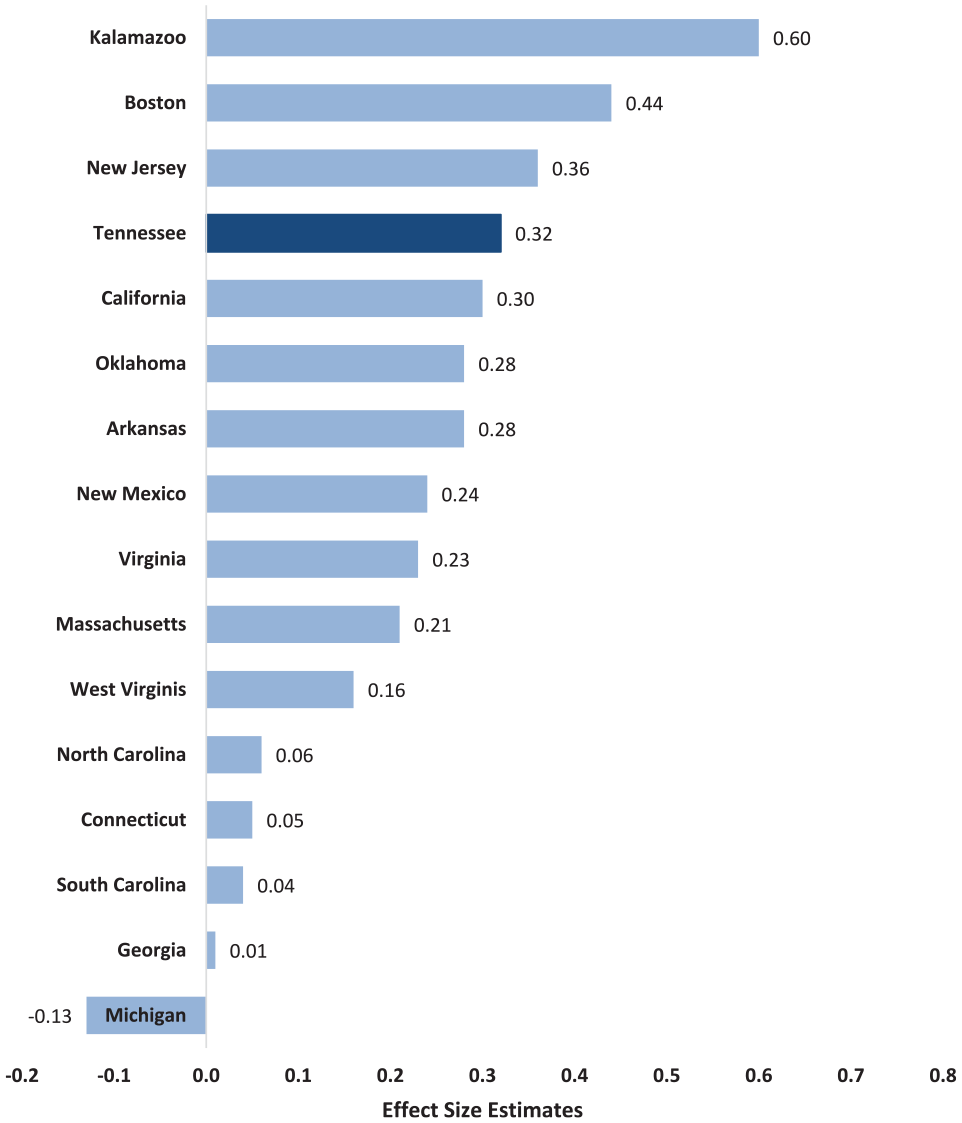
Effect size estimates for PPVT or WJ Picture Vocabulary from age-cutoff regression-discontinuity studies of pre-K programs.

Effect size estimates for Woodcock–Johnson (WJ) Applied Problems from age-cutoff regression-discontinuity studies of pre-K programs.
Figures 10 to 12 reveal the generally positive effects on these measures found for all the pre-K programs studied with the age-cutoff RD design. While acknowledging the methodological and programmatic variation across these studies, it is notable that the TN-VPK effects compare relatively well. TN-VPK is not at the very top of any of these distributions, but it is in the top half in all three, indicating what can be described as an above average performance compared to the peer programs represented. TN-VPK, therefore, cannot be easily discounted as an inferior program despite the disappointing longer term effects found in the randomized components of the Tennessee study that were able to assess the extent to which the pre-K gains were sustained.
What Happened After Pre-K?
Followed over time in the other components of the Tennessee study, the VPK effects on literacy, language, and math disappeared by the end of kindergarten and turned negative by the end of third grade (Lipsey et al., 2018). A common pattern is for pre-K programs to show initial positive effects that then fade out some time afterward (Bailey et al., 2017; Bailey et al., 2020). For TN-VPK, however, the pattern is better described as “catch up.” The children in the control group showed greater gains in kindergarten than the TN-VPK participants such that their scores on the early achievement measures converged on those of the participants. One possible contributor to this pattern may be the content focus of the instruction the children received in pre-K. The skills emphasized in pre-K generally include directly teachable skills in a finite domain, for example, letters of the alphabet, geometric shapes, and cardinal numbers. These have been referred to as “constrained skills” (Snow & Matthews, 2016) that a learner can rather completely master. They are also the skills heavily represented in the age-appropriate items of the typical pre-K outcome measures, especially the literacy and math measures, somewhat less so in the language measures. It is notable in this regard that the RD results in Figures 10 to 12 rather consistently show the largest effects on literacy, smaller ones on math, and the smallest ones on the language measures. Given the nature of these constrained skills, which are also emphasized in kindergarten, it is not surprising that children show similar mastery after the kindergarten year whether or not they participated in a pre-K program.
Continued emphasis on constrained skills in kindergarten that are redundant with what children experienced in pre-K (Engel et al., 2013; Claessens et al., 2014) risks boredom and disengagement by those students. For the TN-VPK randomized sample, we see some indication of this in teacher ratings of feelings about school that are significantly lower for the VPK participants than the nonparticipants at the end of first grade. This is a possible contributor to the slide into negative effects in the later grades for these students.
Unconstrained skills such as vocabulary, comprehension, and mathematical reasoning, by contrast, receive less attention in pre-K and kindergarten but over time become increasingly important for academic performance (Snow & Matthews, 2016). However, the modest enhancement of those skills found for TN-VPK on the language and math measures would only facilitate positive achievement gains in the later grades if they were supported and sustained in those later grades. For this to happen, the students must experience high quality learning environments that provide such support.
Pearman et al. (2020) examined this “sustaining environments” hypothesis (Bailey et al., 2017) for the TN-VPK randomized sample by investigating differential achievement effects for students attending higher quality elementary schools and/or being exposed to higher quality teachers between kindergarten and third grade. Using Tennessee school and teacher evaluation data, they found that VPK participants enrolled in higher quality elementary schools and exposed to a succession of especially effective teachers showed positive effects on the state language arts and math achievement tests relative to their counterparts in the control group. Conversely, the VPK participants without such sustaining environments had lower scores than their counterparts on those achievement tests, that is, showed the negative effects that appeared for the overall sample. The predominance of those negative effects follows from the fact that, sadly, only 12% of these low-income students in the overall sample experienced both high quality schools and highly effective teachers. Here also we have a possible clue to the source of the unexpectedly negative longer term effects of VPK participation.
Conclusions
What is most clearly demonstrated in this RD study is that the TN-VPK program, viewed statewide, has positive effects on cognitive skills that are generally viewed as supporting school readiness. Moreover, the effects compare favorably with those found in pre-K RD studies of programs in other states and localities. These findings do not support the view that the longer term negative effects on achievement found in the randomized component of the Tennessee study stem from a distinctively poor quality pre-K program. We can only speculate about the nature of the interaction between the TN-VPK experience and the experience those children had in later grades that resulted in the longer term negative effects. The evidence available to date highlights redundant content in kindergarten that diminishes positive feelings about school combined with the lower quality schools and teachers most of these students experience in the later grades as likely factors.
Supplemental Material
sj-docx-1-ero-10.1177_23328584211041353 – Supplemental material for Impact of the Tennessee Voluntary Prekindergarten Program on Children’s Literacy, Language, and Mathematics Skills: Results From a Regression-Discontinuity Design
Supplemental material, sj-docx-1-ero-10.1177_23328584211041353 for Impact of the Tennessee Voluntary Prekindergarten Program on Children’s Literacy, Language, and Mathematics Skills: Results From a Regression-Discontinuity Design by Georgine M. Pion and Mark W. Lipsey in AERA Open
Footnotes
Acknowledgements
Without the partnership of the Tennessee Department of Education, this study would not have been possible. We are especially grateful to Connie Casha and Bobbi Lussier, TN-DOE administrators who provided critical support when the project was launched. The Tennessee Education Research Alliance at Vanderbilt has provided invaluable assistance for obtaining and interpreting data from the Tennessee education data system. We would also like to gratefully acknowledge the numerous members of the research team who have contributed greatly to this project over many years: Dale Farran (co–principal investigator), Kerry Hofer, Carol Bilbrey, Janie Hughart, Ilknur Sekmen, Nianbo Dong, and the many data collectors who worked across the state. The research reported here was supported by the Institute of Education Sciences, U.S. Department of Education, through grant R305E090009 to Vanderbilt University. The opinions expressed are those of the authors and do not represent the views of the Institute or the U.S. Department of Education.
Notes
Authors
GEORGINE M. PION is a research associate professor of psychology and human development, Vanderbilt University (retired). Her research interests are human resource policy, particularly as it pertains to the education, training, and employment of scientists and clinical personnel.
MARK W. LIPSEY is a research professor of public policy in human and organizational development, Vanderbilt University. His research interests are program evaluation methodology, meta-analysis, and programs for at-risk children and youth.
References
Supplementary Material
Please find the following supplemental material available below.
For Open Access articles published under a Creative Commons License, all supplemental material carries the same license as the article it is associated with.
For non-Open Access articles published, all supplemental material carries a non-exclusive license, and permission requests for re-use of supplemental material or any part of supplemental material shall be sent directly to the copyright owner as specified in the copyright notice associated with the article.