
Abstract
High school GPAs (HSGPAs) are often perceived to represent inconsistent levels of readiness for college across high schools, whereas test scores (e.g., ACT scores) are seen as comparable. This study tests those assumptions, examining variation across high schools of both HSGPAs and ACT scores as measures of academic readiness for college. We found students with the same HSGPA or the same ACT score graduate at very different rates based on which high school they attended. Yet, the relationship of HSGPAs with college graduation is strong and consistent and larger than school effects. In contrast, the relationship of ACT scores with college graduation is weak and smaller than high school effects, and the slope of the relationship varies by high school.
Keywords
High school course grades are critical indicators of academic performance for students, educators, and institutions of higher education. Yet, standardized test scores are often seen as more reliable and objective indicators of academic preparation than students’ grades because all students are judged based on the same tasks under the same conditions. All states use standardized tests to judge students’ progress toward college readiness goals, with 45 states using ACT or SAT scores (Nayar, 2015). The use of standardized test scores to monitor students’ college readiness is recommended clearly in the What Works Clearinghouse practice guide on how to prepare students for college, whereas HSGPAs are discussed as one piece of performance data to consider, along with curriculum and assessments (Tierney et al., 2009). A key assumption behind the emphasis on test scores in policy and practice is that college entrance exams are strong and consistent measures of readiness. Yet, the emphasis on test scores over grades in policy and practice recommendations stands in contrast to research showing high school grade point averages (HSGPAs) are stronger predictors than test scores of college outcomes (Bowen et al., 2009; Geiser & Santelices, 2007; Hiss & Franks, 2014; Kobrin et al., 2008).
In this study, we directly addressed questions about the variability in HSGPAs across high schools as predictors of college readiness, examining whether students with the same HSGPAs are systematically more likely to graduate college if they came from particular high schools and whether the slope of the relationship differs by high school. We then conducted the same tests with ACT scores; they are generally assumed to be equivalent, but we are not aware of any published evidence that this is the case. We also discerned the extent to which there are high school effects on college graduation that are not captured in either students’ HSGPAs or ACT scores.
Prior Literature on the Reliability of Course Grades Across Schools and Validity of Tests
Numerous publications give the impression that course grades are not reliable measures of achievement in comparison with test scores. For example, the introduction of a new book on testing and college admissions states: Proponents assert that standardized admissions tests provide a neutral yardstick to assess the performance and promise of students from secondary schools whose course offerings differ widely in variety and rigor. This is a particularly salient point in an era of widespread grade inflation. (Buckley et al., 2018, p. 2–3)
Likewise, the introduction of a new report by the Fordham Foundation expressed concern that teachers’ grades do not reflect state standards and wondered how to help parents put more faith in test scores as measures of their students’ readiness instead of relying so much on grades (Northern & Petrilli, 2018). These documents reflect current beliefs, which are echoed in the emphasis placed on test scores in policy and in practice recommendations, described previously, and often inferred without evidence in research studies.
Grades Can Be Seen as Noncomparable Across Schools Because They Are Based on Criteria Developed by Individual Teachers in Schools With Different Curricula
Grades are assigned based on a potentially wide-ranging array of tasks, measured over time, capturing academic knowledge, skills, behaviors, and effort and incorporating teacher judgment (Bowers, 2011; Brookhart et al., 2016; Farkas et al., 1990; Kelly, 2008). The fact that grades are based on a wide range of factors with judgment from many different teachers makes them potentially highly variable across contexts. At the same time, the fact that they are based on a large number of raters (teachers) across a wide range of relevant tasks could actually make them very reliable as indicators of academic readiness for college, where students will also be asked to do a range of tasks with different expectations assessed by many different instructors.
There is no reason to believe a priori that tests would necessarily be more reliable than grades as predictors of college performance. Standardized tests assess students on a narrow range of skills (mostly a subset of what students learn in English and math classes) in one type of condition (a timed test), whereas colleges expect students to have broad knowledge and skills across many subjects and to show consistent effort in different types of assignments over months at a time. Schools could prepare students for the tests in very different ways (see Koretz, 2017), with different implications for their students’ readiness for college.
Moderate Correlations With Test Scores Are Often Used as Evidence of Unreliability in Grades
People sometimes make the argument that grades are “inflated” or “subjective” based on evidence that HSGPAs have increased over time without concurrent changes in test scores (Camara et al., 2004; Gershenson, 2018; Godfrey, 2011; Hurwitz & Lee, 2018) or that students with the same test scores have different HSGPAs at different schools (U.S. Department of Education, 1994; Woodruff & Ziomek, 2004). Pattison et al. (2013) described some of the conceptual flaws in the argument that grades should align tightly with standardized test scores and suggested focusing instead on the predictive validity of each for later outcomes. Because they measure different aspects of achievement, it is possible for one to change without a change in the other.
Evidence about the validity of standardized test scores as measures of college readiness has its own weaknesses, making it questionable to use standardized tests as a metric for judging the reliability of grades. SAT and ACT validitation studies tend to be based on improvement in the prediction of college freshman GPAs when test scores are used together with student-reported HSGPAs relative to models that use student-reported HSGPAs alone (e.g., Kobrin et al., 2008; Noble & Sawyer, 2002; Woodruff & Ziomek, 2004). Researchers argued that because test scores improve the prediction of college freshman GPAs over and above student-reported HSGPAs, they are valid indicators to adjust for inconsistencies in HSGPAs. However, student-reported HSGPAs are more weakly correlated with college freshman GPAs than unweighted HSGPAs taken from transcripts (Geiser & Santelices, 2006; Kuncel et al., 2005; Zwick & Himelfarb, 2011); the studies likely overestimated the value that test scores provide.
Studies based more heavily on HSGPAs from transcripts than student reports suggest test scores provide little improvement in the prediction of college outcomes. Using data from a large sample of colleges across the country, Bowen et al. (2009) found the relationship of SAT and ACT scores with college outcomes was small and sometimes not significant (depending on institution type), controlling for HSGPAs and comparing students in the same colleges. In contrast, HSGPAs had a strong relationship with college outcomes controlling for students’ test scores. Hiss and Franks (2014) concluded that students in test-optional colleges who did not submit test scores had similar or better college outcomes than students in the same colleges with similar HSGPAs who did submit scores even though their scores on standardized tests were much lower. Using data from California universities, Rothstein (2004) found that most of the relationship of SAT scores with college GPA could be attributed to high school poverty, school racial composition, and student background.
Grades Are Lower in Harder Classes With Stronger Peers, and This Suggests Inconsistency in HSGPAs
A number of studies have discerned what are called “frogpond” effects (Attewell, 2001), where students with similar prior test scores, academic performance, or effort receive lower grades in classrooms and schools of predominantly high-achieving students compared to those with lower-achieving students (Barrow et al., 2016; Farkas et al., 1990; Nomi & Allensworth, 2009). Students also tend to get lower grades in classes that are intentionally designed to be challenging, such as Advanced Placement and Honors courses (Sadler & Tai, 2007).
Differences in the types of classes that students take and the expectations associated with the peer composition introduce “noise” into the metric of HSGPAs as an indicator of academic performance in high school. ACT and SAT validity studies claim that students’ test scores can be used to adjust for different standards and expectations at different schools. There is a need to evaluate that claim using data on HSGPAs from transcripts. It is possible that the overall achievement level in a student’s school—information that is publicly available—might be just as useful, or more useful, than individual students’ test scores. Two prior studies noted that the size of the relationship between HSGPA and college outcomes (graduation or college GPAs) is larger among students within the same high school (i.e., when high school fixed effects are used in a model) than across schools (Bowen et al., 2009; Koretz & Langi, 2018). They interpreted this as meaning that HSGPA represents a higher level of achievement at some schools than others, which would be consistent with the frogpond effects discussed previously, and suggested adjusting for these differences with information on school average achievement.
Different College Outcomes for Student Subgroups With the Same HSGPAs Have Been Used as Evidence of Different Grading Standards
Other studies suggested that HSGPAs are inconsistent measures of achievement across high schools because HSGPAs predict that Black and Latino students and students from low socioeconomic status (SES) high schools will receive higher college grades than they actually do (Zwick, 2013; Zwick & Himelfarb, 2011). The researchers suggested that this discrepancy results from differences in the quality of high schools attended by students and showed that school average poverty, used as a proxy for school quality, accounts for some of the differences. They did not conduct equivalent tests of SAT scores to see if similar or larger discrepancies by race or school poverty would occur with prediction models that use SAT scores alone. They also found discrepancies to be much smaller when they used HSGPAs from transcripts rather than student-reported HSGPAs. Their arguments hold if one is to believe that race, ethnicity, and SES do not affect college success in ways unrelated to academic readiness. There are many reasons to believe this is not true, and studies have shown that SAT and ACT scores also overpredict college performance for the same groups (Bridgeman et al., 2000; Noble, 2004; Rothstein, 2004). However, this does suggest that it is important to compare students with similar backgrounds when evaluating the validity of HSGPAs or test scores as indicators of college readiness and that there may be high school effects on students’ college outcomes that need to be better understood.
High Schools Could Affect College Outcomes in Many Ways That Are Not Reflected in Either Students’ HSGPA or Test Performance
High schools might develop structures to prepare students with more “college knowledge” to navigate the postsecondary realm (Conley, 2008; Hoxby & Turner, 2015), provide a more diverse environment that teaches students to adjust to new situations and people (Tam & Bassett, 2004), or provide many other types of enrichment opportunities. Fletcher and Tienda (2010) found that high school fixed effects explained half or more of the differences in college GPA and graduation by students’ race and ethnicty, sometimes reversing the relationships. Such high school effects could make it appear that HSGPAs have different value in some schools than others—when there are simply other factors about high schools that also matter for college success.
Contributions of This Study and Research Questions
In this study, we compare the strength and consistency of HSGPAs as predictors of college graduation across high schools with ACT scores, adding to the current literature in a number of ways:
We began by identifying the extent to which the relationship of each achievement indicator depends on the high school a student attends:
Research Question 1: How different are college graduation rates (6 years after initial enrollment) for students with the same HSGPAs/ACT scores who come from different high schools?
We then compared the size and consistency of the relationships of HSGPAs and ACT scores with college graduation and examined whether including students’ ACT scores in the prediction of college graduation substantially reduces inconsistency across high schools over using HSGPA alone:
Research Question 2: Do ACT scores provide a stronger or more consistent prediction of college readiness across high schools than HSGPAs?
Research Question 3: Is there less high school variance in college graduation rates in models that use students’ ACT scores and HSGPAs together than models that use HSGPAs alone?
We then showed the extent to which information about high schools (school poverty, average ACT scores, average HSGPA) explain high-school-level variation.
Research Question 4: To what extent are high school differences in college graduation rates for students with the same HSGPAs and ACT scores explained by school characteristics?
Finally, we replicated the analysis on related outcomes that are relevant to school practitioners preparing students for college—4-year graduation, college enrollment, and college quality (measured with the institutional graduation rate).
Research Question 5: How large and consistent are the relationships of ACT scores and HSGPAs with enrollment in a 4-year college and with graduation rates after 4 years?
Research Methods
This study used data from the Chicago Public Schools, a large public school district that contains schools with varying academic composition—extremely high-achieving selective schools that get ranked among the top high schools in the country, heterogeneous schools, and schools with very low average test scores. We included for analysis all students who graduated from neighborhood, magnet, selective, and vocational high schools between the years of 2006 and 2009; enrolled in a 4-year college immediately following graduation; and had complete data (n = 17,753). 1 Table 1 provides summary statistics of the analytic group and variables used in the models. For the analysis of enrollment in a 4-year college, we included all high school graduates from these cohorts (n = 55,084).
Descriptive Statistics of Variables Used in the Models
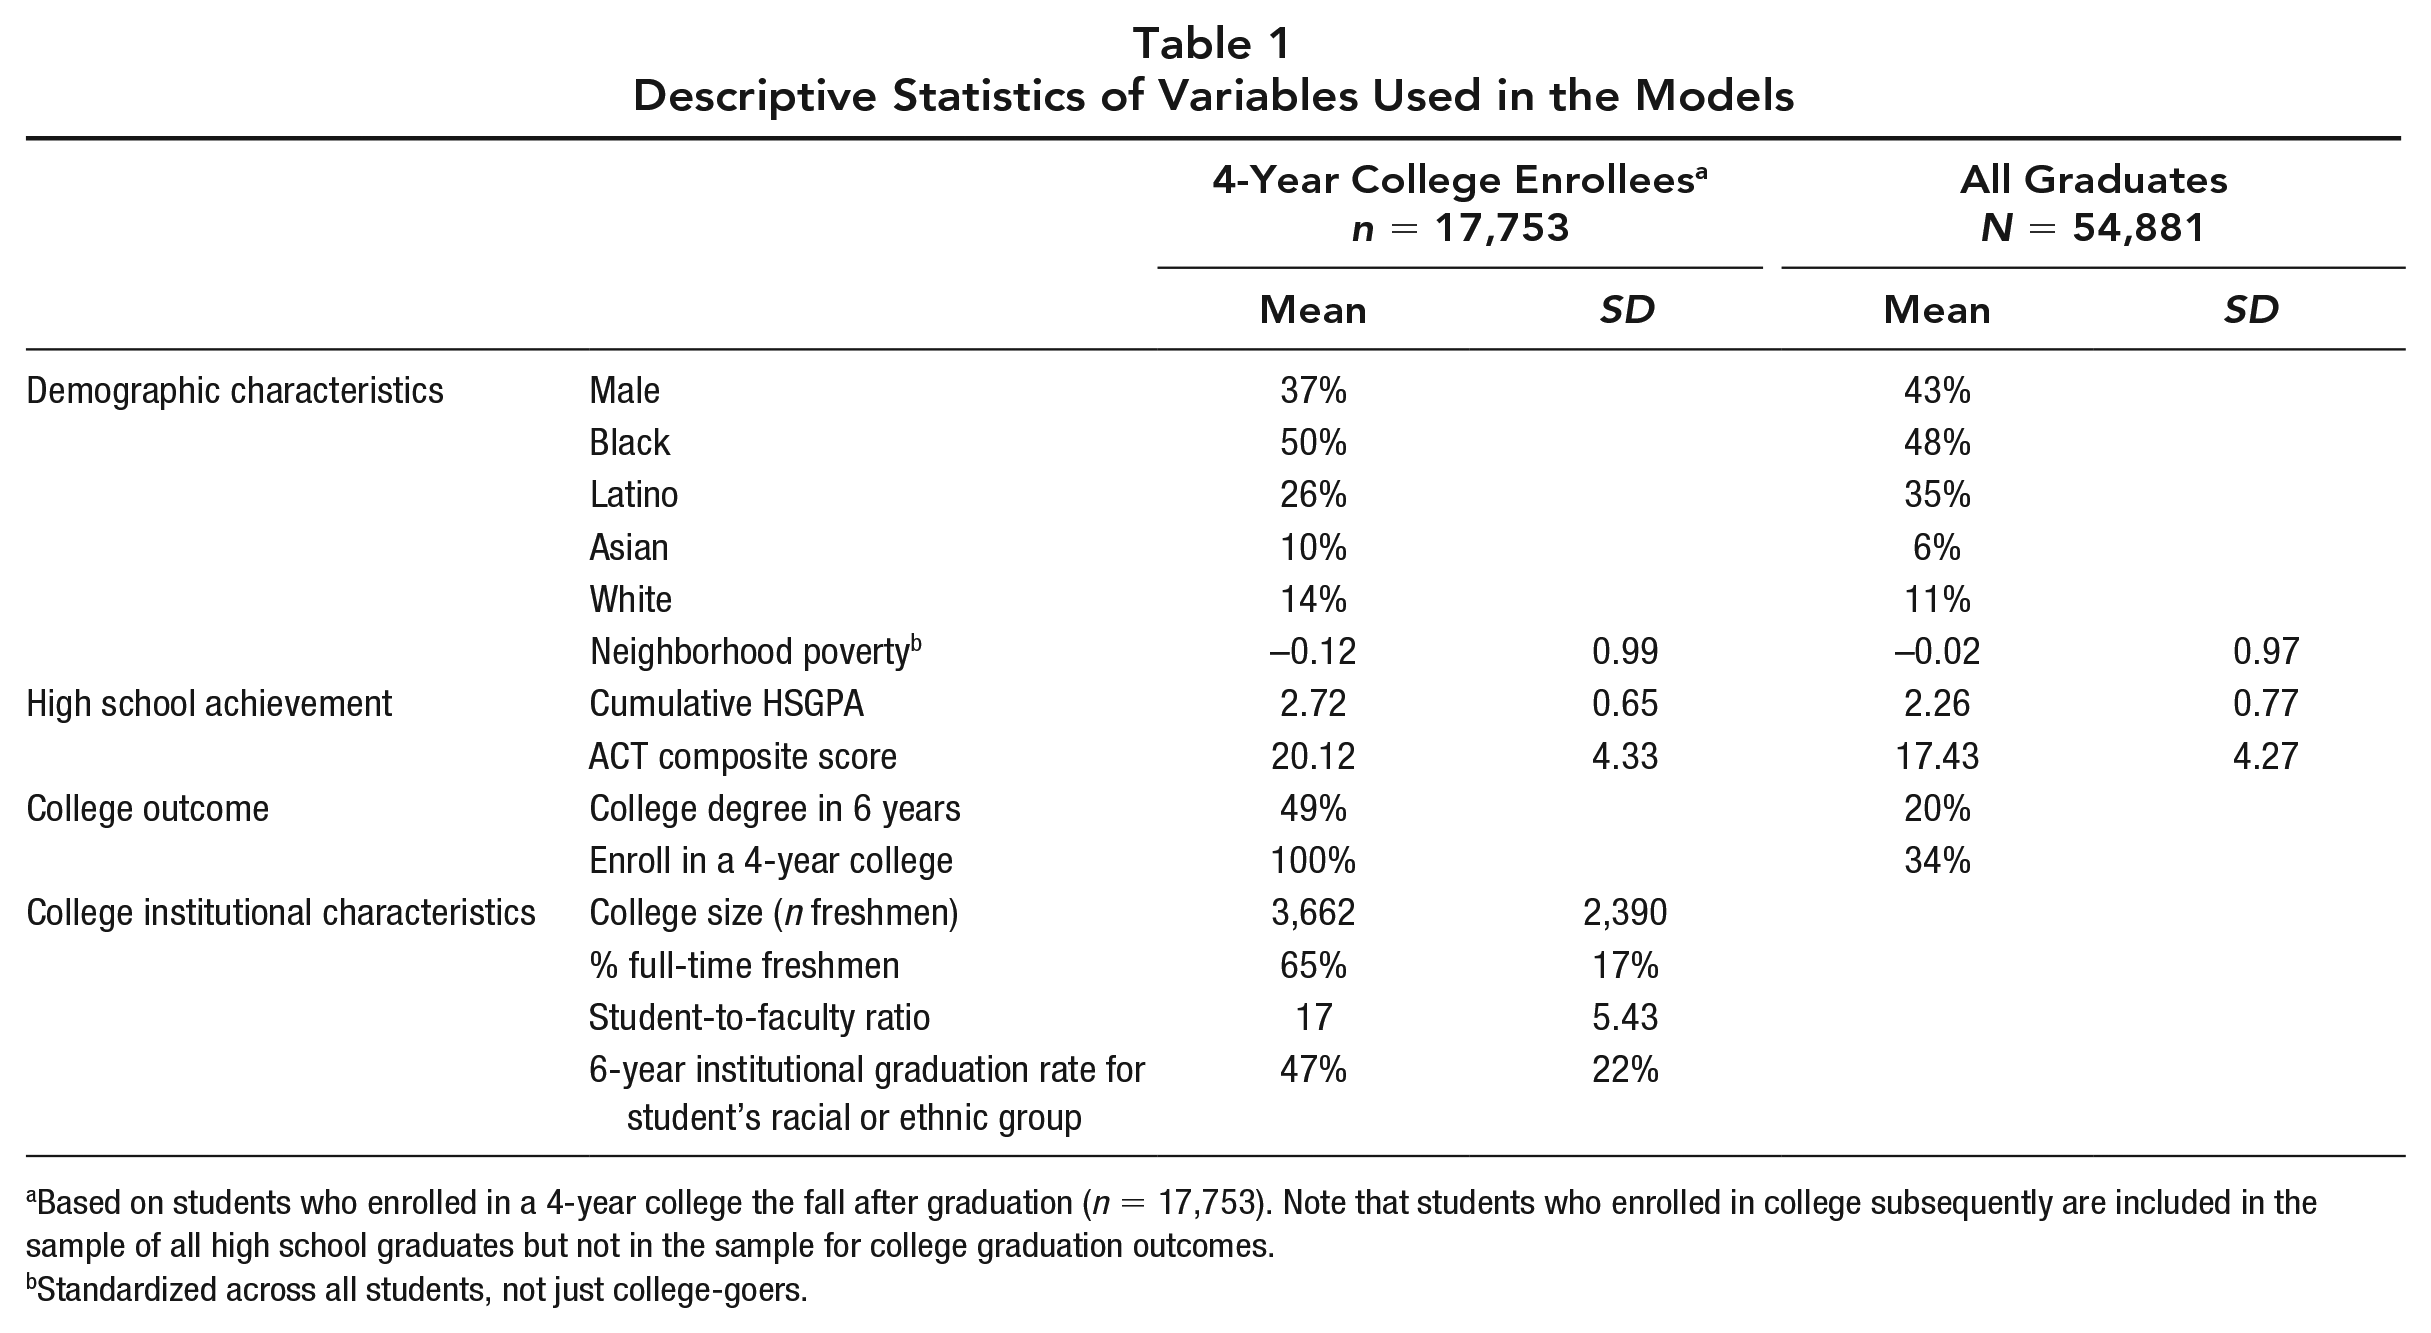
Based on students who enrolled in a 4-year college the fall after graduation (n = 17,753). Note that students who enrolled in college subsequently are included in the sample of all high school graduates but not in the sample for college graduation outcomes.
Standardized across all students, not just college-goers.
For most of our analyses, we only included students who enrolled in a 4-year college so as not to confound enrollment in college with ability to succeed in college once enrolled. Because college admissions use HSGPAs and ACT scores to determine who is accepted, those measures will be related to college graduation simply because they provide access to more resourced schools regardless of whether they indicate readiness to succeed once enrolled. By comparing only students who enrolled in college and controlling for institutional characteristics (described in the following), we focused on the extent to which the HSGPAs and ACT scores were indicators of students’ likelihood of succeeding once in college, not the degree to which they were signals to admissions officers. However, because the results have implications for the degree to which high school educators focus on GPAs or test scores to prepare students for college, we also replicated the analysis with college enrollment as the outcome.
Data and Variables
Data on academic performance and student demographic information (gender, race, and ethnicity) came from district administrative data sets. We obtained economic information on students’ residential neighborhoods by linking students’ addresses to information from the U.S. census at the level of block groups on the percentage of adult males employed and the percentage of families with incomes above the poverty line. HSGPAs were created by coding grades in students’ transcripts 0 through 4 (F–A) and creating an unweighted average of all courses completed in high school. At the time the students were in high school, all students in Illinois took the ACT during the spring of the 11th grade. College enrollment records and 6-year graduation outcomes were obtained through the National Student Clearinghouse. Students were included for the prediction of college graduation if they had full-time enrollment records in a 4-year college during the fall term after they graduated high school. Six-year college graduation is defined as earning a 4-year college degree within 6 years of graduating from high school.
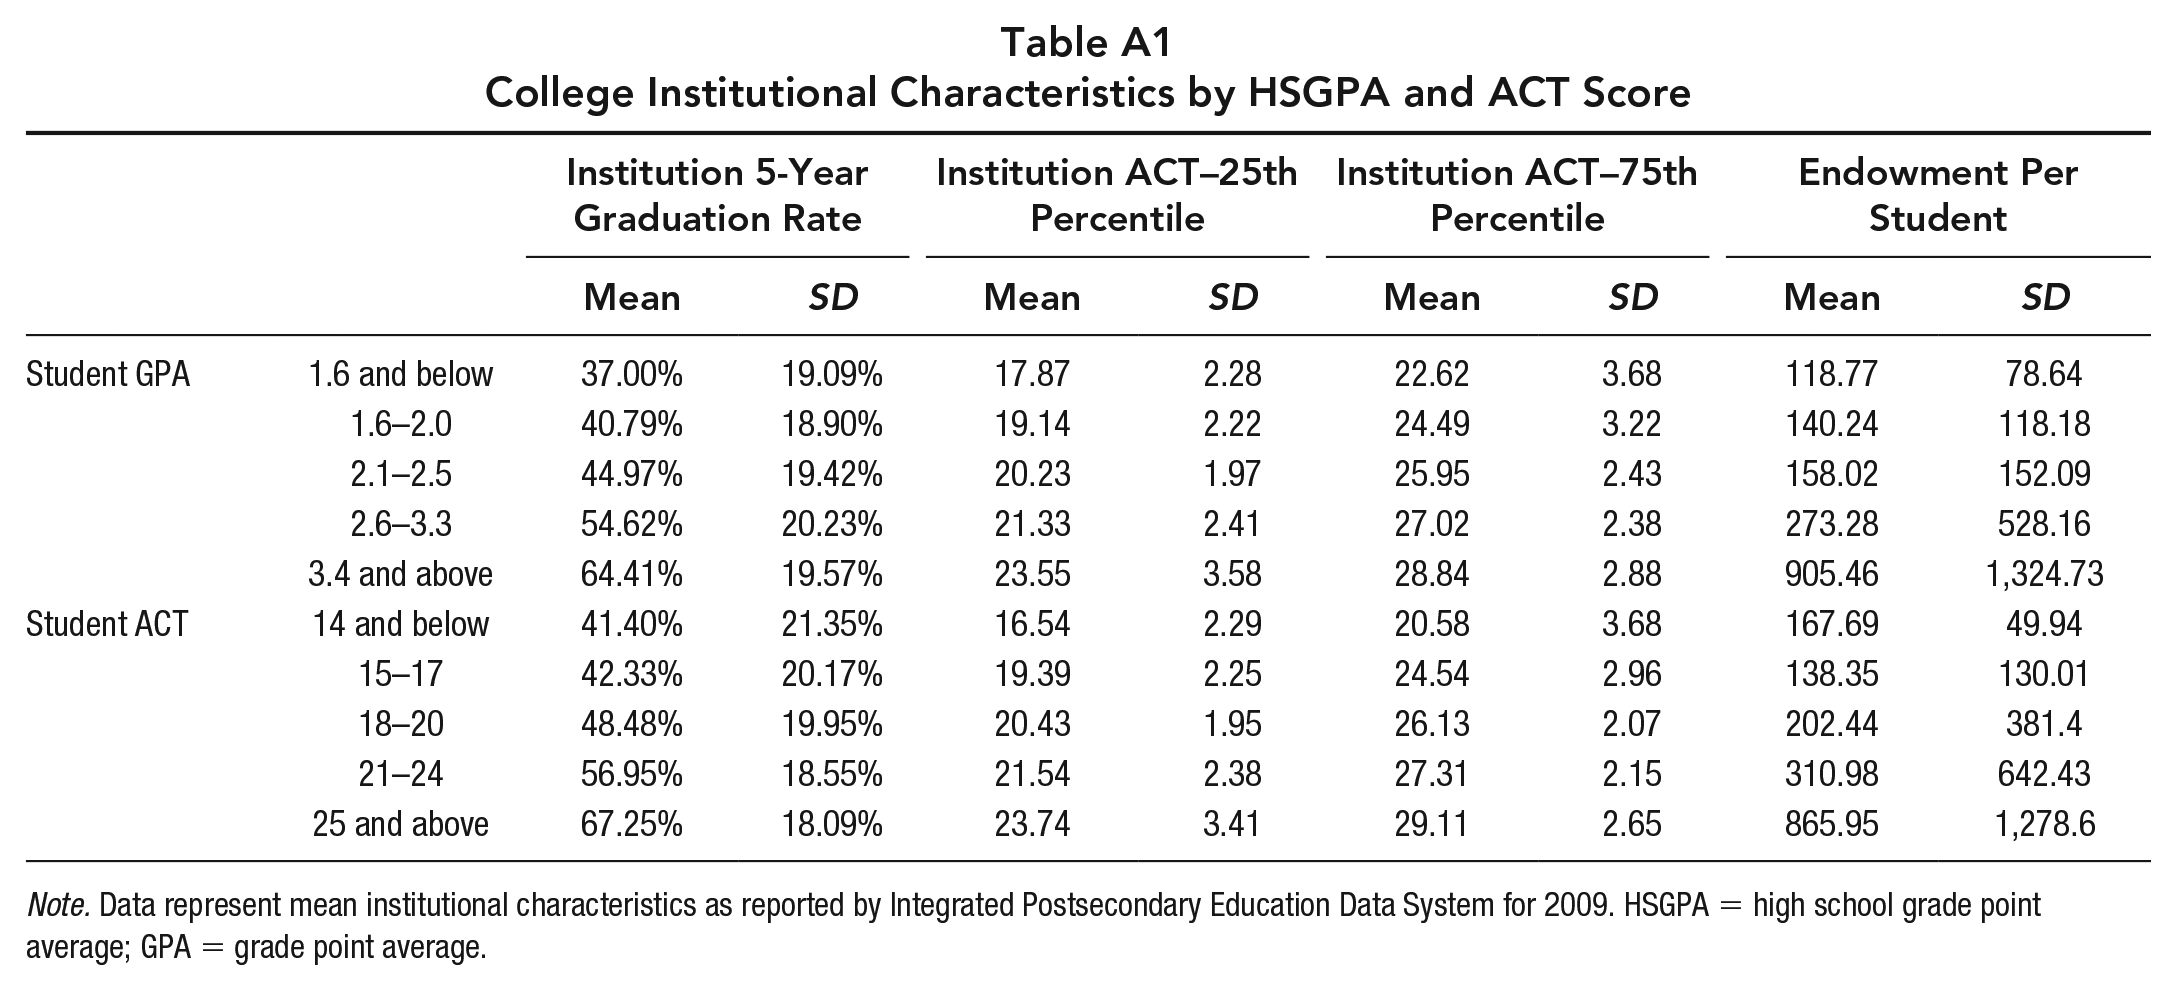
Colleges offer different supports and structures that influence whether students graduate (Bowen et al., 2009; Cohodes & Goodman, 2012; Kurlaender & Grodsky, 2013). In general, there are strong relationships of both HSGPA and ACT score with institutional characteristics, see Table A1 in the Appendix. Because colleges use HSGPAs and ACT scores for decisions about college enrollment, it is important to control for college characteristics so as not to confound the signal that HSGPAs and ACT scores give to admissions officers with the degree to which they represent readiness once enrolled in college. We did this by including information on colleges obtained through the Integrated Postsecondary Education Data System (IPEDS) as covariates: the race- or ethnicity-specific 6-year institutional graduation rate of the college (matched to the race and ethnicity of the student), college size (number of undergraduate students), the percentage of freshman students who are full-time, and the student-to-faculty ratio. We used the institutional information from 2009, the year the last cohort would be making decisions about college, for which the 6-year institutional graduation rates represent students who began college in 2003. Note that students in our sample make up only a small fraction of the students at any college and might differ considerably from typical students at the college they attend.
Methods
We estimated the variance in college graduation rates by high school using hierarchical linear and nonlinear models, with students nested within high schools. We considered using cross-nested models with students simultaneously nested within their high school and college or controlling for college fixed effects. However, students in our analysis group matriculated to more than 500 different 4-year colleges across the United States, and at many of these colleges, there was only a small number of students. This resulted in imprecise estimates of college effects for a large proportion of the sample through these other methods.
For Research Question 1, we used two different methods of estimating variation in college graduation rates by high school for students with the same HSGPA/ACT score. First, we used a series of dummy variables to model the relationship between HSGPA and college graduation nonparametrically. There is no intercept, so the coefficient for each HSGPA dummy variable represents the average college graduation rate for students in that HSGPA group. We allowed the coefficients to vary by high school to identify the variation in college graduation rates across high schools for students with the same HSGPAs. These same models were then repeated with student ACT bins in lieu of HSGPA bins. Coefficients for other covariates were fixed across schools, predicting the log odds of graduating from a 4-year college in 6 years:
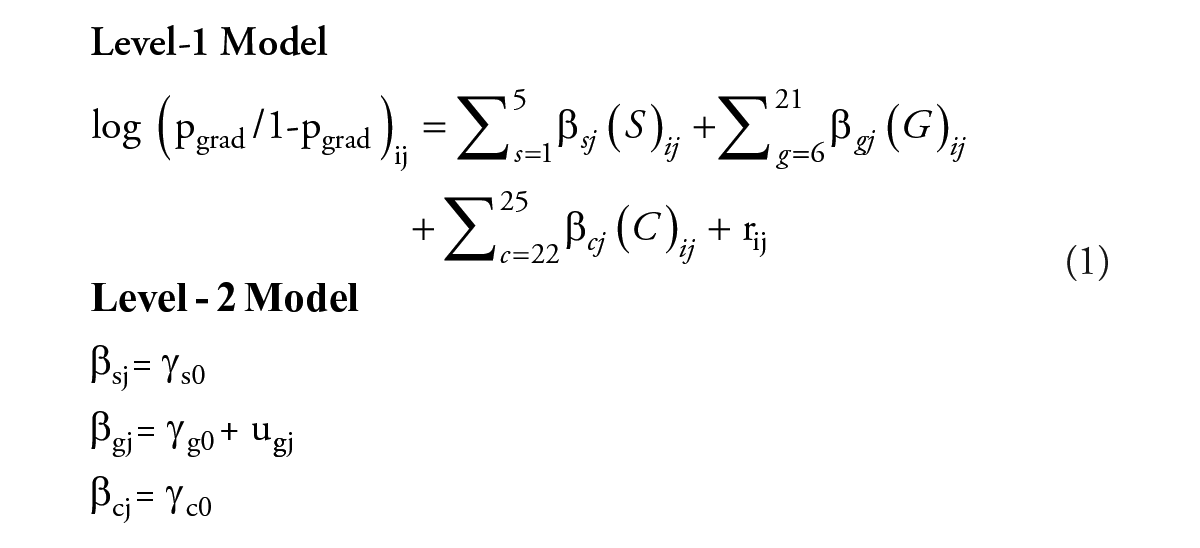
S is a vector of student background variables (neighborhood poverty, male, Black, Latino, and Asian).
G is a vector of dummy variables representing HSGPA bands.
C is a vector of college institutional variables.
ugj is the high-school-level variance in college graduation rates for students in the HSGPA band, controlling for student background and college institutional variables.
The aforementioned method assumes no particular functional form. However, because students with different levels of achievement are not evenly distributed across schools, not all high schools have students in all achievement bands. Therefore, we only calculated school-level random effects for bands in which at least 95% of schools were represented.
We also ran models that used standardized continuous versions of HSGPAs and ACT scores rather than the binned variables and calculated the average school effect across all achievement levels. These models include a squared term because the relationship of each achievement measure is slightly quadratic:
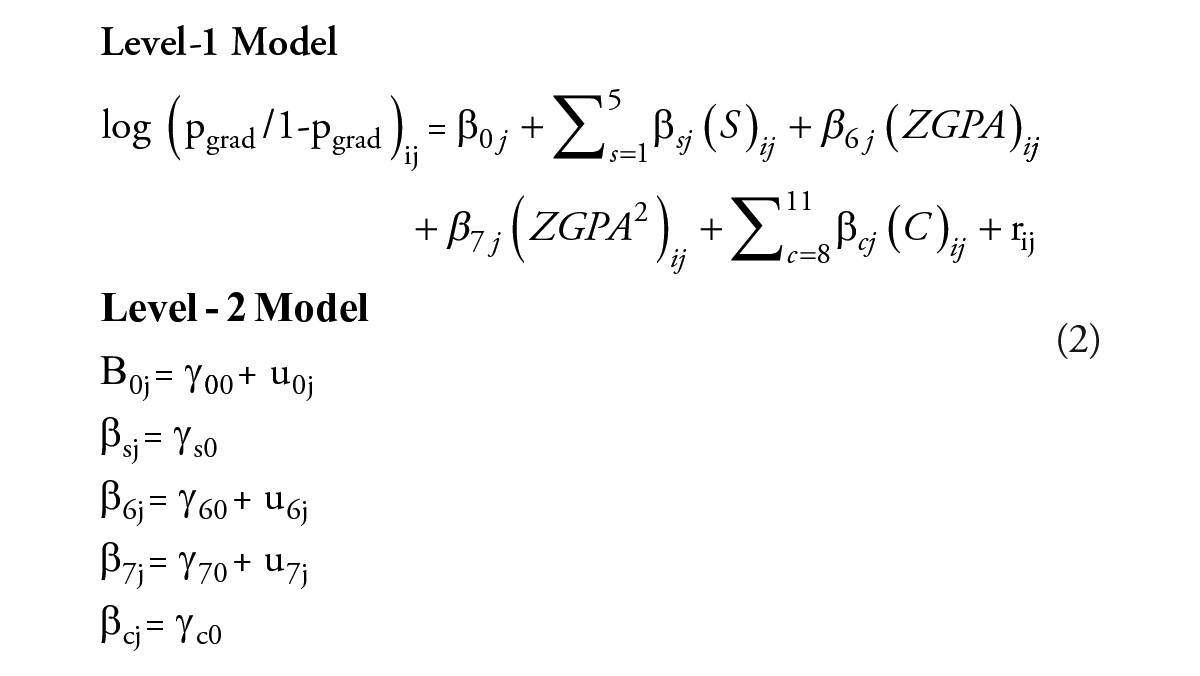
In Equation 2, u0j is the high-school-level variance in college graduation rates, controlling for students’ HSGPAs, student background variables, and the institutional characteristics of the colleges in which they enroll. Variance components on the slopes, u6j and u7j, show variation in the size of the relationship of HSGPA with college graduation across high schools—whether grades are stronger measures of college readiness at some schools than others. Equation 2 was replicated with ACT scores.
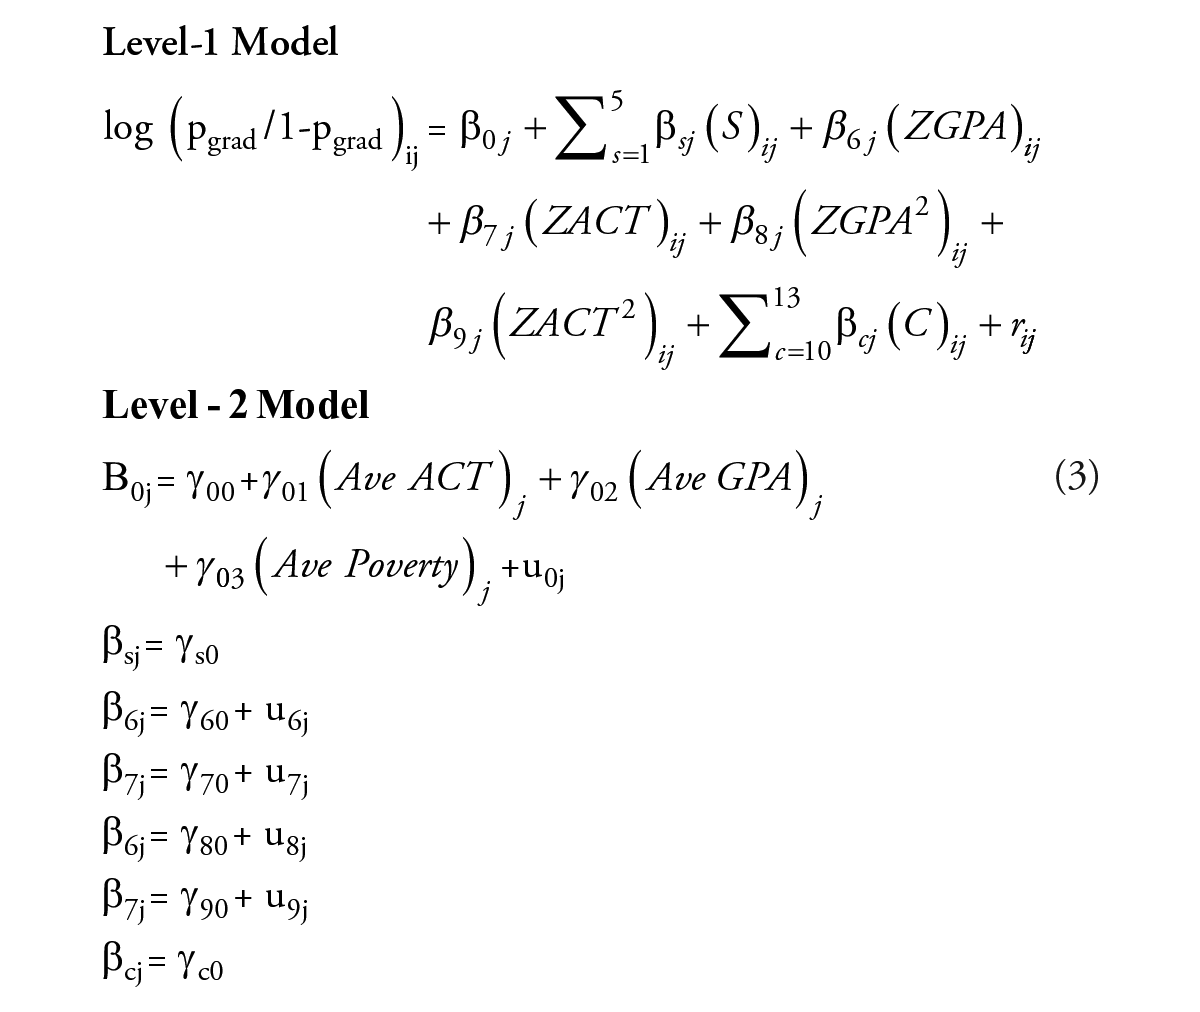
Next, we ran models that entered HSGPA and ACT scores together to discern how much ACT scores improve the prediction of college graduation beyond using HSGPAs alone to answer Research Question 3. We did this in two ways. First, we grand-mean-centered all student variables to show the overall relationships, allowing a direct comparison to the prior models. We then group-mean-centered the variables to discern the relationship of each with college graduation relative to other students in the same school. This second specification is similar to a school fixed-effects model. To address Research Question 4, we included school-level predictors of school performance level (average ACT score and average GPA) and school poverty as predictors of B0j:
Results
We begin by simply showing college graduation rates by students’ ACT scores and HSGPA without additional control variables. As shown in Table 2, both show a relationship with college graduation controlling for the other; within any given row or column, the graduation rate increases as the other metric of achievement goes up. However, the incremental value of additional ACT points flattens out above scores of about 22 to 23 among students with the same HSGPA.
College Graduation Rates by HSGPA and ACT Score: Unadjusted for Student Backgrounds, College Characteristics, or High School Effects
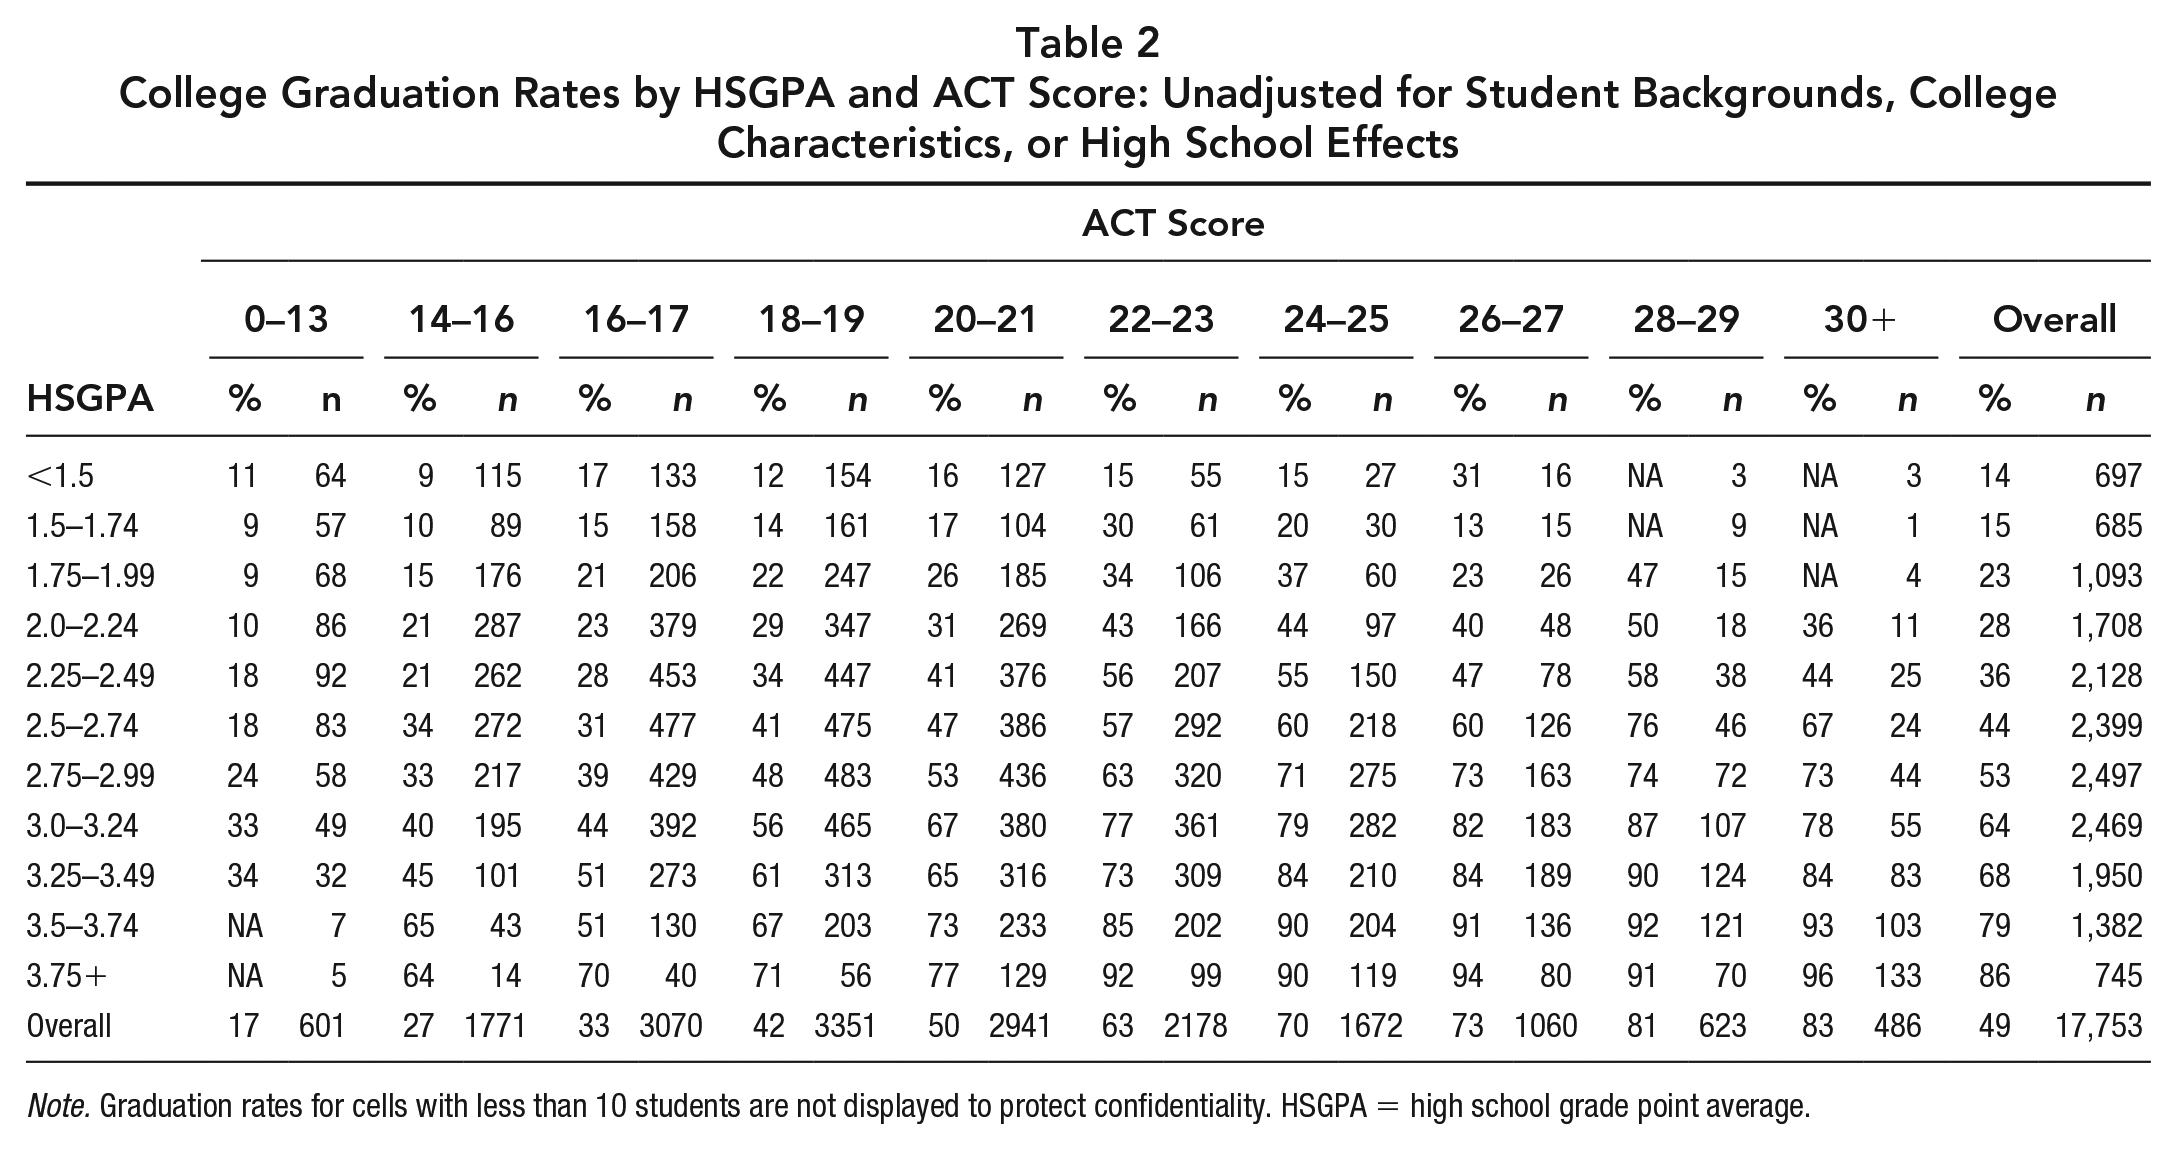
Note. Graduation rates for cells with less than 10 students are not displayed to protect confidentiality. HSGPA = high school grade point average.
Table 3 displays coefficients from models predicting college graduation rates with HSGPAs. The odds ratios show the likelihood of graduating from college; students with a 3.0 to 3.25 HSGPA have fairly even odds (0.91), which gives them just under a 50–50 chance (48% probability), whereas students with a HSGPA of 3.5 to 3.75 are 3.6 times more likely to graduate as to not graduate (odds of 3.65, or about 78% graduating and 22% not graduating). HSGPA has a strong relationship with college graduation in both the unconditional model and the model that controls for students’ backgrounds and college institutional variables, although the relationship is smaller once the control variables are introduced. The coefficients from the full model were converted into percentages and displayed graphically as the thick black line in the left panel of Figure 1. Across the range of HSGPAs, the probability of graduating from college ranges from 20% for students with HSGPAs less than 1.5 to about 80% for students with HSGPAs of 3.75 or higher after controlling for student backgrounds and college characteristics.
Model Predicting 6-Year College Graduation Rates by Student HSGPA Score (Students Nested Within High School)
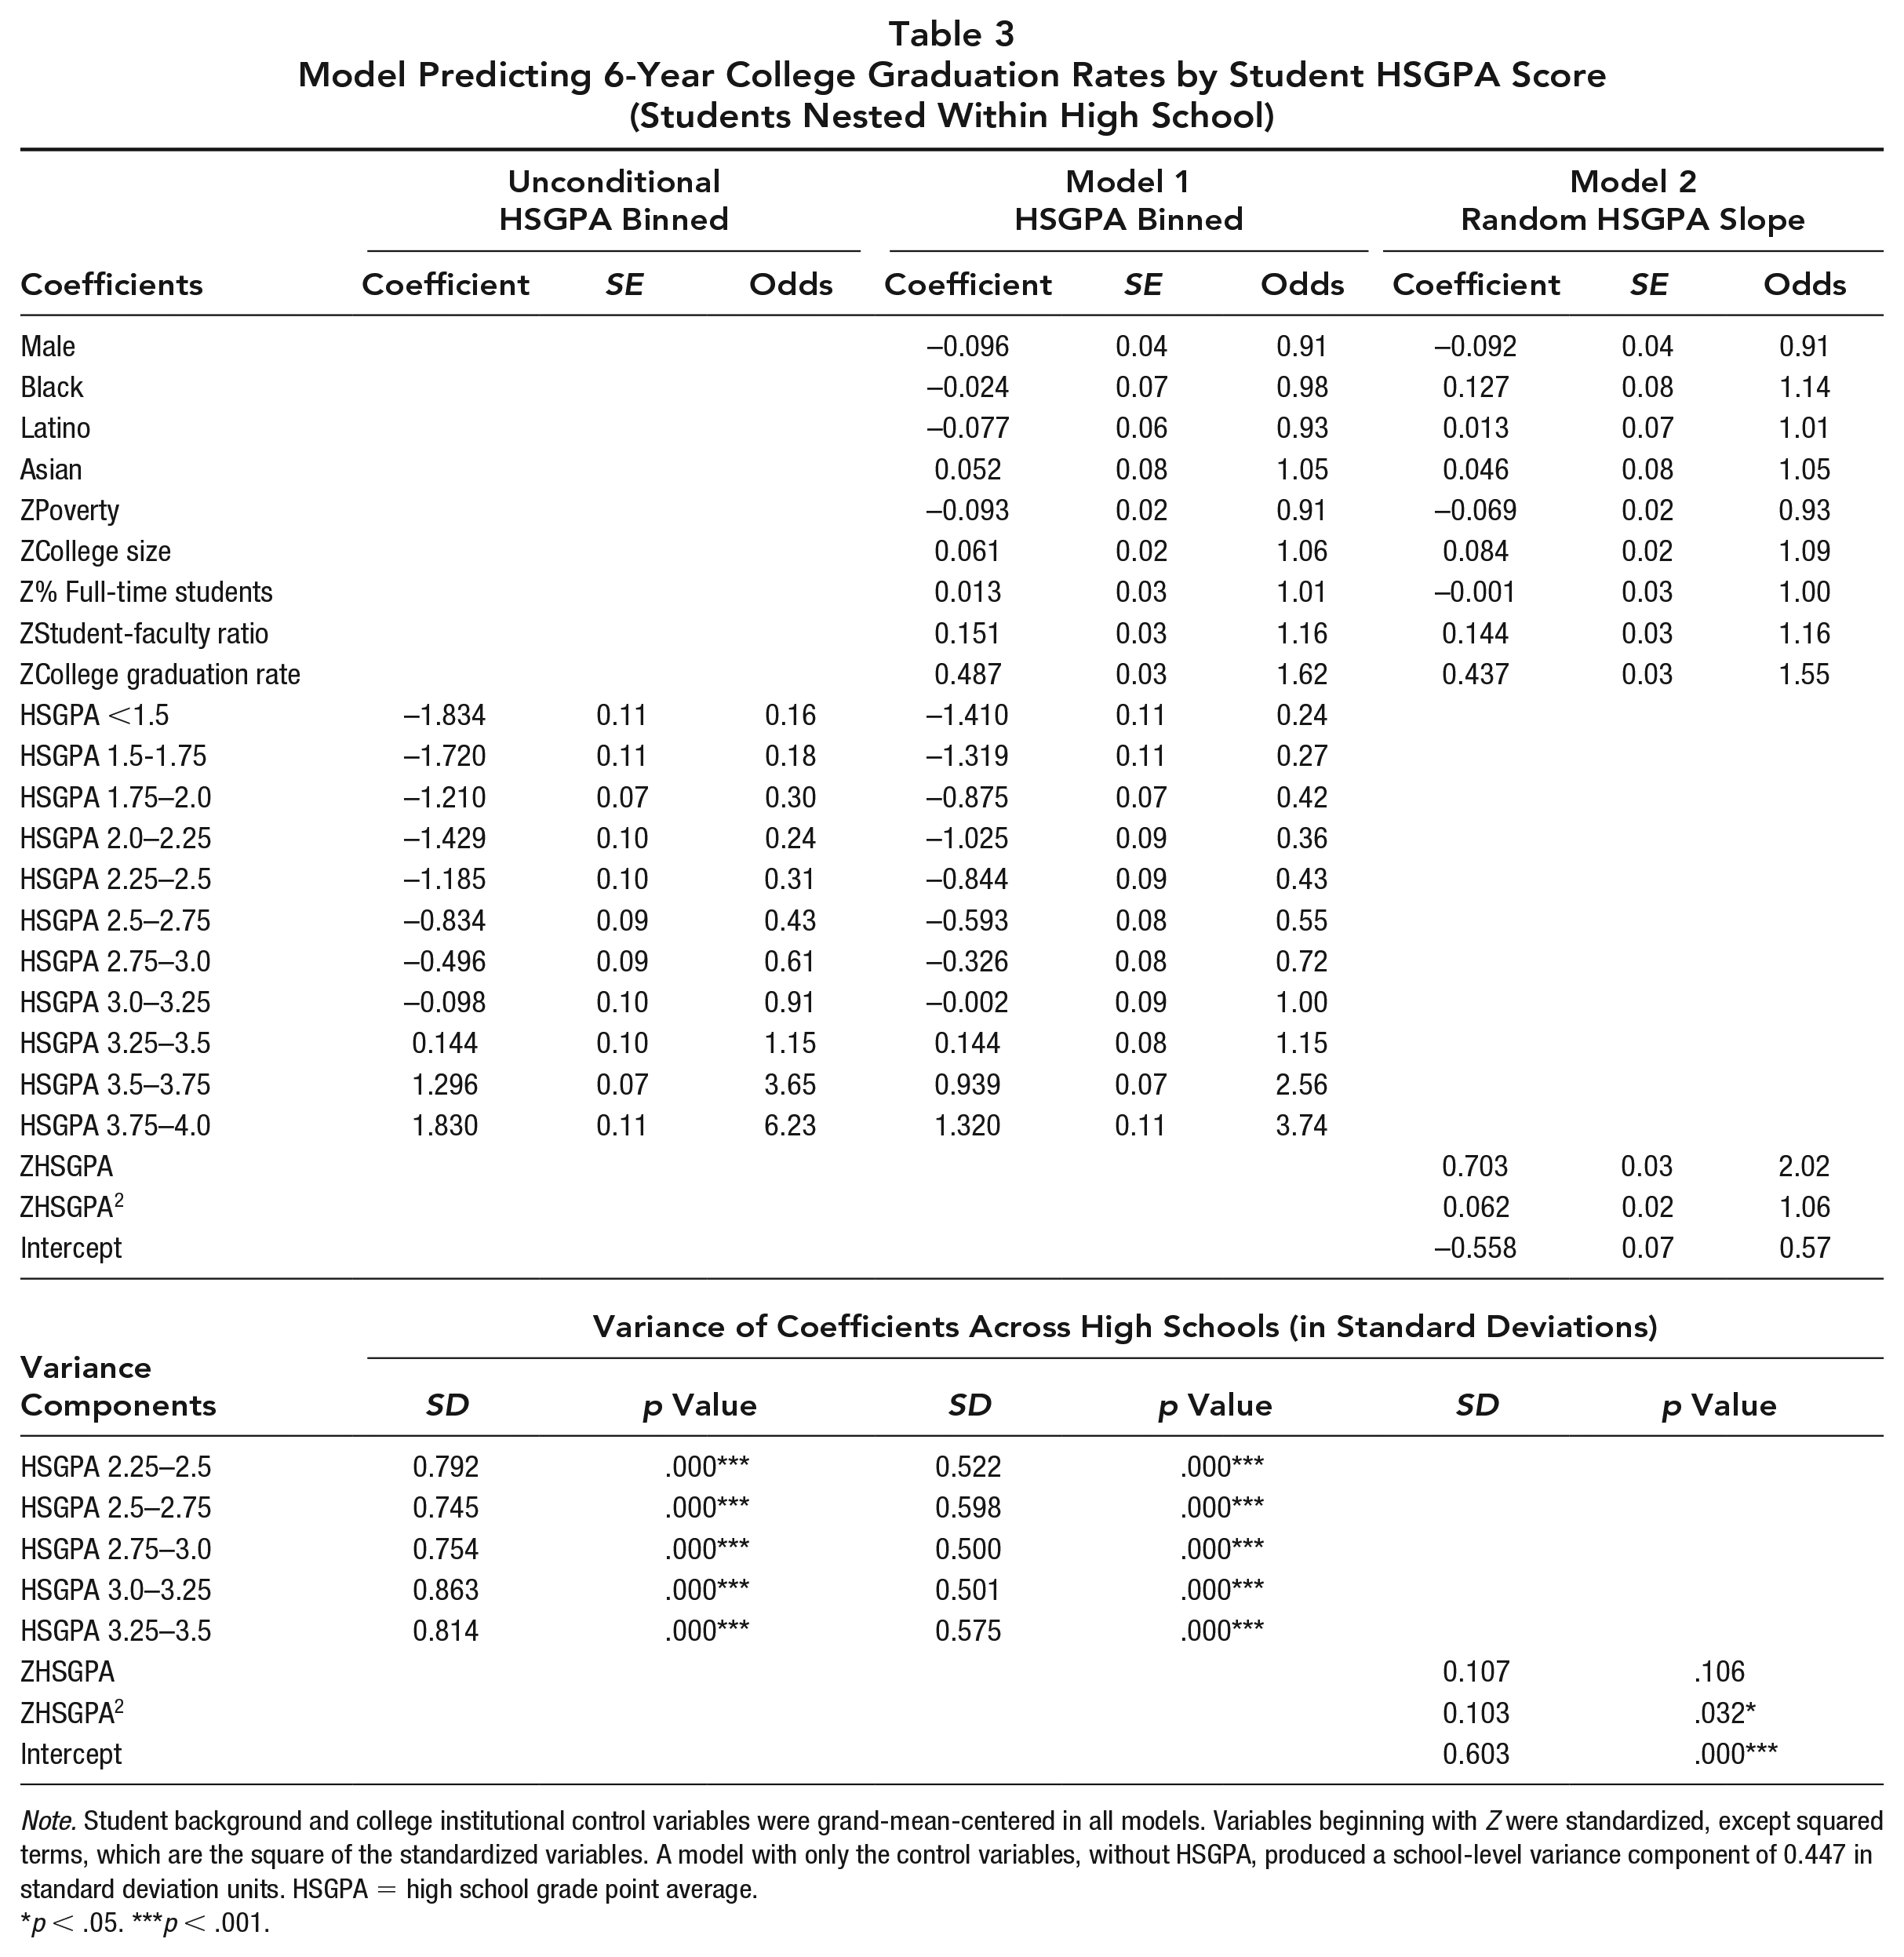
Note. Student background and college institutional control variables were grand-mean-centered in all models. Variables beginning with Z were standardized, except squared terms, which are the square of the standardized variables. A model with only the control variables, without HSGPA, produced a school-level variance component of 0.447 in standard deviation units. HSGPA = high school grade point average.
p < .05. ***p < .001.
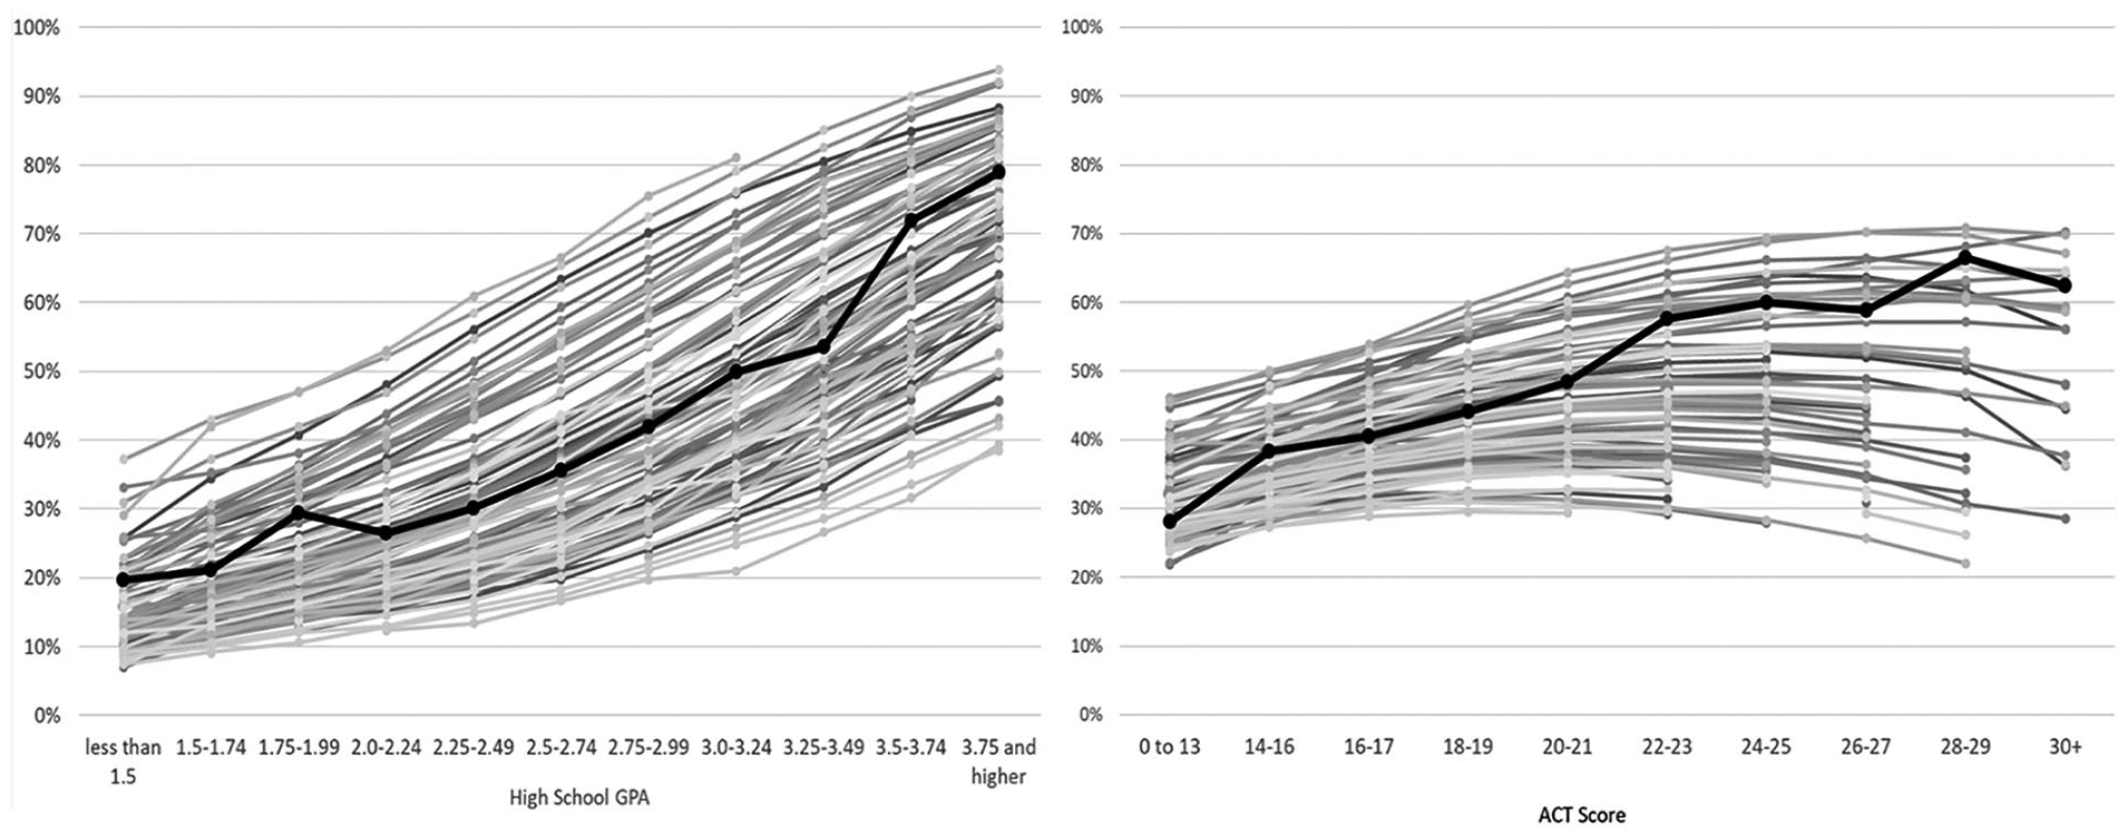
College graduation rates by high school grade point average (HSGPA) and ACT Score, controlling for student background and college characteristics.
The variance components at the bottom of Table 3 show the degree to which average graduation rates varied across high schools. There is significant high school variance in college graduation rates for students in each HSGPA bin. For example, among students with HSGPAs between 3.25 and 3.5, a 2 SD range of high school effects is 0.144 ± 0.575 in log-odds in the conditional model. Thus, students with a 3.25 of 3.5 HSGPA at schools with very negative school effects (1 SD below the mean) have college graduation rates that are similar to students with HSGPAs of 2.75 to 3.0 at more typical schools (where the average log odds of graduating are –0.326).
Model 2 in Table 3 shows the results from a model where HSGPA was entered as a continuous variable along with a squared term instead of discrete bins. The linear component shows that for every standard deviation increase in HSGPA, the odds of graduating from college double (odds coefficient = 2.02) at the point where the quadratic term is zero (which is at the sample average). The quadratic term is positive, so the relationship is larger among students with the highest levels of achievement and lower among students with low HSGPAs. The school variance component for the intercept from this model (0.603) is slightly higher than those in the binned model (where variance components ranged from 0.501 to 0.575) and represents the variance in school effects averaged across students of all achievement levels. Not only is the school-level variance component large (0.603), it is larger when HSGPAs are included in the model than in a model that only includes control variables (0.447, not shown in Table 3). This pattern is consistent with the frogpond effects discussed earlier, wherein HSGPAs are suppressed at high schools with more positive school effects. About one fourth of the school-level variation in Model 2, (0.603 – 0.447)/0.603 = 26%, is “extra” variation that is induced by comparing students with similar HSGPAs across high schools.
The model displayed in Table 3 also allows the slope of the relationship between HSGPA and college graduation to vary by high school. The strong linear trend (coefficient of 0.703) does not vary significantly by high school (SD of slopes = 0.107). The quadratic term (coefficient of 0.062) does vary slightly across schools (SD = 0.103). The noise that is introduced by variation in the linear and quadratic components is small relative to the signal from the linear slope (0.703), so the overall slope of the relationship is fairly similar across schools. The gray lines in the left panel of Figure 1 show the relationship of HSGPA with college graduation for each high school, estimated from the coefficients and variance components from Model 2. The considerable variation in college graduation rates by high school for students with the same HSGPA is clearly visible. At the same time, the relationship between HSGPA and college graduation has a similar slope and is large and positive across high schools.
Table 4 shows the results of models that mirror those in Table 3, substituting ACT scores for HSGPAs. Differences in college graduation rates by ACT score are more modest than by HSGPA, particularly after controlling for student background and college characteristics, but show a sizable range—from odds of 0.39 to 1.98 in the conditional model (graduation rates of 28% to 66%). School-level variance is smaller among students with the same ACT score than among students with the same HSGPA. Still, there is considerable variation in college graduation rates by high school among students with the same ACT score (0.265–0.343). For students with an ACT score of 16 to 17, for example, a 2 SD range in the log-odds of graduating is –0.387 ± 0.343 from the conditional model. Students with an ACT score of 16 to 17 in a school with large positive effects (1 SD above the mean) would graduate at a rate similar to students with scores of 20 to 21 in a more typical school (log odds of –0.059). Thus, students with the same qualifications, defined by either their HSGPA or their ACT score, graduate from college at different rates based on which high school they attend.
Model Predicting 6-Year College Graduation Rates by Student ACT Score (Students Nested Within High School)
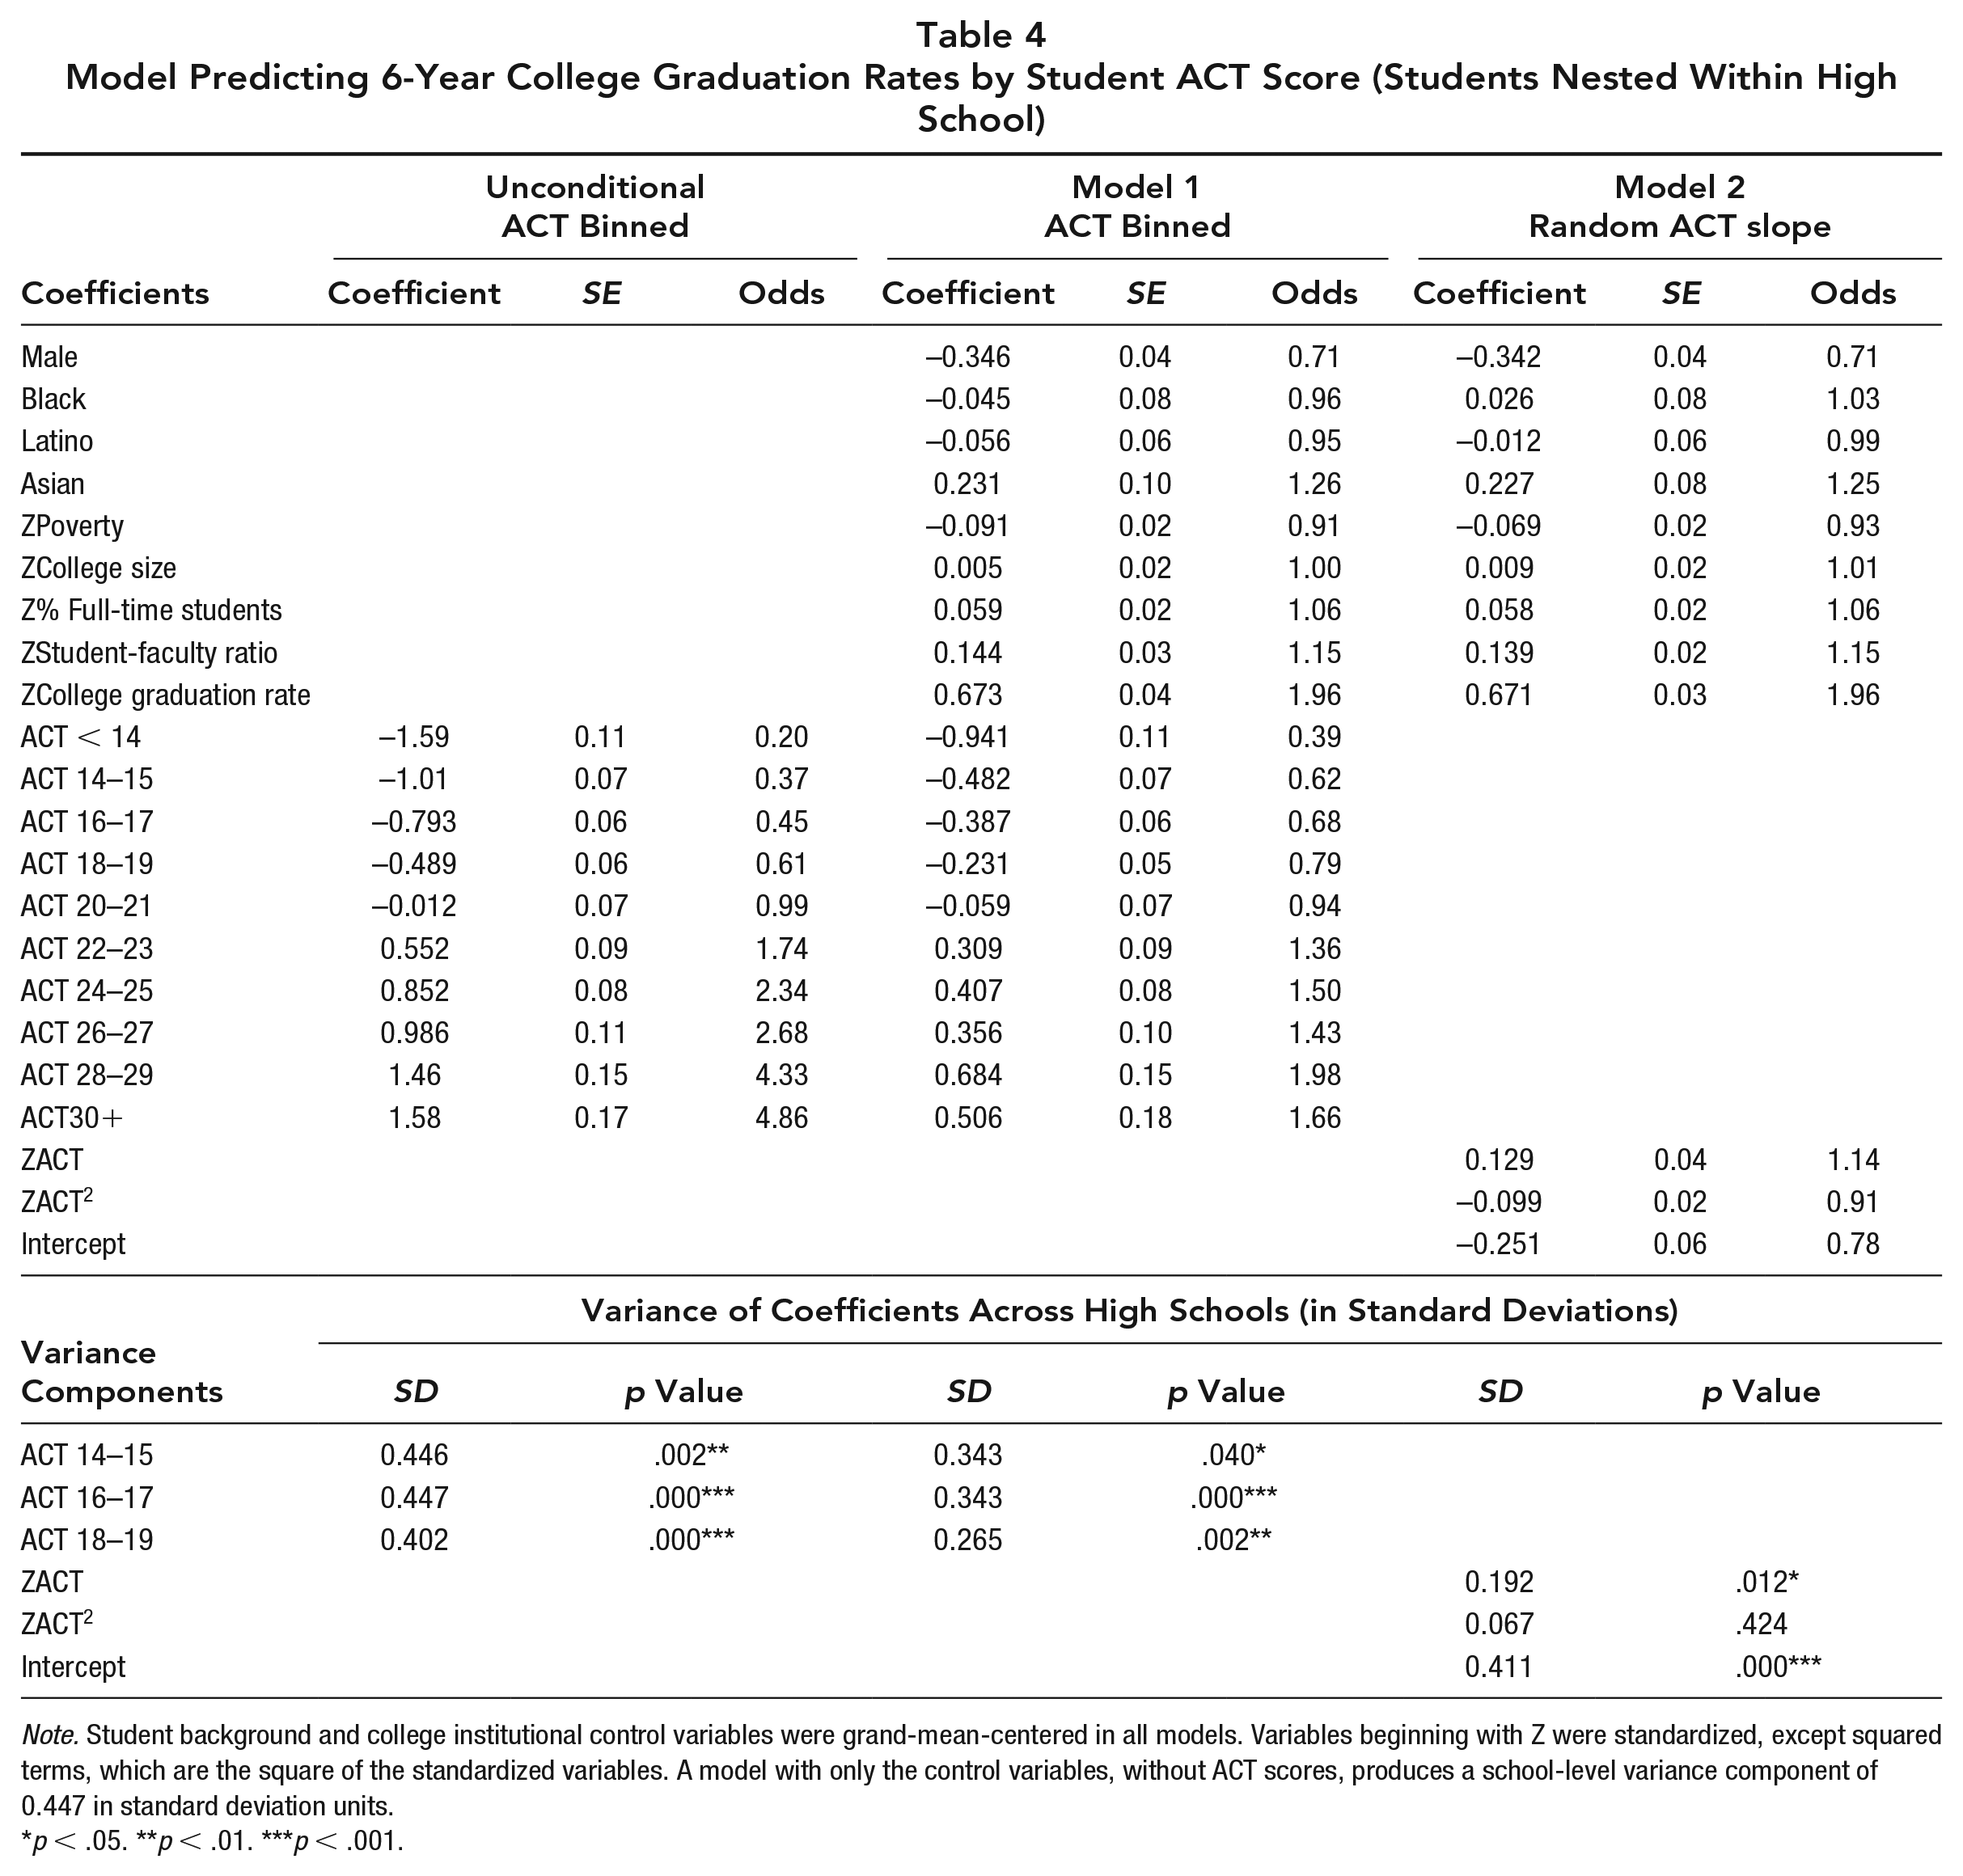
Note. Student background and college institutional control variables were grand-mean-centered in all models. Variables beginning with Z were standardized, except squared terms, which are the square of the standardized variables. A model with only the control variables, without ACT scores, produces a school-level variance component of 0.447 in standard deviation units.
p < .05. **p < .01. ***p < .001.
Model 2 in Table 4 shows the relationship of ACT scores with college graduation modeled with continuous linear and quadratic terms. The standardized linear term is much smaller than that of standardized HSGPA (0.129 vs. 0.703), with the odds of graduating increasing by 14% (odds coefficient of 1.14) for every standard deviation increase in ACT scores when the quadratic term equals zero. There is a negative quadratic term, so the relationship is larger among students with low achievement, small among students with high achievement, and becomes negative among students with the highest achievement. The variance components show that the linear component of the slope varies significantly and the variance in the slopes (SD of slopes = 0.192) is larger than the average slope (0.129). Thus, the noise introduced by variance in the ACT slope is larger than the average signal from ACT scores.
ACT scores also provide less accurate predictions of college success based on students’ race, ethnicity, and gender than HSGPAs. The subgroup differences in college graduation rates are significantly different from zero for Asian and male students in the models that control for ACT scores, but the demographic coefficients are not significantly different from zero in the models that control for HSGPAs. ACT scores explain only a little of the school-level variance in college graduation rates; the variance component on average school effects (0.411) is similar to a model with the same control variables but no ACT scores (0.446). However, they do not induce more school-level variance, as was seen with HSGPAs.
The right panel of Figure 1 shows the relationships from Models 2 and 3, modeled as percentages. The dark line shows the averages from the bins in Model 1, and the gray lines show the relationship for each school, calculated from the coefficients and variance components in Model 2. The dark line is not at the center of the gray lines because most of the students with high ACT scores are concentrated in schools with high average college graduation rates, whereas students with very low ACT scores are concentrated at schools with low average college graduation rates. Many schools do not have students with very high ACT scores, and a number of schools do not have students with very low ACT scores, so few of the lines go the full range of the horizontal axis.
In Table 5, ACT scores and HSGPAs are included together in the models. The main HSGPA coefficient does not change substantially relative to the model without ACT scores in Table 3 (0.708 vs. 0.703), but the main ACT coefficient shrinks considerably from the model without HSGPA (from 0.129 to a nonsignificant –0.016). Because the ACT score contributes little to the prediction, there is a similar amount of school-level variance in the combined model (0.622) as the model that includes HSGPA alone (0.603, from Table 3). ACT scores used at the individual student level do not reduce the variability by high school in predicting who will graduate college. The slope of the relationship of ACT scores with college graduation still varies significantly based on high school (0.213); in schools with a standard deviation below the mean, the linear slope is negative (–0.016 – 0.213, or –0.229), and in others it is positive (–0.016 + 0.213, or 0.197).
Models Predicting College Graduation Rates by Both HSGPA and ACT Score (Students Nested Within High School)
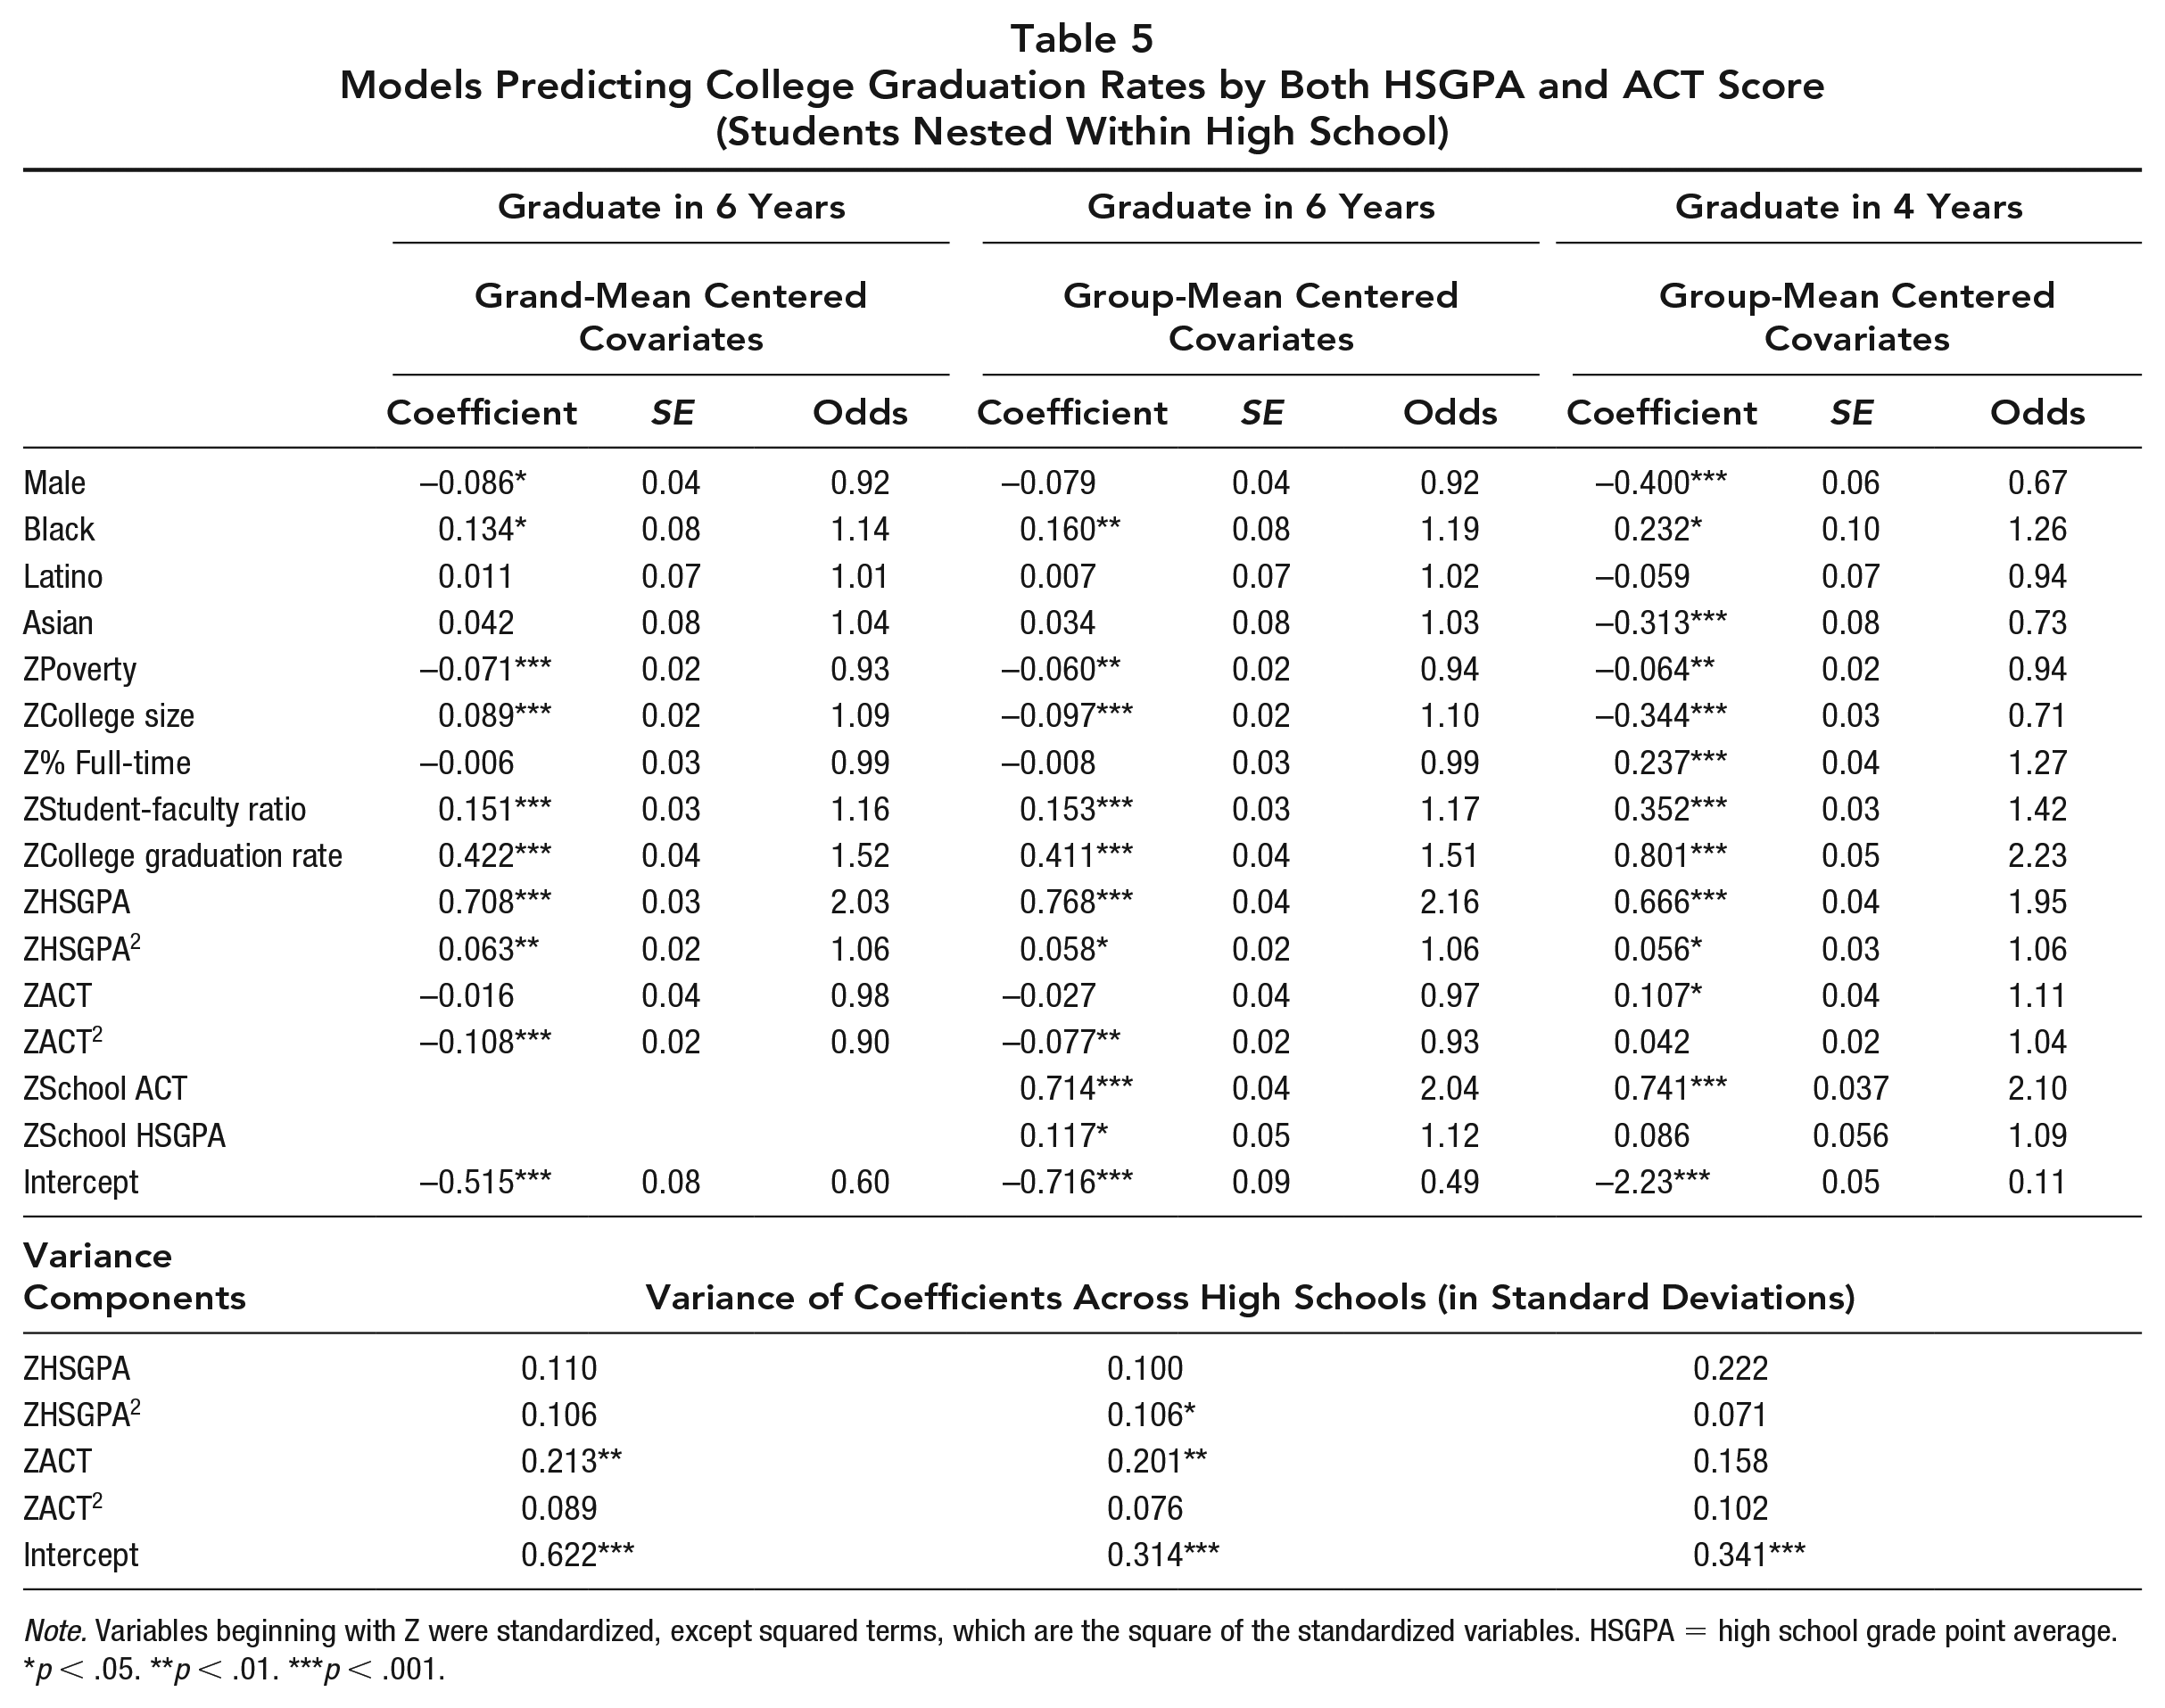
Note. Variables beginning with Z were standardized, except squared terms, which are the square of the standardized variables. HSGPA = high school grade point average.
p < .05. **p < .01. ***p < .001.
The insignificant relationship between ACT scores and 6-year college graduation rates may be surprising given the positive bivariate relationship. We ran a series of models with different sets of control variables (HSGPA, student demographic variables, college characteristics, high school fixed effects) to determine which variables explained the bivariate relationship. Including either college characteristics or HSGPA in the model reduced the ACT coefficient by about 70%, compared to a model with only ACT as a predictor. Thus, ACT scores are related to college graduation, in part, because students with higher scores are more likely to attend the kinds of colleges where students are more likely to graduate and because students with higher test scores tend to get higher grades.
In the next model, the variables are group-mean-centered so that the coefficients show the relationship of each variable with college graduation relative to other students in the same school. The within-school coefficient for HSGPAs is slightly larger than the coefficient from the earlier model, and the ACT score coefficient remains small and not significant. The ACT slope varies significantly by high school (0.201, p < .01); the main linear portion of GPA slope does not vary, and the quadratic term varies only slightly. This model includes school-level variables (average ACT scores and average GPAs among all students), which reduces the school-level variance in the intercepts by half (the main school effects). 2 School average ACT scores are strongly related to college graduation. The odds of graduating college double for every standard deviation increase in school average ACT scores. We also ran models that included school average poverty, but it is strongly correlated with school average ACT scores (r = .70), so comes out as not significant when entered simultaneously. If entered alone in the model, either variable is a significant predictor, with a standardized coefficient of –0.557 for school poverty.
Also included in Table 5 is the prediction of whether students graduate from college in 4 years. Only about half as many students graduate in 4 years as in 6 years, but it is of interest because most students initially intend to graduate in 4 years. The coefficients on college characteristics are larger for graduating in 4 years than 6 years—thus, where a student attends college matters for how long it takes them to graduate as well as whether they graduate. Another difference from the prediction of graduation in 6 years is that ACT scores are slightly predictive of graduating in 4 years in the full model, even controlling for HSGPA and college characteristics. However, the ACT coefficient is one sixth the size of the HSGPA coefficient, and although the variation in the ACT slopes across high schools is not significant, the standard deviation of ACT slopes is larger than the average ACT slope. HSGPA shows a similar relationship with graduation in 4 years as in 6 years—students’ odds double for every standard deviation increase in HSGPA.
Although this study is primarily concerned with college completion, college completion is contingent on college enrollment, and colleges use both HSGPAs and ACT scores for admission decisions. Therefore, Table 6 presents model results predicting enrollment in a 4-year college among all high school graduates and college institutional graduation rates among students enrolled in a 4-year college. Both HSGPAs and ACT scores are strongly related to enrollment, with the odds of enrolling increasing by about 2.5 times for a standard deviation increase in either. They are also about equally as predictive of going to a college with strong institutional graduation rates, with HSGPA increasingly predictive at the higher achievement levels (with a positive quadratic term). The quadratic terms are much more sizeable for enrollment in college than graduation and are negative. Thus, very low achievement serves as a barrier to college enrollment more so than very high achievement increases it. School average ACT scores are significantly related to college enrollment and enrolling in a college with strong graduation rates. Even after controlling for school average achievement, there is significant variance across high schools in college enrollment rates and the institutional graduation rate of the colleges into which students enroll. Furthermore, the slopes of both GPAs and ACT scores with 4-year college enrollment vary significantly across high schools. Thus, where students attend high school matters considerably for college enrollment and the types of colleges students attend.
Models Predicting College Enrollment Variables
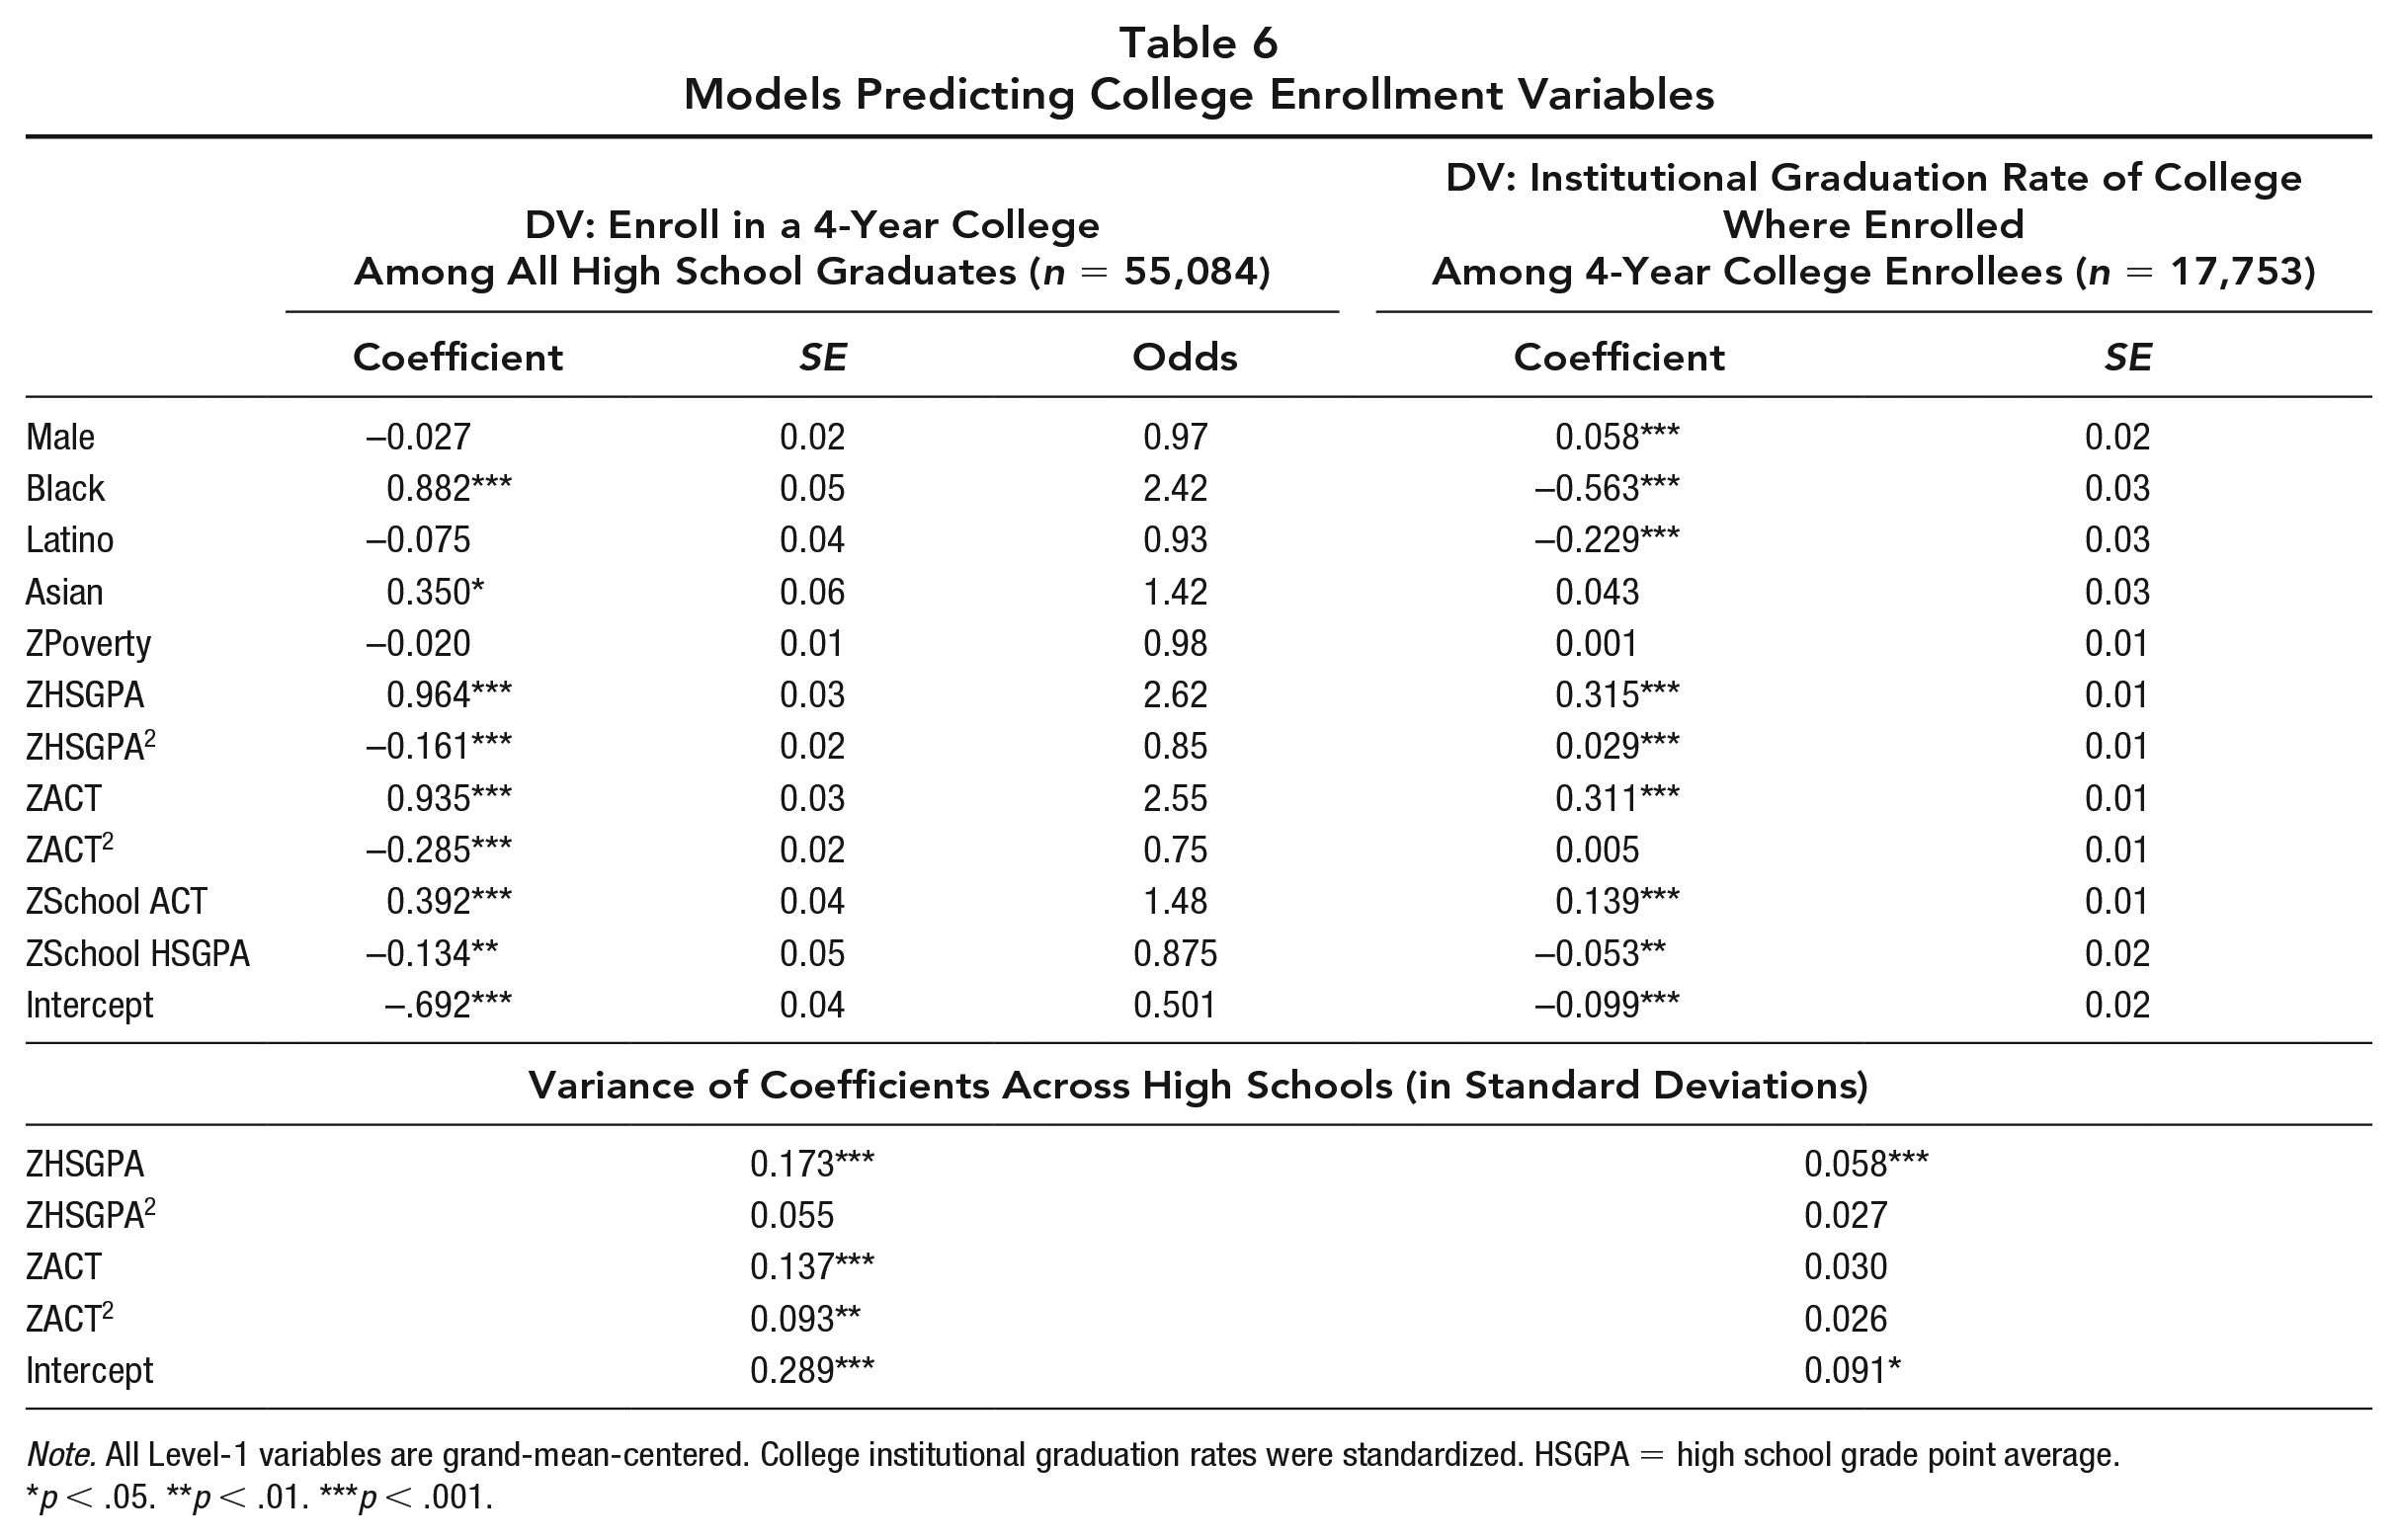
Note. All Level-1 variables are grand-mean-centered. College institutional graduation rates were standardized. HSGPA = high school grade point average.
p < .05. **p < .01. ***p < .001.
Because both ACT scores and HSGPA are strongly related to enrollment, we also ran a model that predicted college graduation in 6 years without controlling for college institutional variables. In this model, the HSGPA and ACT score slopes capture the influence of getting into a stronger college (the signaling effect) that comes with a higher achievement level along with the ability to succeed once there. In this model, both the HSGPA and ACT slopes are larger (0.911 and 0.125, respectively) than in the model in Table 5, and both are significant. The average ACT slope is still smaller than the variance in ACT slopes across high schools (SD of slopes is 0.202) and is less than one seventh the size of the HSGPA slope.
Discussion
It is commonly believed that HSGPAs indicate different levels of readiness for college, based on the high school a student attends, and that ACT scores are consistent indicators. However, HSGPAs perform in a strong and consistent way across high schools as measures of college readiness, whereas ACT scores do not. There are large high school effects on college graduation such that students with either the same HSGPA or the same ACT score graduate from college at different rates, based on which high school they attended. Neither capture all of the ways in which high schools influence college graduation. The school differences are larger for students with the same HSGPA, which is consistent with prior studies showing that grades are depressed in schools and classes with higher-achieving students. HSGPAs are not equivalent measures of readiness across high schools, but they are strongly predictive in all schools, and the signal they provide is larger than the differences across schools. School-level variance in college graduation rates is one quarter smaller among students with the same ACT score than students with the same HSGPA. However, this still leaves considerable school-level variance, and the signal provided by ACT scores is much smaller than the noise introduced by school effects.
As measures of individual students’ academic readiness, ACT scores show weak relationships and even negative relationships at the higher achievement levels. The negative slope among students with the highest achievement could result if people are using ACT scores to make decisions about students’ readiness for very rigorous academic programs out of a belief that they are strong indicators of readiness when they are not. Future research might investigate this further. Regardless, there is little evidence that students will have more college success if they work to improve their ACT score because most of the signal from the ACT score seems to represent factors associated with the student’s school rather than the student. In contrast, students’ efforts to improve their HSGPAs would seem to have considerable potential leverage for improving college readiness. The fact that HSGPAs are based on so many different criteria—including effort over an entire semester in many different types of classes, demonstration of skills through multiple formats, and different teacher expectations—does not seem to be a weakness. Instead, it might help to make HSGPAs strong indicators of readiness because they measure a very wide variety of the skills and behaviors that are needed for success in college, where students will also encounter widely varying content and expectations.
Test scores provide more of a signal at the school level, with school-level average test scores providing additional information about students’ likelihood of graduating above and beyond students’ individual HSGPAs. For judging college readiness, school-average ACT scores would provide a stronger prediction than students’ individual scores. This is consistent with the findings and recommendations in Koretz and Langi (2018) and Bowen et al. (2009). The same pattern is observed with school-average poverty levels (in models that do not control for average ACT scores), which echoes Rothstein’s (2004) findings. These high school effects could result from higher academic standards (e.g., more college-oriented curricula at higher-achieving, higher-SES schools). Yet, they could also represent selection effects. Families with more financial, social, and human capital might select into higher-achieving, higher-SES high schools, either by choice of residence or application, and those families would likely continue to offer support when students are in college. School effects also could come from different peer networks, advising, supplemental experiences, or broader curricular offerings available at schools with more resources. Future research should investigate high school effects on college outcomes more thoroughly.
This study was conducted only with data from Chicago and only with data from public schools. There could be more variation across high schools with a more comprehensive sample and different relationships. The similarity in results that are available from studies of schools in other places provides some indication of their generalizability. Studies that used data from samples that include 21 prestigious flagship universities from across the country and all public universities in four states (Bowen et al., 2009; Koretz & Langi, 2018; Rothstein, 2004) all showed that HSGPAs are strongly related to either college graduation or to college freshman GPA and that students’ individual ACT or SAT scores add only modestly to the prediction beyond HSGPA, if at all, in models that include high school fixed effects and compare similar colleges. The graduation rates presented by Bowen et al. (2009) for specific HSGPAs are also similar to the graduation rates found here and shown in Figure 1. Graduation rates by HSGPA are not provided in other studies, to our knowledge.
This research strongly supports the use of students’ grades in a formative way to guide school improvement efforts and assess the effectiveness of programs designed to improve college readiness and rely less heavily on test scores. The teachers and schools that improve test scores are not always the same as those that improve students’ grades (Jackson, 2016), and programs that have positive effects on test scores do not always have positive effects on grades (Nomi & Allensworth, 2009). Reaching goals that all students will graduate college-ready would seem to require strategies around improving students’ HSGPAs because HSGPAs are so strongly related to eventual college completion at all high schools. Higher ACT scores might help students get access to stronger colleges, but the payoff would only occur if students actually attend stronger colleges. As an increasing number of colleges become test-optional, they are likely to be decreasingly salient for college admissions as well.
States and districts might also consider relying less heavily on standardized test scores in their accountability systems as indicators of college readiness given that the relationship is not strong and not consistent across schools. In fact, part of the variance in the relationship of ACT scores with college graduation could result from practices that prepare students for standardized tests versus supporting strong academic skills more broadly. A number of states have developed longitudinal data systems that allow for the creation of metrics of students’ actual performance in college. The existence of large school effects among students with the same ACT scores suggests that if high schools are not tracking the success of their students in college and are relying solely on students’ test scores as indicators of their students’ college readiness, they may be misestimating the effects of their practices on students’ college readiness. Likewise, we worry that if families and college admissions officers must rely on school poverty levels and average test scores as proxy indicators for school effects, they might not recognize strong practices at schools serving low-income students. Measuring and publishing school effects on postsecondary outcomes would provide better information to guide families, educators, and policymakers.
Footnotes
Appendix
College Institutional Characteristics by HSGPA and ACT Score
| Institution 5-Year Graduation Rate |
Institution ACT–25th Percentile |
Institution ACT–75th Percentile |
Endowment Per Student |
||||||
|---|---|---|---|---|---|---|---|---|---|
| Mean | SD | Mean | SD | Mean | SD | Mean | SD | ||
| Student GPA | 1.6 and below | 37.00% | 19.09% | 17.87 | 2.28 | 22.62 | 3.68 | 118.77 | 78.64 |
| 1.6–2.0 | 40.79% | 18.90% | 19.14 | 2.22 | 24.49 | 3.22 | 140.24 | 118.18 | |
| 2.1–2.5 | 44.97% | 19.42% | 20.23 | 1.97 | 25.95 | 2.43 | 158.02 | 152.09 | |
| 2.6–3.3 | 54.62% | 20.23% | 21.33 | 2.41 | 27.02 | 2.38 | 273.28 | 528.16 | |
| 3.4 and above | 64.41% | 19.57% | 23.55 | 3.58 | 28.84 | 2.88 | 905.46 | 1,324.73 | |
| Student ACT | 14 and below | 41.40% | 21.35% | 16.54 | 2.29 | 20.58 | 3.68 | 167.69 | 49.94 |
| 15–17 | 42.33% | 20.17% | 19.39 | 2.25 | 24.54 | 2.96 | 138.35 | 130.01 | |
| 18–20 | 48.48% | 19.95% | 20.43 | 1.95 | 26.13 | 2.07 | 202.44 | 381.4 | |
| 21–24 | 56.95% | 18.55% | 21.54 | 2.38 | 27.31 | 2.15 | 310.98 | 642.43 | |
| 25 and above | 67.25% | 18.09% | 23.74 | 3.41 | 29.11 | 2.65 | 865.95 | 1,278.6 | |
Note. Data represent mean institutional characteristics as reported by Integrated Postsecondary Education Data System for 2009. HSGPA = high school grade point average; GPA = grade point average.