
Abstract
Policymakers have long sought to raise expectations for students through standards-based reform. I examine the extent to which the Common Core State Content Standards (CC) affected student achievement and the size of achievement gaps. I merge together data on preparation for and implementation of the CC with the National Assessment of Educational Progress student-level data. To identify the effect of CC on student outcomes, I compare early implementors of the CC to late implementors of the CC in a difference-in-differences framework. I find the initial effect of the CC on math scores was positive. The CC had a large positive initial effect on economically advantaged students but no detectable initial effect on economically disadvantaged students. Raising state expectations without addressing the structural issues burdening economically disadvantaged students may result in unintended consequences.
Keywords
In 2010, a national alliance of states moved rapidly to adopt the Common Core State Content Standards (CC) due to concerns about low expectations for students. The popularity of the CC quickly declined because of insufficient support for implementation and the belief that reforms to content standards would harm students. About a quarter of the states that adopted the standards announced substantial revisions or revoked the adoption of the CC. Many modifications to the CC occurred before the standards were implemented in classrooms. But state policymakers could not have judged whether the standards benefitted students prior to their implementation. Today, policymakers continue to debate whether or not to continue using the CC. The CC has received renewed attention because state laws mandate that states consider changes to content standards every 7 to 10 years. I provide new evidence about the effects of CC on student outcomes and achievement gaps that will inform decisions about future changes to the CC.
The CC did influence teacher’s instruction and classrooms. The vast majority of teachers reported using CC-aligned textbooks (Blazar et al., 2019). Nationwide the preponderance of teachers (66%) reported that alignment to CC was one of the three most important influences on curricula, programs, and/or instructional tools used in their classroom practices (Opfer et al., 2016). Educators did not receive sufficient supports to implement the CC (Xu & Cepa, 2018) and superintendents reported challenges related to finding adequate staff and financial resources to support all the necessary implementation activities (Rentner, 2013). Staff from high-poverty districts reported less confidence in their capacity to implement the CC (A. B. Brown & Clift, 2010; Finnan & Domenech, 2014).
Questions about whether the CC content standards improved student outcomes and the size of the relationship has benefitted students remain unresolved (Polikoff, 2017). Studies have found the relationship between CC implementation and student outcomes is mixed (Allensworth et al., 2021; Loveless, 2014, 2015, 2016; Gao & Lafortune, 2019; Song et al., 2019; Xu & Cepa, 2018). In particular, it is unknown whether the CC contributed to the closure of achievement gaps (O’Day, & Smith, 2019; Polikoff, 2017).
I use the student-level National Assessment of Educational Progress (NAEP) to estimate the initial effect of CC on student outcomes. I identify the initial effect of CC by exploiting variation in the implementation of CC across time. Within a difference-in-differences framework, I dynamically estimate the effect of preparing for the CC and implementation of the CC. In 2011, I estimate the effect of preparing for CC by comparing treated states that had begun preparation activities (e.g., professional development, curricula development) to comparison states that were still planning the implementation of the standards. In 2013, I estimate the effect of implementing the standards by comparing treated states that mandated alignment of instruction with the standards and comparison states where some had begun preparation activities. I restrict the sample to include the years from 2003 to 2013 to remove the endogeneity from changes to content standards after 2013. A tradeoff with my approach is that I capture the initial rather than long-term effect of the CC.
State capacity would bias the effect of CC if it explains both the timing of implementation and changes to student outcomes. To mitigate concerns about this source of bias, I demonstrate that early and late implementing states are quite similar across a broad range of capacities. My estimation strategy accounts for many plausible confounders and identifies the initial effect of preparing for and implementation of the CC on student achievement overall and achievement gaps.
Common Core State Standards
The Common Core State Standards Initiative (CCSSI; 2010) was a joint project of the National Governors Association and the Council of Chief State School Officers. The CCSSI pursued two standards-based reforms: development of new content standards and development of new assessments. The CCSSI applied the CC brand to both projects, but there were key differences. The CC content standards were broadly supported by education reformers and stakeholders (e.g., AFT, NEA). Content standards are a list of learning goals that states define for teachers. States also set standards for curriculum and performance on summative assessments, but neither of these reforms was targeted by the CCSSI. CC is also used to describe the Common Core testing consortia (i.e., Smarter Balanced, Partnership for Assessment of Readiness for College and Careers). The assessment consortia were groups of states that contracted with test writers to develop assessments that were aligned with the CC content standards. Additionally, companies have applied the CC brand to describe instructional materials (e.g., textbooks) that were aligned with either the content standards or assessments (Polikoff, 2015). However, instructional materials with CC branding may not be a part of the CCSSI, because the CC’s public license allows businesses to use the CC brand for products that have educational purposes.
The goal of the CC was to raise and equalize expectations for all students (Achieve, 2013). Similar to other standards-based reforms, the explicit goal of content standards is to close achievement gaps (Gamoran, 2008). Without uniform content standards academically vulnerable students may suffer from systematically lower expectations that could in part cause achievement gaps (Bleiberg & West, 2014).
The CCSSI started writing the standards in 2008. Beginning in 2009, states began adopting the CC content standards in part due to incentives from Race to the Top and the Bill and Melinda Gates Foundation. By 2011, 45 states adopted the CC standards. By 2013, 15 states had implemented the standards in either math or reading. In 2014, the politics of CC soured, and Indiana became the first state to revoke the standards. 1
Conceptual Framework
The CC content standards are more rigorous than the typical content standards used prior to the CC. The rigor of state content standards has three main components: clarity/specificity, content and skills, and coverage (AFT, 2006). Using these criteria, a 2011 review gave a D or an F grade to 22 state English Language Arts standards and 15 state math standards (Carmichael et al., 2010). Some state content standards lacked clarity/specificity in that the standards were not assigned to specific grades and subjects. Not all states required the teaching of both content (e.g., literature, real-world examples) and skills (e.g., decoding, numeracy). While state content standards did not cover every grade and subject.
There are four pathways through which the CC could influence student outcomes: instructional changes aligned to the content standards, changes to curricula, heightened expectations for students or Pygmalion effects, and the implementation of other standards-based reforms (see Figure 1). The CC could improve student outcomes through promoting instructional practices aligned with the CC. CC aligned instruction is the channel with the greatest potential to influence student outcomes (Polikoff, 2012). The CC calls for students to use multiple strategies to solve problems (i.e., reasoning abstractly or quantitatively) and to focus students on using evidence from complex texts. A majority of teachers reported using CC aligned instructional practices in 2015 (Opfer et al., 2016). But the likely initial effect of CC aligned instructional practice is quite small given that teachers need years to implement changes.

Common Core State Content Standards logic model.
After the adoption of the CC, districts purchased new curricular materials that were aligned with the content standards. The CC could influence student outcomes through aligned curricula like textbooks. Textbooks have an outsized influence on students because of their frequent usage by teachers (Polikoff, 2015). The CC could improve student outcomes through adopting standards-aligned instructional practices or curricular materials.
Rigorous content standards like the CC can improve student achievement by raising the state’s expectations for what is taught (more content and skills), which in turn changes what students learn. The CC could also close achievement gaps by raising expectations for academically vulnerable students. A rich tradition of research has focused on Pygmalion effects or the ways that teacher expectations matter for student achievement (Rosenthal, 1987). Students will align their performance with their expected performance (Good et al., 2018, Liou & Rotheram-Fuller, 2019). Teachers have lower expectations for students who are Black and from low-income families (Ferguson, 2003; Gershenson et al., 2016). The CC raises state expectations, which could equalize teacher expectations for academically vulnerable students to the same level as advantaged students then it could in turn close achievement gaps (Gamoran, 2008). Heightened expectations for students would have immediate effect on student outcomes.
The CC may also improve student outcomes via other education policies linked to content standards. Content standards serve as one of three key components in standards-based reform along with assessments and accountability (Smith & O’Day, 1991). Content “standards are the foundation on which almost everything else rests” (Carmichael et al., 2010). Content standards like the CC determine the skills measured on assessments, which states use to determine which schools receive sanctions under accountability systems. Similarly, content standards influence other school activities (e.g., professional development, teacher evaluation). The CC could improve student outcomes via its influence on these other school policies.
Critically in the context of my analysis, it is unlikely that CC influenced student outcomes through some of the pathways described in Figure 1. For example, few teachers had access to CC aligned curricular materials like textbooks from 2010 to 2013 (Polikoff, 2015). In 2015, the preponderance of teachers reported using CC aligned instructional practices, but during the period of study national data are not available (Opfer et al., 2016). Teacher and school leader survey data suggest that professional development on content standards, which could influence teacher’s expectations for students and aligned instructional activities was conducted during the period in question (Kober & Rentner, 2011a, 2011b, Webber et al., 2014). Additionally, changes to the CC assessments and school accountability systems all happen after 2013.
The Effect of Content Standards on Student Outcomes
States began to pursue standards-based reform in the 1990s. These efforts also included implementing more rigorous content standards like the Principles and Standards for School Mathematics. However, there are no studies from the pre-CC period that isolate the effect of content standards on student outcomes. Two comprehensive literature reviews on the effects of standards-based reforms on students found no studies that estimated the effect of reforms to content standards on students (Hamilton et al., 2009; Lauer et al., 2005). Few studies were conducted because of the inherent complexity in examining standards-based reform. State changes to content standards virtually always coincided with reforms to assessments, accountability systems, or curricula. Contemporaneous standards-based reforms make it difficult to identify the effect of the content standards on student achievement. The interconnectedness of standards-based reform led Dutro (2002) to conclude that, “We may never be able to directly answer the question ‘What impact are state content standards having on student learning?’” (p. 6). Fortunately, the CC differs from previous standards-based reform efforts because changes to assessments and accountability lagged behind changes to content standards.
Several studies have endeavored to estimate the effect of the CC on student achievement. Loveless (2014, 2015, 2016) examines whether the similarity of a state’s standards to CC is correlated with NAEP outcomes. He finds relatively small positive effect sizes ranging from 0.01 to 0.04 standard deviations (SD). Overall, the descriptive differences between states that strongly implemented CC to states that did not adopt the standards appear to be small and insignificant. Xu and Cepa (2018) examine the effect of CC on ACT scores in Kentucky. They exploit the variation in exposure to CC across three cohorts. Students in the second two cohorts that received the CC had significantly higher ACT scores (0.03–0.04 SD) compared with students in the first cohort.
Gao and Lafortune (2019) examine CC implementation in California and its effect on student outcomes. Using a statewide survey, they collected information about districts’ implementation processes. They exploit the variation in the timing of local adoption—as measured by the year in which a district adopted a CC aligned textbook—to examine the impact of CC standards adoption on student outcomes. In elementary and middle schools, the CC is associated with improvements in English Language Arts achievement. In high schools, adoption districts saw their advanced placement passing rate increase by 1.3 percentage points.
Song et al. (2019) estimate the effect of adopting the College and Career Ready (CCR) content standards on NAEP state average test scores. CCR content standards include three categories of states: CC implementing states, states that made substantive revisions to the CC, and states that never adopted the CC (i.e., developed their own standards). Content standards for states that made substantive revisions (Korn et al., 2016) and states that never adopted the CC have important differences with states that implemented the CC (Norton et al., 2017). Song et al. (2019) find moderately sized and significant negative effects of CCR on fourth-grade average state NAEP scores (0.06–0.10 SD). The analysis suggests that CCR had a significant negative effect on Black and Hispanic students in fourth-grade reading and for students with disabilities in eighth-grade math. In fourth-grade math and eighth-grade reading, they find statistically insignificant effects. My study of the CC differs from Song and coauthors (2019) study of the effect of content standards on student outcomes. I isolate the initial effect CC, whereas Song et al. (2019) estimate the effect of a more broadly defined content standards treatment.
Several qualitative studies have examined how the implementation of rigorous content standards can change instruction. Collaborating with other teachers improved the confidence of teachers who were developing CC aligned content materials (Herman et al., 2016). Teachers who do not feel they have authority over the implementation of content standards were less likely to make changes to their instruction (Edgerton & Desimone, 2019). Teacher collaboration and autonomy may mediate the effect of the CC on student outcomes via changes to instruction.
My study contributes to the growing literature on CC’s effects. I also leverage the NAEP microdata to estimate intersectional effects for students that belong to multiple academically vulnerable groups. Additionally, my document analysis allows me to observe when states implemented the CC for specific grades and subjects. Using a measure that is specific to states, grades, and subjects allows me to more precisely estimate the effect of CC.
Specifically, I ask the following questions about the initial effect of CC.
Research Question 1: To what extent did Common Core affect student achievement?
Research Question 2: To what extent did Common Core close or exacerbate achievement gaps?
Data and Measures
I use data from four subject/grade NAEP data sets (fourth-grade math, eighth-grade math, fourth-grade reading, and eighth-grade reading) over six waves (2003, 2005, 2007, 2009, 2011, and 2013). The NAEP study uses a complex three-stage sampling design to allow for valid inferences about student achievement outcomes for the nation as a whole, each state, and certain school districts (Rogers et al., 2014). Two strengths of the NAEP are that the assessment items rarely changed across waves and that the sample includes students from diverse backgrounds (including students with individualized education plans and English language learners; Rogers et al., 2014). The NAEP assesses a broader set of skills than the average state summative assessment. The broadness of the state frameworks makes the NAEP particularly useful for examining the CC, which expands the scope of what states expect teachers to learn. Another strength is the low-stakes nature of the NAEP assessment for students and teachers. Accountability pressures on students and teachers could induce measurement error in tests that states use to evaluate schools (Koretz, 2017; Koretz & Barron, 1998; Koretz & Hamilton, 2006). NAEP’s purpose is to inform policy and practice, mitigating the incentive for cheating or gaming.
I merged into the NAEP, data on pre-CC content standards from the Fordham Institute (Carmichael et al., 2010; Finn et al., 2006; Klein et al., 2005). I categorize pre-CC standards as either low or high rigor. Low-rigor standards are “clearly inferior” to the CC according to Carmichael et al. (2010). Standards in the other group were either “indistinguishable from the CC” or were “superior to the CC.” 2 I also merged in Adequate Yearly Progress (AYP) data from 2003 as a measure of baseline school achievement data (Reback et al., 2013). Finally, I merge in data on education reforms adopted during the period of study including teacher evaluation (Bleiberg & Harbatkin, 2018), ESEA (Elementary and Secondary Education Act) Waivers (Center on Education Policy, 2018), high school exit exams, and alternative pathways to teaching (Howell & Magazinnik, 2017; Jordan & Grossmann, 2018).
Dependent Variable
To construct my outcomes of interest, I rely on test score information from six waves of the NAEP. The NAEP is a matrix-based assessment in which each student completes a sample of test items. The NAEP provides plausible values that are created through an item response theory procedure. NAEP then transforms the plausible values into scale scores. I then standardized the scale scores within grade, subject, and year to have a mean of 0 and an SD of 1. I use the first plausible value as my dependent variable. 3
Treatment
To measure changes to state content standards, I conducted a document analysis (Bowen, 2009; see online Supplemental Appendix C). I collected 123 documents from state education agencies (e.g., reports, websites, grant and waiver applications, implementation timelines), surveys, interviews, media reports. All documents were collected from online sources. I made extensive use of the Internet Archive to obtain documents that were taken offline. I define standards implementation as state mandated alignment of instruction with content standards for a specific grade-subject (e.g., fourth-grade math).
The differences in definitions of standards implementation motivate my use of document analysis, which is particularly valuable for studying dynamic historical events like state policy implementation (Bowen, 2009). Document analysis is also useful tool when implementation timelines are not congruent across sources. Whenever possible, I triangulate sources and discuss divergent cases. Ideally, multiple sources of different types (i.e., government documents, interview data, and media reports) describe the same implementation date. For all states, I use multiple sources to corroborate the implementation date of the CC standards. I measure when the CC standards were adopted, when implementation was planned, when implementation occurred if at all, and when an alternative set of standards was implemented. Analyzing state specific documents across time increases my confidence that I have observed when implementation occurred. For example, if the documents show that a state adopted the CC standards in May 2010, 1 month later describes plans to implement in 2013, and then reports in December 2014 that implementation occurred in 2013, then my assertion that implementation occurred in 2013 is valid. I find that states adopted the CC standards from February 2010 to June 2012 and implemented the standards from the 2012 school year to the 2015 school year (see online Supplemental Table B1). Two states implemented CC in 2012 and ten more followed in 2013 (see online Supplemental Table B2).
Schools were engaged in a variety of activities to prepare for the CC prior to formal implementation of the standards (e.g., professional development, curriculum). The crux of the CC intervention is raising state expectations for student learning. The formal change in state content standards is observable for a precise school year. Other changes like the use of CC aligned textbooks may have occurred in 2011 or later depending on the state (Polikoff, 2017). Teachers may have adjusted their expectations for student learning after participation in PD on the CC or developing CC alignment curriculum in 2011 or in subsequent years.
Surveys of state and school leaders provide some evidence that CC preparation activities were underway in 2011, prior to mandated instructional alignment in subsequent years. An important context for interpreting survey results on CC preparation activities is that states required districts to comply, which could influence how educators respond to surveys. Among a sample of 36 states that had adopted the CC in 2010, 13 states required districts to provide professional development for teachers and principals to support implementation of the CC, and 22 reported that districts were expected to do so (Kober & Rentner, 2011b). Among CC adopters, 11 states required districts to align teacher evaluation systems with CC, and 10 required the alignment of new curriculum materials and/or instructional practices with CC. Thirty-seven states reported providing, guiding, or funding professional development on the CC in the 2011 school year (Webber et al., 2014). Sixty-six percent of school districts in states that had adopted the CC reported intentions to develop a comprehensive plan and timeline for implementing the CCSS in either 2011 or 2012 (Kober & Rentner, 2011a). Teachers began aligning their instruction to the CC before state mandates. A national survey (Markow et al., 2013) found that 46% of principals and 62% of teachers reported that a great deal of teachers in their school were using the CC in the 2012 school year when only three states (Nevada, Kentucky, and the District of Columbia) were requiring full implementation the standards. If there is an effect of CC, I ought to be able to detect it in 2011 and would expect its size to increase in 2013.
Covariates
The NAEP student survey contains a robust set of student characteristics. I control for exogenous student characteristics including gender, whether the student has an individualized education plan, English language learner (ELL), eligibility for free or reduced-price lunch (FRPL), and race/ethnicity. I also add measures for whether the student is at, above, or below the modal age for their grade level. These exogenous student characteristics control for observable differences between the students in states that were early and late implementors of the CC that are correlated with student outcomes. I also include a baseline measure of school achievement (AYP status in 2003) and lagged state average NAEP scores. 4 Baseline AYP status controls for pretreatment differences in student outcomes.
Sample
I observe about 83,000 students for each subject-year (see online Supplemental Table B3). Eight states implement the CC early in fourth-grade math, seven states implement the standards early in eighth-grade math, and 10 states implement early in reading (fourth and eighth grades). Figure 2 visually displays the treated states (i.e., early implementors) by grade and subject. Early implementing states are spread out through the nation and appear to be diverse politically and demographically (LaVenia et al., 2015). For each grade and subject, there are about 24 comparison states that implemented the standards late (2014 or 2015; see online Supplemental Table B2).

Implementation of Common Core in English language arts and math by state in 2013.
States were excluded from the analytic sample for three reasons. First only, states that had low rigor content standards prior to the CC were included (Carmichael et al., 2010). Ideally, I would use states that had no content standards as a control group, but every state had content standards prior to the CC. I also exclude states (i.e., Colorado, Pennsylvania, North Carolina, and New York) that replaced the CC with content standards that differed substantively from the CC. I exclude states that make major revisions because of endogenous political dynamics that influenced the implementation of CC and also student outcomes within New York and North Carolina. Colorado and Pennsylvania revise their content standards before instructional alignment was ever scheduled to take place in the 2013–2014 school year. New York and North Carolina both phase in the CC content standards during the 2012–2013 school year and during the same school year begin the legal/political process that ultimately replaces the standards in the 2013–2014 school year. Because New York and North Carolina are both implementing and revoking the standards in the 2012–2013 school year, I choose to exclude them from the analytic sample. Finally, I exclude states that never adopted the CC but did reform their content standards (i.e., Alaska, Texas). These states adopted standards that are substantively different from the CC. Each grade-subject includes about 2,000 school districts and about 4,000 schools. In total, there are about half a million students for each grade subject.
Estimation Strategy
I estimate the initial effect of the CC on student achievement in a difference-in-differences framework. I compare states that were early implementors of the CC (2011–2013) to late implementors (2014 to 2015). I begin by estimating a series of models that assume the following general form:

where y is a NAEP test score (standardized by subject, grade, and year) for student i, school c, state s, and year t. EarlyCC 2011 is equal to 1, if a state is preparing for the CC in 2011 prior to mandated instructional alignment in 2013, and zero if the state implements the CC in 2014 or later. EarlyCC 2013 is equal to 1 for states that mandated instructional alignment in 2013, and zero if the state implements the CC in 2014 or later. β1 is the initial effect of preparing for CC on NAEP scores within states that were early implementors of the CC in 2013. β2 is the coefficient of interest, the initial effect of implementing the CC on student outcomes within states that were early implementors of the CC in 2013.
I then estimate a nonparametric event-study specification, which models pre- and posttreatment effects in a fully flexible way:

The estimates from the event study measure effects relative to outcomes in 2009, the last year prior to CC implementation. For the pretreatment years, τ1, τ2, and τ3 model pretreatment effects of CC relative to 2009. In the two posttreatment years, τ5 and τ6 estimate the effect of CC relative to 2009. Equation 2 includes state or district fixed effects and the full set of covariates in Equation 1. The analytic sample includes the year 2003 to 2013 and excludes states that never adopted the CC, made major revisions to the CC, or had high rigor standards prior to the CC.
To answer the second research question, I add interactions between the treatment indicators, membership in race/ethnic groups, and eligibility for FRPL. Here, I employ a critical quantitative approach (Sablan, 2018). I leverage the detailed information about student race/ethnicity by not aggregating racial subgroups. For example, I test for effects within groups of Hispanic/Latinx student (e.g., Mexican, Cuban, Puerto Rican). I also test whether the effect of CC differed for race/ethnic groups across levels of socioeconomic status (SES; i.e., FRPL eligibility) and for ELLs.
In a difference-in-differences framework, the key assumption is that outcomes for students in treated states (early CC implementors) would have followed the same trajectory as students in comparison states (late CC implementors) in the absence of treatment. If the treatment and comparison groups had systematically different pretreatment trends then the assumption of parallel trends is violated. Figure 3 shows a flat pretreatment trend for both treatment and comparison states prior to the implementation of CC. For fourth-grade math and eighth-grade math the mean outcome differs by less than 1.5% of an SD. Visually the pretreatment trends in math appear flat for both the treatment and comparison groups. For fourth-and eighth-grade reading, there is visual evidence that the assumption of parallel trends is violated. The pretreatment trends for the treatment and comparison groups in reading cross, which implies their trajectory posttreatment may be attributable to something other than implementing the CC. The differing pretreatment trends invalidate the difference-in-differences estimation strategy and renders inferences about CC’s effect on reading outcomes to be merely descriptive. In the subsequent interpretation of the results, I focus primarily on CC’s influences on math scores where the flat pretreatment trends imply that the difference-in-differences estimates are valid.

NAEP score trends.
A salient issue when estimating the initial effect of CC are changes that states made to standards after the adoption of CC. Starting in 2014, several states made major revisions to the CC and some revoked them entirely. In 2014 and later, teachers reacted to announced changes and revisions, which changed how the CC influenced student outcomes. I avoid potentially endogenous teacher reactions by restricting the period of study from 2003 to 2013. The sample restriction also avoids conflating the effect of the CC standards with the CC assessments which were first used in 2015.
Results
Figure 3 depicts the trends in outcomes for the treatment and comparison groups. Each panel describes the trend for a NAEP grade–subject (fourth-grade math, eighth-grade math, fourth-grade reading, and eighth-grade reading). The x-axis is the NAEP year and the y-axis is NAEP student outcomes standardized within subject, grade, and year. CC (red line) describes average outcomes for students in states that were early implementors of the CC. Comparison (blue line) describes the average outcomes for students in states that were late implementors of the CC. 2009 is the last wave prior to the start of preparation for CC in 2011 and the implementation of standards in 2013. Average fourth- and eighth-grade math outcomes for comparison states are about flat from 2003 to 2013. In fourth-grade math, average outcomes increase for states that were preparing for CC and had implemented CC. In fourth-grade math, average NAEP scores were about 3% of an SD higher in 2013 compared with 2009 and about 2% of an SD higher in 2013 compared with 2011. In eighth-grade math, the outcomes for treatment states increase in 2011 before dipping in 2013. The pattern of results for reading does not suggest any change in scores after the implementation of CC.
Regressions
Table 1 describes the initial effect of the CC on student outcomes in the analytic sample. All models include district fixed effects and the covariates described in Equation 1. The initial effect of implementing the CC is significant in math but not reading. The initial effect of CC on math scores is significant and between 4% and 10% of an SD (see online Supplemental Table A3). The initial effect of CC on fourth-grade math in 2011 is 0.05 SD in 2011 and then doubles (SD = 0.105) in 2013. The initial effect of CC on eighth-grade math scores is stable across the posttreatment periods (~SD = 0.45). The nonparallel pretreatment trends for reading (Figure 3) violate the assumption required to identify effects in a difference-in-differences framework. The pretreatment trends cross multiple times and imply the direction of the bias could be either negative or positive. The available evidence suggests no relationship between CC implementation and reading outcomes.
Effect of Common Core on NAEP Scores

Source. U.S. Department of Education, National Center for Education, Statistics, NAEP, “Student and Teacher Survey,” 2002–2003, 2004–2005, 2006–2007, 2008–2009, 2010–2011, 2012–2013.
Note. See online Supplemental Table B2 for detailed exclusion criteria. Standard errors are robust to clustering by school. Covariates includes Female, individual education plan, English language learner, race/ethnicity, modal age for grade, school AYP status in 2003, and lagged average state scores. Sample sizes rounded in accordance with NCES nondisclosure rules. Estimates adjusted using NAEP student-level probability weights. CC = Common Core State Content Standards; Adj = adjusted; FE = fixed effect; AYP = adequate yearly progress; NAEP = National Assessment of Educational Progress.
p < .05. **p < .01. ***p < .001.
Event Study
Figure 4 includes the results from the event study (see online Supplemental Table B4 for full results). The four columns describe results from each of the NAEP data sets (fourth-grade math, eighth-grade math, fourth-grade reading, and eighth-grade reading). The models in Figure 4 include district fixed effects and covariates. The pretreatment estimates are both individually and jointly indistinguishable from zero, suggesting the pretreatment trends assumption is met. In the event study, there is no evidence of trends in student performance prior to the CC after the inclusion of controls. For fourth-grade math the effect of implementing the CC is about twice as large as the effect of preparing for the standards (9.5% of an SD). In eighth-grade math the effect of CC is about 4% of an SD in both posttreatment years. Consistent with the previous models, the effects of CC are significant in math but not reading.
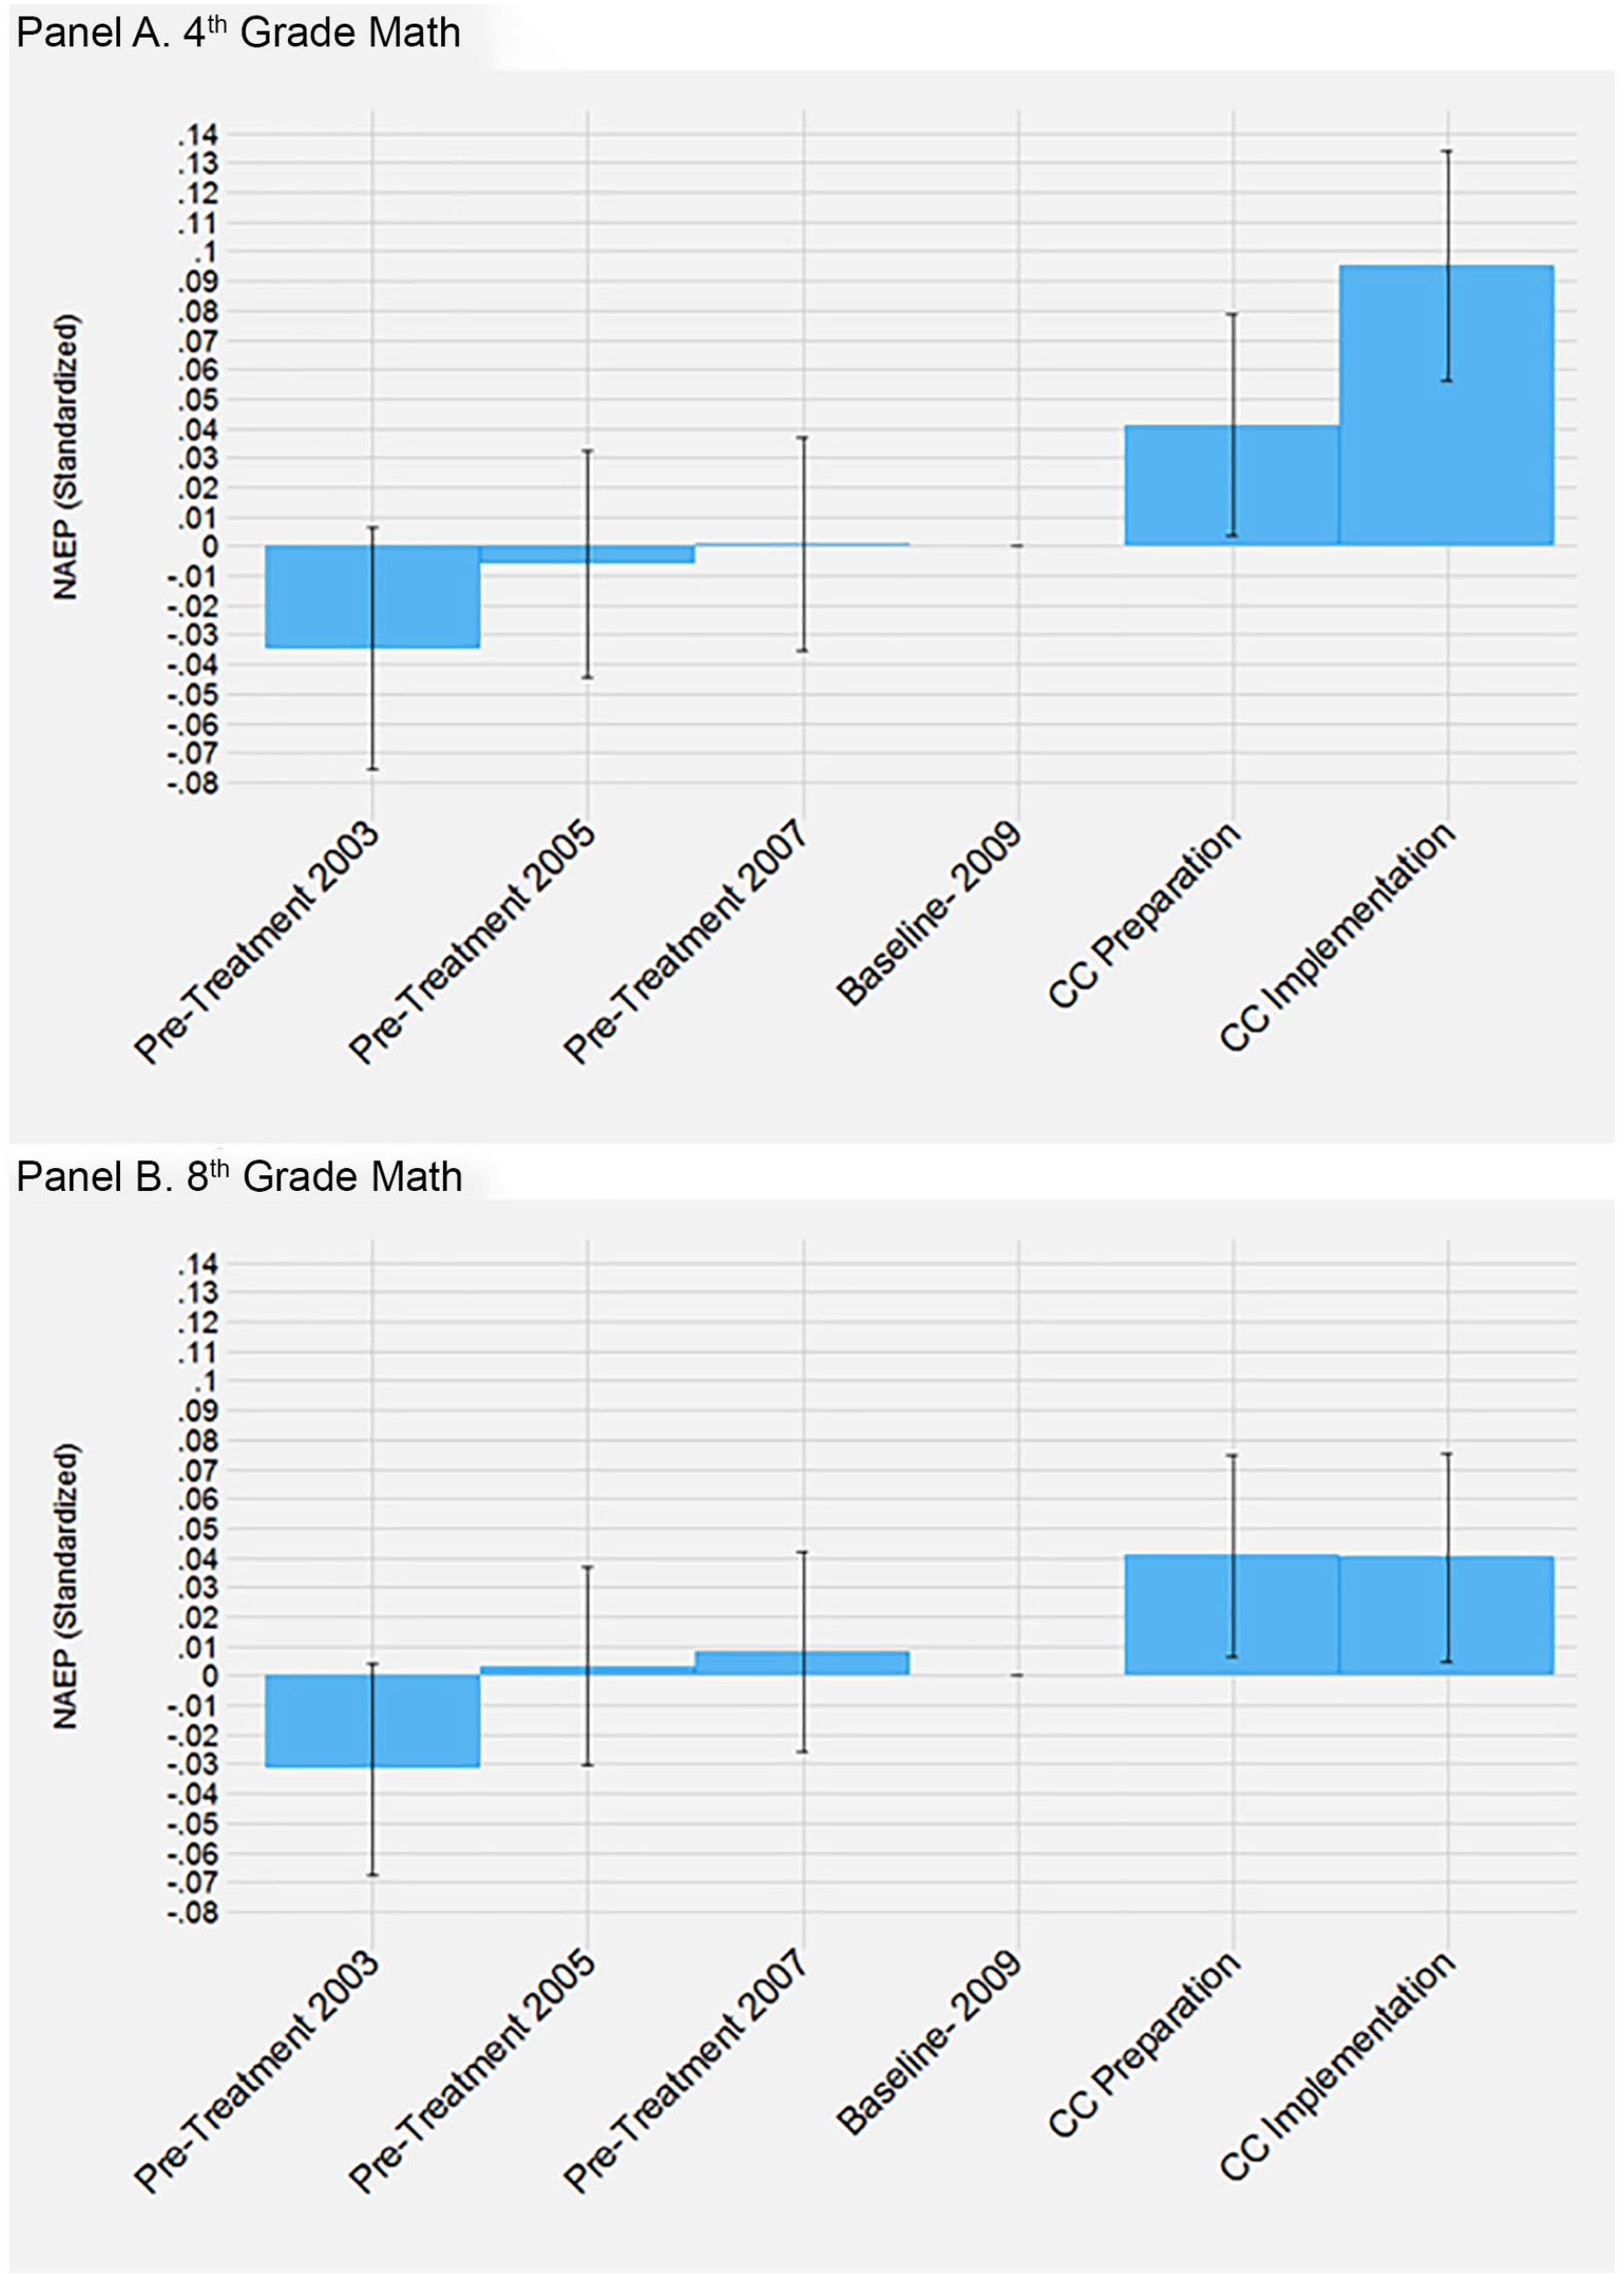
Event study on fourth- and eighth-grade math.
Differential Effects for Academically Vulnerable Students
Table 2 adds interactions between membership in academically vulnerable populations and implementation of the CC. The first row of Panel A describes the main effect of implementing the CC, which here is interpretable as the effect of implementing the CC for White economically advantaged students (FRPL ineligible). The subsequent rows compare outcomes for academically vulnerable students relative to White economically advantaged students. Figure 5 visualizes the effect of CC for race/ethnic groups. Across race/ethnic groups, CC contributes to the closure of achievement gaps. The White–Black achievement gap is about 5% of an SD smaller after the CC in fourth-grade math and about 6% of an SD smaller in fourth-grade reading. In fourth- and eighth-grade math, CC shrinks the White–Hispanic achievement gap by about 16% of an SD. fourth-grade math outcomes for FRPL eligible students decline by 6% of an SD after CC. In math, the benefits of CC were shared across race/ethnic groups but not across SES. Similar to the main results, I cannot detect the effect of CC on academically vulnerable populations on reading outcomes.
Differential Effects of Common Core for Academically Vulnerable Students

Source. U.S. Department of Education, National Center for Education, Statistics, NAEP, “Student and Teacher Survey,” 2002–2003, 2004–2005, 2006–2007, 2008–2009, 2010–2011, 2012–2013.
Note. See online Supplemental Table B2 for detailed exclusion criteria Standard errors are robust to clustering by school. See Table 1 for a full list of covariates. Sample sizes rounded in accordance with NCES nondisclosure rules. Estimates adjusted using NAEP student-level probability weights. ELL = English language learner, CC = Common Core State Content Standards; MG = math grade; RG = reading grade; Adj = adjusted; FE = fixed effect; FRPL = free or reduced-price lunch; NAEP = National Assessment of Educational Progress.
p < .05. **p < .01. ***p < .001.
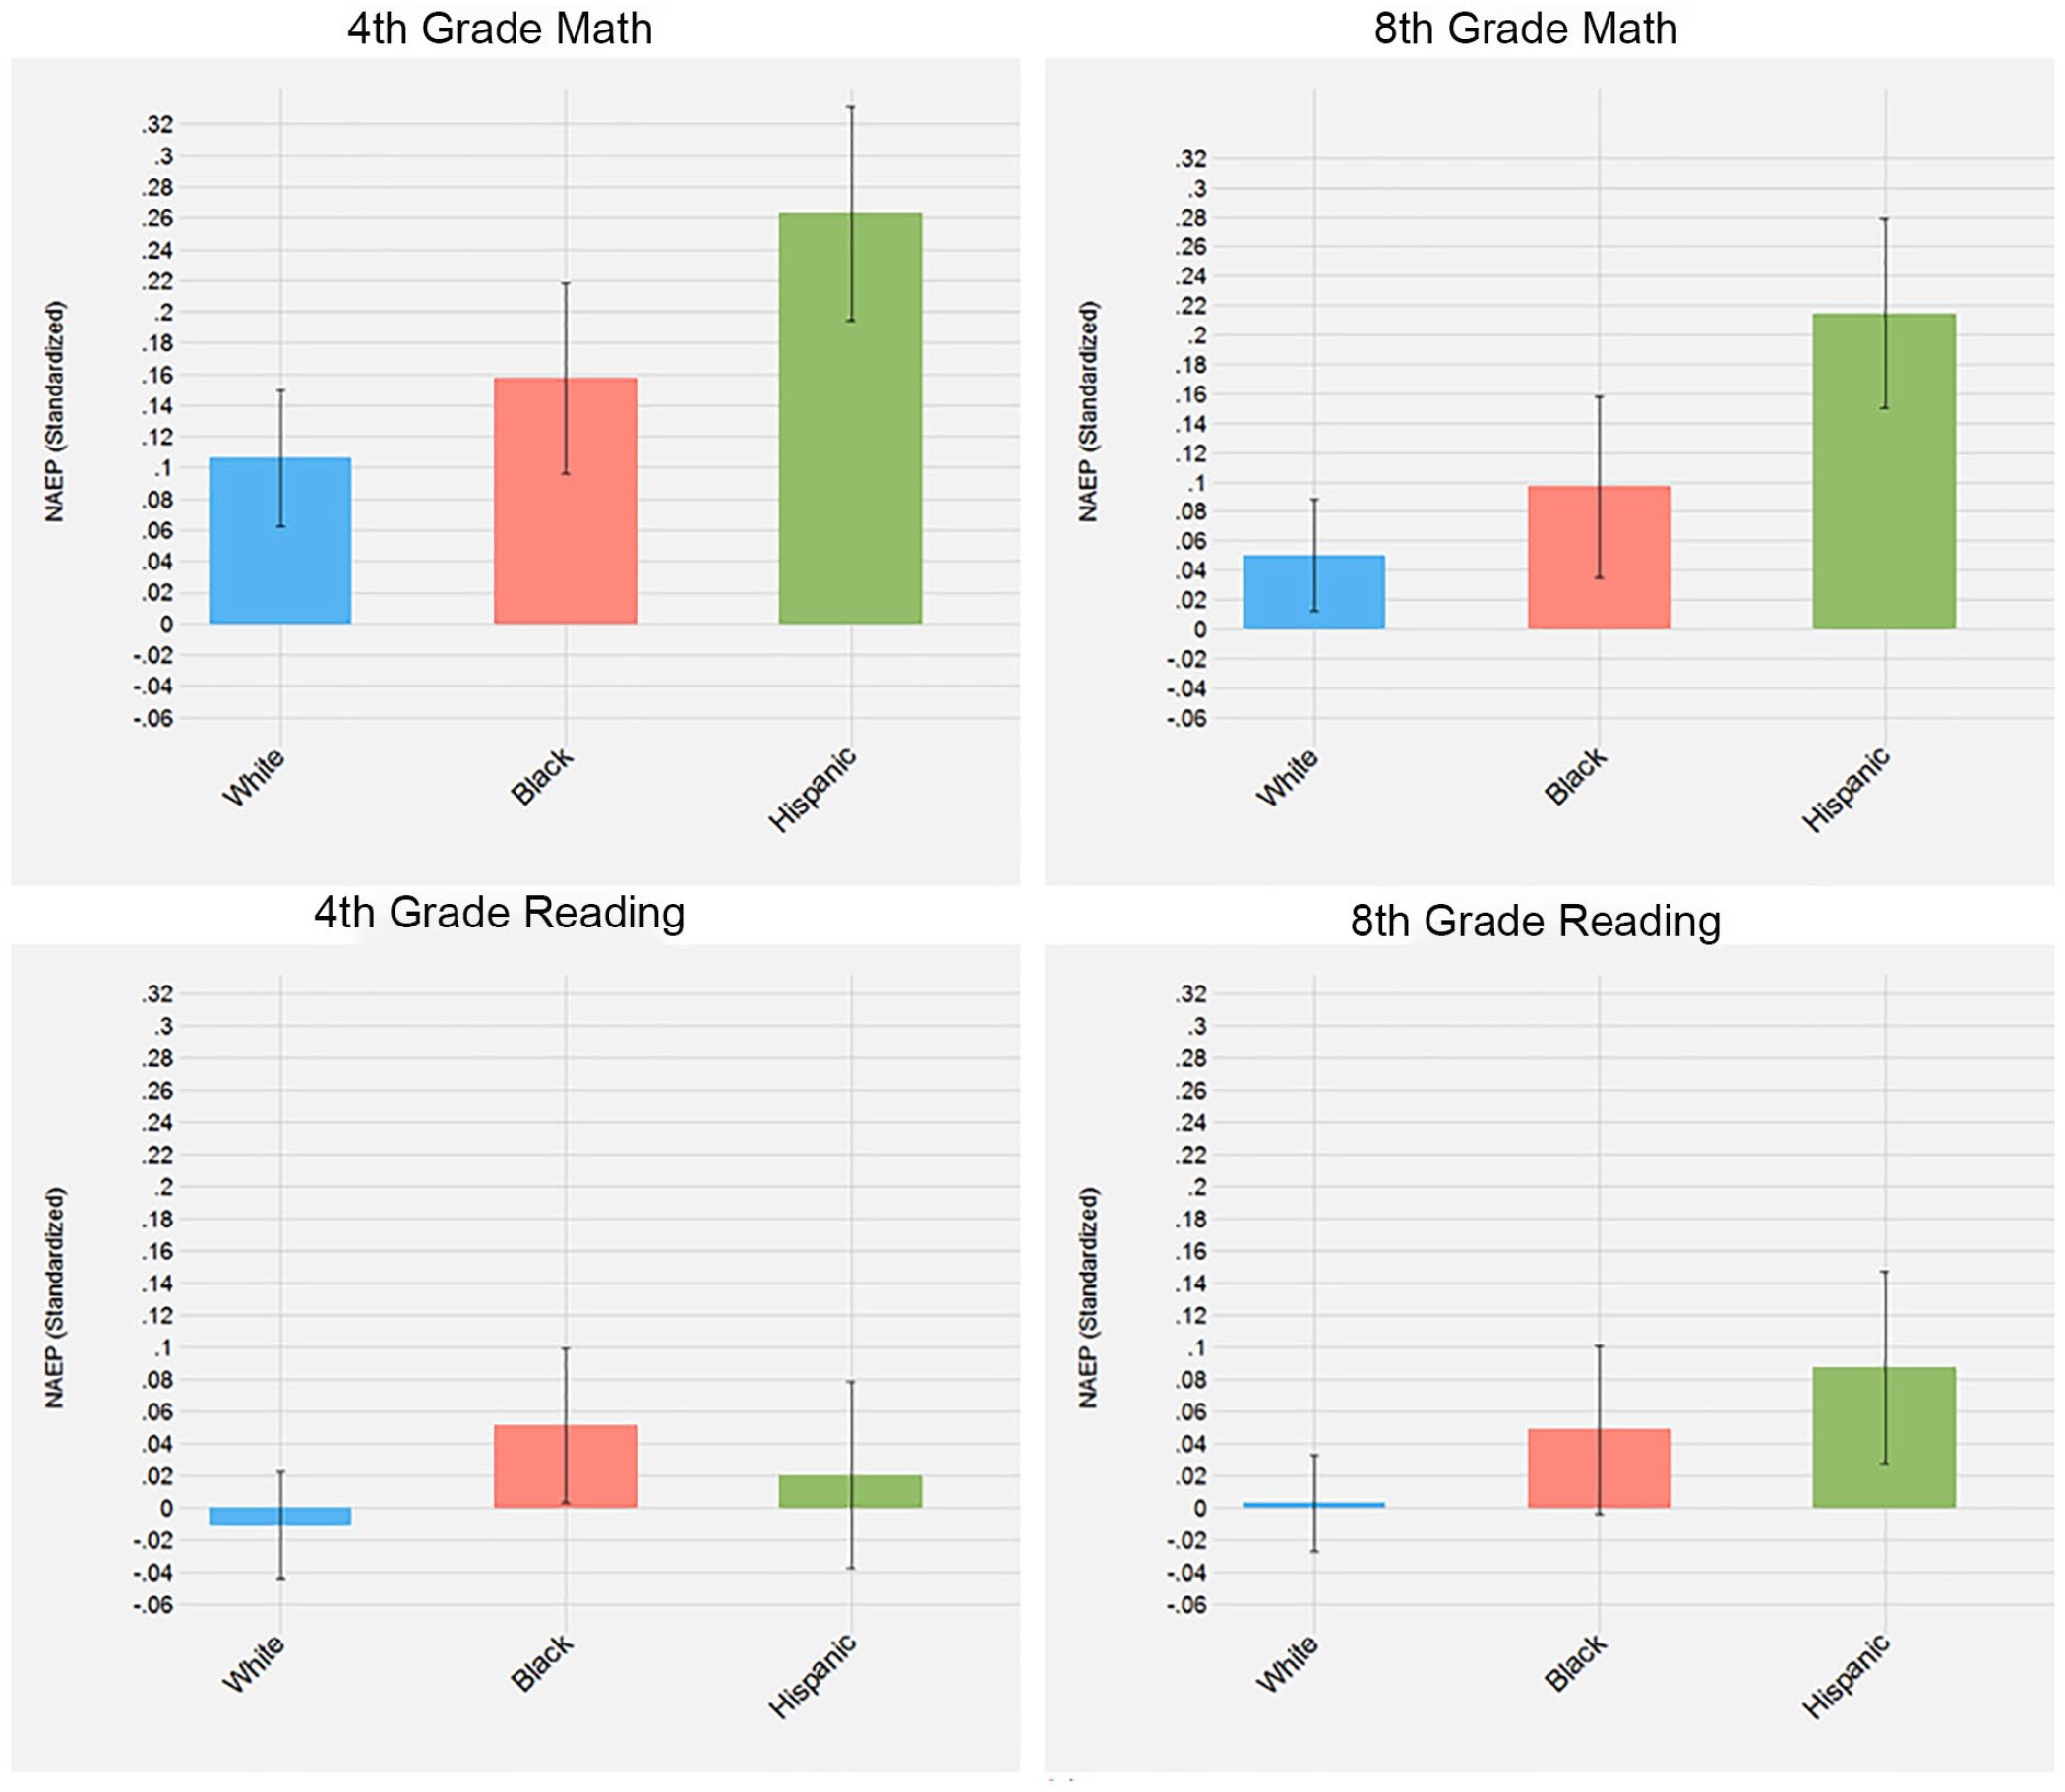
Common Core effects on achievement gaps.
In Table 2, Panel B, I estimate models where I interact the main effect of implementing the CC with a variable indicating a student is an ELL. The effect of the CC on math remains about the same size and significance for fourth-grade math and eighth-grade reading. Similar to the main difference-in-differences models, there is no detectable effect on reading scores. The gap in fourth-grade math scores between academically advantaged students in the reference category and ELLs decreases by about 12% of an SD. A major concern for educators is that ELLs are, “at risk for not satisfactorily achieving the standards—particularly in English Language Arts” (Roseberry-McKibbin, 2015). The gap between academically advantaged students and ELLs increases in fourth-grade reading, although the change is statistically insignificant. In eighth-grade reading the gap between academically advantaged students and ELLs increases by about 12% of an SD. I interpret the reading results descriptively due to the evidence that pretreatment trends in reading outcomes could bias the effect of CC. The descriptive negative results on reading scores are concerning and insufficient to ameliorate concerns about the CC’s effects on ELLs.
Intersectional Effects
Figure 6 describes the effect of implementing the CC for economically advantaged and disadvantaged students from different race/ethnic groups. To produce the estimates in Figure 6, I add interactions between implementing CC, membership in a race/ethnic group, and a measure of economic advantage (FRPL eligibility). The effect of CC on fourth- and eighth-grade math is about 5% of an SD larger for economically advantaged White students when compared with economically disadvantaged White students. The effect of CC on fourth-grade math is about 15% of an SD larger for economically advantaged Black students when compared with economically disadvantaged Black students. In eighth-grade math there is no significant difference between CC’s effect on economically advantaged and disadvantaged Black students. The positive effect of CC was larger for economically advantaged White and Black students than the effect of CC for economically disadvantaged White and Black students in math. The CC had a larger positive effect (0.1 SD) for economically disadvantaged Hispanic students than for economically advantaged Hispanic students in fourth-grade math. 7 A possible explanation is that expectations of economically disadvantaged Hispanic student’s English comprehension was systematically lower than economically advantaged Hispanic students, but there were no differences in English comprehension. If true, raising expectations for Hispanic students would disproportionately benefit economically disadvantaged Hispanic students.

Common Core effects by race/ethnicity and economic disadvantage.
Student Absences
In Table 3, I estimate the effect of CC on student absences. The CC content standards raise expectations for student learning. Teachers can influence absenteeism by shaping student’s attitudes toward school (Gershenson, 2016; Gottfried & Gee, 2017; Liu & Loeb, 2019; Tran & Gershenson, 2021). CC could influence student absences via teachers by influencing expectations for student learning or the alignment of instruction with content standards. To create the student absence measure, I use an item from the NAEP student survey that asks, “How many days were you absent from school in the last month? Students can respond: “None, 1 or 2 days, 3 or 4 days, 5 to 10 days, or more than 10 days.” Table 3 includes the results from an ordered probit model with state and year fixed effects where I pool across grades and subjects. CC is associated with a small and insignificant increase in student absences. It appears that the changes that CC makes within schools (i.e., teacher expectations for student learning, the alignment of instruction with content standards) are not correlated with student absences.
Effect of CC on student absences

Source. U.S. Department of Education, National Center for Education, Statistics, NAEP, “Student and Teacher Survey,” 2002–2003, 2004–2005, 2006–2007, 2008–2009, 2010–2011, 2012–2013.
Note. Regression results from an ordered probit model. The outcome is derived 5 an item where the possible responses where teacher indicated the number of days a student had been absent in the past month: none, 1 to 2 days, 3 to 4 days, 5 to 10 days, more than 10 days. See online Supplemental Table B2 for detailed exclusion criteria. Standard errors are robust to clustering by school. See Table 1 for a full list of covariates. Sample sizes rounded in accordance with NCES nondisclosure rules. Estimates adjusted using NAEP student-level probability weights. CC = Common Core State Content Standards; FE = fixed effect; NAEP = National Assessment of Educational Progress; NCES = National Center for Education Statistics.
Robustness Checks
A remaining issue is the possibility of unobserved state reforms that occurred contemporaneously with the implementation of CC and influence student outcomes. For example, if states implemented teacher evaluation at the same time as CC, then teacher evaluation would bias the effect of CC. The fixed effects control for any time-invariant state or district policy that would bias the effect of CC. Additionally, I find that the results in math are robust to controlling for time-varying education policies (see online Supplemental Tables A8, A9, and A10).
A final concern is systematic differences between the treated states that chose to implement the CC early and the comparison states that chose to implement the CC late. For example, if the states implemented the standards early because they knew they had high levels of capacity then the high levels of capacity could explain any positive effects. It is also possible that late implementing states waited because they thought they lacked the capacity to implement the CC. The lack of capacity could also explain changes in student outcomes. State capacity could vary based on experience with implementing rigorous content standards.
I test whether early and late CC implementors states had systematically different levels of capacity for education reform in Table 4. Capacity for state education reform is a multifaceted concept (Manna, 2006). I collected measures of education resources, political capacity, standards-based reforms, and content standards rigor. Using a state-level data set, I ran bivariate models, where I regressed an indicator for whether states were early or late implementors of the CC on state capacity characteristics that were measured prior to CC. The results from the models are displayed in Table 4. Models in the second and third columns use data from all states after list-wise deletion. Column 2 contains the mean differences between states that were early implementors of the CC compared to all other states. Models in the fourth and fifth columns exclude states that did not adopt the CC, made major revisions to the CC, or had high-rigor standards prior to the CC for any grade and subject. Column 4 contains the mean differences between states that were early implementors of the CC compared with late implementors of the CC. There were no significant differences in state capacity for education reform when I compare early implementors or late implementors. The document analysis suggests that the availability of the CC assessments influenced when states chose to implement the CC content standards. Test writers were developing and piloting the assessments from 2010 to 2014, and they were first administered in 2015. Forty-seven percent of states that were early implementors of the CC standards chose to use the CC assessments in 2015, whereas 73% of states that were late implementors of the standards chose to implement the standards and assessments in the same year (2015). Unobservable differences in capacity to implement content standards may have biased the results. But the document analysis suggests that states were influenced by the availability of the assessments, which is exogenous prior to 2015.
Pretreatment Balance on Education Reform Capacity

Note. Estimates are from separate state-level models where I regress an indicator for whether a state implements CC by 2013 on each characteristic. Models in the second and third columns use data from all states. Models in the fourth and fifth rows exclude states that did not adopt the CC, made major revisions to the CC, or had high-rigor standards prior to the CC for any grade and subject. State characteristics include educational resources, political capacity, standards-based reforms, and content standards rigor. Each educational resource characteristic is a state average from 2009, except for median household income and value, which was measured in 2000. Education resource data from School Funding Fairness Data System (Baker et al., 2020). Political capacity data were collected from several sources: CC adopting institution (National Conference on State Legislatures, 2020), State Education Agency staff in 2011 (C. Brown et al., 2011), support for education spending (American National Election Studies, 2013). I collected data on CC consortia and assessments collective from state reports on summative assessments (Salazar, 2014; Woods, 2015, 2018) and data on the state accountability systems CSSO and Education Department reports (Erpenbach, 2008, 2011; Erpenbach et al., 2003; Erpenbach & Forte, 2005, 2007; Fast & Erpenbach, 2004; Forte & Erpenbach, 2006; Hoffer et al., 2011; U.S. Department of Education, 2017, 2020). Data on content standards rigor were collective from studies of content standards (AFT, 2006; Carmichael et al., 2010). Data on content standards rigor were collective from studies of content standards (AFT, 2006; Carmichael et al., 2010). SEA = State Education Agency; ELA = English language arts; ESEA = Elementary and Secondary Education Act; PARCC = Partnership for Assessment of Readiness for College and Careers; CC = Common Core State Content Standards.
Discussion
CC had a small positive effect on math scores (0.04–0.10 SD) and no detectable effect on reading scores. The benefits of CC were clearest in fourth-grade math. Critically, the effect of CC varies across academically vulnerable students. The CC had a large positive effect on Black economically advantaged students across grades and subjects. Academically vulnerable students whose families equipped them with the benefits of high SES in the form of economic capital benefitted when the CC raised expectations. However, for students from economically disadvantaged families that faced other barriers to academic success the CC backfired. Raising state expectations without addressing the structural issues burdening economically disadvantaged students will at best maintain the status quo. Higher expectations provide the greatest benefit to students when students also have the resources needed to succeed.
A nascent consensus in the literature on the effects of CC on student outcomes is emerging. Consistent with the analysis herein, Loveless (2014, 2015, 2016), Xu and Cepa (2018), Gao and Lafortune (2019), and Allensworth et al. (2021) all find small positive correlations between the CC and student outcomes. Song et al. (2019) find largely negative effects of the CCR standards, which includes CC implementing states, states that made major revisions, and states that never adopted the CC. The results of both studies are consistent if the negative effects are isolated among states that revised or revoked their standards after adopting the CC.
The small effects I find in math but not reading are consistent with the prior literature on the relationship between content standard reforms and changes to instructional alignment. Instructional alignment is the most potent pathway through which the CC could influence student outcomes. Teachers have reported not being able to align their instruction with the state content standards that preceded CC (Spillane, 1996, 1999). The adoption of state content standards reforms prior to CC resulted in “superficial” changes to instruction (Polikoff, 2012). Despite considerable state efforts to compel teachers to enact the content standards, relatively few teachers aligned their instruction. Teachers likely faced similar challenges implementing the CC and the lack of instructional alignment explains the small and null effects. Polikoff (2012) finds that instructional alignment with contents standards in math was significantly larger than instructional alignment in reading. If the CC had a similar effect on instructional alignment in math but not reading, then it could explain why I find larger effects on math outcomes.
There is scant evidence that replacing the CC standards will benefit students. I find no evidence that student outcomes declined due to the implementation of CC. Making multiple substantive changes to content standards sends a confusing signal to teachers and schools. I find the CC increased math outcomes in states that chose to implement the content standards before switching to a new assessment. States should consider focusing on implementing one standards-based reform at a time. Conversely, pursuing changes to content standards and assessments at the same time may put too must strain on schools.
The positive effect on math outcomes and null results on reading outcomes is consistent with previous research on content standards. The effects of school interventions are frequently larger in math than in reading. Factors like home environment, other coursework, and extracurricular activities have a greater influence on reading relative to math outcomes (Early et al., 2014). In addition, the Principles and Standards for School Mathematics written by the National Council of Teachers of Mathematics (NCTM) may have prepared math teachers for more rigorous content standards. The NCTM standards described principles for learning core mathematics concepts and were akin to a first draft of the math CC standards. The experience from using the NCTM could have enhanced the clarity, specificity, and coverage of the CC math standards. There is no analogue to the NCTM standards for reading. The developers of the CC reading standards faced the challenge of writing the first national reading standards and the appropriate role of informational texts, which remains unresolved (Porter-Magee, 2012). Between the experience with the NCTM and the challenges of writing reading standards, it is possible that the CC math standards were relatively better than the CC reading standards.
I also find that the CC had larger effects on fourth-grade math when compared with eighth-grade math. One possible explanation is that the CC math content standards rearranged the order in which some concepts were taught. For example, the CC math content standards omit some algebra concepts from the eighth-grade standards and the fourth-grade standards direct teachers to focus more on mathematical reasoning.
My analysis has a few salient limitations. It is proper to characterize the main results as the initial effects of CC. I am unable to estimate unbiased long-term effects of the CC on student achievement. The generally positive pattern of results persists in 2015 and 2017 for early implementing states (see online Supplemental Table A6). However, the flat outcomes for late implementors suggest that some reaction to treatment biases the estimates. Although the effect of CC on math scores is statistically significant and positive, the size of CC’s effect on math scores is sensitive to the various modeling choices and sample restrictions (0.03–0.10 SD; see online Supplemental Tables A2 and A3). Finally, it is not possible to rule out that unobservable differences in state capacity to implement content standards account for the results I describe.
I hypothesized that changes to instructional alignment or curriculum would mediate the effect of CC on student outcomes. A limitation of my data is that I cannot observe either instruction or curricula across states and time. However, the implementation of CC is associated with a decrease in differentiated instruction overall and the specific practice of setting different learning goals for students (see online Supplemental Table A4 and A5). The effect of CC on differentiated instruction is consistent with the idea that CC causes teachers to raise and equalize their expectations for student learning. Given the limited window in which I observe posttreatment outcomes, it is unlikely that teachers had enough time to change their instruction. A limitation of my analysis is that I cannot isolate the extent to which the effects I observe are due to changes in instructional alignment or teacher expectations.
I find that the benefits of CC were isolated among economically advantaged students as measured by eligibility for FRPL, which is a noisy measure of SES. In future research I hope to better understand which forms of economic, social, or cultural capital explain differential effects. Another potential line of research would examine how the CC changed teacher instruction via collaboration and autonomy. The CC does not work equally well for all students across schooling contexts. Understanding what causes those differences is key to improving the next generation of content standards.
Supplemental Material
sj-docx-1-ero-10.1177_23328584211010727 – Supplemental material for Does the Common Core Have a Common Effect? An Exploration of Effects on Academically Vulnerable Students
Supplemental material, sj-docx-1-ero-10.1177_23328584211010727 for Does the Common Core Have a Common Effect? An Exploration of Effects on Academically Vulnerable Students by Joshua Bleiberg in AERA Open
Footnotes
References
Supplementary Material
Please find the following supplemental material available below.
For Open Access articles published under a Creative Commons License, all supplemental material carries the same license as the article it is associated with.
For non-Open Access articles published, all supplemental material carries a non-exclusive license, and permission requests for re-use of supplemental material or any part of supplemental material shall be sent directly to the copyright owner as specified in the copyright notice associated with the article.