
Abstract
Existing literature on the impact of Common Core State Standards in Math has shown little benefit, but it has not examined variation in outcomes based on implementation strategies, student subgroups, or outcomes other than test scores. We use a difference-in-differences approach with school fixed effects to compare outcomes in pre- and poststandards years across schools with different levels of participation in professional learning around the standards in the middle grades in Chicago. Postimplementation, there were significantly greater improvements in student reports of standards-aligned instructional practices, math grades, pass rates, and test scores in schools with more extensive professional learning around the standards, among students with low and average initial achievement. Relationships were largely not significant for students with high initial achievement. We discuss why Chicago might have seen positive results, including the district emphasis on professional learning around the practice standards and differential impacts based on student prior achievement.
Keywords
The adoption of the Common Core State Standards in Mathematics (CCSS-M) by most states across the country brought ambitious new targets for what students should learn and be able to demonstrate in school, and significant new demands on teachers. Almost 10 years after states began implementing the CCSS-M, there is only limited research on how student outcomes have changed in response to the new standards. The studies that exist focus exclusively on test scores and do not differentiate effects for students with different achievement levels. They also tell us little about which strategies for implementing the standards might be effective, as they examine average changes across entire states.
New standards by themselves cannot raise student achievement—they depend on the work of districts, schools, and teachers to interpret the standards and effectively shift instructional practice (Toch, 1991; Tyack & Cuban, 1995). Because the CCSS-M were intentionally constructed to allow flexibility in implementation across districts and schools, we can expect that the extent to which new standards led to improved student achievement varied widely depending on district implementation strategies. After reviewing the literature on CCSS-M implementation, we identify teacher professional learning (PL) around instructional practices as a particularly promising standards implementation strategy. We then examine changes in student outcomes across schools in Chicago based on their use of supports for PL around the standards, asking the following questions:
How did students’ reports of instructional practices, their test scores, grades, and pass rates in math change with implementation of the CCSS-M, based on their schools’ level of participation in standards-related PL?
How did changes in math outcomes differ for students with low, average, and high prior math achievement?
The CCSS-M Transition: Research on Implementation and Student Outcomes
The CCSS-M contain two different types of standards. Content standards describe what students should learn at each grade level, whereas practice standards call for learning “processes and proficiencies” to support conceptual understanding across content areas. The practice standards include asking students to “make sense of problems and persevere in solving them,” “reason abstractly and quantitatively,” and “construct viable arguments and critique the reasoning of others” (Common Core State Standards Initiative, 2020c). Conceptual understanding, widely understood to derive from knowledge of key mathematical principles and how they relate to one another (Hiebert & Lefevre, 1986; Rittle-Johnson et al., 2001), can be fostered by having students engage in these types of practices (Camburn & Han, 2011; Hattie, 2009; Prawat, 1989; Rittle-Johnson & Schneider, 2015). Integrated with instruction on procedural learning, they have been shown to improve student achievement (Baroody, 2003; Fennema et al., 1996; Kazemi, 1998; Newmann et al., 2001; Rittle-Johnson et al., 2001; Wenglinsky, 2002).
Research on whether the CCSS-M have actually led to improvements in math achievement is sparse and filled with caveats. Polikoff (2017) identified four priority areas for research around the CCSS-M: (1) studies on the effects of the standards on student outcomes, (2) research on implementation, (3) research on how supports provided through district and school implementation plans change teacher practice and student outcomes, and (4) examination of heterogeneous effects on subgroups of students. To date, there are only a few studies in each of these areas, and many gaps remain in what is known.
Studies on the Effects of Standards on Student Outcomes
Because the standards were adopted by almost all states at the same time, it is difficult to find comparison groups to develop strong causal estimates of their effects on students. Several studies have used states as the unit of analysis, comparing student achievement in years before and after standards implementation. One study compared states that were early adopters with late-adopting states, among states with low-rigor standards prior to the Common Core, and it found moderate effects on fourth-grade math scores (around 0.10 SD), only modest effects on eighth-grade math scores (around 0.04 SD), and no effects among economically disadvantaged students (Bleiberg, 2020). Another study found small improvements in ACT (American College Test) scores in Kentucky (0.03–0.04 SD), comparing cohorts of students exposed to the standards with earlier cohorts, but it was unable to conclude whether the impacts were due to the standards or other changes in the state (Xu & Cepa, 2018). A series of studies compared changes in CCSS adopter states with strong implementation with a very small number (four to eight) of nonadopter states and found a mix of null, very small positive, and very small negative effects on student achievement, based on different specifications (Loveless 2014, 2016). A further study compared states based on the degree to which the new standards differed from their previous standards and found slightly negative long-term impacts of the CCSS-M that grew more negative over time (−0.10 to −0.06 SD; Song et al., 2019). One further study did consider local variation, comparing districts within the same state, based on their adoption of CCSS-aligned textbooks. It found that implementing districts had a slightly higher percentage of middle school students scoring proficient on the state achievement test compared with nonimplementing districts, while differences in math achievement across elementary students were insignificant (Gao & Lafortune, 2019).
Thus, when examining changes in achievement, the findings are not consistent, the existing research typically examines statewide averages without considering variation across schools and districts, and it often focuses on changes in the content standards. Moreover, existing research uses standardized test scores as the sole measure of achievement. State tests may not be adequate for measuring student learning from standards-aligned instruction; Polikoff and Porter (2014) found surprisingly small associations between standards-aligned instruction and student test scores. Besides looking at test scores, research has yet to consider whether students’ course grades changed along with their probability of passing math. Students’ grades in their courses have been shown to be stronger predictors than test scores of high school success, graduation, college enrollment, and college persistence (Allensworth & Clark, 2020; Easton et al., 2017). Course failures are critical math outcomes, given the demonstrated risk of increased failure rates in response to higher academic demand (Allensworth et al., 2009; Clotfelter et al., 2015; Simzar et al., 2016).
Research on Standards Implementation
At the outset of CCSS-M implementation, administrators expressed concerns about teacher preparation to teach math in an entirely new way (McLaughlin et al., 2014; Rentner & Kober, 2014). Studies of CCSS-M implementation across standards-adopting states have found that teachers report making significant changes to their instruction in response to the standards (Bay-Williams et al., 2016; Kane et al., 2016; Opfer et al., 2016). However, studies have also shown considerable variation in the extent to which teachers have changed their instruction (Edgerton & Desimone, 2018), with those who teach higher proportions of low-achieving students spending less instructional time engaged in standards-aligned practices than others (Schweig, Kaufman, & Opfer, 2020). Whether students themselves perceive differences in the types of instructional tasks they engage in during their math classes has not yet been studied, and instructional changes may be perceived differently for different subgroups of students.
Research on the Effects of Implementation Supports on Student Outcomes
While the CCSS-M were adopted by states, how to implement them in schools has been largely left up to districts (Desimone et al., 2019). Districts could support instructional change through many different mechanisms, including adopting new textbooks, digital tools, and other curricular resources; making efforts to improve teachers’ math skills; aligning the scope and sequence of instruction in different classes; and investing in professional development (PD) to support new instructional practices, PL communities, or coaching (Desimone et al., 2019; Kane et al., 2016). Studies of materials, curriculum, and textbooks have not found significant effects on student outcomes from changing to a new textbook in response to standards, or using a curriculum that was designed pre- versus post-CCSS-M, although a few particular curricula seem to be more effective than others (Blazar et al., 2019; Kane et al., 2016). However, there is evidence that more PL around the standards is related to stronger student outcomes. Kane et al. (2016) found that students scored higher on CCSS-aligned math assessments in schools where teachers had more PD around the standards and higher percentages of teachers who felt knowledgeable about them, controlling for differences in prior-year student achievement and teacher effectiveness.
PD has long been considered a primary lever for enacting instructional change (Desimone, 2009; Kennedy, 2016; Opfer & Pedder, 2011). Greater investments in PD provide legitimacy and consistency to what is being asked of teachers as well as the opportunity to learn new content and skills (Desimone, 2002, 2009; Desimone et al., 2019; Desimone & Garet, 2015). As states transitioned to the new standards, there were major challenges in providing sufficient high-quality PD (Kober et al., 2013; Rentner & Kober, 2014). Edgerton (2020) found that many districts lacked the capacity to provide ongoing support to teachers. Several years after standards-adopting states began implementing the CCSS-M, only about a third of teachers reported feeling like they had high levels of preparation to teach the new standards (Kane et al., 2016; Scholastic & Bill & Melinda Gates Foundation, 2014). Teachers felt particularly in need of PL on differentiating instruction for students with different levels of prior achievement and helping students achieve the practice standards (Hamilton et al., 2016). Variation in the use of PL across schools and districts could be a key factor for understanding variation in student outcomes with CCSS-M implementation.
Research on Instruction for Heterogeneous Students Under the CCSS-M
While the CCSS guidelines recognize that students with disabilities, English learners (ELs), and low-achieving students may need special supports to meet the expectations of the new standards (Common Core State Standards Initiative, 2020a, 2020b), they leave the details of how to provide these accommodations up to teachers, schools, and districts. In particular, a number of scholars have pointed out the need for special attention to the ways students with a track record of underperformance in math have experienced the new standards (Haager & Vaughn, 2013; Powell et al., 2013; Saunders et al., 2013).
Previous research suggests that, absent effective supports, students with a history of low achievement in math may benefit less than other students or even have worse academic outcomes in response to reforms that increase rigor in their math classes (Allensworth et al., 2009; Clotfelter et al., 2015; Gamoran & Hannigan, 2000; Simzar et al., 2016). Students with a history of low achievement may become disengaged and stop trying when academic rigor increases without simultaneous efforts to help them meet the new demands (Bandura, 1986; Bouffard-Bouchard, 1990; Lent et al., 1984; Shernoff et al., 2003). One of the most frequent concerns educators have expressed about the CCSS-M is lack of confidence in their ability to help students with low prior achievement attain the skills expected by the new standards (Haager & Vaughn, 2013; Hamilton et al., 2016; Powell et al., 2013; Saunders et al., 2013).
At the same time, the standards were adopted to ensure that all students have access to a rigorous curriculum and instructional practices that promote a deep understanding of mathematics. Low-achieving students frequently have been grouped in classes that focus heavily on procedures and computation (National Council of Teachers of Mathematics, 2018). Divorced from instruction to support comprehension of key mathematical concepts, this type of instruction has been shown to make students less motivated to discern the reasoning behind the procedures they use (Boaler et al., 2000; Hiebert & Lefevre, 1986). Over time, students become less equipped to undertake rigorous math problems, leading to the observed widening of gaps between low and high achievers over time (Jordan et al., 2009; Niemi, 1996; Richland et al., 2012). For low-achieving students with low conceptual understanding of math, instruction to support these practice standards may be especially critical.
How This Study Contributes
In this study, we examine changes in students’ instructional experiences and achievement after the adoption of new standards, based on the extensiveness of teachers’ PL around the standards across schools in Chicago. We examine a wider variety of student outcomes than in existing research on CCSS-M, including test scores, grades, rates of course passing, and student reports of engaging in standards-aligned instructional practices. After examining average outcomes of the CCSS-M implementation across students, we disaggregate the analyses for students with low, average, and high prior-year achievement. The “low-achieving” group includes most students with disabilities at each grade, as well as students facing other obstacles, broadly conceived, that contribute to below-grade level math achievement. Arguably, this group contains those students whom standards-based reforms aim to help the most, but who previous studies suggest will be most likely to struggle with the increased academic demand of the new math standards.
Like the Kane et al. (2016) study, we use variation in participation in PL around the CCSS-M to examine the relationship between PD and changes in student outcomes. We also incorporate a longitudinal component, comparing differences in outcomes in poststandards years relative to prestandards years, similar to Song et al. (2019), Loveless (2014, 2016), and Bleiberg (2020). As with those studies, and with the Kane et al. (2016) study, causal inferences are limited because the schools with different levels of implementation are not random, just as the states with weaker standards pre-CCSS-M were not random in the studies of states. We include school fixed effects in the models so as to compare schools with themselves in prior years; this provides more confidence that changes in outcomes across schools with different levels of participation in PL were not simply a result of initial differences between schools.
We are able to do this work using detailed data on students in the middle grades (Grades 6 to 8) from the Chicago Public Schools (CPS; n.d.), a large urban district with about 500 schools that implemented the CCSS-M through a teacher leader model that provided PD and resources to encourage instructional change around the CCSS-M. The decentralized organizational structure of schools in the district resulted in significant variation in schools’ participation in the district’s PD standards implementation strategy. We leverage this variation to examine the relationship between PD on the CCSS-M and changes in student outcomes.
Standards Implementation in Chicago Public Schools: Promoting High-Quality Instruction Through Teacher Leaders
After Illinois adopted the CCSS-M in 2010, the CPS Department of Mathematics launched a multiyear effort, beginning in 2013, to support teachers’ transition to the new standards. Their focus was on helping teachers modify their instructional practices so that students would develop the procedural and conceptual understanding called for by the practice standards. As described by one district leader to a member of the study team in an interview for an associated qualitative study, “this [strategy] was going to be about high-quality instruction. Then if the materials changed, the standards changed, if anything, the assessment changes, it doesn’t matter because this is still good teaching.” The district partnered with local universities to develop and provide content for PD sessions, which was informed by Charlotte Danielson’s Framework for Teaching (Danielson, 2009) and the Teaching for Robust Understanding (TRU) Framework (Schoenfeld & Teaching for Robust Understanding Project, 2016), and it emphasized creating equitable, student-centered learning environments.
A primary feature of their PL program was a teacher leader model. Two or three teachers from each school were designated teacher leaders and attended Teacher Leader Institutes. In schools with higher proportions of low-achieving students, teacher leaders and their administrators were offered the opportunity to participate in math team learning communities where they could develop school-based PL plans and share across schools. All teacher leaders were expected to develop their own classroom practice to better align with the goals of the CCSS-M and support colleagues in their schools to make instructional improvements. The district offered a number of voluntary standards-focused workshops and opportunities for PD and collaboration that teachers could attend if they were not designated teacher leaders. The district also provided resources to support instruction and a list of recommended core curricula through a website called the “Knowledge Center.” PD sessions often helped teachers use the materials provided by the Knowledge Center and the resources it contained to support PL within schools.
CPS schools differed considerably in the degree to which their teachers participated in PL around the standards (Gwynne & Cowhy, 2017), similar to what has been observed in studies of other places (Desimone et al., 2019; Kane et al., 2016). This variation allows us to analyze the relationship between the extensiveness of standards-related PL and changes in math instruction and student learning outcomes.
Method
Sample and Data
Our analyses are based on CPS students who were in the sixth through eighth grades at any point from 2011–2012 to 2016–2017. Students are included if they had a math score on the state assessment from the previous school year and were enrolled in regular CPS schools, which include neighborhood schools, magnet schools, and selective schools, but exclude alternative schools for dropout recovery and special education schools. Charter schools are also omitted from the analyses presented in the main text because we lacked their data on course grades and course passing rates.
Survey Data
A number of our variables come from surveys of teachers and students administered in the spring of each year in CPS. Participating in surveys is optional for individuals. However, schools receive reports on a subset of measures that are used for school improvement planning and district accountability. Thus, participation is strongly encouraged and time is usually set aside for teachers and students to take the surveys during the school day. Many of the survey measures show strong evidence of validity in their relationships with growth in student achievement over time (Klugman et al., 2015; Nomi & Allensworth, 2013). As a result of the strong district support of the surveys, response rates are high. Teacher response rates in 2015 were 80.7%. Student survey response rates ranged from 74% to 83% for the surveys administered in the spring of 2011 through 2017.
Measure of Professional Learning
Our main independent variable, other than school year, is the extent to which teachers in each school participated in the district-wide PL program designed to support the new standards. Teachers’ participation in PL is captured with the teacher survey administered in the spring of 2015, which was the first year (2014–2015) that all teachers in the district were expected to use standards-aligned instruction. Several questions asked teachers to describe their PD related to the new standards. See online Supplemental Appendix A for specific survey items. These were combined into a single measure with a reliability of 0.76 using a Rasch model (Wright & Masters, 1982). Since teacher responses on the survey are anonymous and cannot be tied to individual students and classrooms, we aggregated their responses to the school level to create a schoolwide measure of standards-related PD. Using hierarchical linear models, we calculated empirical Bayes estimates for each school, using a measurement model at Level 1, with teachers nested within schools at Levels 2 and 3. The school-level reliability of the measure was 0.72.
Using the empirical Bayes estimates from the hierarchical linear models, schools were categorized into three equal groups, henceforth identified as schools with extensive, average, or limited standards-related PL. The categories were determined including schools with middle grades and high schools so that parallel work on high schools would be comparable; this results in uneven numbers of schools in the categories for this study. High school teachers participated less extensively in PL around the standards than teachers in the middle grades. The groups reflect variation in participation across schools in PL through the district’s teacher leader model, variation in any additional PD teachers experienced through other PL opportunities, and variation in school-based PD sessions run by teacher leaders. Responses to survey items across the three implementation groups are provided in online Supplemental Appendix B.
Schools with more extensive PL had slightly lower achievement, served students from neighborhoods with higher levels of poverty, and served more Black students (see Table 1). This corresponds with district efforts to offer additional PD supports for schools with higher proportions of low-achieving students. At the same time, the differences in mean achievement and student characteristics between the three groups are fairly small, relative to the variation within the groups. All three groups of schools are heterogeneous along all dimensions of student body composition, with considerable overlap across them on all student characteristics. Moreover, all of the statistical models control for differences in student composition, and the use of school fixed effects provides additional confidence that the changes we observe in outcomes across schools in each PL category were not a result of initial differences between schools.
Characteristics of Schools in the Three Professional Learning Groups

Note. Means are calculated based on the student population in the 2014–2015 school year.
Student-Level Variables
District administrative records include information about students’ background characteristics (race/ethnicity, gender, special education status, and census block group) for all students enrolled in the district each year. To control for students’ socioeconomic status, we use variables created from U.S. Census data measuring neighborhood poverty (percentage of families under the poverty line and percentage of males unemployed) and neighborhood social status (median family income and average education levels), linked by their residential census block group. These allow a more fine-tuned measure of family background than an indicator of free and reduced lunch status, since more than 80% of students in CPS qualify. The Census measures are standardized across all census block groups in the city, not just the blocks in which CPS students live.
Student Reports of Math Practices
For each survey administration, students are asked questions specifically about practices they do in their math class (Math Instructional Practices). These practices correspond with the types of activities that are aligned with the CCSS-M Standards for Mathematical Practice and are consistent with the practices emphasized in district-sponsored PD around the standards. The questions were combined into a Rasch measure with a reliability of 0.57. See online Supplemental Appendix A for the specific survey questions.
Student Achievement
We use student transcript data for information on math course grades and whether students passed their math course. Course grades are available by semester, and some students take multiple math classes. We take the average for each student of their grades in math (measured on a 0- to 4-point scale) in each semester class. We calculated their math course pass rate based on whether they passed (1) or failed (0) each semester of each math course they took.
During the period covered by this study (2011–2017), CPS students took a number of different standardized tests. The old state test (ISAT [Illinois Standards Achievement Test]) was administered through the spring of 2014. The PARCC [Partnership for Assessment of Readiness for College and Careers], which was developed as an assessment for the CCSS-M, was administered beginning in the spring of 2015. Thus, the change in the state test occurred in the same year as standards implementation. Another math assessment, the NWEA-MAP (Northwest Evaluation Association Measures of Academic Progress), was given to all third- through eighth-grade students in every year from 2013 onward. This exam has more precision than the state tests because it is computer adaptive. It also correlates with the ISAT and PARCC at between 0.86 and 0.90, depending on grade and year, disattenuated for measurement error, based on our analysis of CPS data. Because the NWEA was given in years before and after standards implementation, we use NWEA scores as our outcome measure of math skills. However, so that we have a prescore measure for the year 2013, we use students’ performance on the ISAT or PARCC from the prior year (2011 through 2016) as a control variable for prior achievement, standardized by grade and year. Online Supplemental Appendix C provides an analysis of change in PARCC scores over the post-CCSSM years by the extensiveness of PL in the school.
Table 2 provides details on variables for those students who have data on all outcomes, which is the sample used for the analyses presented in the main text, as well as the full data set. We limit the main analysis to students with complete data so the results are comparable across outcomes; the same students are included for each analysis. However, this substantially reduces the analytic sample down from the population of students in the district. We have test score data for almost all students in the district, but students who transferred midyear do not have spring test data. We have transcript data for all students except those enrolled at charter schools. Survey response rates are about 80%. By including only students with data on all four outcomes, the analytic sample consists of 213,965 students in 418 schools versus 325,275 students in 478 schools. The characteristics of the reduced and full samples are very similar. We ran models for each outcome with the entire population of students who have data on the outcome to confirm that our conclusions would be the same, as described in online Supplemental Appendix C.
Descriptive Statistics on Students in All Years (2013–2017)
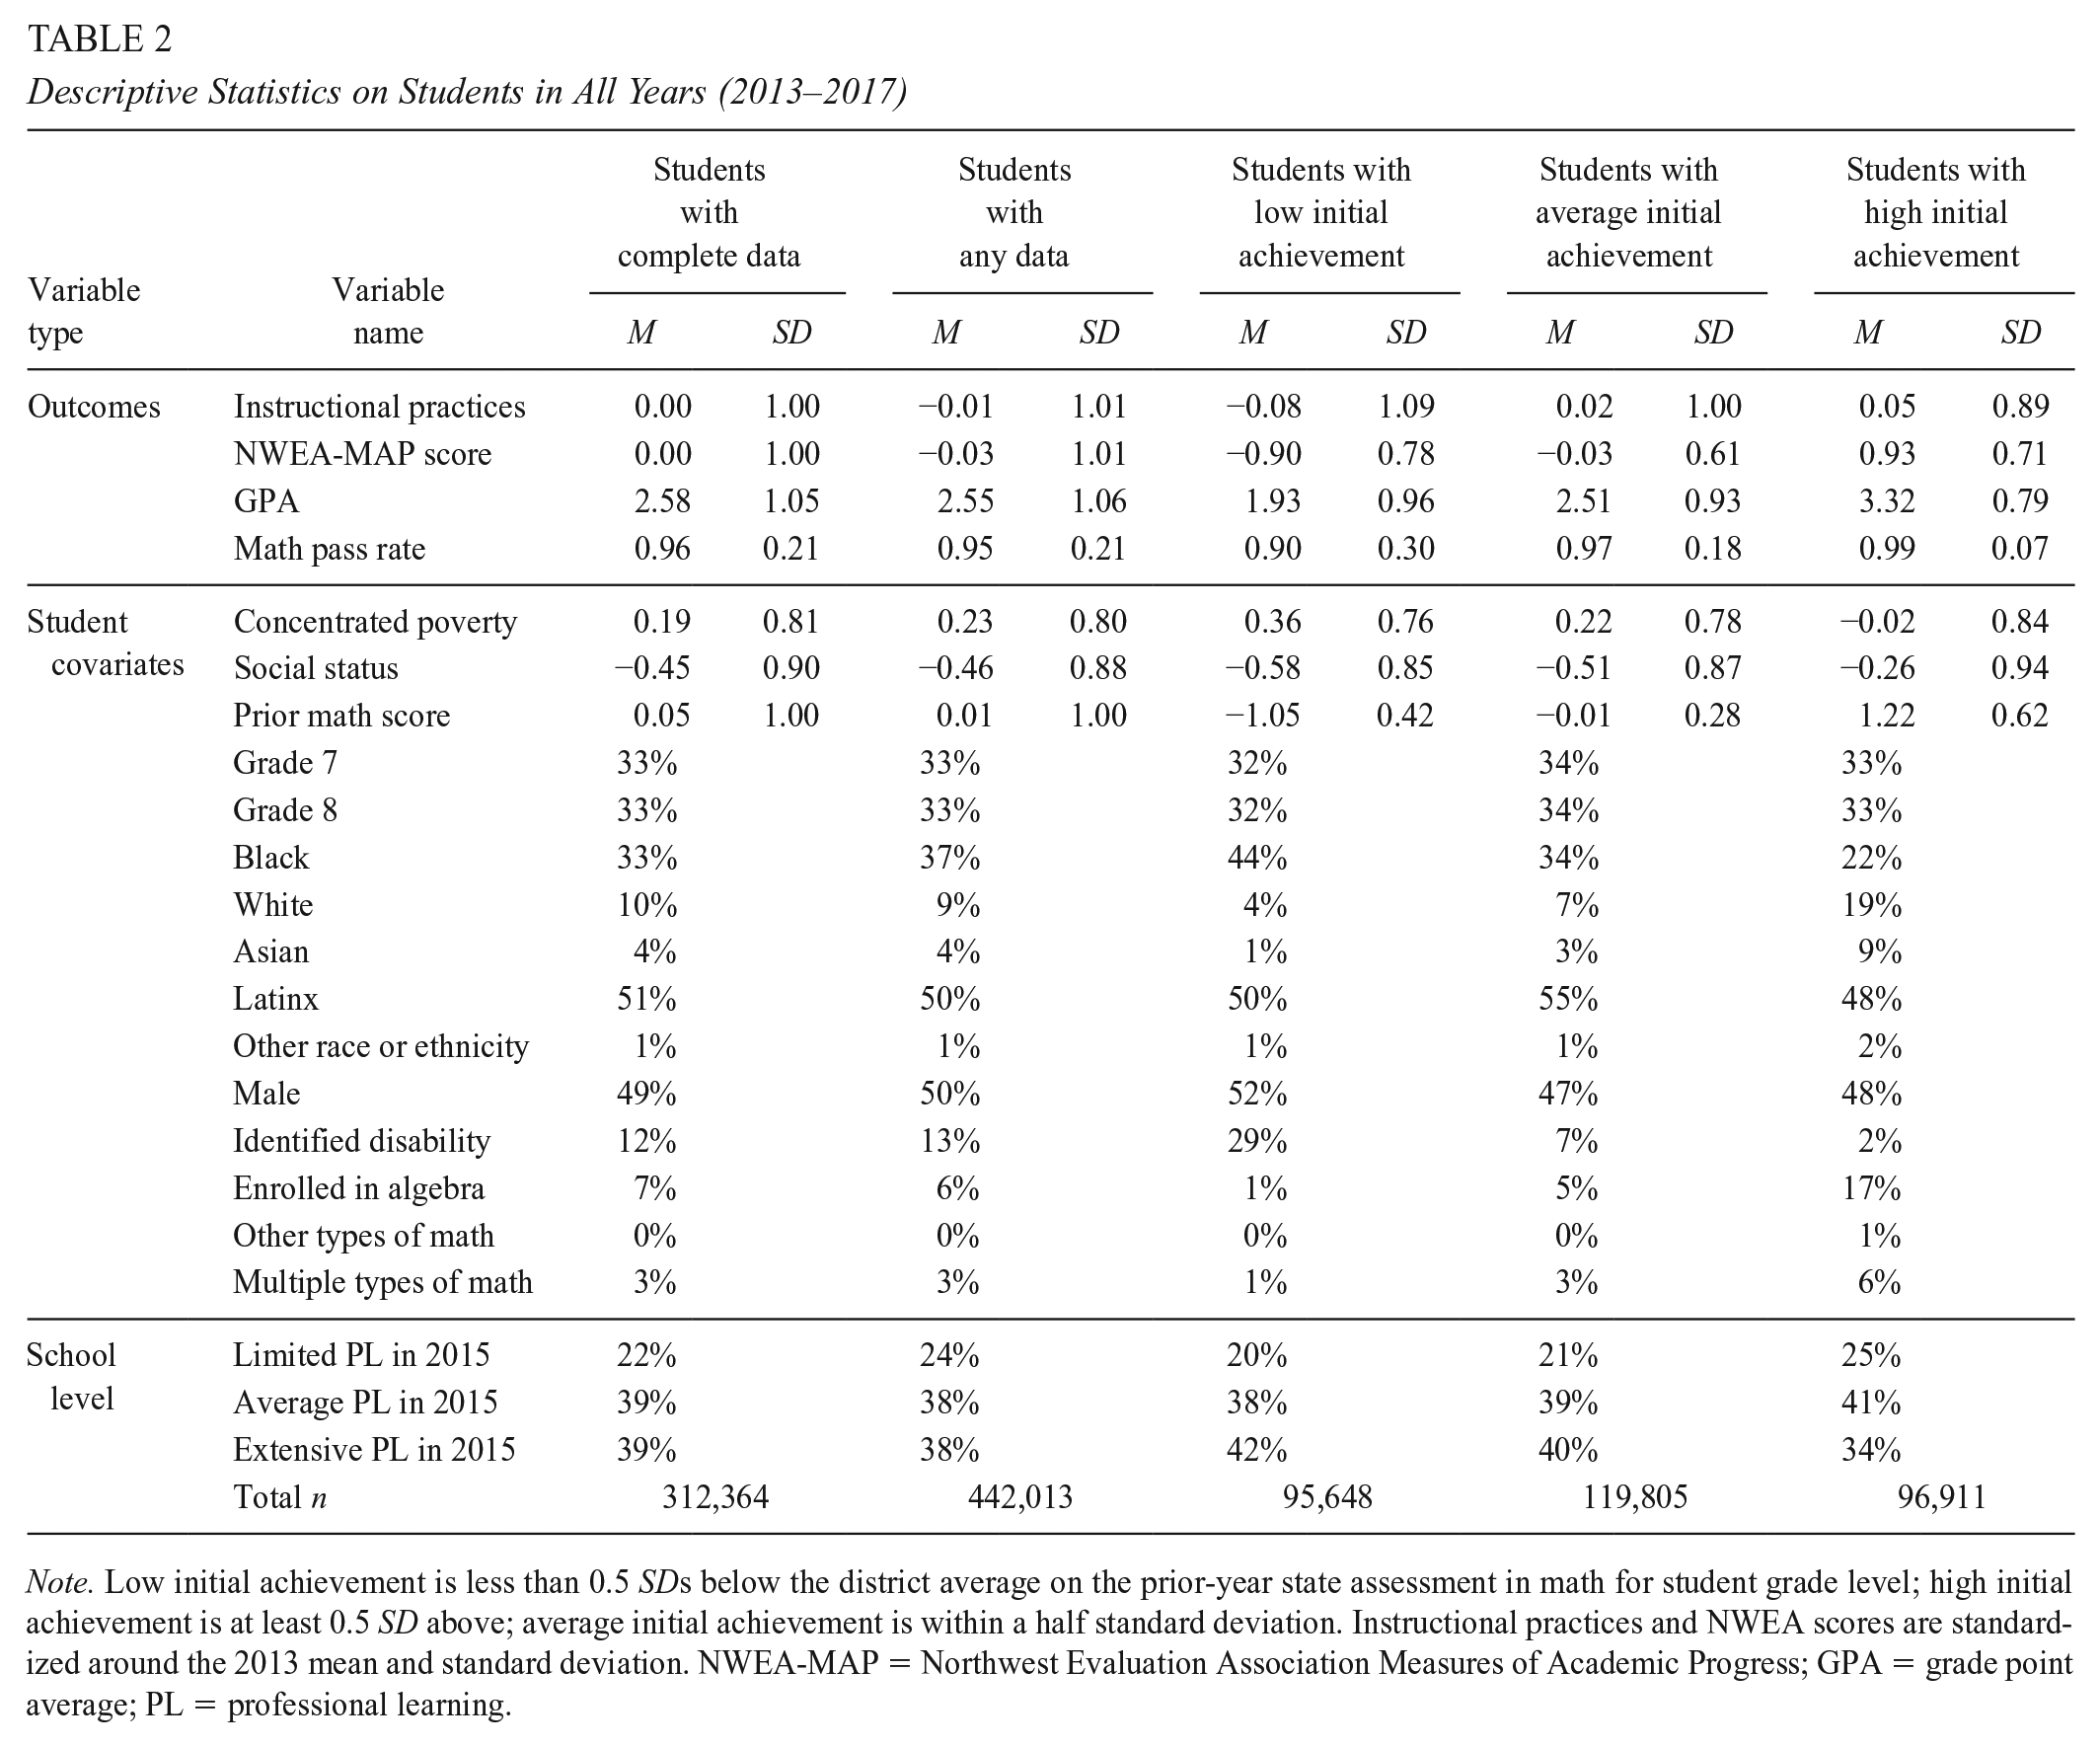
Note. Low initial achievement is less than 0.5 SDs below the district average on the prior-year state assessment in math for student grade level; high initial achievement is at least 0.5 SD above; average initial achievement is within a half standard deviation. Instructional practices and NWEA scores are standardized around the 2013 mean and standard deviation. NWEA-MAP = Northwest Evaluation Association Measures of Academic Progress; GPA = grade point average; PL = professional learning.
To answer the second research question, we divide the data based on students’ prior-year achievement levels. Students in the low-achievement group scored at least a half standard deviation below the district average for their grade level on the prior-year state assessment, those in the high-achievement group had scores at least half a standard deviation above average, and the remainder were in the average achievement group. There are several differences other than their prior-year math scores (see Table 2). On average, students in the public schools in Chicago tend to live in areas of the city with higher poverty rates than the city as a whole. However, students with high prior-year achievement come from census blocks with poverty levels that are at the city average. These students may be more representative of state or national population averages in terms of students’ economic status than the other groups. Students in the group with low prior-year achievement are much more likely to have identified disabilities (29% vs. 2% in the high-achievement group).
Analytic Methods
We take a difference-in-differences (DiD) approach, comparing changes in student outcomes in postimplementation years to preimplementation years, in schools with extensive and moderate implementation of PL around the standards to those with limited PL. All schools were expected to implement the standards beginning in the 2014–2015 school year. This is also the year in which we measured teachers’ participation in PL around the standards. We refer to 2015 as the year when the standards and the PL around the standards were implemented, with 2011 to 2014 as preimplementation years and 2015 to 2017 as postimplementation years.
The first difference that we model is based on school year. We compare outcomes in the spring of 2015, 2016, and 2017 (postimplementation years) with outcomes in the spring of 2014 to discern whether student outcomes were higher in postimplementation years. Each year is modeled as its own dummy variable, with 2014 as the excluded group, so that we can observe whether any changes were short-lived, sustained, or grew over time. If the CCSS-M brought changes in instruction and student outcomes, we should see that outcomes are different in 2015 and later years, relative to 2014. We include a series of student covariates so that we compare the outcomes of students with the same backgrounds over time.
Because other initiatives were occurring in the district at the same time that it adopted the CCSS-M, we cannot fully attribute any of the changes observed in student outcomes in postimplementation years to standards implementation. Therefore, we focus on teacher participation in PL around the standards in the 2014–2015 school year as one aspect of standards implementation, discerning whether schools with extensive or average participation in PL saw greater changes in student outcomes than schools with limited PL. Because teacher participation in PL was minimal in schools with limited PL, the changes we observe postimplementation for schools with limited PL mostly reflect other changes happening in the district. Thus, the differences estimated for these schools minus the differences observed in the other schools with different levels of PL reflect the effects of participation in PL around the standards. This approach provides more confidence that observed changes were due to a component of standards implementation rather than other changes occurring in the district.
One concern with this approach is that the schools that participate more fully in PL around the standards are different in some unmeasured ways from schools with limited PL, and that these differences might also be related to student outcomes. To mitigate this concern, we include school fixed effects that capture stable characteristics of schools. Thus, we are comparing school outcomes in postimplementation years with outcomes in the same schools preimplementation—comparing schools with themselves. We include dummy variables for each school year with 2014 as the excluded group, alone and interacted with PL. If the groups are comparable, with the covariates and school fixed effects, we should see no significant difference in the years before implementation, relative to 2014 (the year before implementation). We should see differences in 2015 and later years, relative to 2014, if PL in 2015 was related to improvements in student achievement. The model is as follows:

The outcome Y for student i in school s in time t, where
β1 to β6 capture the differences in the outcome in each year compared with 2014 through a series of dummy variables for time (D2011–D2017, excluding 2014);
Is are dummy variables for two of the implementation groups—schools with average PL and schools with extensive PL;
γc are the DiD coefficients for schools with different levels on the intervention, I (either extensive or average implementation). Among schools with limited PL (the excluded group), the difference in the outcome from 2014 to 2015 is the main effect for D2015, β4, while for schools with average PL, the difference is β4 plus the coefficient on the interaction of D2015 * ImpAve, γ10.
αs are school fixed effects;
Zist are student-specific covariates; and
standard errors were clustered by school.
We also ran a model that used a continuous variable of PL, rather than categories of limited, average, and extensive PL (see online Supplemental Tables C4 and C5 in Appendix C). We highlight the categorical models since they are used to make a figure and table that are easier to interpret.
We then run the same models separately for each of the three subgroups defined by students’ achievement in the prior year to discern whether there were differences in outcomes for students with different prior-year achievement levels. By running the models separately, the covariates are specific to each of the subgroups, and the estimates are not influenced by outcomes for students in the other achievement groups.
Limitations
There are a number of caveats to this study. First, the schools with extensive PL were not a random group. Administrators could elect to have their schools participate in standards-related PL, and teachers could elect to participate. Those who participated more fully may have been more receptive to PL. Online Supplemental Appendix B provides more information on the three implementation groups. Each group contained a heterogeneous mix of schools, but schools with more extensive participation had somewhat lower achievement, on average. Their teachers might have felt a greater press for change. Requiring extensive PL in schools with less buy-in might produce different results than shown here.
Second, the magnitude of change due to PL may be an underestimate of the total effects because we only examine differences relative to other schools—all of whom received some degree of PL around the standards. As shown in online Supplemental Appendix B, not all teachers in schools with extensive PL participated in standards-related PD, while a small percentage of teachers in schools with limited PL participated regularly in PL. The relationships we measure are further diminished by measurement error that exists in our school-level measure of teachers’ participation in PL.
Third, these changes are occurring within a context of other policy changes in the district, including a new teacher evaluation system, and restrictions on the use of suspensions coupled with more restorative discipline strategies. While we leverage differences in participation in standards-based PL to tease out the influence of standards-based support, it could be that standards-based PL was effective only because these other policy elements were also in place, or were in some way due to these other district policies. Fourth, these methods isolate one particular element of implementation (PL) and do not identify the total influence of the standards. There is not a way to tease out the results of the complete district implementation plan from other district-wide changes. These are also conservative estimates of the influence of PL around the standards, as we measure participation in PD in the first year of district-wide standards implementation, while student outcomes are measured through 3 years of implementation. We do this so the treatment variable (teacher reports of participation in PD in the 2014–2015 school year) occurs prior to the time any outcome variables would be observed (spring 2014–2015 through 2016–2017).
Results
Coefficients from the first set of models are shown in Table 3. The year fixed effects in the first several rows show how students’ outcomes changed in each year, relative to 2014, among schools with limited PL around the standards. There were improvements in most outcomes over time, but we cannot determine whether they were due to the standards, or to other district initiatives. The next two sets of coefficients include interaction terms between year and whether schools engaged in average or extensive levels of PL around the standards. These coefficients show the extent to which outcomes changed more in schools with average or extensive PL around the standards than in schools with limited PL. These coefficients should be added to the main year fixed effects to determine the overall change in the outcome for schools with average or extensive PL around the standards, relative to 2014. To make this easier to see, Figure 1 graphs these changes over time. The 2011 to 2014 values in the figures show how much the schools started off in different places on the outcomes, but the school fixed effects control for any differences when estimating the DiD coefficients in the models.
Coefficients From Models Predicting Outcomes With the Extensiveness of School Professional Learning
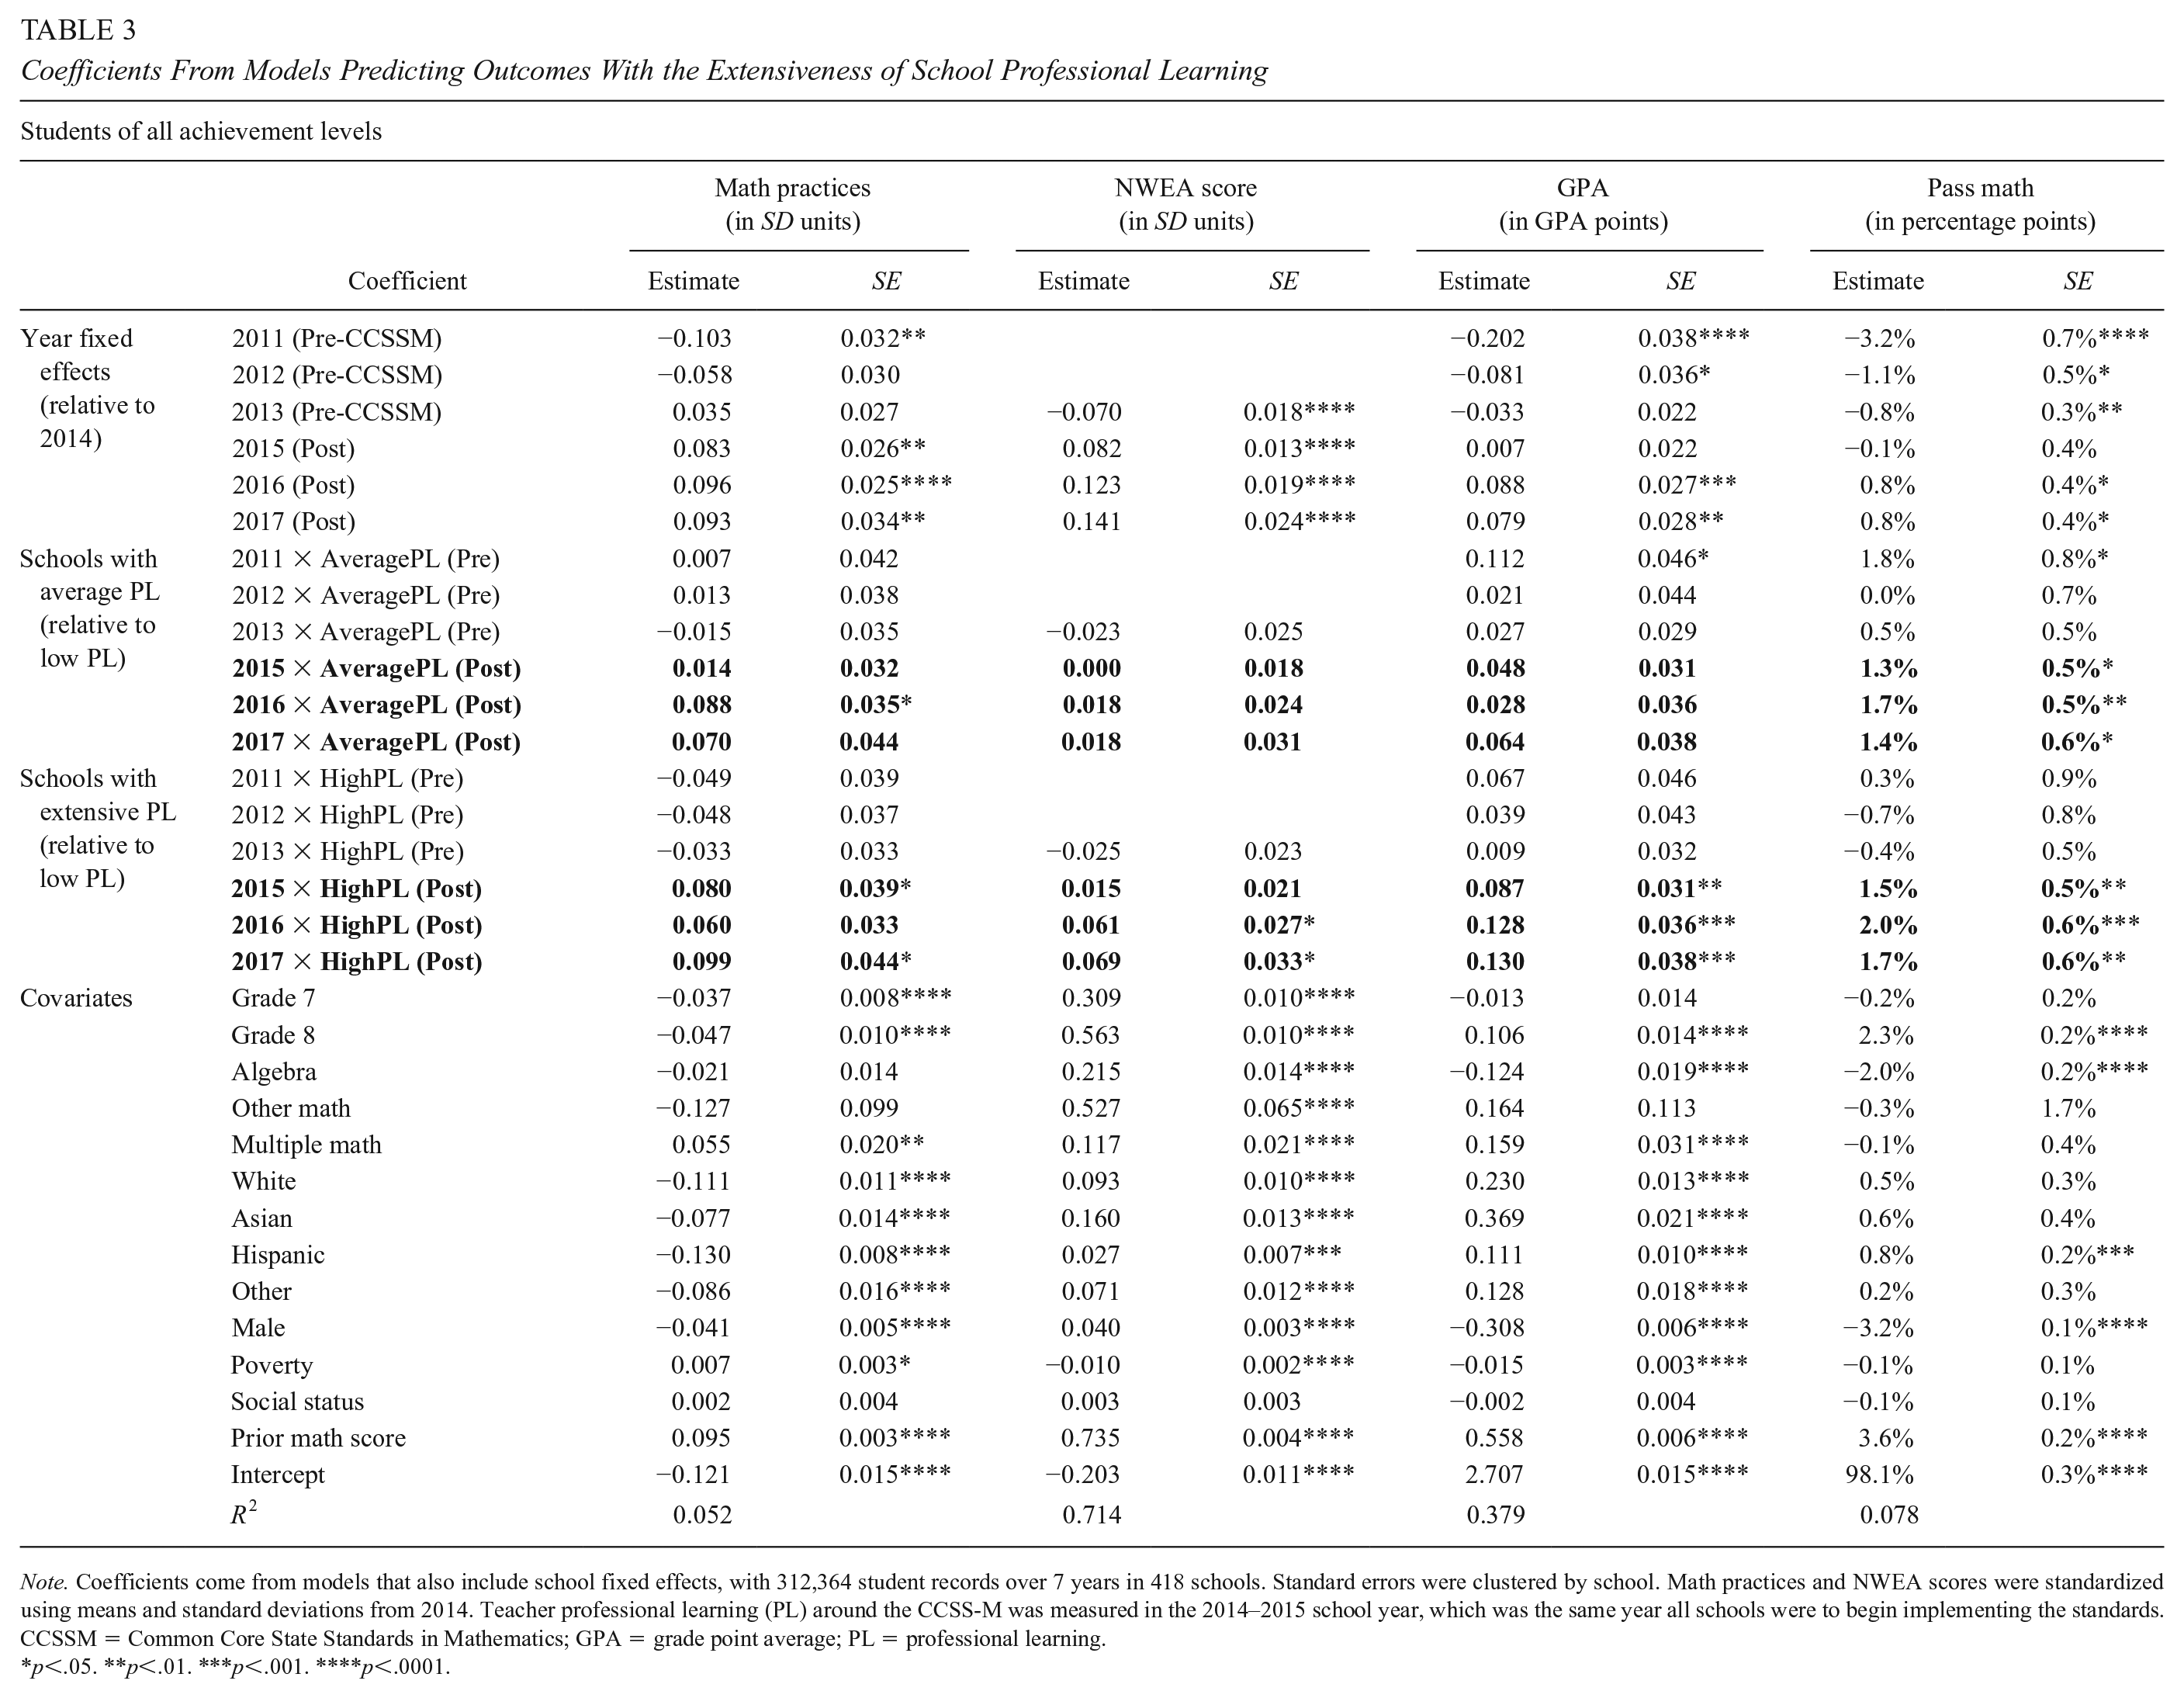
Note. Coefficients come from models that also include school fixed effects, with 312,364 student records over 7 years in 418 schools. Standard errors were clustered by school. Math practices and NWEA scores were standardized using means and standard deviations from 2014. Teacher professional learning (PL) around the CCSS-M was measured in the 2014–2015 school year, which was the same year all schools were to begin implementing the standards. CCSSM = Common Core State Standards in Mathematics; GPA = grade point average; PL = professional learning.
p<.05. **p<.01. ***p<.001. ****p<.0001.

Student outcomes by the extensiveness of professional learning.
In general, schools with extensive PL around the standards in 2015 showed significantly more growth in student outcomes than schools with limited PL in 2015 and later years, while schools with average PL showed few differences from schools with limited PL. Neither group showed significantly different growth compared with schools with limited PL in 2011 to 2014, the years before implementation. Starting in 2015, students in schools with extensive PL reported significantly greater improvement in Math Instructional Practices than students in schools with limited PL around the standards (0.080 SD). The differences relative to schools with limited PL were sustained over time. Students in schools with average levels of PL also reported significantly larger improvements in instructional practice than schools with limited PL, but these differences were only significant in 2016.
Student academic outcomes also improved more in schools with extensive standards-related PL than those with limited PL. Math course grades improved by 0.087 GPA (grade point average) points more in schools with extensive PL than in schools with limited PL in 2015, with the difference growing to 0.130 GPA points by 2017. Schools with average standards-related PL did not show significantly larger improvements in GPA than schools with limited PL. Math course pass rates improved more in schools with both average and extensive PL compared with schools with limited PL, improving by 1 to 2 percentage points more in 2015, 2016, and 2017. NWEA scores grew more in schools with extensive PL than in schools with limited PL in 2016 and 2017 (0.061 SD in 2016 and 0.069 SD in 2017), but scores were not significantly higher in schools with average PL than in schools with limited PL. The differences in NWEA scores in schools with extensive PL are similar to impacts on PARCC scores found by Kane et al. (2016), who found that an additional 2 days of PL each year improved PARCC scores by 0.045 SD.
Differences by Students’ Prior Achievement
Looking at all students together obscures differences based on students’ initial achievement levels. Schools with extensive PL showed significantly larger improvements in achievement than schools with limited PL among their low- and average-achieving students, but there were few significant differences in the achievement of their high-achieving students (see Table 4). For students with low initial achievement, math GPAs improved by 0.161 points more in 2017, and pass rates improved by 3.1 percentage points more, if they were in schools with extensive PL than in schools with limited PL. Low-achieving students’ NWEA scores improved by 0.078 SD more in schools with extensive PL than in schools with limited PL in 2016, relative to scores in 2014. Low-achieving students also showed more improvements in grades and pass rates in schools with average PL around the standards than in schools with limited PL. At average-PL schools, low-achieving students’ GPAs improved by more than 0.10 points in 2015 and 2017, and pass rates improved by about 3 additional percentage points in all postimplementation years, relative to grades and pass rates in 2014.
Selected Coefficients Predicting Outcomes With School Professional Learning

Note. Models were run separately based on students’ prior achievement levels. Models included school and year fixed effects, student race, ethnicity, gender, neighborhood poverty level, neighborhood social status, type(s) of math class, and prior spring math score, with 312,364 student records over 7 years in 418 schools. Standard errors were clustered by school. Low achievement ≥ 0.5 SD below the mean in the prior year; high achievement ≥ 0.5 SD above the mean. Math practices and NWEA scores were standardized using means and standard deviations from 2014. Coefficients on covariates are available in the online supplemental tables. Teacher professional learning (PL) around the CCSS-M was measured in the 2014–2015 school year, which was the same year all schools were to begin implementing the standards. NWEA = Northwest Evaluation Association; GPA = grade point average; CCSSM = Common Core State Standards in Mathematics; PL =professional learning.
p<.05. **p<.01. ***p<.001.
Average-achieving students also showed significantly greater improvements in test scores, math course grades, and pass rates in schools with extensive PL than in schools with limited PL, with test scores improving 0.093 SD more, grades by 0.151 points more, and pass rates by 1.4 percentage points more. Average-achieving students did not show significantly more improvements if in schools with average levels of PL, with the exception of showing higher pass rates in 2016 by 1.3 percentage points.
Table 5 shows the results as averages, rather than coefficients that need to be added together, and shows how the groups were different in the base year. The values for 2014 are the simple means for each subgroup, based on students’ prior-year achievement, year, and school PL around the standards. The values for other years are calculated by adding the coefficients from Table 4 onto the 2014 subgroup means, with coefficients from interaction terms added to the year fixed effects for students in schools with average or extensive PL.
Average Outcomes by Prior-Year Student Achievement, School Professional Learning Around the Standards and Year, Based on Model Estimates

Note. Values for 2014 are simple averages for each subgroup. Values for other years use coefficients from models controlling for school and year fixed effects, student race, ethnicity, gender, neighborhood poverty level, neighborhood social status, the type(s) of math class, and prior-year math score, added on to the 2014 values. NWEA = Northwest Evaluation Association; GPA = grade point average; CCSSM = Common Core State Standards in Mathematics; PL = professional learning.
Prior to standards implementation, students with high prior-year achievement reported more frequently engaging in standards-aligned instructional practices than low-achieving students (by 0.23–0.25 SD in 2011 and 0.11–0.14 SD in 2014; see Table 5). In the postimplementation years, low-achieving students showed increases in standards-aligned practices of 0.15 SD in schools with limited PL and 0.24 SD in schools with extensive PL. Students with low achievement still reported less engagement in standards-aligned practices than students with high prior-year achievement in the same schools, but the differences were smaller, and low-achieving students in schools with extensive PL engaged in standards-aligned practices at higher rates than high-achieving students in schools with limited PL after standards implementation.
Overall, achievement was still lower among students who had lower prior achievement than other students, but in schools with extensive PL, the differences in GPA and pass rates between students with low and high test scores were narrower in postpolicy years than in prepolicy years. The difference in GPAs was 0.11 points smaller, and the difference in pass rates was 4 percentage points smaller. Differences in NWEA scores remained similar.
Alternative Specifications
Results from alternative models are presented in online Supplemental Appendix C; the conclusions are similar to those in the main text. Coefficients from models that use all cases with data on each outcome are included in online Supplemental Tables C1 to C3; the DiD coefficients in these models are larger and more consistently significant for predictions of math practices and NWEA scores among low- and average-achieving students. Coefficients from models that use a continuous measure of PL are shown in online Supplemental Tables C4 and C5; the patterns of which DiD coefficients are significant are similar to those of schools with extensive PL. Online Supplemental Table C6 provides an analysis of PARCC scores; these were significantly higher in 2016 for schools with average PL, and in both 2016 and 2017 in schools with extensive PL. Table C8 includes teacher fixed effects; this model has the potential to confound school PL and teacher effects, but there are significant relationships on a number of the DiD coefficients, and the size of the coefficients are similar to models without teacher fixed effects.
Discussion
While the CCSS identify a centralized set of knowledge and skills that students should master, strategies for implementing the new standards are intentionally left to districts and schools. This design has led to considerable variation in implementation, prompting calls for research on how district and school supports affect classroom practice and academic outcomes for various subgroups of students (Polikoff, 2017). In Chicago, the district developed a PL program that emphasized changing instructional practices in math through a teacher leader model. Evidence from this study suggests that the strategy seems to have paid off, increasing student engagement in instructional practices consistent with the new standards, reducing differences in instructional experiences among students with different prior achievement levels, and showing improvements in test scores, grades, and pass rates in math classes. Achievement improved district-wide during this period for students of all achievement levels, but the improvements were greatest in schools with extensive participation in PL, particularly among students with low prior-year achievement. The patterns observed in Chicago are in line with the goals of the CCSS-M to improve instructional equity, closing achievement gaps in math course pass rates and grades.
The Benefits to Achievement Were Observed Most Consistently for Students With Low Achievement and Those at Risk of Failing Their Math Class: Why?
Study after study have shown that teachers worry about being able to teach to the new standards for low-achieving students, and they find it difficult to do so (Haager & Vaughn, 2013; Hamilton et al., 2016; Powell et al., 2013; Saunders et al., 2013). However, even if they find it difficult, the benefits may still be large for low-achieving students who were least likely to engage in practices that promote deep engagement and conceptual understanding prior to the standards. A prior study on double-dose algebra in Chicago also found improvements in math scores for students with below-average math skills. In that case, as in the case of CCSS-M implementation, teachers received PD for how to do more student-centered instructional practices that support conceptual understanding, and the extra time gave them the flexibility to take the chance on teaching in new ways (Nomi & Allensworth, 2013). Changes in instructional practices may also have been less critical for the achievement of students who already were successful in math.
Chicago Provides an Example of Successful Implementation: Why Is It Different From Studies of CCSS-M Adopting States?
This analysis provides evidence of positive outcomes associated with CCSS-M implementation in one city. Because most studies analyze states as a whole, we don’t know which other districts had successful implementation. There are a number of reasons why we might see positive results in Chicago when statewide results are null, or show improvements mostly for high-SES students—and these have implications for future efforts to improve achievement and equity in math.
First, it could be that CPS emphasized what ultimately matters most for student engagement and learning, particularly for low-achieving students. The district’s support for new instructional practices meant that teachers were prepared to implement not just the content standards but also the practice standards. The Teaching for Robust Understanding and Danielson frameworks integrated into the PD around the standards further supported the emphasis on instructional practices, and the availability of instruction-ready resources for promoting student discussion and problem-solving around multiple solutions made it easier for teachers to try new techniques. The prior studies that found no positive effects, or positive effects of standards only on economically advantaged students (Bleiberg, 2020; Song et al., 2019), used change in the content standards as the independent variable; they could not speak to how much instructional practices changed in those states. It is possible that economically advantaged districts had more resources to invest in PD. It is also possible that raising content standards without improving the quality of instruction does not benefit low-achieving students; studies of prior policies intended to raise rigor in math classes have found null or negative effects on low-achieving students (Allensworth et al., 2009; Clotfelter et al., 2015; Gamoran & Hannigan, 2000; Simzar et al., 2016). Furthermore, the Polikoff and Porter (2014) study that found no relationship between teachers’ instruction and student gains focused primarily on the content standards.
Second, the Chicago context is not representative of the state or nation as a whole; it is an 80% low-income district, where many students begin school with low achievement relative to national averages. Significant achievement gains were only observed for students with low or average achievement relative to other students in Chicago. When results are averaged across all students, the benefits for students with low achievement may be obscured. Typical districts in the state and nation may be more similar to students who are high achieving in Chicago.
The teacher model was also run in a way that is quite different from PL approaches in other places. This might have influenced the success of schools with extensive PL. Rather than training teachers to implement curricula in a prescribed way, the district encouraged teachers to “try out” practices and share what worked with others. This approach—with teachers supporting each other around instructional change with access to expert knowledge and resources—requires experimenting and learning from failure. That can be frustrating for teachers and involves considerable uncertainty. But it is consistent with learning science and innovation research (Cobb & Jackson, 2011; Coburn et al., 2013; Coburn & Russell, 2008). It also mirrors the goals of the CCSS-M for students, where students are presented problems and given support to find different solutions themselves.
Prior studies also focused solely on test scores as outcomes. Improvements in test scores were less clear than improvements in grades or pass rates—test scores improved gradually over time while grades and pass rates improved in the implementation year and then continued to grow. If we had only looked at test scores, we would have added another study to the literature that shows ambiguous results. The standards themselves may not clearly translate into gains on standardized tests—or they may require considerable support for teachers to make instructional changes that have a positive impact and those changes may take time to be seen in test scores.
The Teacher Leader Model Was Successful for Some Schools but Not All Schools
The model seems to have been effective for schools that participated in standards-aligned PL most extensively. In these schools, improvements began in 2015 and continued to accumulate through 2017. This continued improvement may reflect continued participation in PL, which was offered by the district through 2017. It may also reflect the design of the teacher leader model, wherein multiple teacher leaders from each school worked together to improve instruction. This collaborative design could have improved internal capacity for changes that were sustainable over time.
At the same time, it is important not to lose sight of the wide variation in participation in PL across schools. Many schools participated in PL to only a limited degree, and the achievement gains for schools with average levels of PL were largely null relative to schools with limited PL, except among low-achieving students. Furthermore, this analysis only shows what happened in schools serving the middle grades. Initially, we planned to include high schools in our analysis. However, only 8% of high schools (11 schools) engaged in extensive PL. The estimates of policy effects among high schools were not stable with different model specifications. This variation in schools’ implementation suggests that the teacher leader model was not entirely sufficient for meeting the district’s aim of reaching all its teachers.
Supplemental Material
sj-pdf-1-ero-10.1177_2332858420986872 – Supplemental material for Improvements in Math Instruction and Student Achievement Through Professional Learning Around the Common Core State Standards in Chicago
Supplemental material, sj-pdf-1-ero-10.1177_2332858420986872 for Improvements in Math Instruction and Student Achievement Through Professional Learning Around the Common Core State Standards in Chicago by Elaine Allensworth, Sarah Cashdollar and Julia Gwynne in AERA Open
Footnotes
Acknowledgements
We would like to thank Amy Cassata and Jeanne Century from UChicago STEM Education, University of Chicago, for their partnership and feedback, and sharing information about professional learning initiatives around the CCSS-M in the Chicago Public Schools. We would like to thank Jessica Mahon at the Chicago Public Schools for her partnership and input on this work. We are also grateful to Paloma Blandon and Arya Muralidharan for their assistance. The research reported here was supported by the Institute of Education Sciences, U.S. Department of Education, through Grant R305A160162 to the University of Chicago. The opinions expressed are those of the authors and do not represent views of the Institute or the U.S. Department of Education.
Correction (January 2023):
Article updated to correct the grant number.
Authors
ELAINE ALLENSWORTH is the Lewis-Sebring Director of the University of Chicago Consortium on Chicago School Research. Her research examines factors influencing students’ educational attainment, school leadership, and school improvement.
SARAH CASHDOLLAR is an Institute of Education Sciences predoctoral fellow in the Department of Comparative Human Development at the University of Chicago. She studies the impacts of Career and Technical Education and standards-based education reform on adolescent educational experiences and outcomes.
JULIA GWYNNE was a managing director at the University of Chicago Consortium on School Research when conducting this research. Currently she is a consultant at the Consortium. Her research interests include studies of educational policy and charter schools.
References
Supplementary Material
Please find the following supplemental material available below.
For Open Access articles published under a Creative Commons License, all supplemental material carries the same license as the article it is associated with.
For non-Open Access articles published, all supplemental material carries a non-exclusive license, and permission requests for re-use of supplemental material or any part of supplemental material shall be sent directly to the copyright owner as specified in the copyright notice associated with the article.