
Abstract
The U.S. Department of Education made recent technical changes reducing eligibility for the Rural and Low-Income School Program. Given smaller budgets and lower economies of scale, rural districts may be less able to absorb short-term funding cuts and experience stronger negative achievement effects. Kansas implemented a state-level finance change (block grant funding) after 2015, which froze district revenue regardless of enrollment and reduced funding in districts where enrollment increased. Difference-in-differences models compare achievement before and after block grant implementation to estimate effects of funding cuts separately in rural and nonrural districts. Between-state and within-state comparisons offer complementary identification strategies in which the strengths of one approach help address limitations of the other. Revenue/spending reductions are similar by geography but represent a larger fraction of rural district budgets. Results indicate that revenue reductions have larger implications for achievement in rural areas, where they represent a larger proportion of the total budget.
Introduction
Education funding improves student outcomes, particularly for children in socioeconomically disadvantaged contexts (Candelaria & Shores, 2019a; Jackson et al., 2016; Lafortune et al., 2016; Rauscher, 2020). Less is known, however, about the consequences of education funding reductions for student outcomes (Jackson et al., 2019; Shores & Steinberg, 2019) and particularly whether the consequences of funding cuts differ in rural and urban contexts. Rural districts may experience stronger negative implications of funding cuts—particularly state funding cuts—due to smaller budgets and lower economies of scale. The same dollar reduction represents a larger proportion of the total budget in rural compared with nonrural districts due to smaller budgets. The same percentage funding reduction can have larger effects in rural areas because services and fixed costs are divided across fewer students and schools (lower economies of scale).
Approximately half of U.S. school districts are located in rural areas and receive about 17% of state education funds, on average (Showalter et al., 2017; U.S. Department of Education [USDE], 2014). Nearly 9 million students (19%) attend a rural public school; almost half of those students are low income and a quarter are non-White (Showalter et al., 2017). Adding to the challenges faced by rural districts, a recent technical change in determining student poverty rate at the USDE threatens eligibility for the Rural and Low-Income School program in more than 800 schools (Green, 2020). With smaller total budgets than urban districts, a relatively small dollar reduction can represent a nontrivial portion of total annual revenue in rural districts. Because smaller budgets also dictate lower cash reserve limits, rural districts may be less able to absorb short-term funding cuts and experience stronger negative effects on achievement than urban or suburban districts. This article leverages a unique natural experiment in Kansas to test whether funding reductions affect achievement differently by geography (i.e., rural districts in counties with low population density compared with districts in higher density areas).
From 2008 to 2014, Kansas reduced K–12 education funding through its general formula by 14.6% and total state funding by 10.3% in constant dollars (Leachman et al., 2016). While most states increased funding after the recession, Kansas state formula funding remained 9.9% lower in 2018 than in 2008, after adjusting for inflation, and increases in local funding did not make up for these state reductions (Leachman et al., 2017). Furthermore, Kansas discontinued its funding formula and transitioned to a block grant system for distributing education funds in 2015 (Leachman et al., 2017). Because block grant funding froze revenue regardless of enrollment, districts where enrollment increased experienced a decrease in per pupil revenue. These funding patterns and the relatively high proportion of rural residents (34% in 2010; Institute for Policy and Social Research, 2019) make Kansas a valuable case to examine variation in the relationship between education funding cuts and student outcomes by geography.
Constructing district-level panel data, this study investigates the effect of funding cuts on student outcomes in rural and nonrural areas using difference-in-differences (DID) models. I use two complementary approaches—between-state and within-state comparisons—to estimate achievement differences before and after Kansas transitioned to block grant funding: (1) in Kansas districts compared with those in states with similar achievement trends before the policy change and (2) in Kansas districts where enrollment increased (and funding per pupil therefore decreased) compared with districts in Kansas where enrollment decreased (and funding per pupil increased). The strengths of one approach help to address limitations of the other. I estimate models separately in rural and nonrural districts to examine whether effects of funding cuts differ by geography. Sensitivity analyses test for placebo effects, examine effects on the likelihood of low-achievement scores, include alternative state samples, exclude outliers, and use alternative definitions of rural. Examining effects on per pupil revenue and spending types (e.g., teacher salaries, per pupil instructional spending) and student:teacher ratios provide information about potential mechanisms. Results suggest that similar education funding cuts have stronger negative implications for achievement in rural districts. The policy had larger effects in rural areas not because spending per pupil has a heterogeneous effect on achievement by geography but because the reduction in revenue and spending as a result of the policy represented a larger proportion of the total budget in rural than in urban areas.
Theoretical and Empirical Background
School Funding and Achievement
Strong and growing evidence indicates that school funding matters for academic achievement. For example, recent studies examining the effects of court-ordered school finance reform find benefits of school funding for educational achievement, educational attainment, and high school graduation rates (Candelaria & Shores, 2019a; Jackson et al., 2016; Lafortune et al., 2016). Having established that money matters, research has begun to examine variation in effects of funding by how districts distribute and spend resources (Jackson, 2019). Teacher salary spending benefits achievement, while evidence is mixed for capital spending (Brehm et al., 2017; Cellini et al., 2010; Hanushek et al., 2018; Imberman & Lovenheim, 2015; Martorell et al., 2016). Substantial within-district inequality of school resources could also alter the relationship between funding and achievement (Hyman, 2017; Picus & Wattenbarger, 1996; Roza, 2010). Districts frequently allocate a greater share of funds to schools with more advantaged students, where more experienced teachers tend to work (Heuer & Stullich, 2011; Roza, 2010; Timar & Roza, 2010).
Another key factor that could alter the relationship between funding and achievement is the direction of change in funding. The bulk of the research examines the effects of an increase in spending on student outcomes (e.g., Hyman, 2017; Kreisman & Steinberg, 2019). Some evidence suggests revenue uncertainty, beyond the actual amount, has negative implications for student achievement (Lavertu & St. Clair, 2018). However, few studies examine effects of funding reductions on student outcomes (Jackson et al., 2019; Shores & Steinberg, 2019) and no research has examined whether these effects differ by geography.
The relationship between funding and achievement may differ in the context of funding cuts compared with increases (Jackson et al., 2019). First, districts may be able to avoid any effects of short-term funding cuts on achievement by relying on savings. Districts are allowed to set aside a certain proportion of their budget for unexpected costs and those cash reserves could offset temporary funding reductions. Second, district leaders could cut nonessential expenses first (e.g., extracurricular activities, travel; Ellerson, 2010), with limited implications for achievement. Third, districts could encourage early teacher retirement or reduce spending through staff attrition (Fitzpatrick & Lovenheim, 2014).
K–12 education funding declined sharply from 2008 to 2013, in several states by more than 10% but rebounded in most states after the recession (Leachman et al., 2016). The period following the 2008 recession provides an opportunity to examine the relationship between funding cuts and achievement in the context of recent recovery from previous cuts.
Variation by Geography
Evidence indicates larger benefits of education funding for socioeconomically disadvantaged students and districts (Biddle & Berliner, 2002; Candelaria & Shores, 2019a; Jackson et al., 2016; Lafortune et al., 2016; Rauscher, 2016, 2020; Shores & Steinberg, 2019). Education funding may also have heterogeneous implications by geography, given geographic variation in resources and variation in the relationships between resources and achievement (Miller & Votruba-Drzal, 2015; Miller et al., 2019).
For example, high poverty in rural areas could yield stronger effects of revenue reduction because education funding has larger benefits for poor students. In 2015–2016, 48% of students in rural schools were low income (Showalter et al., 2017). Poverty, economic instability, and their negative implications are frequently examined in urban areas (Brooks-Gunn et al., 1997; Ludwig et al., 2001; Mingione, 1996; Small & Newman, 2001; Wilson & Aponte, 1985), but they also have important implications in rural areas (C. M. Duncan, 1996; Tickamyer & Duncan, 1990).
However, even holding poverty constant, effects of school funding cuts on student outcomes could be larger in rural contexts compared with urban and suburban geographic contexts due to (1) smaller budgets, (2) lower economies of scale, and (3) less access to services.
Smaller Budgets
The same dollar reduction represents a larger proportion of the total budget in rural compared with nonrural districts. For example, a $100,000 reduction represents 2.6% of median total 2016 revenue in rural districts, compared with 0.7% in nonrural districts. Because the same funding cuts represent a greater portion of rural budgets, they may be less able to absorb those cuts, avoid reductions in essential spending, and prevent achievement declines.
Lower Economies of Scale
The same percentage funding reduction could have larger effects in rural areas because lower enrollment limits the extent to which rural districts can benefit from economies of scale (Johnson et al., 2012). In districts with larger enrollment, many students can benefit from the services of counselors, special education teachers, English as a second language teachers, speech therapists, or other teachers with special skills that may not be applicable for all students but may increase achievement among many students. Teachers with these skills can serve students in multiple schools in areas with higher population density and in districts with multiple schools. When funding is reduced, these teachers or counselors become even less affordable in rural districts because their salaries are divided across fewer students and schools. Funding cuts may also further narrow the range of course offerings (e.g., fewer Advanced Placement courses) and public school choice in rural districts, which prevents rural districts and parents from matching students to schools and courses as often occurs in suburban and urban districts (Khattri et al., 1997; Roscigno et al., 2006; Zhang & Cowen, 2009). Similar economies of scale occur for technology, supplies, and transportation (a substantial fixed cost in rural districts). Declining enrollments in many rural districts have made this problem more acute in recent years (Center for Rural Policy and Development, 2009).
Less Access to Services
Access to fewer resources outside of school compared with more urban contexts (e.g., museums, libraries, health care; Miller et al., 2019) can make it more difficult for rural children and families to make up for school funding reductions (G. J. Duncan & Brooks-Gunn, 2000; Guo & Harris, 2000). Fewer local services can also make it more difficult for rural districts to retain qualified teachers during funding cuts (Allen & Sloan, 2005).
In contrast, there are several reasons why effects may not be stronger in rural areas, including (1) community, (2) geographic diversity, and (3) unobserved heterogeneity.
Community
Schools in rural areas tend to have a stronger sense of community and higher social capital, which are related to higher attendance and achievement (Coleman, 1988; Coleman et al., 1982; Flower, 2010; Hopkins, 2005; Tieken, 2014). These differences in school climate could help explain the weaker relationship between family income and achievement in rural areas (Miller & Votruba-Drzal, 2015) and could allow rural schools to weather funding cuts with smaller changes in achievement.
Geographic diversity
The funding-achievement relationship may not differ significantly by geography because rural and urban areas are highly diverse and increasingly interdependent (Lichter & Brown, 2011). This diversity could lead to variation in the relationship between funding cuts and achievement across districts in all geographic contexts, rather than between rural and urban areas. Alternatively, interdependence between rural and urban areas could encourage greater similarity by geography and yield similar relationships between funding reductions and achievement in rural and urban contexts.
Unobserved heterogeneity
Some unobserved factor could account for an apparent relationship between funding reductions and achievement by geography. For example, rural districts have lower expenditures per pupil compared with urban and suburban districts, when holding other factors constant (Roscigno et al., 2006). This could change due to rising fixed costs in rural areas (e.g., transportation, food services; Kemp, 2016). However, lower expenditures in rural areas could partly reflect lower property values, declining fertility, and aging populations (Allen & Sloan, 2005; Johnson et al., 2012; Kemp, 2016; New York State Association of School Business Officials, 2017). At the same time, lower expenditures could reflect lower benefits of education and therefore less value placed on educational investments in rural areas (Roscigno et al., 2006). Thus, research should address potential unobserved factors (e.g., differences in the value of education between districts) that could account for a different relationship between funding and achievement by geography.
Existing Empirical Evidence
Limited research examines geographic variation in the relationship between funding and achievement and even fewer studies address potential unobserved characteristics that could bias estimates. Roscigno et al. (2006) provide valuable and detailed analyses of variation in funding, educational achievement or attainment, and their relationships across rural, suburban, and urban locations. Using data from the National Educational Longitudinal Survey and hierarchical linear models, they find lower school and family resources and investments in both rural and urban (inner city) areas. These lower resources help account for lower educational achievement and attainment in rural and urban compared with suburban areas. The valuable contributions of Roscigno et al. (2006) help explain geographic variation in achievement and raise questions about whether school funding investments have stronger effects on achievement in rural or urban areas.
Only one study examines effects of financial investments on educational outcomes in rural contexts (Paxson & Schady, 2002). Using DID models and instrumental variable techniques, they find that financial investments in Peru increased school attendance rates in rural but not in urban schools (Paxson & Schady, 2002).
The existing research suggests that effects of education funding increases may differ by geography and provides rigorous evidence of that in a developing context (Peru). Research has not yet examined whether effects of education funding cuts differ by geography in a contemporary developed context.
Based on the above review, it is unclear whether decreases in school funding have stronger or weaker effects on achievement in rural school districts. This article leverages a unique natural experiment in Kansas to test whether funding reductions affect achievement differently by geography. Specifically, this study tests whether effects of funding reductions differ in rural districts compared with districts in other contexts. Results can inform current USDE policy decisions that may reduce funding for hundreds of rural schools (Green, 2020).
Kansas Policy Context
In 2015, the Kansas State Legislature enacted the House Substitute for SB7 Bill, which repealed the school funding formula and created the Classroom Learning Assuring Student Success (CLASS) Act. This bill is known colloquially (and throughout this article) as the “Block Grant Bill” because it appropriated funds to districts in the form of block grants for fiscal years 2016 and 2017.
The Kansas Block Grant Bill set school district revenue in 2016 and 2017 at the same level as 2015 (with a 0.4% reduction to cover the Extraordinary Need Fund for districts with an extraordinary increase in enrollment or decrease in property value and slight changes in calculation for virtual students; Kansas Legislative Research Department, 2015). Because block grant funding froze revenue regardless of enrollment, districts where enrollment increased experienced a decrease in per pupil revenue and districts where enrollment decreased enjoyed an increase in per pupil revenue.
The state allows districts to collect local taxes to supplement district revenue (called the Local Option Budget), but this revenue cannot exceed a maximum level set by the state to allow equity across districts within the state. Thus, districts have limited ability to increase their revenue in other ways, which makes the transition to block grant funding in Kansas particularly useful for estimating effects of state funding cuts.
Method
Complementary difference-in-differences analyses apply two identification strategies: within-state comparisons and between-state comparisons. The strengths of one approach help address limitations of the other.
Data
For the within-state analyses, I use district-level data from 2010 to 2018 for school districts in Kansas for several reasons. First, achievement tests are typically conducted at the state level, making cross-state comparisons challenging. The Kansas Department of Education (KSDE) provides annual achievement information for each school district, which allows comparisons across districts. These data are not publicly available and were purchased from KSDE. Second, Kansas includes a relatively high proportion of rural school districts (64% in 2018 as defined by the USDE, 2020). Third, implementation of the Block Grant Bill in 2015 by the Kansas State Legislature provides an identification strategy to estimate effects of funding reductions on achievement.
For the between-state analyses, I use 2009–2016 data from the Stanford Education Data Archive (SEDA; Reardon et al., 2019). These data provide achievement measures in standard deviation units that are comparable across states but are only available through 2016 (1 year after the Block Grant Bill). I limit the analyses to districts in Kansas and states with similar pretreatment achievement trends (±0.015 of the Kansas pretrend): Arkansas, Connecticut, Delaware, Idaho, Illinois, Maryland, Missouri, North Carolina, North Dakota, South Dakota, Utah, and Vermont. Results are similar when including all states or Kansas and its neighboring states: Colorado, Missouri, Nebraska, and Oklahoma.
Measures
Achievement is measured using annual assessment data in English language arts (ELA) and math from KSDE. The assessments were developed by the Center for Educational Testing and Evaluation at the University of Kansas. Assessments for years 2010 to 2013 were given in Grades 3 to 9 and 11 (Neuenswander, 2015). Year indicates spring of each academic year throughout the article, so 2010 indicates the 2009–2010 academic year. There is no assessment data in 2014 due to a denial of service attack on the state assessment servers (Kansas State Legislature, 2019). The assessments were changed beginning in 2015 and from 2015 to 2018 were given in Grades 3 to 8 and 10. Due to the change in assessments after 2013, I convert district average test scores into annual standardized scores (measured in standard deviation units from the mean in each year) to allow comparisons over time. The SEDA data also measure achievement in standard deviation units, relative to the grade-specific mean of three cohorts who were in Grade 4 in 2009, 2011, and 2013, which provides a stable comparison (Fahle et al., 2018). All analyses include year fixed effects to account for state-wide or regional changes in achievement over time.
Post–Block Grant funding is an indicator for years after 2015 when the Block Grant Bill was implemented. The Block Grant Bill affected district revenue in fiscal years 2016 and 2017. All years after 2015 are coded as treated because effects could occur with a delay and still influence achievement in 2018.
Enrollment is measured two ways: total enrollment and enrollment in grades tested. Using KSDE data, total annual district enrollment is the number of full-time equivalent students, which includes the total number of students enrolled in kindergarten through 12th grade, 3- and 4-year-old special education preschool, and virtual students (Dennis & Neuenswander, 2016). Students who are enrolled part-time are counted as a portion of one student and 3- and 4-year-old preschool students are counted as half-time (Dennis & Neuenswander, 2016). National Center for Education Statistics data on total district enrollment is used in the between-state analyses for comparability.
Only seven of the thirteen K–12 grades are tested each year in Kansas and only six grades are included in the SEDA data in each year. Achievement in districts should be more strongly related to the number of students in the grades tested than to changes in total enrollment. For example, an increase in the number of students in grades tested could increase the student:teacher ratio and reduce individual interaction time with teachers in tested grades, while growth in the number of virtual and preschool students would not.
Primary analyses (in both KSDE and SEDA data) therefore measure growth in enrollment at the transition to block grant funding as an indicator for districts where the number of students tested increased from 2015 to 2016. Federal policy requires states to test every student in Grades 3 to 8 and one high school grade (Fahle et al., 2018). However, sensitivity analyses use alternative indicators for enrollment growth from 2015 to 2016 with consistent results. To address potential changes in all measures of enrollment, models control for total enrollment and number of students tested. Kansas analyses also control for weighted enrollment (with low-income, bilingual, and special education students weighted more than others in state funding calculations).
Rural is an indicator for districts in which the population density was less than 10 people per square mile in all counties with a district school in 2018 (USDE, 2018). County population density is one criterion used by the USDE to determine eligibility for the Small, Rural School Achievement Program, which provides additional funding to rural districts (USDE, 2020). However, geographic context is a continuum and any threshold to determine rural location is somewhat arbitrary. Therefore, I use several alternative measures in sensitivity analyses: (1) all district schools are in a location defined as rural by the Secretary of Education in 2018 (65% of districts); (2) eligible for the Small, Rural School Achievement Program: All district schools are in a county with low population density (<10 people/square mile) and in a location defined as rural by the Secretary of Education in 2018 (64% of districts); and (3) district total enrollment is below the median (531 students in Kansas data, 730 students in SEDA data; 50% of districts). Results are consistent using these alternative measures. The primary measure of rural is preferred because it uses a more conservative definition of rural and provides a stronger test of effects in rural districts than the other measures due to the smaller sample size of rural districts.
Attendance increases achievement (Gottfried, 2010) and could be a potential mechanism through which funding influences achievement. Dropout rates tend to be higher among students with low achievement (Glennie et al., 1970; Rumberger, 2013), so analyses predicting achievement could underestimate the negative effects of funding cuts. District-level attendance and dropout rates are available from KSDE in all years 2010 to 2018. Attendance rate is the annual average daily attendance divided by average daily membership in a district. Dropout rate is the annual proportion of students in Grades 7 to 12 who leaves school from October 1 to September 30 with a dropout exit code and does not reenroll in school by September 30. Codes that count as dropping out include Discontinued schooling, Moved within the United States, not known to be continuing, Unknown, Transfer to an adult education facility (i.e., for GED completion), and Transfer to a juvenile or adult correctional facility where educational services are not provided (KSDE, 2019). Attendance and dropout rates provide alternative dependent variables that are measured consistently in all years.
Several potential mechanisms are examined to understand how school funding cuts influenced achievement. School district revenue is measured in 2019 dollars using total revenue per pupil, as well as state, local, and federal revenue per pupil. All currency is adjusted for inflation using monthly consumer price index data from the St. Louis Federal Reserve based on the fiscal rather than calendar year to match the school calendar (Candelaria & Shores, 2019b). Spending is measured in 2019 dollars using total spending per pupil as well as per pupil spending on instruction. Other potential mechanisms include student:teacher ratio and average teacher salaries (in 2019 dollars). These data are from the Census Annual Survey of School System Finances (F–33), Kansas Policy Institute, and KSDE.
Control measures include annual characteristics of students in the district (percent Black, Hispanic, eligible for free/reduced-price lunch, special education) from KSDE and SEDA, and district child poverty rate and total population from SAIPE (U.S. Census Bureau Small Area Income and Poverty Estimates Program).
Analysis
DID models are used to estimate the effect of funding cuts on achievement. Between-state estimates compare districts in Kansas with districts in states with similar achievement pretrends before and after the transition to block grant funding. Equation 1 predicts achievement in district (i) and year (t) with district fixed effects, an indicator for posttreatment (after 2015, when the Block Grant Bill was implemented), an indicator for districts in Kansas that were subject to the Block Grant Bill, time-varying controls (X) for district characteristics, and a linear time trend (year).
1
The sample is limited to districts where enrollment increased from 2015 to 2016, because those districts received lower per pupil revenue after the Block Grant Bill in Kansas.

Within-state estimates compare Kansas districts where enrollment increased to those where enrollment decreased before and after the Block Grant Bill. Because block grant funding froze district revenue regardless of enrollment, districts where enrollment increased experienced a decline in per pupil revenue and those where enrollment decreased experienced an increase in per pupil revenue. Equation 2 predicts achievement in district (i) and year (t) with district fixed effects, an indicator for posttreatment (after 2015, when the Block Grant Bill was implemented), an indicator for districts where enrollment increased from 2015 to 2016, time-varying controls (X) for district characteristics, and a linear time trend (year).

In both analyses, baseline models include no controls (X). Robust standard errors are adjusted for district clustering in all models. If
The key assumption is that districts would have had similar trends in achievement in the absence of the Block Grant Bill (Angrist & Pischke, 2009; Goodman-Bacon, 2018; Wooldridge, 2003). The common trends assumption in the between-state analyses is that achievement in Kansas and the comparison states did not change after 2015 for reasons other than the Block Grant Bill. Including districts in multiple states means that policy changes in other states around the time of the Block Grant Bill could violate this assumption. The SEDA data makes cross-state comparisons possible with scaled achievement scores but includes only one year of achievement data after the Block Grant Bill. The within-state analyses include more years of data after the Bill and districts that are all subject to the same state policies. In the within-state analyses, the key assumption is that achievement in Kansas districts where enrollment grew and shrank did not change after 2015 for reasons other than the Block Grant Bill. If districts with declining enrollment also had declining achievement (e.g., due to rising poverty), this could bias estimates.
Several steps address this concern and potential violation of the above assumptions. First, all analyses include district fixed effects to adjust for stable differences between districts. Second, I add time-varying controls for multiple district characteristics that could influence achievement. Third, I add controls for time-trends in total district population and child poverty rate. Fourth, I conduct placebo tests at 5 years prior and 4 years prior to the true policy change. These steps address potential limitations of both the between- and within-state analyses and assess robustness of the DID estimates to controls that help address potential violation of the common trends assumption.
Results
Appendix Tables A1 and A2 provide descriptive statistics separately by geography in the SEDA and KSDE data, respectively. Table A1 includes districts in all states (Panel A), districts in Kansas and states with similar pretreatment achievement trends (±0.015 SD; Panel B), and districts in Kansas and neighboring states where enrollment increased from 2015 to 2016, because those districts experienced funding cuts in Kansas. The sample in Panel B is used for the main analyses. Seven percent of the SEDA sample districts are rural and about one third of the Kansas sample is rural, based on the conservative definition used here (low-county population density). Approximately half of rural Kansas districts (51%) grew between 2015 and 2016, compared with 57% of nonrural districts. Mean achievement differences between rural and urban districts are small (never larger than one tenth of a standard deviation) in both the SEDA and KSDE samples. Revenue and spending are higher in rural districts, on average, and nonrural districts have higher student:teacher ratios, teacher salaries, percent Black students, and enrollment. In Kansas, percent Hispanic students, child poverty rate, and eligibility for free/reduced-price lunch are higher in rural compared with nonrural districts.
The between-state analysis is limited to districts that grew, while the within-state analysis compares districts that grew and shrank. Panel B in Table A2 compares mean values in Kansas districts where enrollment increased or decreased from 2015 to 2016. These districts show no significant differences in achievement, attendance rate, dropout rate, free/reduced-price lunch eligibility, percent Hispanic students, percent special education students, and most revenue measures. However, districts that shrank are more likely to be rural, they have higher state revenue and instructional spending per pupil, lower teacher salaries, student:teacher ratios, enrollment, and child poverty rate. Comparing rural and nonrural districts and including time-varying control measures help address these differences, and the between-state analyses, which do not compare districts that grew and shrank, provide a useful complement.
Figure 1 shows mean achievement in the SEDA sample by year from the Block Grant Bill in Kansas and in other states with similar trends, separately by geography. Mean achievement decreased slightly over time in both rural and nonrural districts in Kansas and in other states before the Block Grant Bill. The decrease appears slightly larger in Kansas, but trends are broadly comparable.
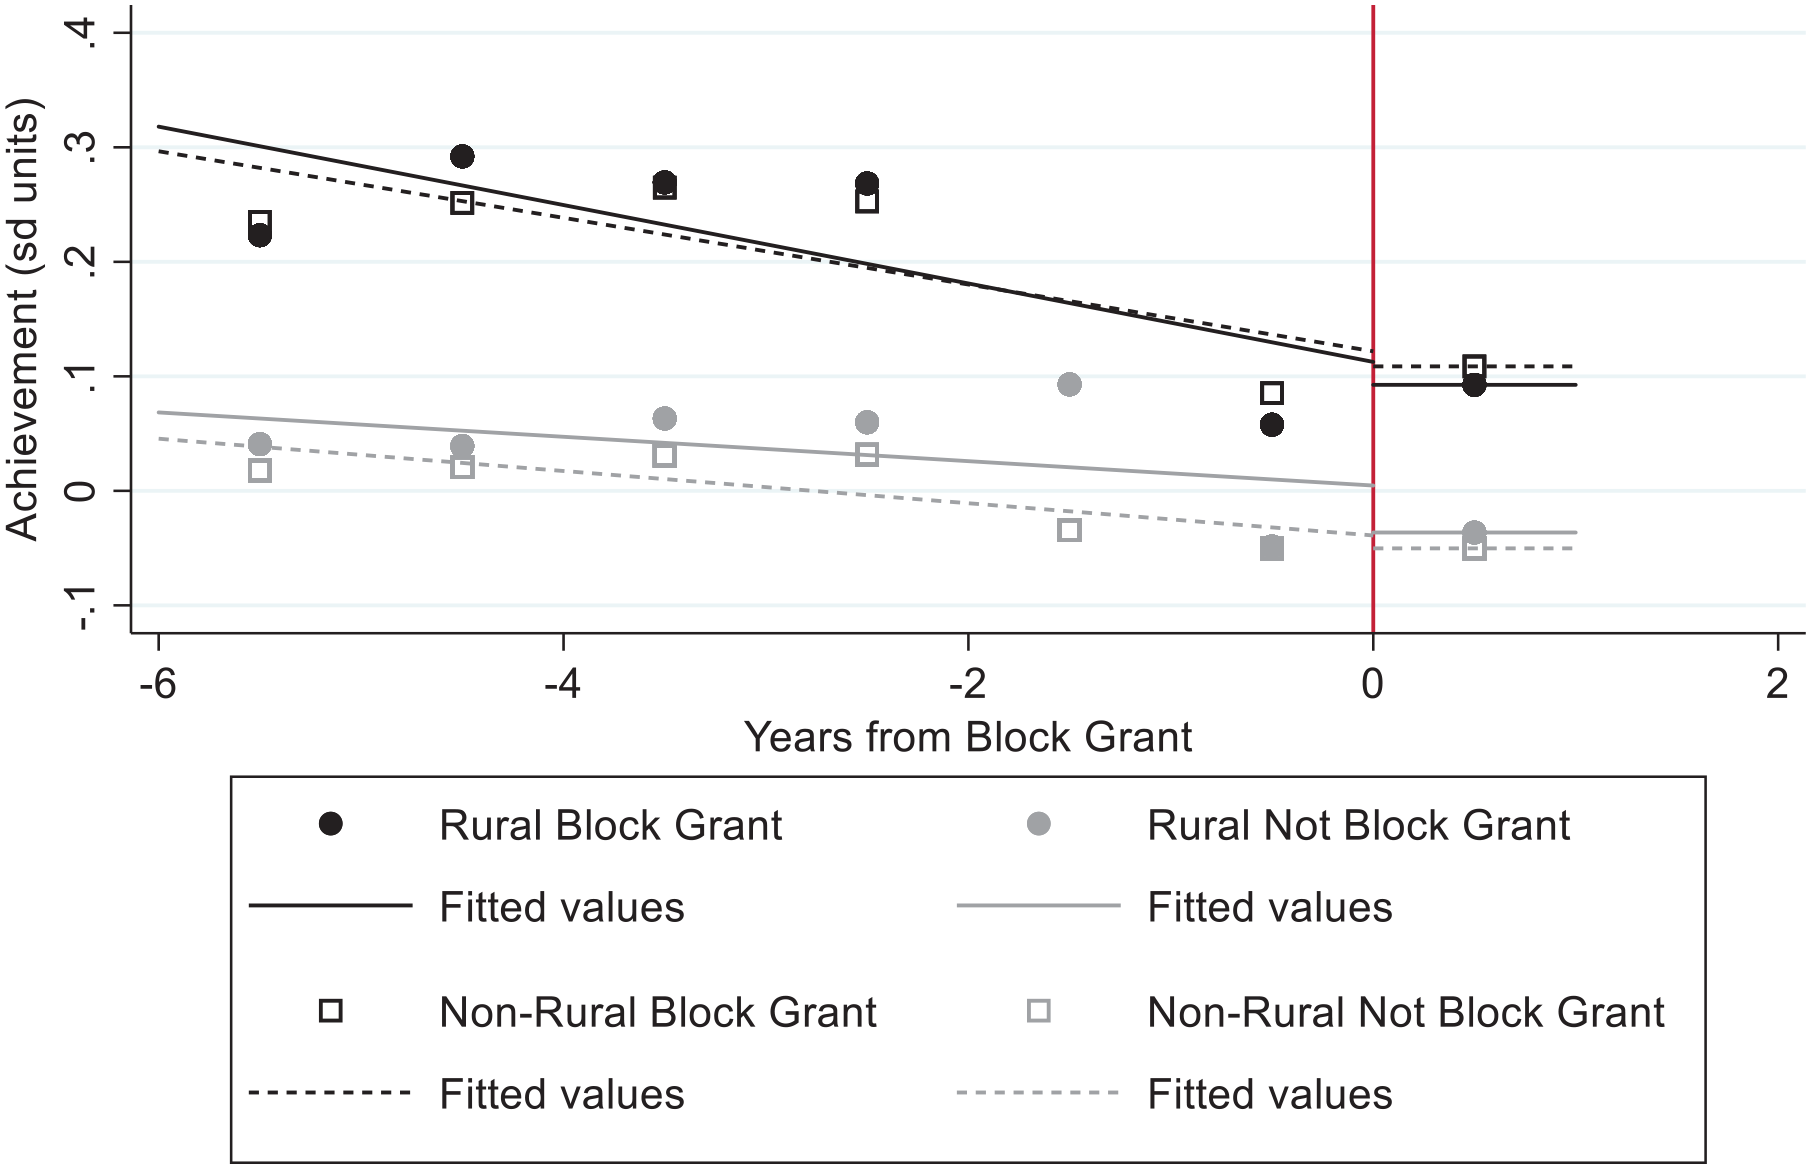
Achievement trends before and after Block Grant Bill by geography—Between-state analyses.
The Kansas data include more than 1 year after the Block Grant Bill, which enables the examination of trends before and after the Bill. Figure 2 shows trends in achievement by year from the Block Grant Bill in Kansas districts that grew and shrank, separately by geography. The figure suggests an achievement decline of approximately 0.2 standard deviations among rural districts that grew after the Bill. However, the figure also suggests potential assessment changes over time, as well as different trends by enrollment change and geography. (Appendix Figure A1 provides histograms of Kansas achievement by year.) These different pretrends could bias estimates in the within-state analyses. In addition to including district fixed effects and multiple controls, an alternative specification helps address this concern. 2
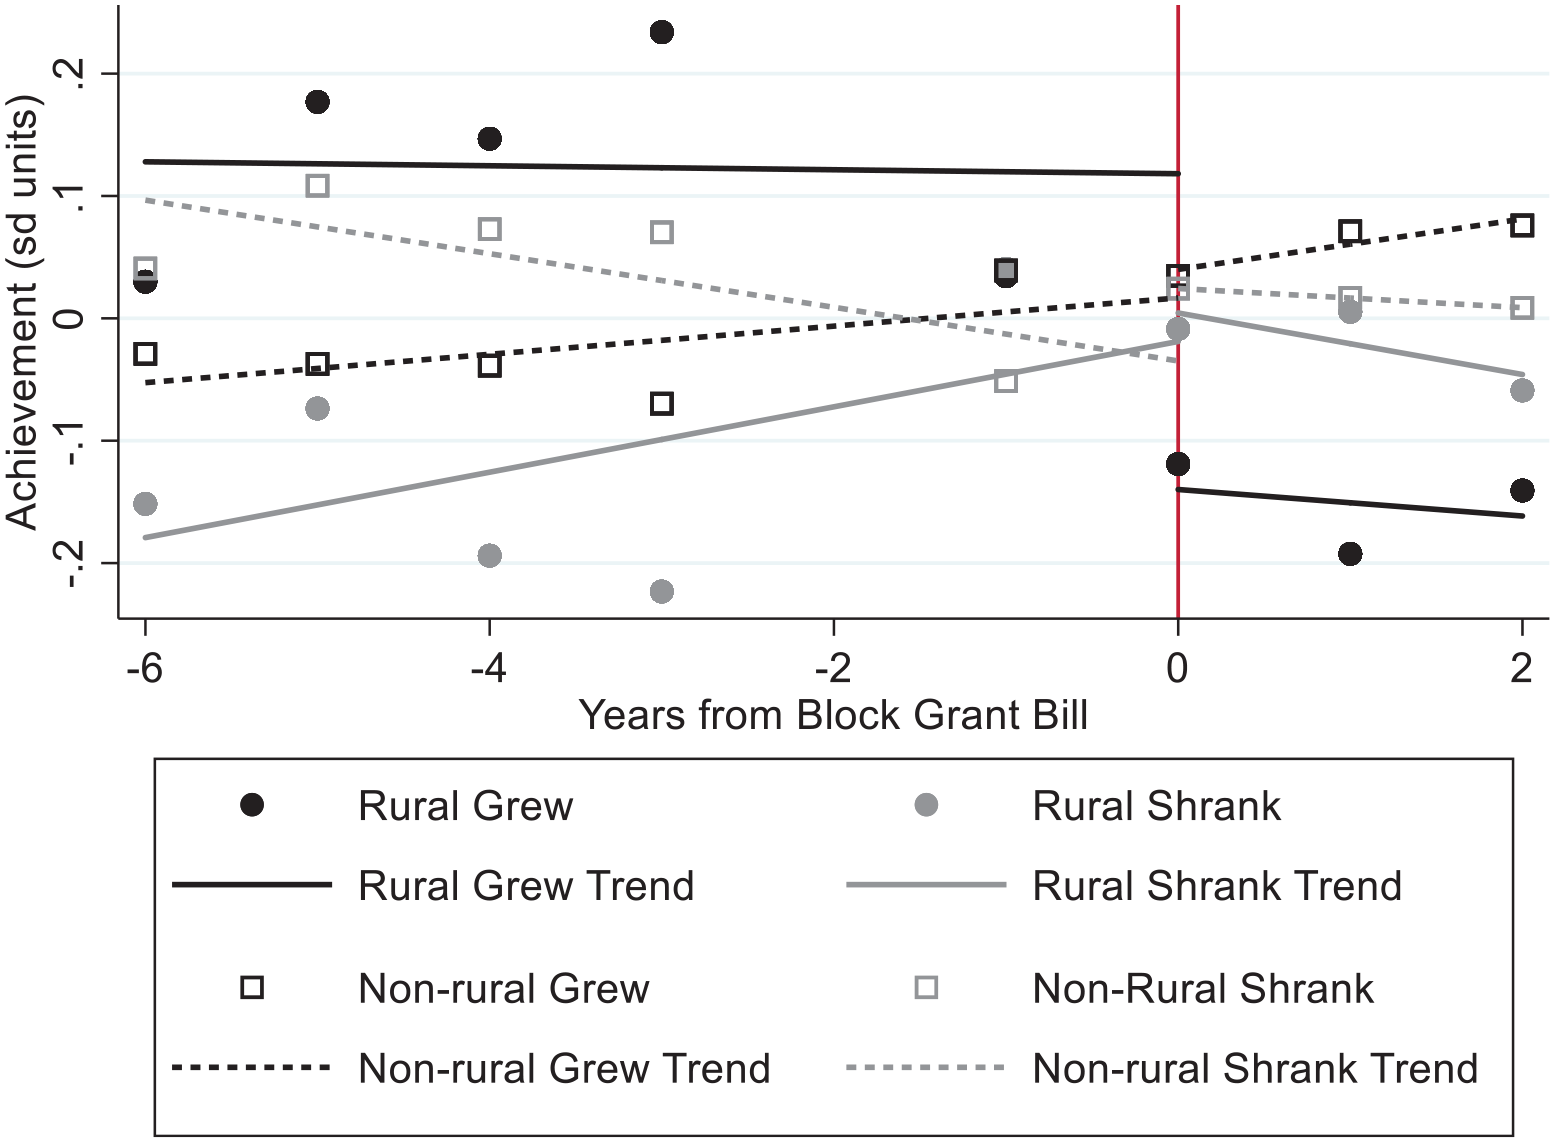
Math achievement trends before and after Block Grant Bill by enrollment change—Kansas districts.
Tables 1 and 2 show the first stage DID estimates predicting revenue and spending measures in rural and nonrural districts. The between-state estimates (Table 1) indicate that the Block Grant reduced revenue and spending per pupil in both rural and nonrural districts where enrollment increased, but these estimates do not differ significantly by geography. For example, revenue per pupil declined by about $950 more in rural districts in Kansas than in other states after the Block Grant, compared with a decline of about $900 in nonrural districts. Given differences in enrollment, however, these similar declines represent different proportions of mean total revenue. In rural districts, this decline is 0.01% of mean total revenue, more than five times greater than the 0.002% of mean total revenue in nonrural districts. Declines in spending similarly represent a larger fraction of mean total spending in rural than in nonrural districts (more than four times greater).
Difference-in-Differences Models Predicting per Pupil Revenue and Spending: Between-State Analyses
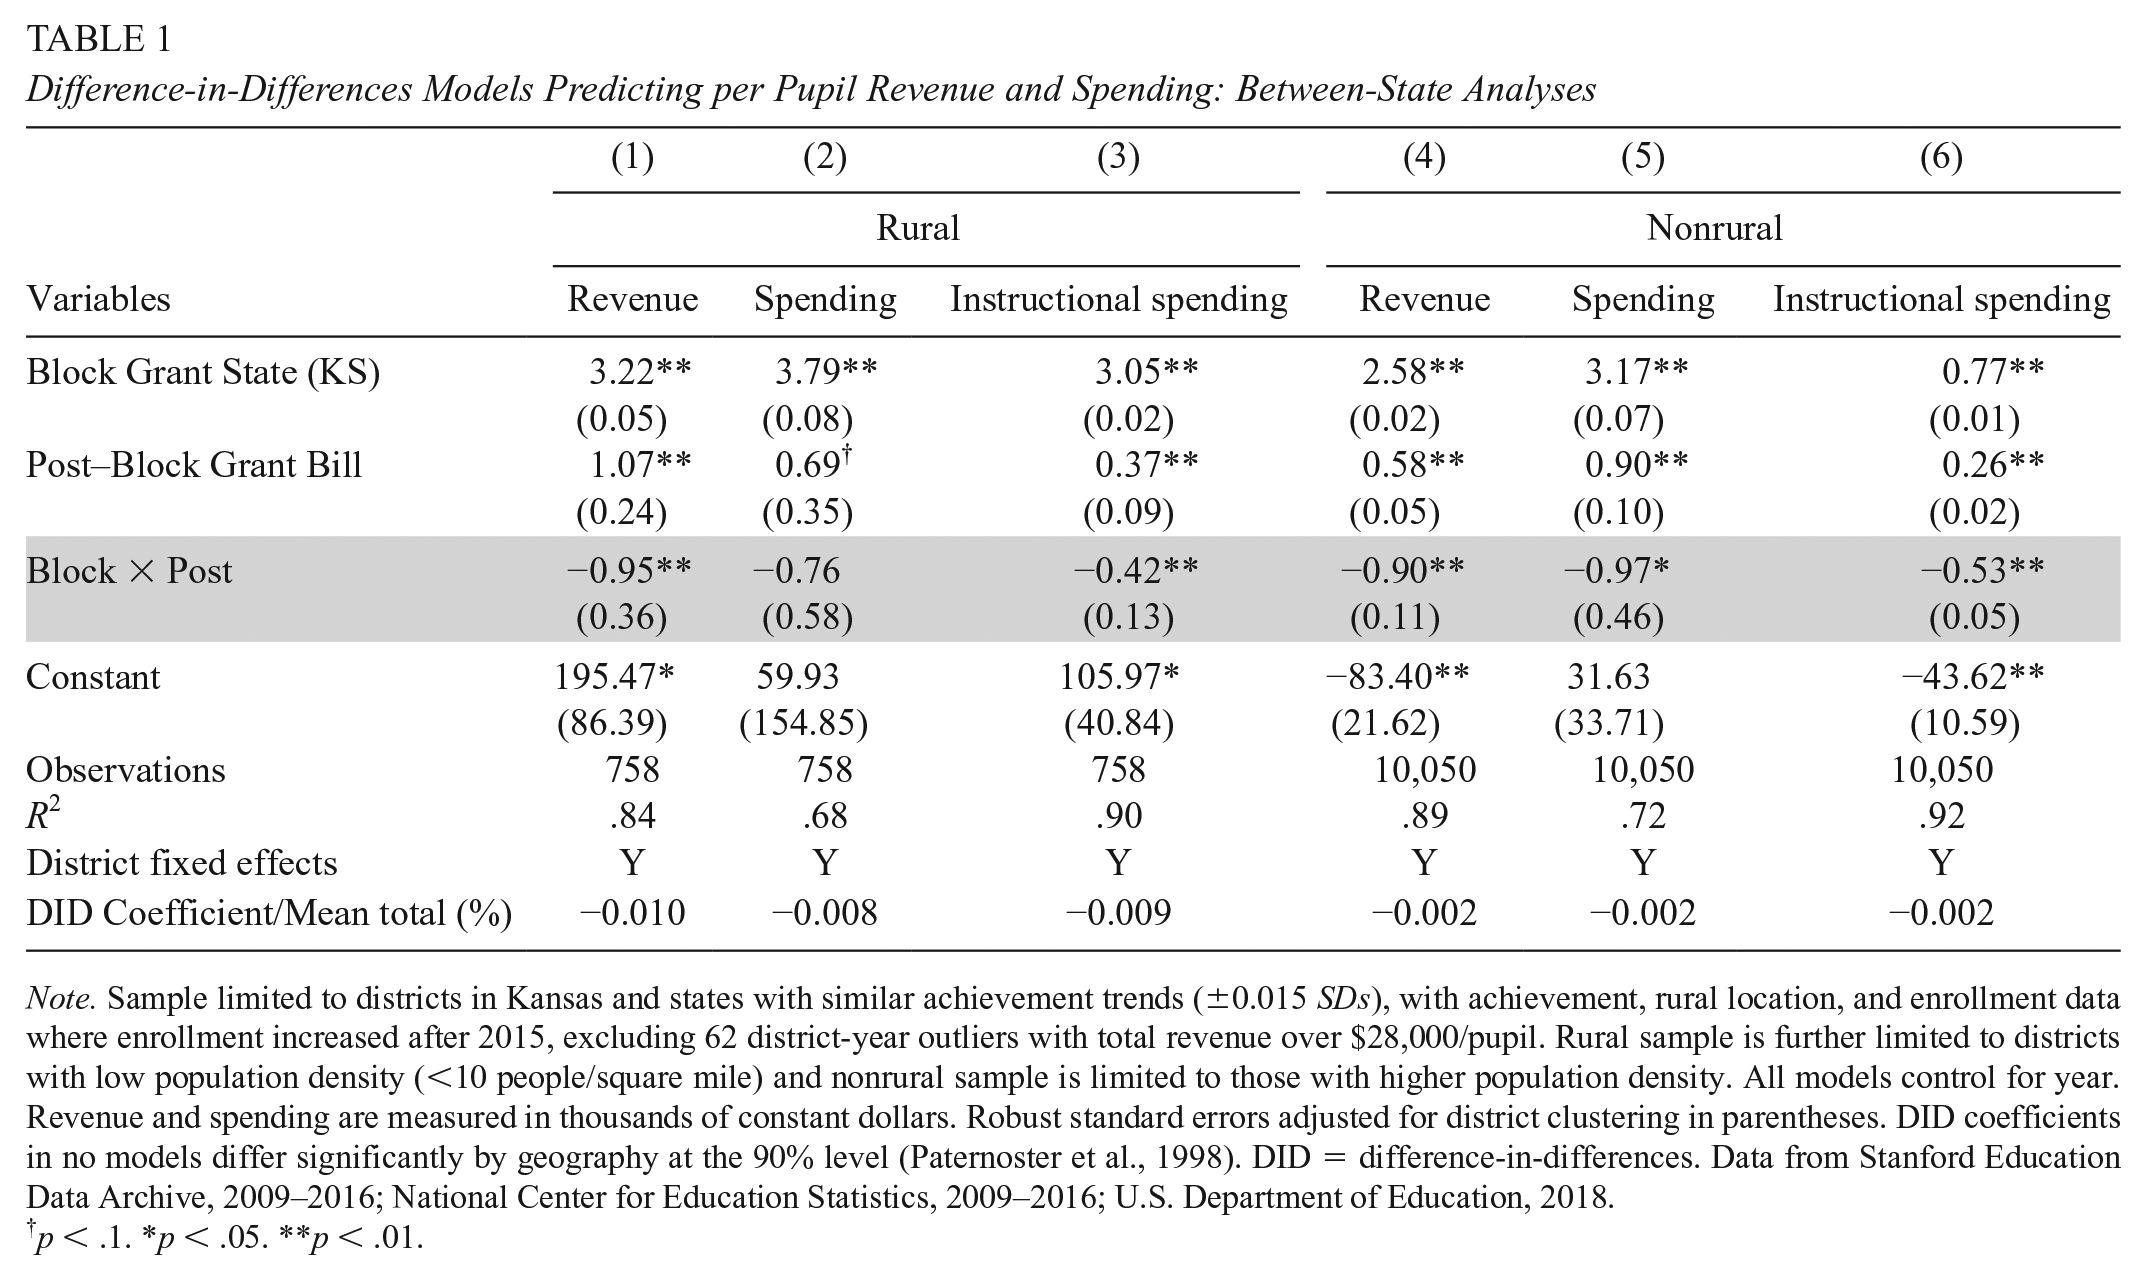
Note. Sample limited to districts in Kansas and states with similar achievement trends (±0.015 SDs), with achievement, rural location, and enrollment data where enrollment increased after 2015, excluding 62 district-year outliers with total revenue over $28,000/pupil. Rural sample is further limited to districts with low population density (<10 people/square mile) and nonrural sample is limited to those with higher population density. All models control for year. Revenue and spending are measured in thousands of constant dollars. Robust standard errors adjusted for district clustering in parentheses. DID coefficients in no models differ significantly by geography at the 90% level (Paternoster et al., 1998). DID = difference-in-differences. Data from Stanford Education Data Archive, 2009–2016; National Center for Education Statistics, 2009–2016; U.S. Department of Education, 2018.
p < .1. *p < .05. **p < .01.
Difference-in-Differences Models Predicting per Pupil Revenue and Spending—Within-State Analyses

Note. Sample limited to districts with rural location, enrollment, and spending/revenue data, excluding two district-year outliers with total revenue over $60,000/pupil. Rural sample is further limited to districts with low population density (<10 people/square mile) and nonrural sample is limited to those with higher population density. All models control for year. Revenue and spending are measured in thousands of constant dollars. Robust standard errors adjusted for district clustering in parentheses. DID coefficients in no models differ significantly by geography at the 90% level (Paternoster et al., 1998). DID = difference-in-differences. Data from Kansas State Department of Education, 2010–2018; Kansas Policy Institute, 2010–2018; U.S. Department of Education, 2018.
p < .1. *p < .05. **p < .01.
Within-state estimates (Table 2) echo the between-state results and suggest the Block Grant reduced revenue and spending per pupil in both rural and nonrural districts where enrollment grew. For example, revenue per pupil declined by about $1,040 more in rural districts that grew than in other districts after the Block Grant, compared with a decline of about $530 in nonrural districts that grew. These estimates do not differ significantly by geography, but they represent different proportions of mean total revenue and spending. In rural districts, the revenue decline as a proportion of mean total revenue is over 10 times greater than that in nonrural districts. Declines in spending as a fraction of mean total spending are over nine times greater in rural than in nonrural districts. Appendix Tables A4 and A5 show estimates predicting revenue and spending measures using a continuous measure of enrollment change. A 1% increase in enrollment after the Block Grant reduced revenue and spending per pupil in both rural and nonrural districts. These declines are rarely different by geography but are significantly larger in rural districts in two models, suggesting larger per pupil declines in instructional spending and state revenue among rural districts.
One concern in these analyses is that the Block Grant may have induced changes in school composition that could bias DID estimates on achievement. Appendix Tables A6 and A7 show estimates predicting student composition to examine whether the policy change induced enrollment changes in ways that may affect achievement. Estimates indicate that the Block Grant had no significant effects on student composition in rural districts in either the between-state or within-state analyses. In nonrural districts in the SEDA sample, eligibility for free/reduced-price lunch declined by 2% and child poverty rate declined by 1% after the Block Grant. In the within-state analyses, the proportion of Hispanic students increased by 1% in nonrural districts after the Block Grant. These analyses do not suggest substantial changes in student composition with the Block Grant. Small increases in child poverty in nonrural districts in the between-state analyses indicate the importance of controlling for child poverty and trends in child poverty.
Table 3 provides between-state DID estimates predicting math achievement, separately by geography. Achievement declined by 0.13 SD units in rural districts that grew in Kansas after the Block Grant Bill compared with equivalent districts in other states that were not subject to the Bill (p < .05). This difference holds (estimates range from −0.14 to −0.15; p < .01) when adding controls for district demographics and trends in district population size and child poverty rate. In contrast, estimates in nonrural districts range from −0.05 to −0.07 standard deviation units (p < .01). Estimates consistently suggest larger achievement declines in rural compared with nonrural districts and the coefficients differ by geography at the 90% level in Models 2 and 6 (Paternoster et al., 1998).
Difference-in-Differences Models Predicting Standardized Math Achievement—Between-State Analyses
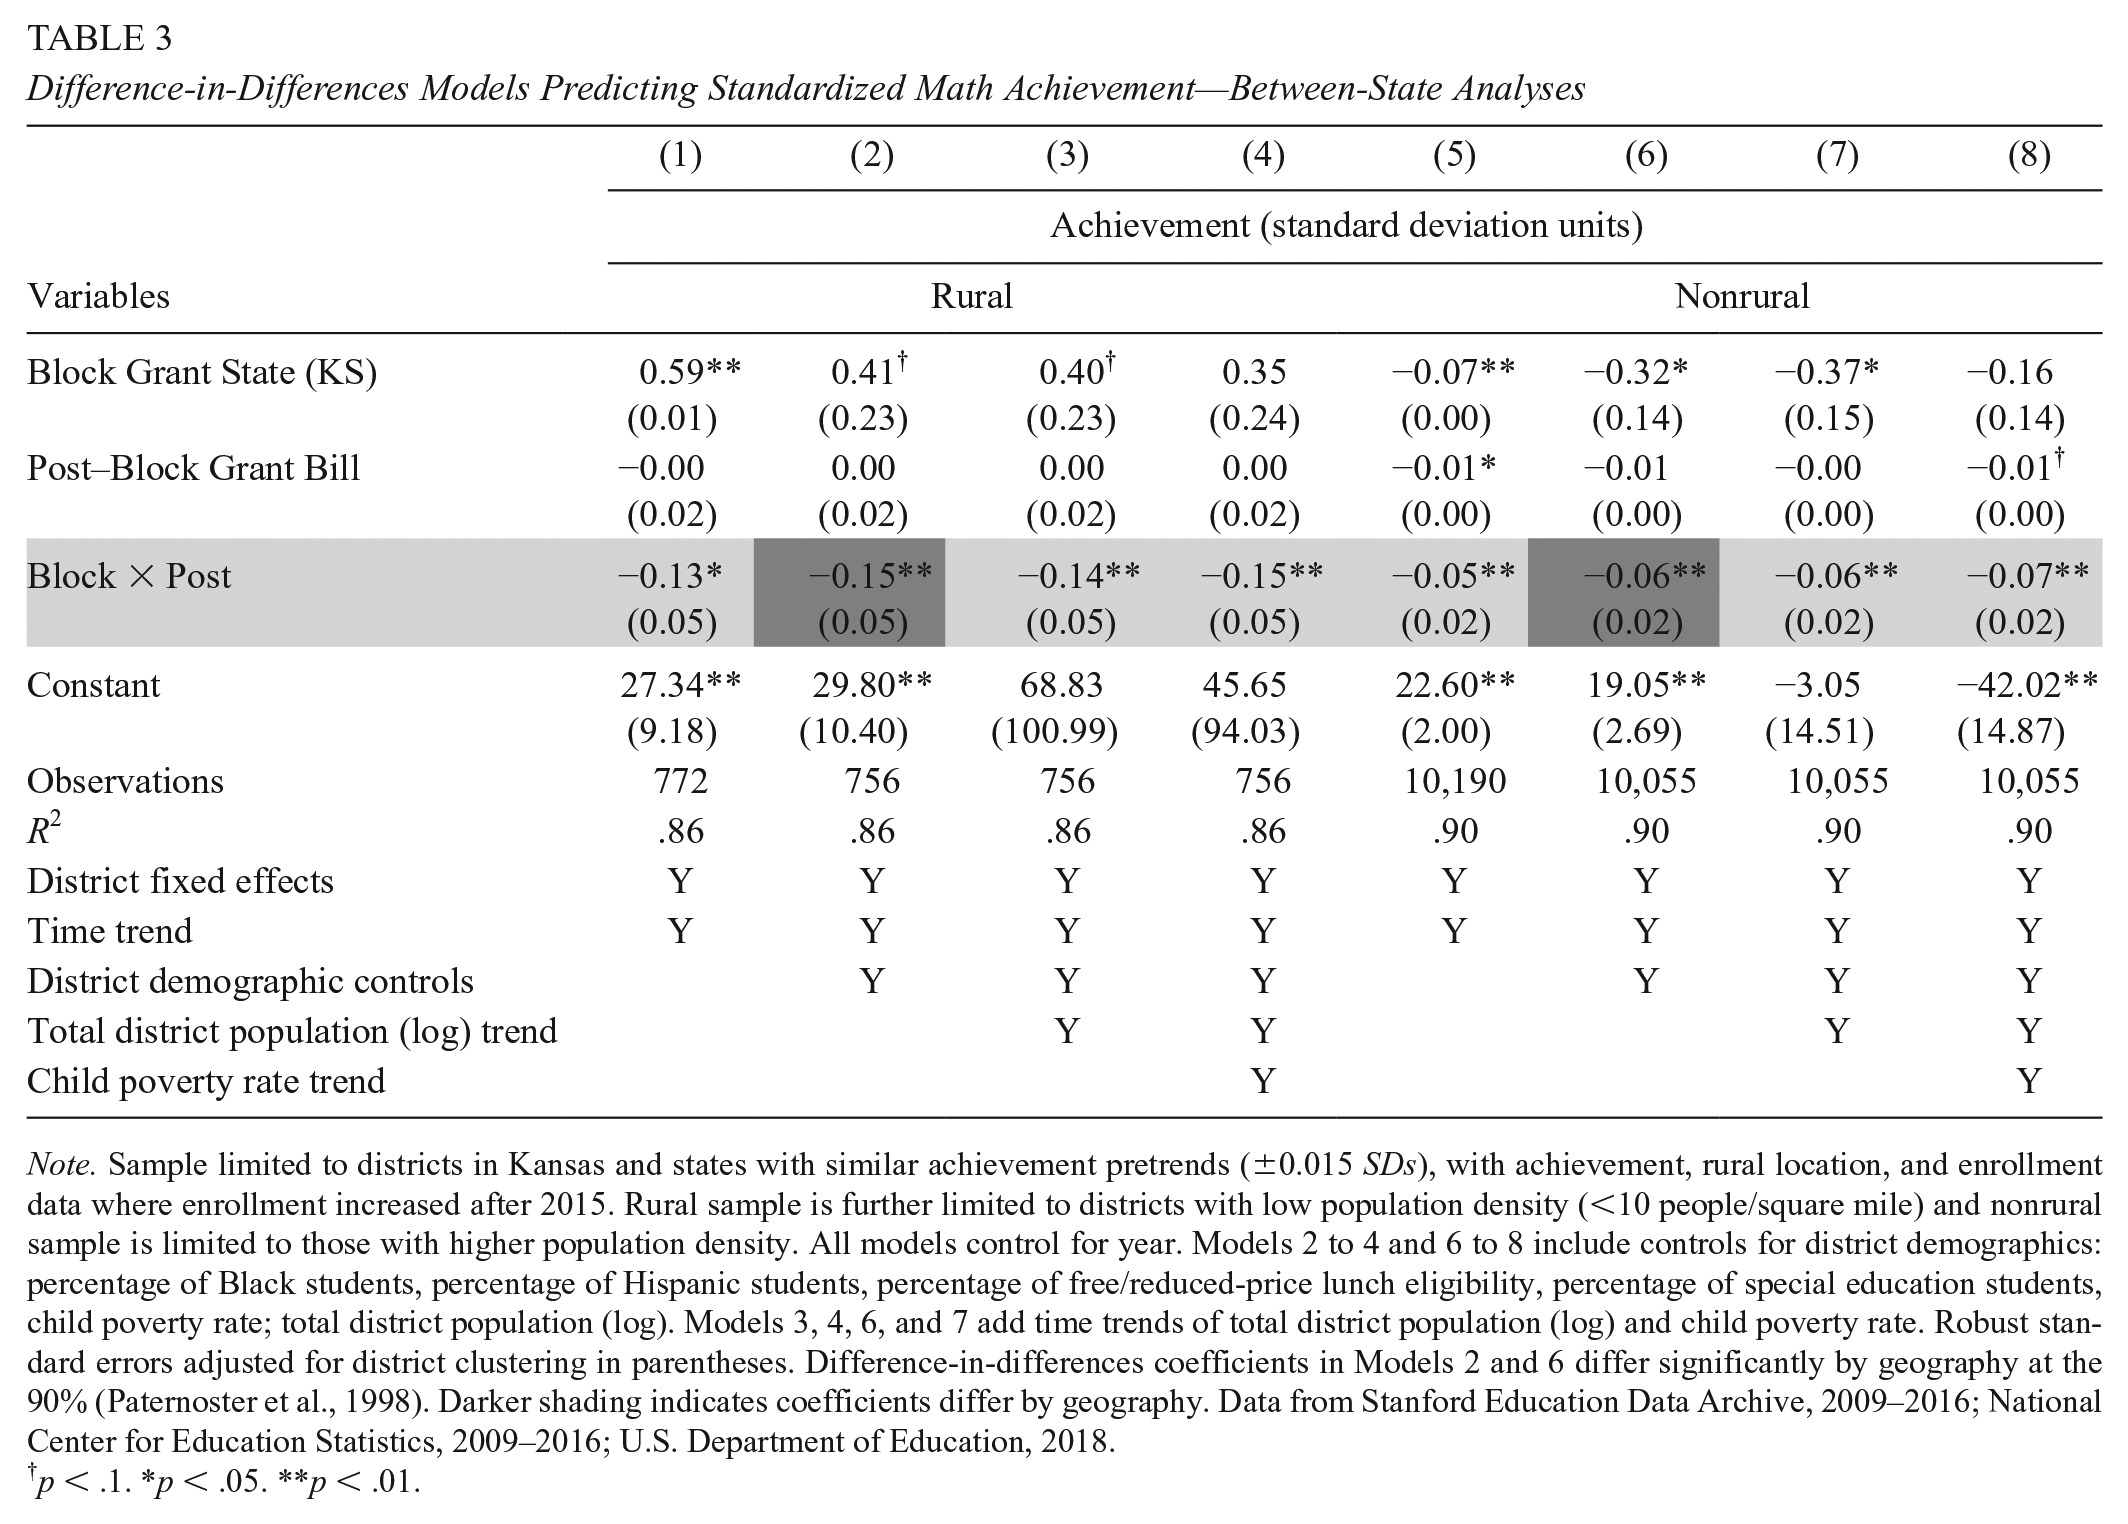
Note. Sample limited to districts in Kansas and states with similar achievement pretrends (±0.015 SDs), with achievement, rural location, and enrollment data where enrollment increased after 2015. Rural sample is further limited to districts with low population density (<10 people/square mile) and nonrural sample is limited to those with higher population density. All models control for year. Models 2 to 4 and 6 to 8 include controls for district demographics: percentage of Black students, percentage of Hispanic students, percentage of free/reduced-price lunch eligibility, percentage of special education students, child poverty rate; total district population (log). Models 3, 4, 6, and 7 add time trends of total district population (log) and child poverty rate. Robust standard errors adjusted for district clustering in parentheses. Difference-in-differences coefficients in Models 2 and 6 differ significantly by geography at the 90% (Paternoster et al., 1998). Darker shading indicates coefficients differ by geography. Data from Stanford Education Data Archive, 2009–2016; National Center for Education Statistics, 2009–2016; U.S. Department of Education, 2018.
p < .1. *p < .05. **p < .01.
Table 4 provides within-state DID estimates predicting math achievement. Compared with other rural Kansas districts where enrollment shrank, districts where enrollment grew (and per pupil funding therefore declined) had significantly lower achievement after the Block Grant Bill. Specifically, estimates suggest achievement declined by −0.37 to −0.38 standard deviation units more after the bill in rural districts that grew than in those that did not. In contrast, estimates in nonrural districts range from +0.09 to +0.13. The DID coefficients in rural and nonrural districts differ significantly at the 95% level in all models (Paternoster et al., 1998). Illustrated in Figure 3, these stronger negative effects on achievement in rural districts are consistent with Hypothesis 1 and hold when controlling for multiple time-varying district characteristics and trends in district population and child poverty rate.
Difference-in-Differences Models Predicting Standardized Math Achievement—Within-State Analyses

Note. Sample limited to districts with achievement, rural location, and enrollment data. Rural sample is further limited to districts with low population density (<10 people/square mile) and nonrural sample is limited to those with higher population density. Models 2 to and 6 to 8 include controls for district demographics: % Black students, % Hispanic students, % free/reduced-price lunch eligibility, % special education students, child poverty rate, total district population (log). Models 3, 4, 6, and 7 add time trends of total district population (log) and child poverty rate. Robust standard errors adjusted for district clustering in parentheses. Difference-in-differences coefficients in all models differ significantly by geography at the 95% (Paternoster et al., 1998). Darker shading indicates coefficients differ by geography. Data from Kansas State Department of Education, 2010–2018; Kansas Policy Institute, 2010–2018; U.S. Department of Education, 2018.
p < .1. *p < .05. **p < .01.

Difference-in-differences estimates predicting standardized math achievement by geography—within-state analyses.
Table 5 shows results from the same models in Table 4 but using a continuous measure of enrollment change (percent district enrollment change from 2015 to 2016). These estimates suggest that each 1% increase in enrollment after the Block Grant reduced achievement by 0.01 SD units in rural districts but had no effect on achievement in nonrural districts. The interaction coefficients in all models differ by geography at the 90% level. Figure 4 shows the predicted marginal effects of the transition to block grant funding on math achievement, by decile of percent change in enrollment at mean values of other covariates. Effects are fairly constant in nonrural districts but show a clear trend toward larger negative effects on achievement at higher levels of enrollment growth. Appendix Table A8 shows between-state analyses allowing estimates to vary by percent enrollment change from 2015 to 2016. These estimates also suggest achievement declines for each 1% increase in enrollment after the Block Grant but only in rural districts.
Difference-in-Differences Models Predicting Standardized Math Achievement—Within-State Analyses by Continuous Enrollment Change

Note. Sample limited to districts with achievement, rural location, and enrollment data, excluding eight outlier districts where enrollment increased more than 30% in 2016. Rural sample is further limited to districts with low population density (<10 people/square mile), and nonrural sample is limited to those with higher population density. Models 2 to 4 and 6 to 8 include controls for district demographics: % Black students, % Hispanic students, % free/reduced-price lunch eligibility, % special education students, child poverty rate, total district population (log). Models 3, 4, 6, and 7 add time trends of total district population (log) and child poverty rate. Robust standard errors adjusted for district clustering in parentheses. Difference-in-differences coefficients in all models differ significantly by geography at the 90% (Paternoster et al., 1998). Darker shading indicates coefficients differ by geography. Data from Kansas State Department of Education, 2010–2018; Kansas Policy Institute, 2010–2018; U.S. Department of Education, 2018.
p < .1. *p < .05. **p < .01.

Conditional marginal effects of Post–Block Grant on standardized math achievement by decile of percentage of change in enrollment.
Appendix Tables A9 to A12 show equivalent results predicting ELA rather than math achievement. Results from the within-state ELA analyses are similar to those predicting math achievement and estimates suggest larger negative effects of the Block Grant on achievement in rural than nonrural districts (p < .05). However, in the between-state analyses, DID coefficients do not achieve statistical significance among rural districts when predicting ELA achievement and coefficients do not differ significantly by geography. This could reflect weaker effects of funding for ELA achievement, the relatively small sample size of rural observations, or only 1 year of achievement information after the Block Grant Bill in the between-state analyses.
Mechanisms
In addition to revenue and spending (Tables 1 and 2), Appendix Tables A13 and A14 provide results of DID models predicting students per classroom teacher and average teacher salaries. Estimates suggest that growth after the Block Grant Bill may have increased student-to-classroom teacher ratios and reduced salaries in rural districts. However, estimates only achieve marginal significance (p < .10) in two models and coefficients do not differ significantly by geography.
DID estimates predicting dropout rates among young men are shown in Appendix Table A15 and suggest that growth after the Block Grant Bill did not significantly influence male dropout rates in either rural or nonrural districts. However, estimates are consistently positive in rural districts and negative in nonrural districts. Students with lower achievement are more likely to drop out of school (Glennie et al., 1970; Rumberger, 2013), but these results suggest that the main analyses do not underestimate the negative effects of block grant funding cuts on achievement in rural or nonrural areas due to an increase in dropout rates. Similarly, DID estimates predicting attendance rates (shown in Appendix Table A16) are consistently negative in rural areas and positive in nonrural areas but do not achieve statistical significance. These estimates differ by geography in the full model (p < .10). These results suggest that effects on achievement are not driven primarily by attendance rates.
Sensitivity Analyses
A series of sensitivity analyses assess robustness of the results. First, I exclude district-year observations with outlying achievement scores (three times the interquartile range beyond the 25th or 75th percentiles). This excludes zero observations in the between-state analyses and 10 observations in the within-state analyses. Results are nearly identical to the main analyses.
Second, I predict the likelihood that achievement scores fall below the 25th percentile using linear probability DID models. Results in Table A17 show that enrollment growth after the Block Grant Bill increased the likelihood of low achievement scores by 14% to 15% in rural districts (p < .05) but reduced it by 6% to 7% in nonrural districts, where estimates are not significant. The DID coefficients in rural and nonrural districts differ significantly at the 95% level in all models. Between-state analyses predicting whether achievement is below the 25th percentile yield consistent results but estimates do not differ significantly by geography.
Third, Table A18 shows equivalent analyses to those in Table 4 but using three alternative definitions of rural. Results are consistent with the main analyses. Specifically, results suggest that enrollment growth after the Block Grant Bill reduced achievement by 0.13 to 0.24 standard deviation units in rural districts. In nonrural districts, estimates range from +0.05 to +0.12. DID estimates differ by geography at the 90% level in several of these models, particularly in models using the low/high enrollment definition of rural (Panel C). Using alternative definitions of rural in the between-state analyses (not shown) also yield consistent results. The primary measure of rural is preferred because it is more conservative and provides a stronger test of effects in rural districts (due to the smaller sample size). However, consistent evidence using alternative definitions suggests the results are not sensitive to precisely where one places the threshold for rural.
Fourth, alternative state samples are used in the between-state analyses. Appendix Tables A19 and A20 show results when including Kansas and neighboring states (Panel A) and when including all states (Panel B). Results are consistent with the main analyses.
Fifth, the main analyses are repeated when using alternative measures of enrollment growth. Using change in total enrollment in the between-state analyses or change in weighted enrollment in the within-state analyses yields consistent results.
Fifth, placebo tests examine effects 4 and 5 years prior to Block Grant implementation. Results of analyses when assigning artificial dates of the Block Grant 4 years or 5 years before the actual policy are shown in Appendix Tables A21 and A22. These results are not consistent with the main analyses. That is, DID estimates are not significant in any models limited to rural districts and rarely in nonrural districts. DID estimates using a continuous measure of enrollment change (not shown) are not significant at the 95% level. The results of these placebo tests increase confidence in the main analyses.
Conclusion
A recent change by the USDE threatens to reduce funding to more than 800 rural schools (Green, 2020). Given smaller budgets (which dictate lower cash reserve limits) and lower economies of scale, rural districts may be less able to absorb short-term funding cuts and could experience larger achievement declines from revenue reductions than other districts. Leveraging a unique natural experiment, this article uses district-level panel data and difference-in-differences models to compare achievement before and after Kansas transitioned to block grant funding to estimate effects of funding cuts separately in rural and nonrural school districts. Between-state comparisons and within-state comparisons offer complementary identification strategies in which the strengths of one approach help address limitations of the other.
Results suggest education funding cuts have stronger negative implications for achievement in rural districts compared with others. The policy change reduced revenue and spending by similar dollar amounts in rural and nonrural districts, but reductions represent a substantially larger portion of the total budget in rural districts. Thus, the heterogeneous effects on achievement by geography reflect a heterogeneous treatment. Results indicate that revenue and spending reductions have larger implications for achievement when they represent a larger proportion of the total district budget. In this case, funding cuts had larger effects in rural areas not because spending per pupil has a heterogeneous effect on achievement by geography but because the funding cuts were substantially larger in terms of total budget in rural districts (by a factor of four or higher).
An alternative specification that examines variation in block grant effects by a continuous measure of enrollment change also suggests larger negative effects in rural areas, at higher levels of funding cuts. A 1% increase in enrollment after the Block Grant reduced achievement by 0.01 SD units in rural districts but had no effect on achievement in nonrural districts.
Sensitivity analyses suggest results are robust to excluding observations with outlying achievement scores, predicting the likelihood of low achievement (below the 25th percentile), using alternative definitions of rural, and using alternative state samples. Results of placebo tests increase confidence in the analyses. Examining effects on attendance and dropout rates suggests that effects on achievement are not driven primarily by attendance rates and—despite higher dropout rates among low achievers (Glennie et al., 1970; Rumberger, 2013)—are unlikely to underestimate negative effects on achievement due to dropout increases.
Examining effects by subject offers mixed results. Within-state analyses suggest stronger effects of funding cuts for both math and ELA achievement in rural areas. In contrast, estimates predicting ELA achievement do not differ by geography in the between-state analyses. Thus, there is some inconsistent evidence that math achievement in rural areas may be more sensitive to funding reductions than ELA achievement.
Results from between- and within-state analyses are generally consistent, but the mixed results for effects by subject raise some important limitations of the study. First, the rural sample size is relatively small, particularly in the between-state analyses. This could explain why results differ by subject in the between-district analyses. Second, the between-state analyses rely on only 1 year of achievement information after the Block Grant Bill. The larger rural sample in the Kansas data and additional years of data after the Bill make the within-state analyses stronger. Third, the Kansas Department of Education changed assessments over time. To address this concern, between-state analyses use SEDA data that are comparable over time and states and all analyses predict standardized achievement scores and include district fixed effects and time trends. Furthermore, sensitivity analyses estimate the likelihood of low achievement and find consistent results. Fourth, districts were experiencing economic and demographic changes during the period examined, which could bias estimates. However, results are robust to the addition of controls for multiple measures of district demographics that could influence achievement and time-trends in total district population and child poverty rate. These controls help address potential violation of the common trends assumption and address economic and population trends that occurred during the time period examined. Fifth, this study examines districts in Kansas, which represent particular economic, demographic, and policy contexts. The Block Grant Bill provides a unique opportunity to address potentially important unobserved variation between districts and, because districts have limited ability to increase their revenue in other ways, to estimate effects of state funding cuts.
Building on evidence of the consequences of education funding reductions for student outcomes (Jackson et al., 2019; Shores & Steinberg, 2019), results suggest that rural districts may experience stronger negative implications of funding cuts than nonrural districts. The stronger sense of community in rural schools may lead policy makers and community members to expect weaker effects of school funding cuts in rural areas. Results contradict this and suggest that funding cuts have more negative implications for achievement in rural districts because the same dollar reduction represents a larger portion of the total budget in rural districts. Thus, although districts may be able to prevent achievement declines when funding reductions are small (Jackson et al., 2019), results indicate that funding cuts have larger implications for achievement when they represent a larger proportion of the total budget.
Rural and urban areas are highly diverse and increasingly interdependent (Lichter & Brown, 2011), which may reduce differences by geography over time. Nevertheless, results of this study suggest that funding cuts had more negative implications for students in rural districts compared with those in other areas. Approximately half of all U.S. public school districts and about one third of public schools are located in rural areas; these schools enroll about one fifth of public school students, nearly half of whom are low income (National Center for Education Statistics, 2013; Showalter et al., 2017; USDE, 2014). Students from rural schools are less likely to enroll in college immediately after high school (59%) than urban or suburban students (62% and 67%, respectively), and this disadvantage holds even among high-income White students (National Student Clearinghouse, 2016). Thus, funding cuts to rural districts may have negative implications for a substantial proportion of students and districts and could exacerbate geographic inequality in the likelihood of college enrollment.
Footnotes
Appendix
Panel B: Assigning Artificial Block Grant 5 Years Prior to Actual Implementation

| (1) | (2) | (3) | (4) | (5) | (6) | (7) | (8) | |
|---|---|---|---|---|---|---|---|---|
| Achievement (standard deviation units) | ||||||||
| Variables | Rural | Nonrural | ||||||
| Grew 2015–2016 | −1.01**(0.14) | −1.24(1.12) | −1.24(1.11) | −1.14(1.11) | −1.49**(0.08) | 13.78**(4.55) | 12.71*(4.95) | 3.48(5.78) |
| Post–Block Grant Bill (−5 years) | 0.17(0.12) | 0.18(0.12) | 0.18(0.12) | 0.18(0.12) | −0.06(0.08) | −0.04(0.08) | −0.04(0.08) | −0.03(0.08) |
| Grew × Post | −0.09(0.16) | −0.09(0.15) | −0.09(0.15) | −0.10(0.15) | 0.09(0.10) | 0.04(0.10) | 0.04(0.10) | 0.06(0.10) |
| Constant | 38.88(30.95) | 27.71(39.56) | 53.33(312.53) | 92.57(338.60) | −8.20(20.59) | −62.15*(24.04) | 5.78(145.40) | −33.33(147.66) |
| Observations | 760 | 760 | 760 | 760 | 1,491 | 1,491 | 1,491 | 1,491 |
| R 2 | .68 | .69 | .69 | .69 | .76 | .77 | .77 | .77 |
| District Fixed Effects | Y | Y | Y | Y | Y | Y | Y | Y |
| Time Trend | Y | Y | Y | Y | Y | Y | Y | Y |
| Student Demographic Controls | Y | Y | Y | Y | Y | Y | ||
| Total District Population (log) Trend | Y | Y | Y | Y | ||||
| Child Poverty Rate Trend | Y | Y | ||||||
Note. Sample limited to districts with achievement, rural location, and enrollment data. Rural sample is further limited to districts with low population density (<10 people/square mile), and nonrural sample is limited to those with higher population density. Models 2 to 4 and 6 to 8 include controls for district demographics: % Black students, % Hispanic students, % free/reduced-price lunch eligibility, % special education students, child poverty rate, total district population (log). Models 3, 4, 6, and 7 add time trends of total district population (log) and child poverty rate. Robust standard errors adjusted for district clustering in parentheses. Difference-in-differences coefficients in no models differ significantly by geography at the 95% (Paternoster et al., 1998). Data from Kansas State Department of Education, 2010–2018; Kansas Policy Institute, 2010–2018; U.S. Department of Education, 2018.
p < .1. *p < .05. **p < .01.
Acknowledgements
The author is grateful for feedback from Richard Murnane and anonymous reviewers. This research was supported by the William T. Grant Foundation (#187417), the Spencer Foundation/National Academy of Education, and by a grant from the American Educational Research Association which receives funds for its “AERA Grants Program” from the National Science Foundation under NSF Grant #DRL-1749275. Opinions reflect those of the author and do not necessarily reflect those of the granting agencies.
Notes
Author
EMILY RAUSCHER is an associate professor in the Sociology Department at Brown University and faculty affiliate of the Population Studies and Training Center and the Annenberg Institute for School Reform. Rauscher studies the relationship between education and inequality, focusing on specific policies that can increase equality of opportunity by race and socioeconomic status.