
Abstract
Tax increment financing (TIF)—an economic (re)development tool originally designed for urban cities—has been available to rural communities for decades. This is the first study to focus solely on TIF in rural school districts, to examine TIF effects on school districts’ property tax base and rates, and to conduct event-study estimations of TIF effects. The study finds that TIF has mostly positive effects on rural school districts’ property tax base and mixed effects on property tax rates, and that TIF-induced increases in tax base come primarily from residential property and slightly from commercial property. The study’s findings assert the importance of returned excess increment if rural school districts in Iowa and many other states are to benefit from TIF.
Introduction
Tax increment financing (TIF) is a popular urban renewal and economic development tool, especially in Midwestern states. First implemented in 1952 in California, TIF has since been enabled in all states but Arizona. Under TIF, local governments (municipalities or counties) fund development projects within a designated district through property taxes generated from that district over a multiyear period. Originally intended to address urban blight, TIF may have substantial fiscal impacts on rural school finance; for example, rural school districts may not access taxes on properties in TIF areas within their boundaries during the TIF duration. In fact, TIF is frequently used by rural local governments. For example, given the U.S. Census Bureau’s definition of rural (areas with less than 2,500 people), rural municipalities initiated 19% and 35% of active TIF districts in Michigan and Illinois, respectively, in 2018 (Illinois Department of Revenue, 2020; Michigan Department of Treasury, 2018). Wisconsin’s proportion of rural TIF districts is even higher, at 52% in 2020 (Wisconsin Department of Revenue, 2020). In Iowa, where incorporated cities have TIF-initiating power, 490 out of 947 (52%) incorporated cities contain fewer than 500 residents; in fact, 431 rural cities used TIF between fiscal years (FYs) 2001 and 2017. 1 Despite the considerable use of TIF in rural communities, no study in either education finance or TIF literature has yet examined TIF’s effects on rural school finance.
Specifically, this study aims to investigate the effects of TIF on the property tax base and rates of rural school districts. As the state with the highest number of TIF districts (Merriman, 2018), Iowa is an ideal focus for this study. By 2017, 83% of Iowa rural school districts contained multiple TIF areas initiated in different years. In conjunction with the availability of detailed multiyear TIF-related data, this intensity of TIF use and differential adoption timing allow the within- and cross-school district variation needed for empirical estimations of fiscal effects.
TIF is controversial because it brings both fiscal benefits and losses to school districts. Two extant studies explore TIF effects on Iowa school districts’ expenditures and property tax levy (Nguyen-Hoang, 2014, 2021). This study complements these studies with three unique contributions. First, as the call for this special issue indicates, rural school districts—which serve more students than Chicago, Los Angeles, and New York schools combined—receive scant attention in policy research. This study is the first in TIF literature to focus solely on rural school districts, removing the influence of urban school districts, which tend to contain larger TIF districts. Second, this study is the first to examine TIF effects on school districts’ property tax base and rates, subjects of relevance to education policy makers and stakeholders. Specifically, within-district property values are a key determinant of education aid in 42 states, including Iowa (FundEd, 2020). School districts also use property tax base to set property tax rates for residents. Third, this is the first TIF study to employ an event-study design, which allows for TIF effects to vary annually and for nonparametric tests of common pre-TIF trends—a key assumption for causal inference.
Using data from FY2001 to FY2017 in Iowa, this study answers the following three research questions. First, how does TIF use affect rural school districts’ total property tax base and rates? Second, what differential effects does TIF use have on major property classes, namely residential, commercial, industrial, and agricultural classes? Third, given findings on the first question, how do rural school districts adjust property tax rates in response to TIF-induced changes in property tax base?
The article proceeds as follows. The next section reviews related TIF literature, followed by a background section on TIF function in Iowa and its potential effects on rural school districts’ property tax base and rates. The fourth section describes the empirical strategy; the fifth describes the data assembly and summary statistics. Section six discusses the estimation results. Finally, the article concludes with policy implications and a suggestion for future research.
Related Literature on TIF
The literature on TIF—a substantial and growing field—can be categorized into four groups. 2 Two bear closely on this study. One of these examines TIF’s effects on property values within and outside TIF districts. He and Azizi (2019) find that parcels within TIF districts in Indiana sell at higher prices than those outside of TIF districts; similarly, Yadavalli and Landers (2017) find positive effects for properties in TIF areas. A TIF district’s property value growth can depend on types of municipal expenditures within the district (Kane & Weber, 2016), as well as the district’s spatial and demographic characteristics (Byrne, 2006; Larnell & Downey, 2019). Value growth may also vary depending on the TIF district type (e.g., commercial, industrial; Byrne, 2006; Weber et al., 2003). Private and public investment as well as institutional and operational knowledge (proxied by density and age of TIF districts) can have a positive impact on property value (Bland & Overton, 2016). Nguyen-Hoang (2021) finds that TIF districts in Iowa are likely to generate fiscal benefits for affected entities, including school districts. The TIF-induced benefits for school districts’ general funds are likely small, ranging from −0.3% to 3.6% of their total non-TIF property tax levy. Nguyen-Hoang’s (2021) simulations also show that TIF-induced benefits account for 5.8% to 11.8% of the school districts’ total non-TIF property tax levy for capital purposes.
Another group of studies examines whether TIF affects school district finance, including expenditures and revenues. Without accounting for counterfactual scenarios, Lehnen and Johnson (2001) find that TIF did not induce major property tax revenue losses for most school districts in Indiana in 1995. Weber et al. (2008) find little effect of TIF on school revenues across all Illinois districts. This finding contradicts Weber (2003), in which TIF intensity has a significant inverse relationship with property tax revenues of school districts in Cook County, Illinois. Using data on all Iowa school districts, Nguyen-Hoang (2014) finds that TIF use is associated with lower education expenditures. However, this negative effect is small: A 1% increase in total incremental value is associated with a reduction of 0.0018% in operating expenditures. In addition, Nguyen-Hoang (2014) finds that expired TIF districts have no significant effect on education expenditures. Without estimating effects on property tax base, Skidmore and Kashian (2010) find that in its duration, Wisconsin TIF is associated with an increase in the combined property tax rates of all nonmunicipal overlying jurisdictions including school districts; however, they also find that these rates decrease when TIF districts terminate.
Thus far, no existing study on TIF has explored how TIF affects rural school districts’ property tax base and rates—a literature gap that this study seeks to fill.
Background
How Does TIF Work in Iowa?
While TIF law varies by state (Kriz & Johnson, 2019), its framework in Iowa nevertheless resembles TIF in many other states. Counties and incorporated cities (hereinafter referred to as TIF authorities) have TIF-initiating authority. 3 They can establish one or more TIF districts to cover any major property class. 4 At outset, two important aspects of the district must be established: base year and original base value (OBV). The TIF district’s base year is the year that immediately precedes either (1) the TIF authority’s certification of TIF debts to the county auditor or (2) the effective date of the ordinance establishing a TIF area (Duster, 2016). 5 In the second case, it may take years before a TIF-financed development activity occurs and, thus, generates incremental value. OBV is the total assessed value of properties within the TIF district in the base year.
TIF-financed development projects occur, leading to the TIF district’s higher property assessed value (AV) and thus to incremental value, I. (To correctly time the effects of I on property tax base in this study, a TIF district is considered active beginning in the first year of positive incremental value, I > 0.) During TIF, AV is assessed annually to calculate annual base value (ABV), which is available to rural school districts for property taxes (ABV = AV − I, as shown in Figure 1, and 0 ≤ ABV ≤ OBV). (The online Supplemental Appendix provides examples on how ABV and I are determined.) The TIF fund is derived by multiplying I with a composite rate comprising property tax rates of all overlapping or affected entities—such as counties, cities, school districts, community colleges, county hospitals, agricultural extension districts, and county assessors—that had taxing power over the TIF district in the base year. This TIF fund can be used to provide rebates or upfront cash to contracted developers for project costs incurred within the TIF district. Alternately, the TIF authority can use the fund to pay for bonds issued to finance TIF projects. When the TIF district is permanently dissolved, incremental value becomes available for affected entities.
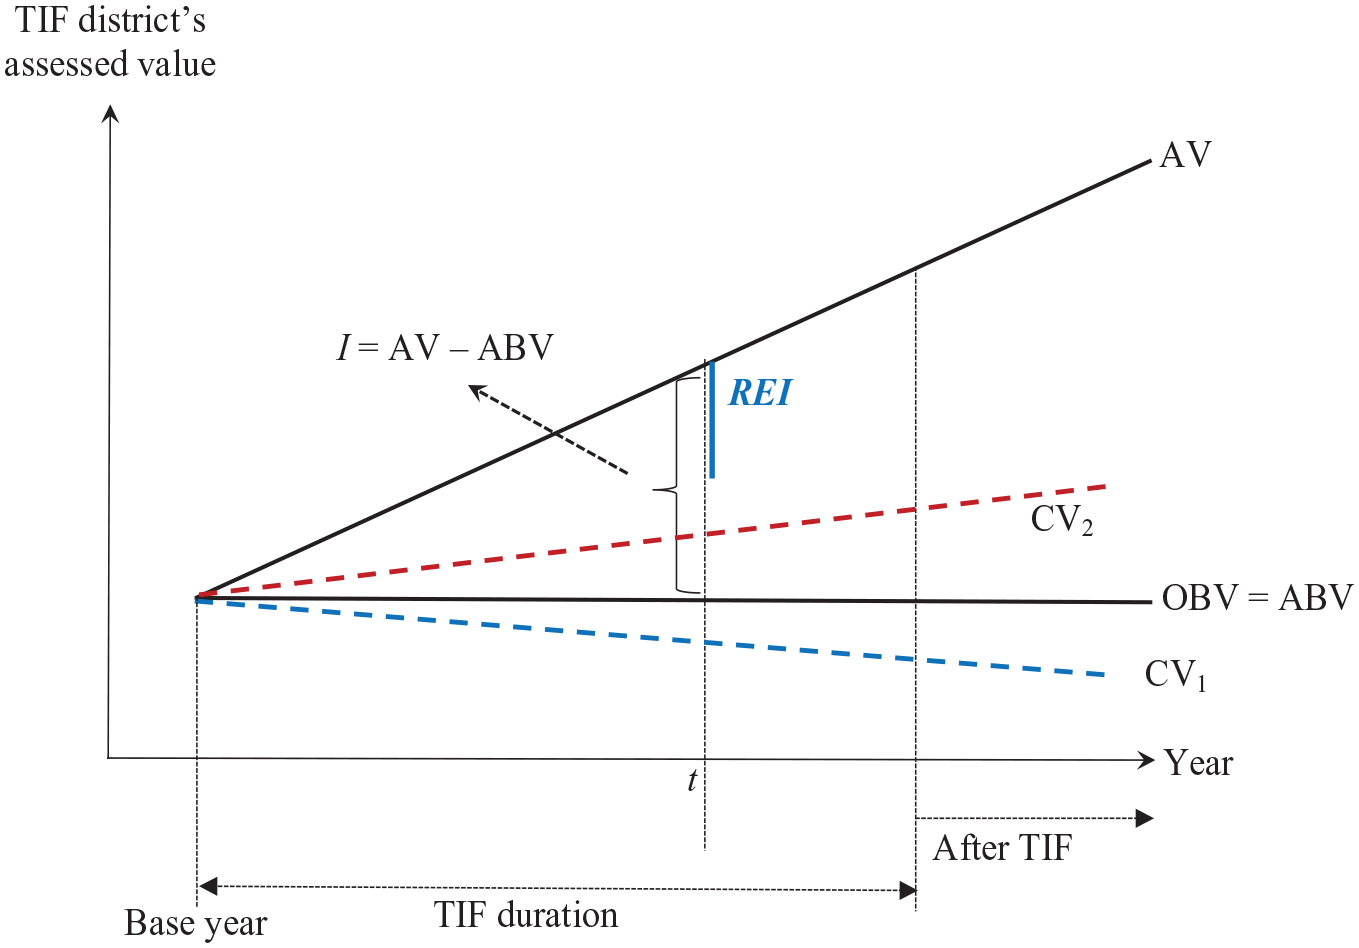
Tax increment financing (TIF) function in Iowa.
There are three major types of TIF districts in Iowa: slum/blighted, economic development, and slum/blighted–economic development districts. No maximum duration restricts TIF districts established before 1995; however, starting in 1995, economic development-only districts have a maximum duration of 20 years. In addition, the duration of economic development TIF districts for public improvements related to residential housing is 10 years for municipalities with a population of 15,000 or more, and 15 years for those under 15,000 population. As with many other states, Iowa does not require a minimum duration for any TIF district type. Before a TIF district expires or permanently dissolves, TIF authorities may choose to amend it by adding additional properties to the district; however, an amendment does not extend the district’s original maximum duration.
How Could TIF Affect Rural School Districts’ Property Tax Base and Rates?
Effects on rural school districts’ property tax base may differ during and after TIF. In its duration, TIF can exert observable and unobservable fiscal effects on school districts’ property tax base. Observable fiscal effects may be positive or negative; we begin with the negative. In most states, a TIF district’s original base value, OBV, is fixed and annually available for school districts to access throughout the TIF district’s duration. In Iowa and several other states, school districts annually access a TIF district’s base value, which is calculated in a variety of methods and may be lower than OBV. For example, Davis (1989) explicates how school districts in Illinois access smaller bases when the optional parcel method is used (instead of the standard aggregate method) to compute increments. Similarly, an Iowa TIF district’s base value, which affected entities can tap annually, may vary from year to year, possibly falling below OBV and even reaching zero. A zero-valued base leaves a school district with no revenue from the TIF district. The online Supplemental Appendix further elaborates how TIF may negatively affect ABV.
As detailed in discussion of a table later in text, annual instances of ABV < OBV occur in relatively high frequency. However, for the average rural school district, OBV is equivalent to 3% of its total taxable non-TIF property value in the year of TIF establishment; by contrast, this figure is 15.5% for Iowa’s average urban school district. Therefore, this negative TIF effect is expected to be smaller for Iowa’s rural school districts than for their urban counterparts.
A potential observable benefit during TIF is the return of excess increments for school districts’ operating purposes. Excess increments are surplus incremental value that a TIF authority does not need for payment of TIF debts in a year. According to Iowa Code §403.6, TIF authorities can invest excess increments either in a reserve fund or in “property or securities in which a state bank may legally invest funds subject to its control.” Alternately, they can choose to release excess increments for school districts to tap for their general funds. In contrast to TIF laws elsewhere, Iowa school districts access the entire incremental value, I, during TIF life to pay for nongeneral fund expenditures, namely, instructional support programs (ISP; since FY2013) and capital projects funded by bonded debt (since 1969) or by physical plant and equipment levy (PPEL; since FY2002).
TIF projects in rural and sparsely populated areas on average tend to be smaller than those in large urban cities, making incremental value and its associated release more modest. In Iowa, the average incremental value represents 9.7% of rural school districts’ total non-TIF taxable property value (V); by contrast, this figure is 15.4% for urban districts. During FY2001 to FY2017, the average incremental value and returned excess increment for Iowa rural school districts were about 20% and 30%, respectively, of those of urban districts. However, TIF authorities returned on average a larger share of incremental value to rural school districts than to their urban peers (38% vs. 26%).
Unobservable effects on a school district’s property tax base mark the difference between what occurred with TIF and what would have occurred absent TIF, that is, in a counterfactual scenario. Because TIF can affect property values both within and outside a TIF area, we examine the counterfactual values of properties inside and outside a TIF district to understand potential unobservable effects. A school district loses nothing (or even benefits) from TIF if the property value of the TIF district would have remained static (or declined) absent TIF; in other words, the TIF district’s property value would not have increased but for TIF funding. In many states, TIF projects must satisfy this but-for condition to proceed. In practical terms, the but-for condition is met when TIF money is the only available source to fill a development project’s financing gap, all other sources of private funds having been exhausted. This is often the case for TIF development projects in slum/blighted areas, the value of which would likely trend downward absent TIF, a counterfactual scenario represented in Figure 1 by CV1. Indeed, rural school districts’ property tax base benefits from TIF (= ABV − CV1) in slum/blighted areas. However, Iowa does not require but-for or blight finding as a condition for TIF use, suggesting that its nonnegative effect on rural school districts’ property tax base cannot be assumed.
Unsurprisingly, the but-for condition often goes unmet in TIF projects in rural Iowa, that is, property value within the TIF district would have increased even without TIF funding, a scenario represented by the red dashed line CV2. The value of nonblighted districts increases with natural appreciation, and small improvements to existing property. What is more, unlike urban cities with staff to conduct financial-gap due diligence on TIF applications (City of Iowa City, 2020), rural towns tend to have limited financing resources for economic development and inadequate human capacity to properly screen a TIF project’s financing gap. Rural towns may thus hastily approve TIF incentives for projects that could have proceeded anyway sooner or later.
TIF may have spillover effects that help or hurt neighboring non-TIF properties within a school district’s boundary, depending on the value of these properties absent TIF. On the one hand, non-TIF properties would appreciate at a faster pace absent TIF. This counterfactual scenario suggests that TIF generates a negative dampening effect on rural school districts’ property tax base. On the other hand, TIF-funded projects catalyze a greater value growth for nearby non-TIF properties, thereby benefiting rural school districts. Given that TIF projects in rural areas are smaller than in urban cities, any TIF-induced spillover effect on rural school districts is likely to be smaller and to manifest more gradually than for urban peers.
During-TIF net total effect on rural school districts’ property tax base depends on annual base values, counterfactual absent-TIF values of the TIF district and of properties in nearby non-TIF areas, and especially incremental value when it is released (partially or entirely) for general funds or when it is fully available for debt service, PPEL, and ISP (as in Iowa).
In addition, TIF may have fiscal effects after termination. When a TIF district with incremental value permanently dissolves, the TIF district will release its entire prior-year incremental value, P, to all affected entities including its associated school district, which may use the funds for both operating and capital purposes. Current ABV of the dissolved TIF district also becomes available to its school district. Proponents of TIF tend to claim that a post-TIF increase in affected entities’ property tax base is a major benefit from TIF; a counterargument is that this increase would have occurred absent TIF. Ultimately, post-TIF fiscal impact boils down to the difference between the value released and the possible increase in value for school districts absent TIF.
School districts use property tax base to set property tax rates. All else being equal, a higher TIF-induced property tax base, as reported later, may induce them to provide relief for residents by reducing property tax rates (Kenyon et al., 2020). Alternatively, school districts may not adjust property tax rates. We let the data speak as to how rural school districts in Iowa set tax rates in response to TIF-induced changes in property tax base.
Empirical Strategies
Method
The unit of analysis is rural school districts. 6 This study adopts a difference-in-differences (DID) estimation approach complemented by an event-study design. For estimation purposes, rural school districts with no TIF districts during the entire sample period provide a counterfactual property tax base trend for rural TIF school districts with at least 1 year of active TIF during the sample period. Because the timing of TIF adoption varies by school district, non-TIF years of later adopters also serve as counterfactuals for early adopters’ TIF years. To answer the first research question, the first dependent variable is a rural school district’s total non-TIF taxable property value, V. Specifically, V includes value outside TIF areas and any within-TIF annual base values available to the school district, but excludes incremental value and returned excess increments (whose inclusion will be discussed later).
Now let V be a function of measures of TIF use, trend variables, and other control factors (C). This function is represented by Equation (1):

where i and t index school districts and years,
Vector C in Equation (1) represents control variables indicating characteristics of a school district’s student body: enrollment, percent of free and reduced-priced lunch students, percent of English Language Learner (ELL) students, and percent of African American students. These variables serve as a proxy for changes in population and demand for schooling that may affect rural school districts’ property values. Together with year and school district fixed effects, variables in C control for confounding factors influencing TIF’s estimated effects.
Equation (1) also includes two trend variables, TPre and TPost. Following Lafortune et al. (2018), TPre captures the pre-TIF value trend and equals (t − t0), where t0 is the base year in the sample period immediately before a school district has the first active TIF (I > 0) district. TPre equals 0 for t0 and is negative for t < t0. TPost reflects the value trend during TIF years and equals (t − t0) when t > t0, and 0 otherwise. Both trend variables equal 0 for non-TIF rural school districts for the entire sample period. An insignificant coefficient of TPre indicates that TIF and non-TIF school districts have a similar pre-TIF value trend.
One might be concerned over potential endogeneity of TIF measures in Equation (1). The extent of endogeneity in this study is minimal for two reasons. First, while school districts may opt out of a TIF process in some states (e.g., Pennsylvania and Texas) and are barred from participation in others (e.g., Florida and New York), participation is compulsory for Iowa school districts. Second, an Iowa school district typically does not share borders with TIF authorities (cities and counties); it straddles multiple TIF authorities and vice versa. Therefore, designated TIF districts most likely have little correlation with rural school districts’ total property tax base.
Despite these reasons, one might argue that potential endogeneity still lingers if non-TIF and TIF school districts have differential growth trajectories of property tax base—a violation of a common pretrend assumption. 7 The results would be biased upward (or overestimated) if the tax base of TIF school districts had a higher pre-TIF growth trend (and by extrapolation, a higher counterfactual growth trend in TIF years) than that of non-TIF school districts. The TPre variable in the DID design of Equation (1) detects linear pre-TIF differential property tax base growth trends between two school district groups. An event-study estimation design provides additional nonparametric (i.e., annually varying) tests on potential pretrend differentials, as represented by Equation (2):
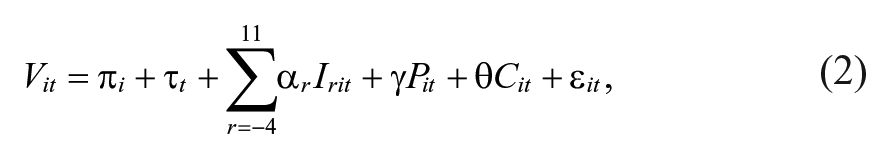
where r indicates the number of years before (r < 0) or after (r > 0) the base year, t0. For TIF school districts, Ir > 0 equals I when t = t0 + r and 0 otherwise; Ir ≤ 0 equals 1 when t = t0 + r and 0 otherwise. Ir equals 0 in all years for non-TIF school districts. For parsimony, r is truncated between −4 and 11, where −4 represents 4 or more years before the base year, and 11 represents 11 or more years after the base year.
8
As suggested by Sandler and Sandler (2014), I0 is also included because the series of Ir vary in size across school districts and over time (i.e., there is no dummy variable trap). When r ≤ 0, each coefficient for Ir,
We conduct two robustness tests. Two thirds of TIF school districts seem to have the first active TIF districts before 2001—the first year of the sample period. These school districts have the first positive incremental value in 2001 and contain TIF districts with base years before 2000. As a previous discussion of the two options for establishing a TIF district’s base year suggests, a prior-2000 base year, especially for TIF districts established via Option 2, is not necessarily the year immediately before the first positive incremental value I is recorded in a rural school district. Given this uncertainty, 2001 is treated as r = 1 in Equation (2) for these school districts, which are hereinafter referred to as the earlier group. The remaining 72 TIF school districts (one third of the total, referred to as the later group) contain TIF districts that have the first positive I in 2001 or later and a base year in 2000 or later. (Only four TIF districts experience the first year with I > 0 in 2001.) For the first robustness test, to determine whether TIF has differential effects on these two school district groups, we include a separate set of Ps and Irs (when r > 0) in Equation (2). 9 Because t0 probably falls outside the sample period of all school districts in the earlier group, the inclusion of this group is not consistent with traditional DID and event-study designs. We exclude the earlier group and keep only the later group and non-TIF rural school districts for the second robustness test.
The dependent variable V does not include returned excess incremental value (IE) or incremental value (I). As discussed earlier, TIF districts may voluntarily return none, part, or all of I for rural school districts’ general (or operating) funds, that is, 0 ≤ IE ≤ I. Iowa school districts access I in its entirety for ISP and capital purposes (debt service and PPEL). To isolate the effects of IE and I on operating and capital purposes, two additional dependent variables are used in Equations (1) and (2): total operating taxable value (VG) and total capital taxable value (VC), where VG = V + IE and VC = V + I. Unlike other sources of TIF fiscal benefits or losses, IE and I have a dollar-for-dollar relationship with total taxable property value. In both equations, differences in the key coefficients of I and Ir > 0, using either VG or V as the dependent variable, capture how much IE, on average, becomes available for school districts’ operating funds per dollar increase in I. Because I is fully available to school districts for capital projects, the key coefficients estimated with VC are expected to be exactly one dollar larger than those estimated with V. Despite this expected increase, the coefficients of I and Ir > 0 in estimations with V and VC have varying levels of statistical significance; results for both estimations are thus reported.
We use Equation (2) for the second and third research questions. For the second question, the equation is estimated with four other dependent variables: non-TIF taxable values for residential, commercial, industrial, and agricultural properties. These four property classes on average represent 95% of total rural school district tax base. 10 Because no data on I and IE by property class are available, this question focuses on VG, that is, these four dependent variables already include returned excess increments. To answer the third research question, we use property tax rates for operating and capital improvement purposes as dependent variables. As indicated earlier, school districts set these tax rates after taking into account other revenues, mostly intergovernmental aid. Therefore, C in these property tax rate estimations includes state and federal aid to rural school districts.
Data and Descriptive Analyses
Data Assembly
This study follows the classification of school district rurality reported in the Common Core Data’s School District Universe Survey Data. Rural school districts are categorized as fringe, distant, or remote, depending on their distance from an urban area (da) or an urban cluster (dc) (Geverdt, 2017). 11 The data set for this study consists of all three types of Iowa rural school districts (267), excluding the remaining nonrural districts (66). Of these 267 rural school districts, 45 did not have any TIF during the sample period.
This study employs data provided by the Iowa Department of Management (IDOM) and Iowa Department of Education (IDOE). Data on each school district’s enrollment, student characteristics, and intergovernmental aid are available at the IDOE’s website (educateiowa.gov). The entire state of Iowa is divided into tax districts, including TIF districts. Data on each tax district’s assessed and taxable value as well as its association with all taxing jurisdictions (e.g., cities, counties, school districts) between FY2002 and FY2017 are available at data.iowa.gov. Staff from the IDOM supplemented the same data for FY2001. They also provided additional data on each TIF district’s base year, original base value, annual incremental value, and returned excess increments, as well as on each school district’s taxable property value (total and by property class) and property tax rates for operating and capital purposes.
A variable of interest is the prior-year incremental value of discontinued TIF districts, P. During its life, each TIF district is associated with a unique numerical identifier. This identifier discontinues when the district is either permanently dissolved or amended; an amended TIF district receives a new identifier (Johnson, 2017). However, only in cases of permanent dissolutions do school districts receive prior-year taxable incremental property value released by the TIF district. Unfortunately, extant TIF data do not indicate why specific TIF districts (as denoted by their identifiers) discontinue; in particular, the lack of shapefiles or maps reflecting changes in TIF district boundaries over the sample period is regrettable.
Finally, operating property tax rates include rates for general fund and ISP. The ISP levy supplements a school district’s main general fund levy and can be used for any general-fund purpose. 12 Property tax rates for capital projects include rates for PPEL and debt service. 13 Property tax rates are per $1,000 of taxable property value and apply uniformly to all property classes. School districts set general fund, ISP, debt service, and PPEL property tax rates annually.
Descriptive Statistics
Table 1 provides summary statistics of key variables used in estimations. The table shows that the mean total non-TIF taxable property value, V, is $180.1 million. The average returned excess increment (IE) and incremental value (I) are $6.7 million and $17.4 million, adding to the average VG and VC of $186.8 million and $197.5 million, respectively. In other words, rural school districts’ mean IE and I represent 3.7% and 9.7% of the mean V, respectively. The mean I among all rural TIF school districts increases over time from $11.8 million in Year 1 (1 year after t0) to $37.3 million in Year 11 and later.
Summary Statistics for Rural School Districts 2001–2017

Note. There are 4,369 observations. Data on dependent and independent variables are from the Iowa Department of Management; data on control variables are from the Iowa Department of Education. TIF = tax increment financing; ELL = English language learner.
In millions of dollars. bValues are in 2017 dollars. The inflation adjustment uses the All Transactions House Price Index for Iowa (U.S. Federal Housing Finance Agency, 2020). This index is derived from both urban and rural transactions. A study, however, finds that housing appreciation rates in rural and urban areas in Iowa in the first 5 years of the 2000s are similar (U.S. Federal Housing Finance Agency, n.d.). The index does not include commercial and industrial property transactions. Despite its weaknesses, this index is the best real estate price level indicator available for Iowa. The two property tax rates are expressed in dollars per $1,000 of taxable property value and adjusted for inflation given that all key variables in dollar terms are already in real dollars. Using unadjusted property tax rates while other variables are in real value changes the results negligibly.
Of the total VG, agricultural property accounts for 45.2%, followed by residential (36.5%), commercial (9.5%), and industrial (3%). This property composition of rural school districts is substantially different from that of urban school districts: residential (55.6%), commercial (29.1%), agricultural (8.7%), and industrial (4.3%).
The mean property tax rate for capital projects is only 15% that of operating purposes ($2.1 vs. $14 per $1,000 of taxable property value). The mean rural school district in the sample has a total enrollment of 644. In 2001, non-TIF rural school districts are on average smaller than TIF rural school districts in enrollment (413 vs. 704) and V ($125 million vs. $196 million). 14 The mean base years are 1992 and 2007 for the earlier and later groups of TIF rural school districts, respectively. The mean VG is slightly smaller for the later group than for the earlier group (e.g., $223 million vs. $244 million in Year 11 and onward). Given later TIF implementation, the later group’s mean I is expectedly lower than the earlier group’s ($4.7 million vs. $15.3 million in Year 1 and $12.7 million vs. $40.7 million in Year 11 and onward).
Earlier discussions indicate two opposing observable effects during TIF life: lower-than-OBV (or depressed) annual base values and release of excess increments. Table 2 documents the extent of these two effects. Column 2 shows that in the first 5 years of the sample period, the share of TIF districts with zero ABVs is small, equal to or less than one fifth of all TIF districts within rural school districts. This share starts to increase, mostly to one quarter or higher, over the next 8 years. This makes sense; a TIF district’s ABV falls with incremental value, which increases over time. In 2015 to 2017, when rollback factor reductions are in place, the share of zero-ABV TIF districts jumps to as high as 50%. (Discussion of rollback factors, as well as the relationship between ABV and incremental value over time, is elaborated in the online appendix.) As shown in Columns 2 and 3, approximately 92% of TIF districts leave either nothing or depressed ABVs for rural school districts during FY2015 to FY2017.
Distribution of TIF Districts Associated With Rural School Districts Over the Sample Period
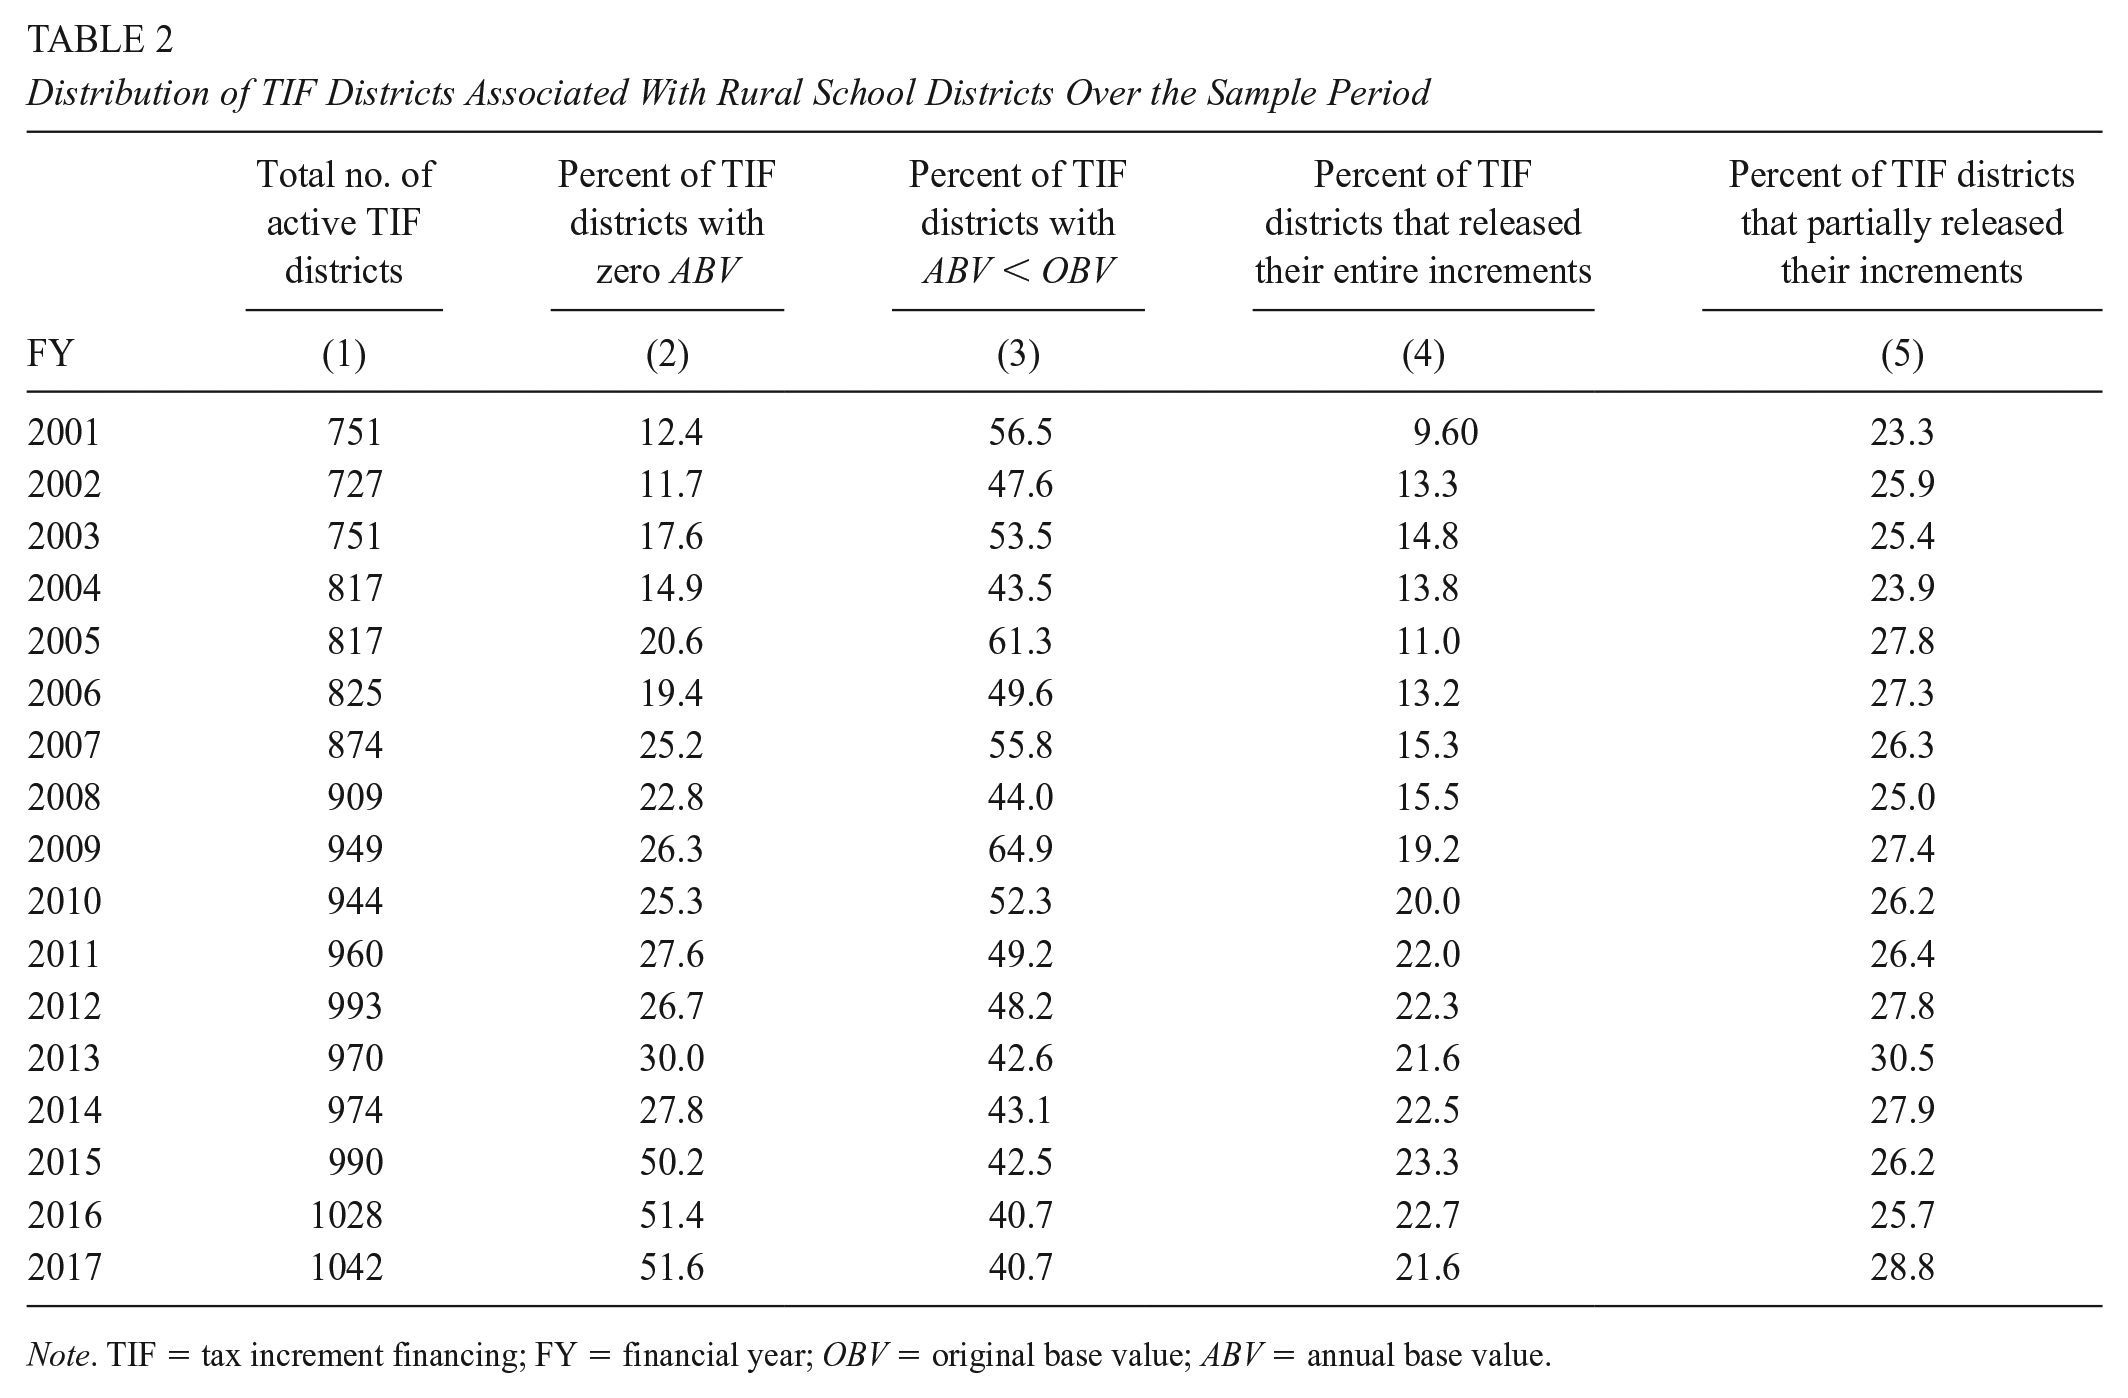
Note. TIF = tax increment financing; FY = financial year; OBV = original base value; ABV = annual base value.
While the above indicates a harmful fiscal TIF effect, the last two columns of Table 2 show the relative frequency of the observable beneficial effect during TIF life. Between 2010 and 2017, at least one fifth of all rural TIF districts returned their entire excess increments (Column 4). Given the partial returns noted in Column 5, between 46% and 52% of TIF districts released either a portion or all of their increments during this period. Because incremental value increases over time, so do released excess increments.
Results
Main Results
Table 3 reports the DID results for the first research question. As shown in Column 1, TIF induces a positive, though not statistically significant, effect on total non-TIF taxable property value (V). This finding suggests that TIF-induced benefits from positive spillover effects and reversed declining value trends in slum/blighted areas more than offset depressed ABVs, negative spillover effects, and nonattributable counterfactual value losses, leaving rural school districts’ operating funds unaffected. Column 2 shows that total operating taxable value, VG, increases by $0.57 for every dollar increase in incremental value, I. On average, half of this increase comes from returned excess increment ($0.57 − $0.28 [Column 1] = $0.29). In other words, TIF authorities release $0.29 for every dollar of I. As expected, the coefficient of I increases by exactly one dollar in Column 3, where total capital taxable value, VC, is the dependent variable. An increase of $1.28 in VC is associated with a dollar increase in I.
Difference-in-Differences Results

Note. There are 4,369 observations for Columns 1 to 6 and 1,791 observations for Columns 7 to 9. The dependent variables are rural school districts’ total non-TIF property taxable value (V), total operating taxable value (VG), and total capital taxable value (VC). These results are estimated with year and school district fixed effects as well as all control variables (except for intergovernmental aid variables) reported in Table 2. The dependent and monetary independent variables (I and P) are in millions of 2017 dollars. Robust standard errors clustered at the school district level are reported in parentheses. When estimated without the trend variables or control variables, the remaining key variables are similar to those reported in this table; for parsimony, these results are not reported. TIF = tax increment financing.
p < .05. **p < .01.
The other variable measuring TIF activity, the number of active TIF districts (N), is not statistically significant in any column in Table 3, confirming the prediction that I better measures TIF-induced fiscal effects, picking up most effects on rural school districts’ property tax base. Two other variables, namely prior-year incremental value of discontinued TIF districts (P) and number of discontinued TIF districts (ND), are not statistically significant in Columns 4 to 6. 15 This finding is consistent with Nguyen-Hoang’s (2014) finding that expired (discontinued) TIF districts have little effect on education expenditures. A plausible explanation for the insignificant effect of discontinued TIF districts found in this study and Nguyen-Hoang (2014) is that districts discontinued by amendment may dilute the effect of those discontinued by permanent termination.
Columns 7 to 9 of Table 3 report the results of a robustness test on V, with VG and VC obtained by excluding school districts with active TIF prior to 2001 (the earlier group). The size and statistical significance of the effects of I on V and VC in Columns 7 and 9 are almost identical to those of the full sample (Columns 4 and 6). The effect of I on VG in Column 8 is 30% larger than that obtained from the full sample in Column 5, suggesting that more recent TIF districts release a higher proportion of each dollar of incremental value. In addition, the coefficient of P becomes significant and identical in size across Columns 7 to 9; operating- and capital-purpose property tax bases increase by $1.3 for every dollar increase in P, $0.3 of which is likely due to the associated release of depressed ABV. As with posttrend variable TPost, pretrend TPre is not significant in Table 3, suggesting a common pretrend between TIF and non-TIF school districts. Overall, the DID results in Table 3 show positive TIF effects on rural school districts’ property tax bases.
Table 4 reports TIF’s annually varying effects under the event-study framework. Column 1 shows that following the base year (t0), TIF induces negative effects on V in most years (1–10); these effects are statistically significant in Years 1 to 6. A dollar increase in I is associated with a decrease of $0.31 to $0.37 in V. Given the increasing I, TIF effects are larger in absolute value over time: The mean TIF school district’s V decreases by $3.6 million in Year 1, continuing to decrease by $6.0 million (3.1% of the mean V) in Year 4 and $6.9 million in Year 6, suggesting that in addition to depressed ABV, within-TIF counterfactual value losses could be at play. 16 The coefficient of I becomes smaller in absolute value starting in Year 7 and turns positive (still insignificant) in Year 11 and later. The reversed trend in V may come from positive spillovers, which take time to manifest.
Main Event-Study Results
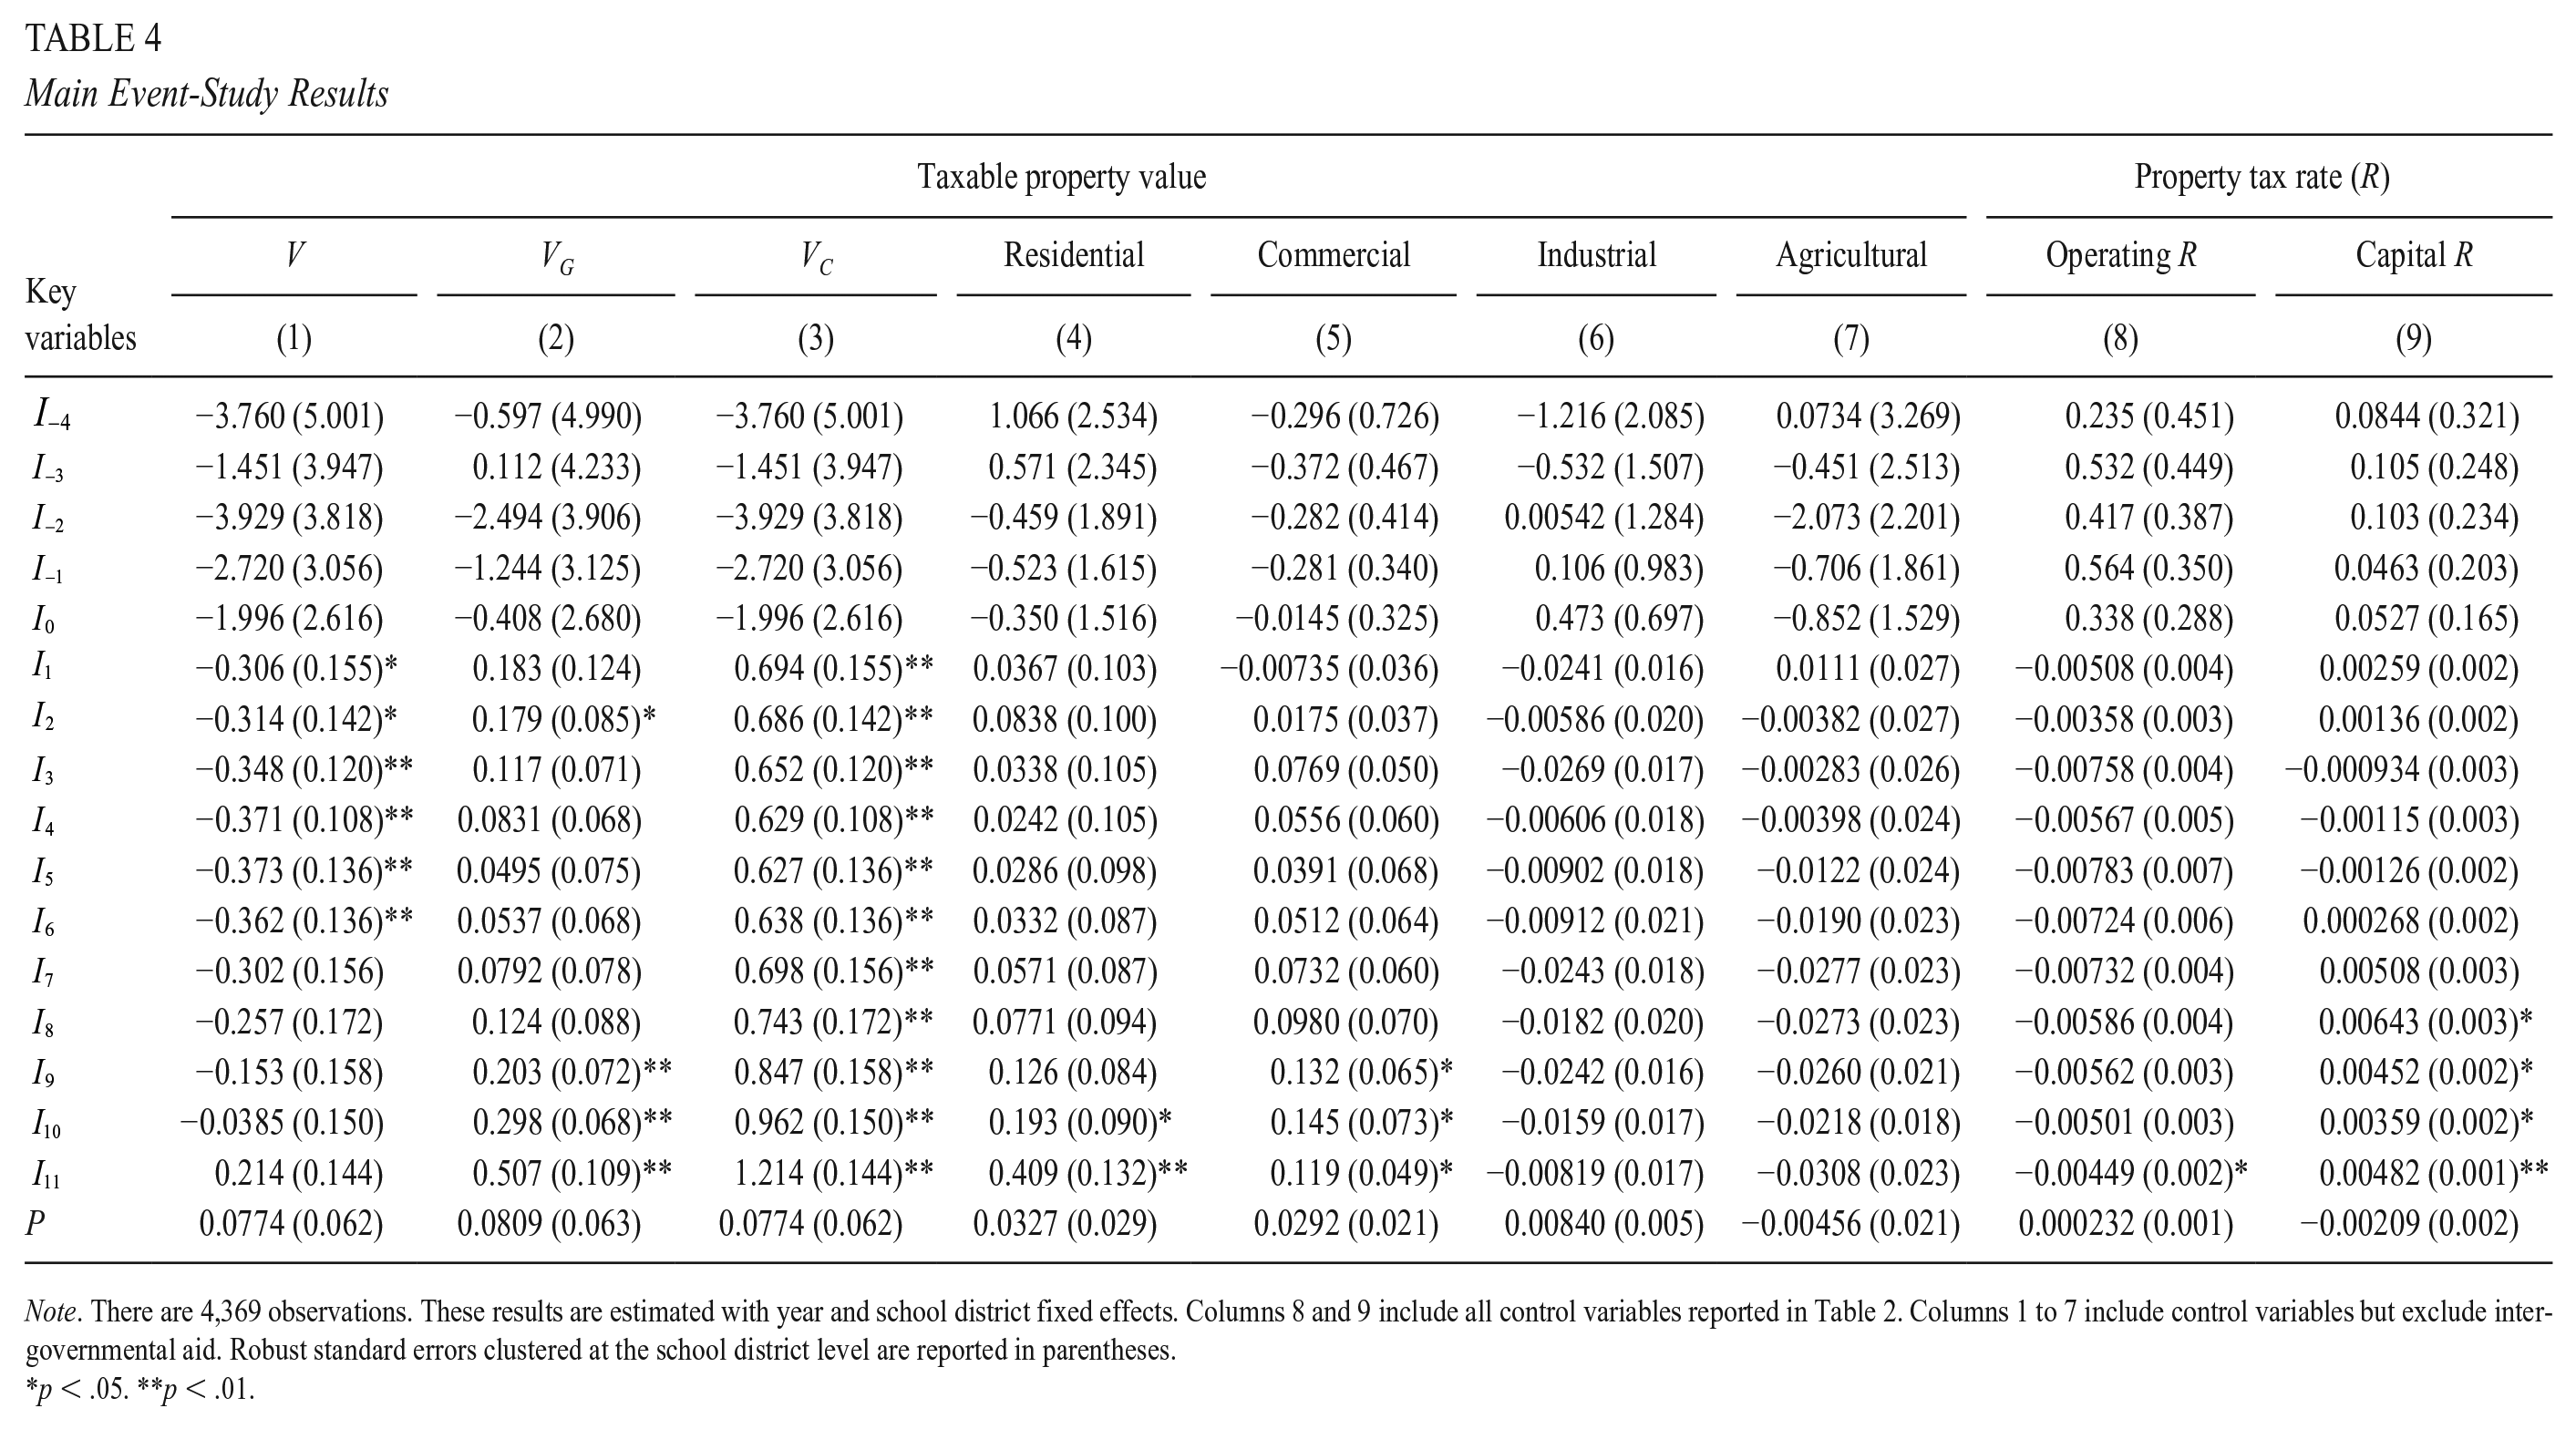
Note. There are 4,369 observations. These results are estimated with year and school district fixed effects. Columns 8 and 9 include all control variables reported in Table 2. Columns 1 to 7 include control variables but exclude intergovernmental aid. Robust standard errors clustered at the school district level are reported in parentheses.
p < .05. **p < .01.
Column 2 shows the effects of TIF on school districts’ tax base for operating funds (VG), including returned excess increments, IE. Taking IE into account, TIF induces statistically significant increases in VG in Years 2, 9, and onward. A dollar increase in I is associated with an increase in VG of $0.20 in Years 2 and 9, $0.30 in Year 10, and $0.51 in Year 11 and onward. Using data on the annual mean I and VG, the effects of I translate into an average increase of 1.1%, 2.6%, 4.1%, and 7.8% in the mean VG in these years, respectively. IE also contributes $0.3 (0.51 − 0.21) for every dollar of I in Year 11 and later, representing 4.6% of the mean VG.
Rural school districts’ funds for capital projects benefit from full access to I. Column 3 of Table 4 shows that the coefficients of Irs (r > 0) are all statistically significant. TIF induces a larger tax base for capital purposes, VC, from $0.63 to $1.21 for every dollar increase in I; as a result, VC also increases by 3.8% in Year 1 (the lowest) to 16.7% in Year 11 and onward (the highest).
Regarding the second research question, increases in VG come from residential and commercial properties (Columns 4 and 5). For example, approximately 80% of a TIF-induced $0.51-million increase in VG in Year 11 and onward comes from a TIF-associated increase in residential value. Columns 6 and 7 show that TIF does not have any effect on industrial or agricultural values, suggesting that few TIF districts include industrial or agricultural property.
Columns 8 and 9 provide answers to the third research question. Given the increases in VG (Column 2), rural school districts seem to make slight TIF-induced reductions in their property tax rate (R) for operating purposes in all years, holding constant other control variables including intergovernmental aid. However, only the coefficient for Year 11 and later is statistically significant. That is, the mean TIF rural school district’s operating R decreases by 0.0045 per $1,000 of taxable value for a $1-million increase in I, which represents a reduction of 0.17 ($37.3 [mean I] × 0.0045) or 1.3% of its operating R. This 1.3% reduction in operating R is smaller than the 7.8% increase in VG. This finding for Year 11 and onward, together with insignificant results in pre-11 years, implies that rural school districts’ operating property tax levy is likely to benefit from TIF during the sample period, which is consistent with Nguyen-Hoang (2021). If rural school districts’ expenditures are assumed to fully reflect changes in revenue, 17 this result seems to contradict Nguyen-Hoang’s (2014) finding of a negative relationship between TIF use and schools’ operating spending.
This decrease in operating R is offset by a similarly sized increase in capital R in Year 11 and onward (Column 9). In addition, an increase in I is also associated with increases in capital R in Years 8 to 10. The estimated increases in capital R in several years and in VC in all years (Column 3) are in line with Nguyen-Hoang’s (2021) finding that most TIF fiscal benefits for school districts come from capital property tax levy.
Results of Event-Study Robustness Tests
Table 5 documents the results of separating earlier and later groups of rural school districts. Column 1 shows that the negative effects on V in Years 1 to 6 for both groups correspond in size to those in Table 4, but statistical significance is limited to the earlier group in Years 2 to 6. Imprecise estimates in the later group could be due to fewer observations of Irs in Years 1 to 6 (44–79 in the later group vs. 141–161 in the earlier group). Similar to Table 4 results, TIF-induced increases in VG occur mostly in later years of TIF use, starting in Year 9 for the earlier group and Year 10 for the later group. Although the coefficient of Ir is smaller for the earlier group, the total effect on the earlier group’s VG is larger due to the group’s higher mean I. For example, TIF induces an increase of 8.4% and 6.8% in the earlier and later groups’ mean VG, respectively, in Year 11 and onward. As in Table 4, increases in both groups’ VG in Year 10 and onward are driven by increases in residential value and supplemented by commercial value increases (Columns 4 and 5).
Robustness Tests: Event-Study Results (Separate Groups)

Note. There are 4,369 observations for Columns 1 to 5 and 1,791 for Columns 6 to 7. These results are estimated with year and school district fixed effects as well as control variables reported in Table 2 (with state and federal aid variables in estimations for Rs). To save space, this table does not report robust standard errors clustered at the school district level. The estimations with separate groups still show no TIF effects on either industrial or agricultural values, so their results are not reported.
p < .05. **p < .01.
Column 6 of Table 5 indicates that only the later group reduces operating property tax rates. The reduction of operating R in Year 11 and onward is 11.4 times larger for the later group than for both groups combined (as in Column 8 of Table 4).
18
By contrast, while the later group reduces capital R by 0.014 in Year 7, increases in capital R happen for the earlier group starting in Year 8 (as in Column 9 of Table 4). This finding could reflect funding needs for school facilities that will serve more students, as a result of TIF developments that are not completely captured by the enrollment variable (which reports the effect of enrollment changes induced mostly by factors other than TIF). Discontinued TIF districts have significant positive effects (similar in size to those reported in Column 8 of Table 3) on the later group. A possible explanation is that later TIF authorities may permanently dissolve recently established TIF districts sooner.
19
Table 6 reports the robustness tests obtained by using only the later group (plus the control group). The results for the later group in Table 6 are similar to those in Table 5, suggesting that TIF effects are robust, regardless of whether the start of the TIF “treatment” is restricted to the sample period (as in conventional event studies) or not. Finally, the pre-TIF coefficients,
Robustness Tests: Event-Study Results (Later Group Only)

Note. There are 1,791 observations. These results are estimated with year and school district fixed effects as well as control variables reported in Table 2 (with state and federal aid variables in estimations for Rs). The estimations with separate groups still show no TIF effects on either industrial or agricultural values, so their results are not reported.
p < .05. **p < .01.
Conclusions
Compared with urban areas, rural communities across the United States tend to have access to relatively limited economic (re)development financing tools. One of these tools is tax increment financing (TIF). Originally designed to address urban blight, TIF is initiated mostly by municipalities (cities, villages, and towns) or counties. Of the 49 U.S. states with TIF-enabling legislation, 17 states have no minimum population requirement for municipal incorporation; the remaining states have minimum population thresholds under 2,500 (the maximum population for a rural area; Bureau of the Census, 1994). While municipalities establish TIF areas within their boundaries, counties do so in unincorporated, usually rural, areas. As evidenced by the significant shares of rural places among Midwestern municipalities that have adopted TIF, TIF now plays a present part in rural communities—and thus school districts.
In most states, schools cannot opt out of TIF, though it may exert meaningful fiscal impacts on their finance. This study makes three unique contributions to the literature: It is the first study to focus solely on TIF in rural school districts, to examine TIF effects on school districts’ property tax base and rates, and to conduct event-study estimations of TIF effects. Using a data panel of rural school districts in Iowa, the study finds that TIF has mostly positive effects on school districts’ property tax base and mixed effects on property tax rates, and that TIF-induced increases in tax base come mostly from residential property and slightly from commercial property. The overall positive effects of TIF on operating tax base take nearly a decade to manifest and are smaller than those on capital tax base. Operating tax rates decrease while capital rates increase; both rate changes occur in later years of TIF use and are proportionally smaller than TIF-induced increases in tax bases. These findings are consistent with Nguyen-Hoang’s (2021) finding that while Iowa school districts’ total operating property tax levy increases slightly at best (and decreases at worst), their capital property tax levy increases significantly.
This study provides statistical evidence for a causal interpretation of TIF effects on property tax base and rates. All pretrend variables are statistically insignificant across estimations, regardless of whether they are obtained by DID or event-study designs, with full or later-group-only data samples, or with separated coefficients on two groups of school districts or not. Given the nonexperimental nature of TIF, one cannot, however, completely rule out the possibility of bias. This study’s findings should thus be interpreted with care.
Given that caveat, this study nevertheless provides a few key takeaways and implications for rural school districts in Iowa and other states. First, TIF can have a harmful fiscal effect on rural school districts’ property tax base; as the study finds, TIF induces significant decreases in rural school districts’ property tax base in at least the first 6 years after initiation. The decrease is most likely to come from depressed annual base value and counterfactual value losses resulting from unmet but-for conditions. This finding has two implications. First, the depression of ABV could be a problem unique to Iowa; the state might consider amending TIF law to prioritize preservation of ABV (i.e., ABV = OBV) over incremental value. Second, this finding implies that the failure of the but-for condition may occur in, and thus have a negative fiscal effect on, rural school districts, as found for their urban peers in Lester (2014). Currently, 14 states (including Iowa) lack a but-for test requirement (Kriz & Johnson, 2019), a policy which guards against development-induced fiscal losses; our findings could be interpreted as support for this development prerequisite. However, the counterfactual but-for test is arguably ineffective in states where it is legally required because the test can be interpreted so broadly that almost any TIF project will pass (Merriman, 2018). Also, rural communities with limited resources for proper due diligence may accept a TIF project’s proposed financing gap as proof that it passes the but-for test. The test’s ineffectiveness has led to calls for its abolition (Farwell, 2005; Reinert, 2001).
A state policy alternative is to legally mandate the return of excess increments. This study’s second takeaway—that the key driver of TIF fiscal benefits for Iowa rural school districts’ operating funds is the voluntary partial or entire return of excess increments, IE—supports this policy option. We find that IE neutralizes negative effects in early years and subsequently brings about fiscal benefits. For example, IE accounts for 4.6% of total operating tax base in Years 11 and later. Release of excess increments to affected jurisdictions is currently mandated in 24 states but merely optional in 25 others (Kriz & Johnson, 2019). 20 In these latter states, instead of releasing excess increments, TIF authorities may use them to keep the increments as an unreserved balance (e.g., Indiana), transfer them to another same-municipality TIF district (e.g., Wisconsin), or invest in a reserve fund (e.g., Iowa). Fiscal benefits to rural school districts would have been larger had all IE been returned—implying that rural school districts will benefit if Iowa and its fellow 24 states channel their efforts into legislating the return of concrete, observable excess increments.
The third takeaway is that access to the full incremental value makes TIF-induced effects on Iowa rural school districts’ tax base for capital purposes larger than those for general purposes. States that have not already done so might consider providing a similar protection from TIF for rural schools’ capital tax base. This protection is important for two major reasons. First, the National Center for Education Statistics reports in its most recent national survey that one fifth of rural schools operated with permanent buildings in fair or poor condition in 2013 (Alexander & Lewis, 2014). Second, while local communities pay 45% of operating costs, they shoulder 82% of school facility costs (Filardo, 2016). These two reasons suggest that locally sourced funds for rural school facilities projects would benefit from a safeguard against TIF, as in Iowa.
Finally, this study focuses on Iowa. As TIF laws differ by state, future research on TIF’s effects on rural school finance in other states is warranted.
Supplemental Material
sj-docx-1-ero-10.1177_2332858421991149 – Supplemental material for The Fiscal Effects of Tax Increment Financing on Rural School Districts: The Case of Iowa
Supplemental material, sj-docx-1-ero-10.1177_2332858421991149 for The Fiscal Effects of Tax Increment Financing on Rural School Districts: The Case of Iowa by Phuong Nguyen-Hoang in AERA Open
Footnotes
Acknowledgements
The author would like to express his sincere thanks to three anonymous referees and special issue editors for their constructive comments and suggestions. His special thanks go to Julien Lafortune and Coady Wing for their helpful suggestions on empirical methods.
Notes
Author
PHUONG NGUYEN-HOANG is an associate professor at the School of Planning and Public Affairs and senior research fellow at the Public Policy Center, both at the University of Iowa. His research revolves around public and education finance and policy.
References
Supplementary Material
Please find the following supplemental material available below.
For Open Access articles published under a Creative Commons License, all supplemental material carries the same license as the article it is associated with.
For non-Open Access articles published, all supplemental material carries a non-exclusive license, and permission requests for re-use of supplemental material or any part of supplemental material shall be sent directly to the copyright owner as specified in the copyright notice associated with the article.